
Quantification of Intracellular Thiols by HPLC-Fluorescence Detection


Abstract
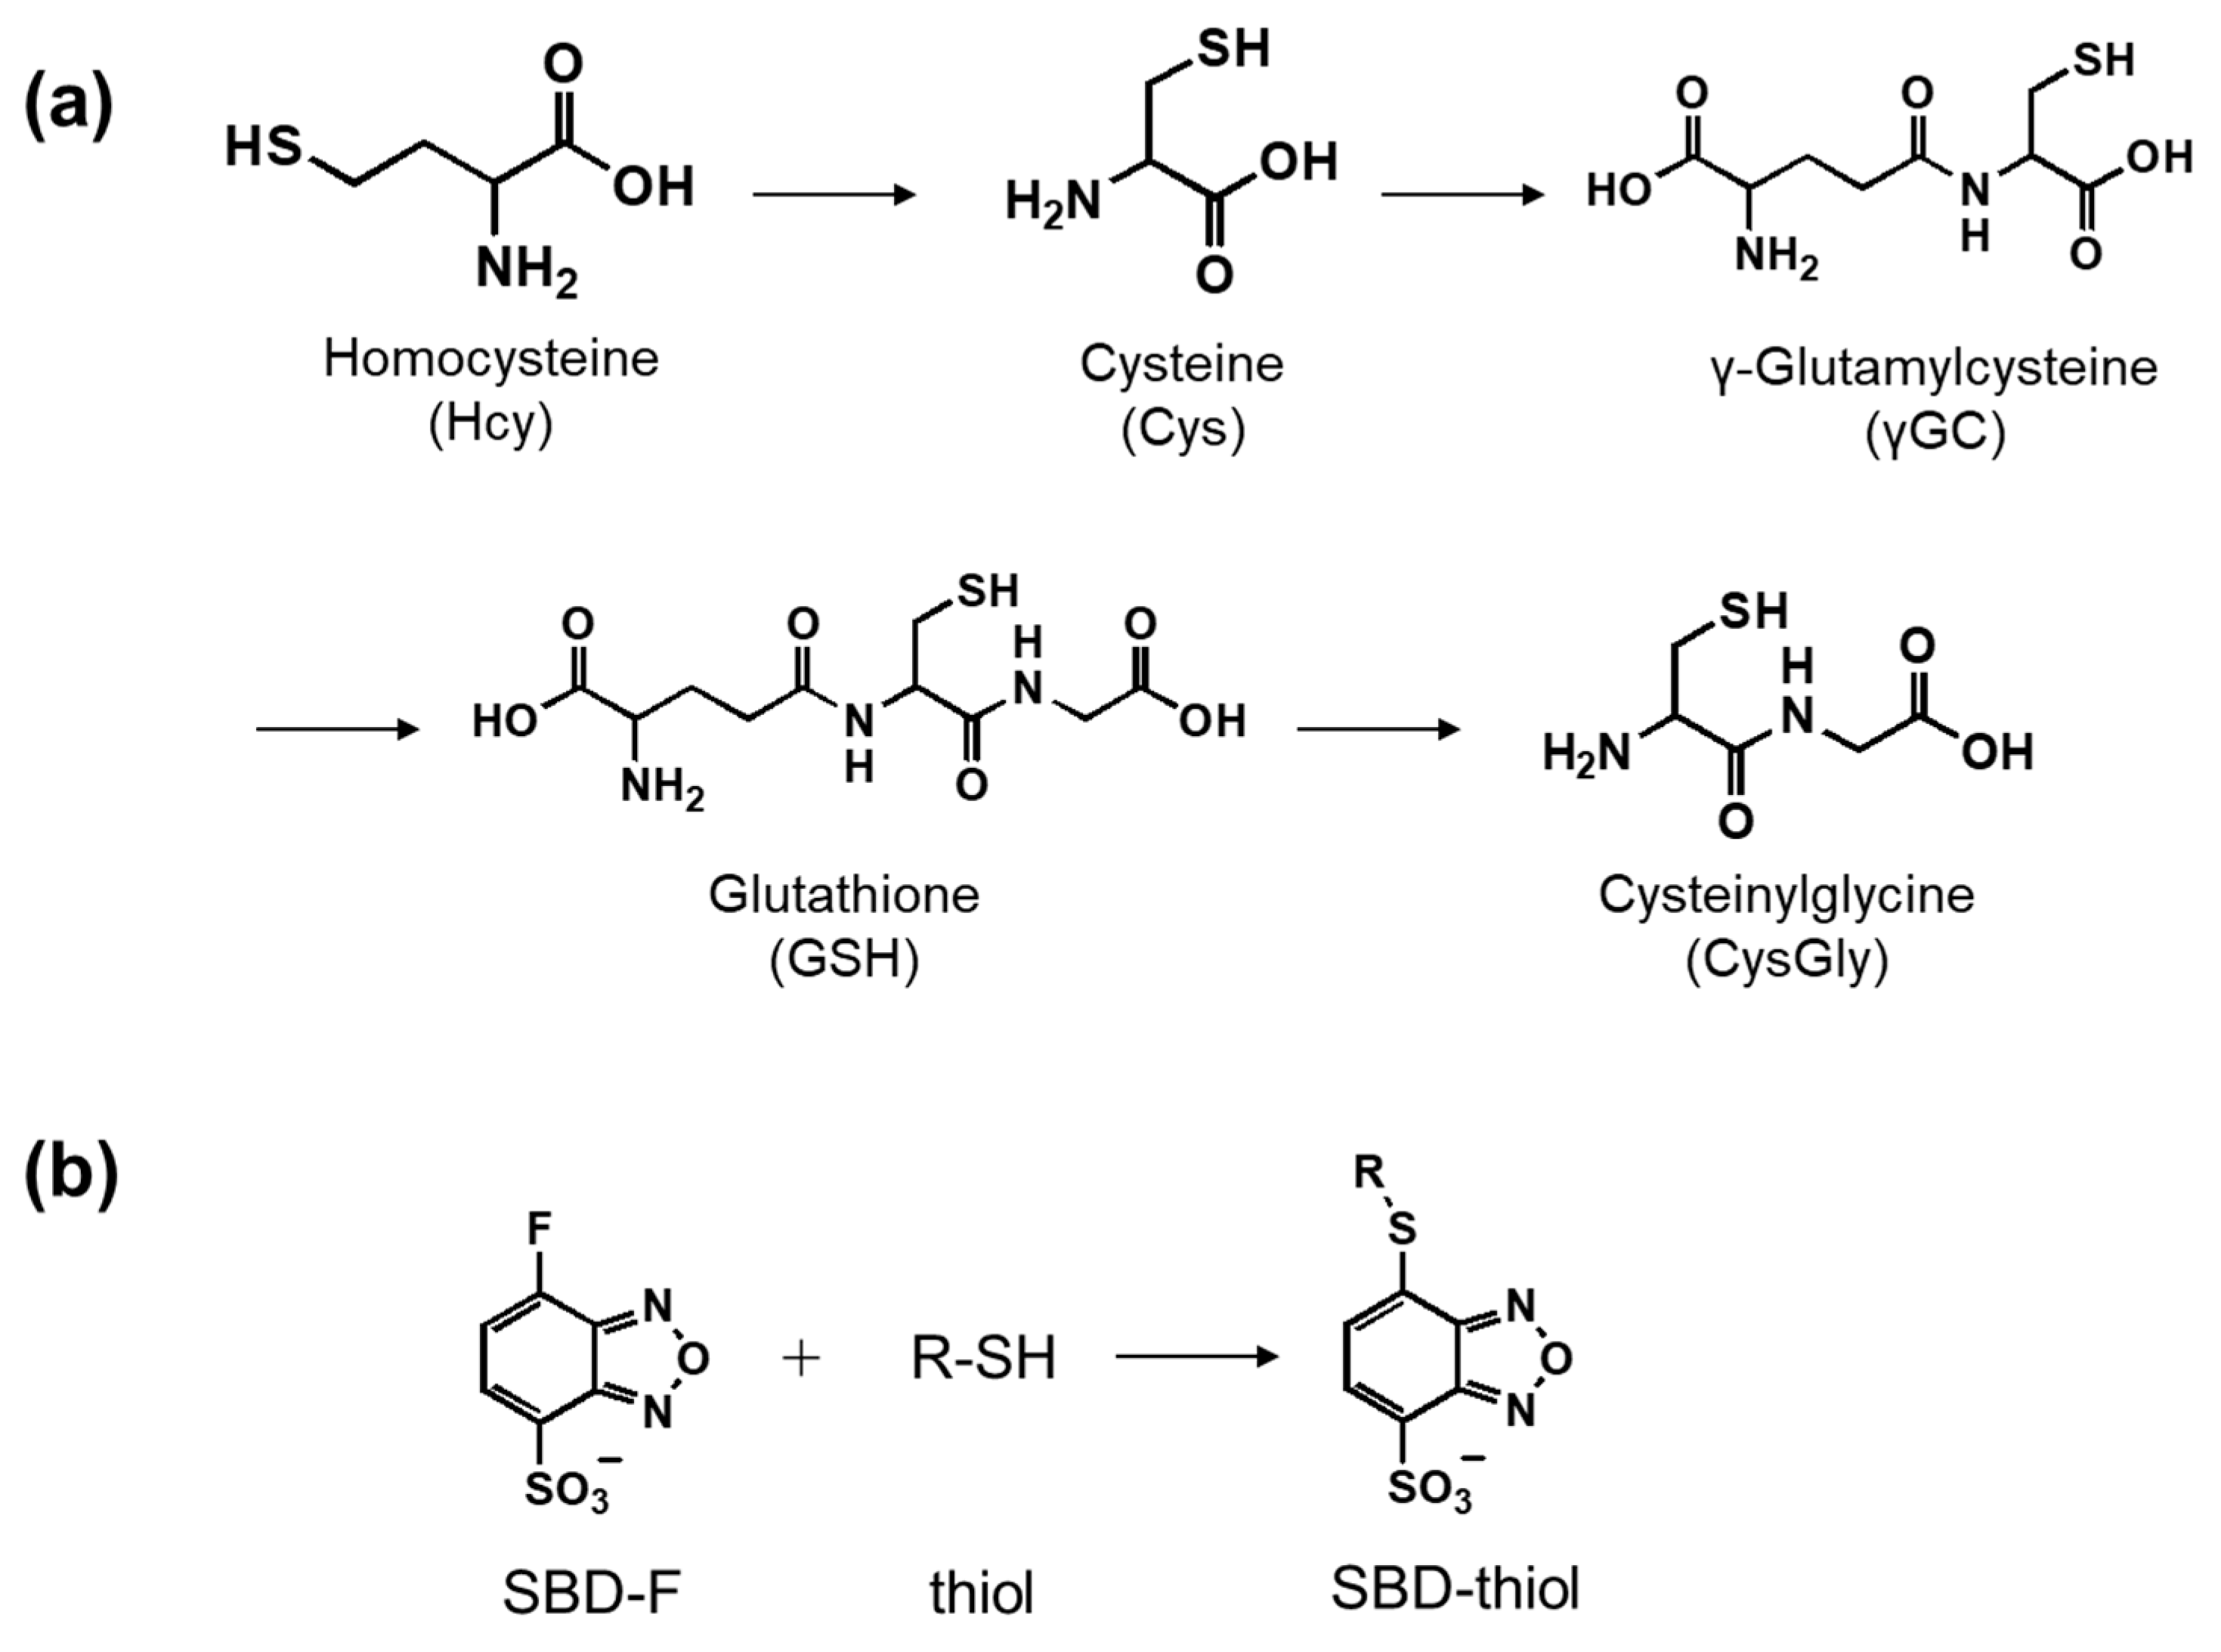
1. Introduction
2. Results and Discussion
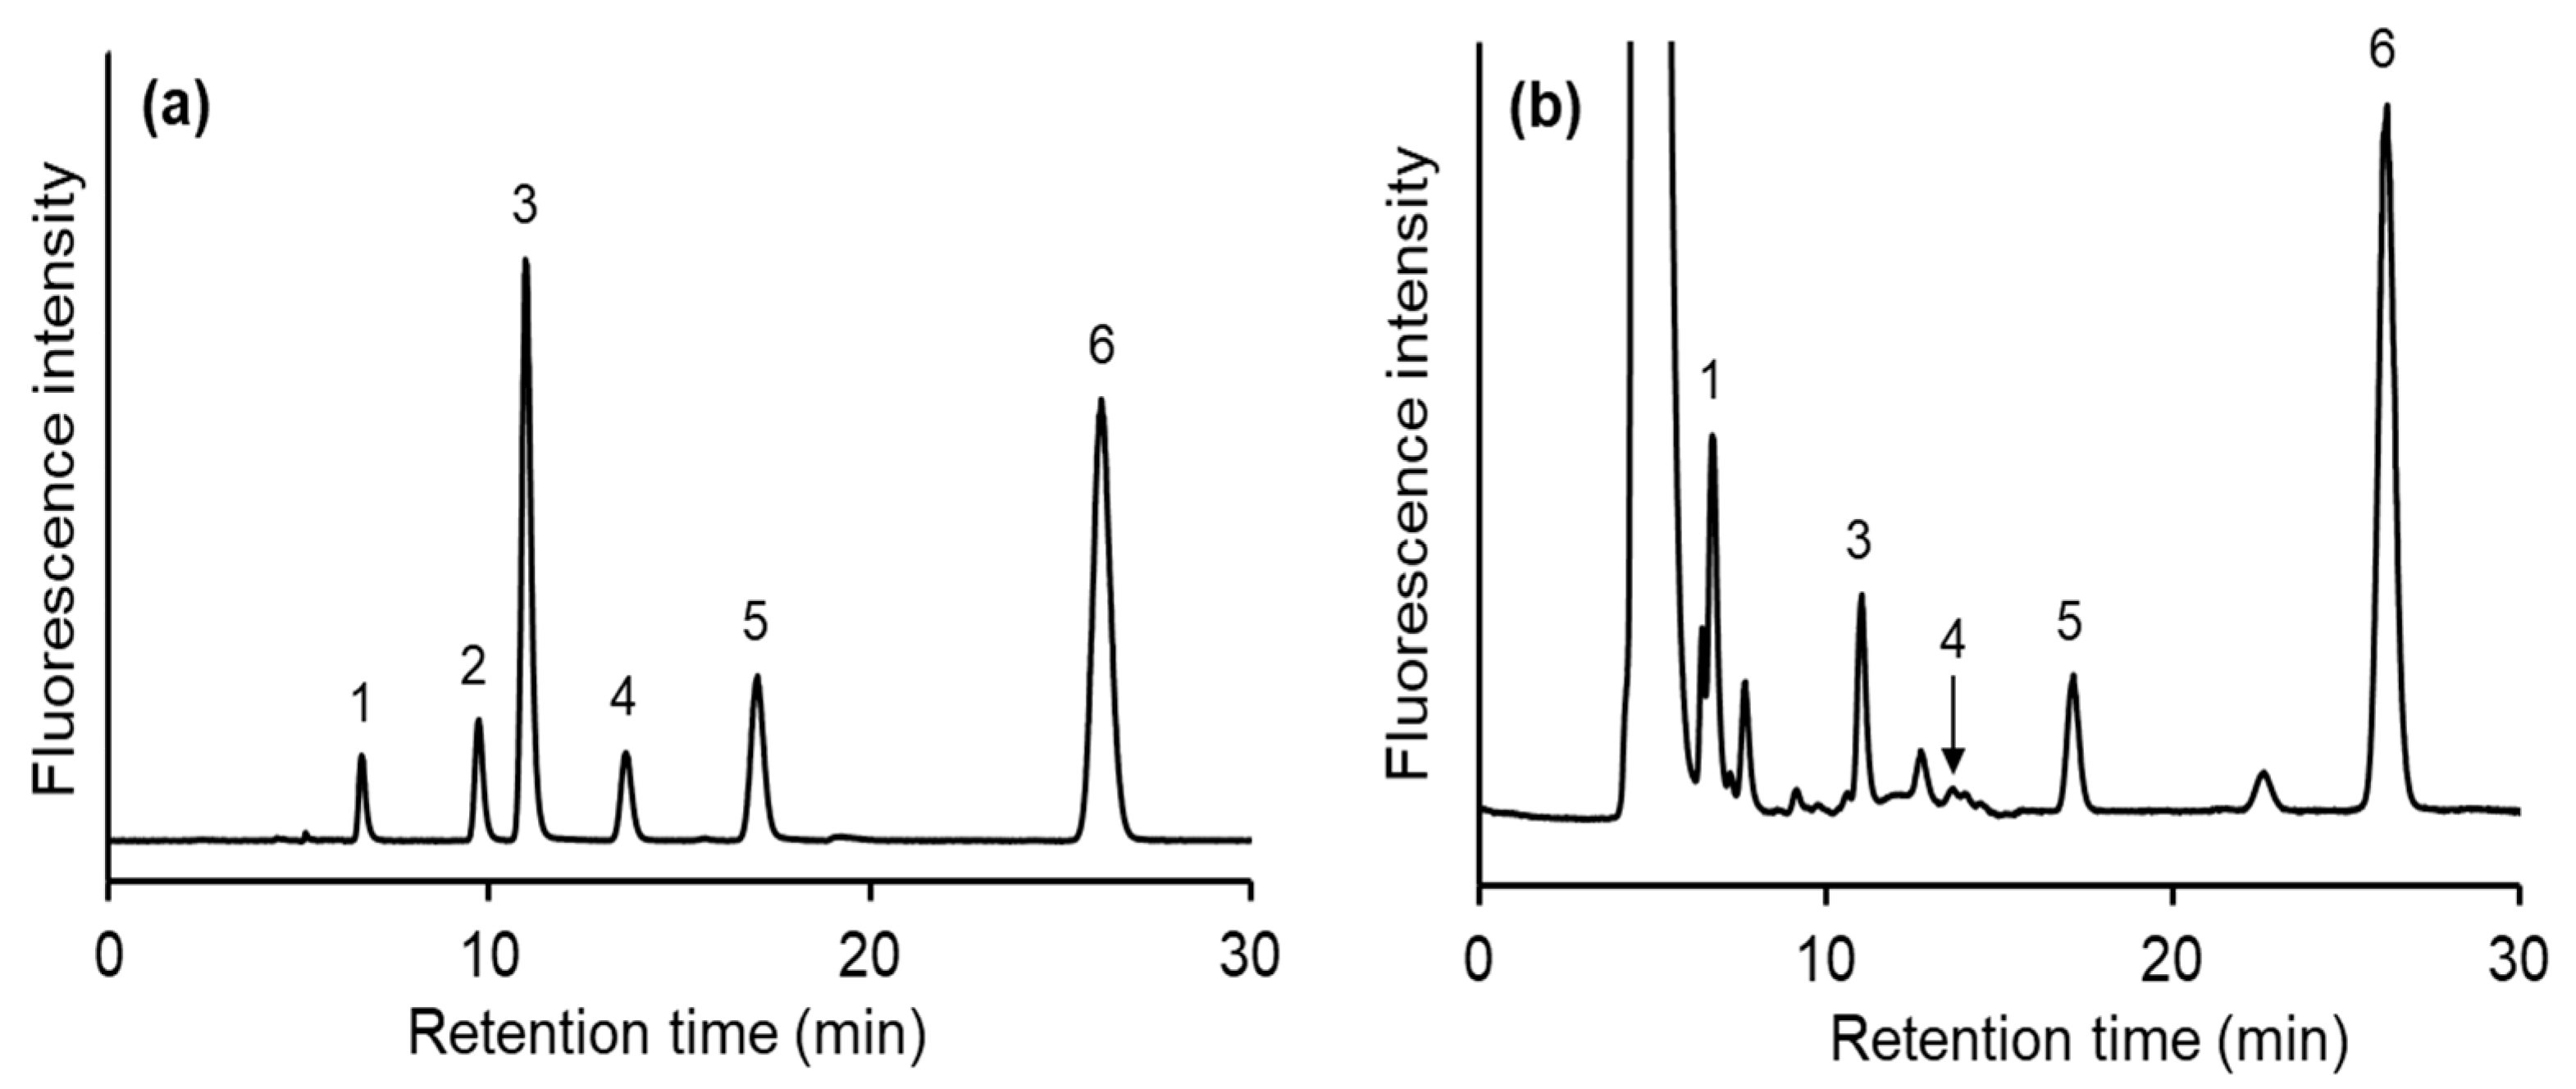
2.1. Investigation of SBD-Thiols Separation
2.2. Application to K562 Cell Samples
2.3. Method Validation
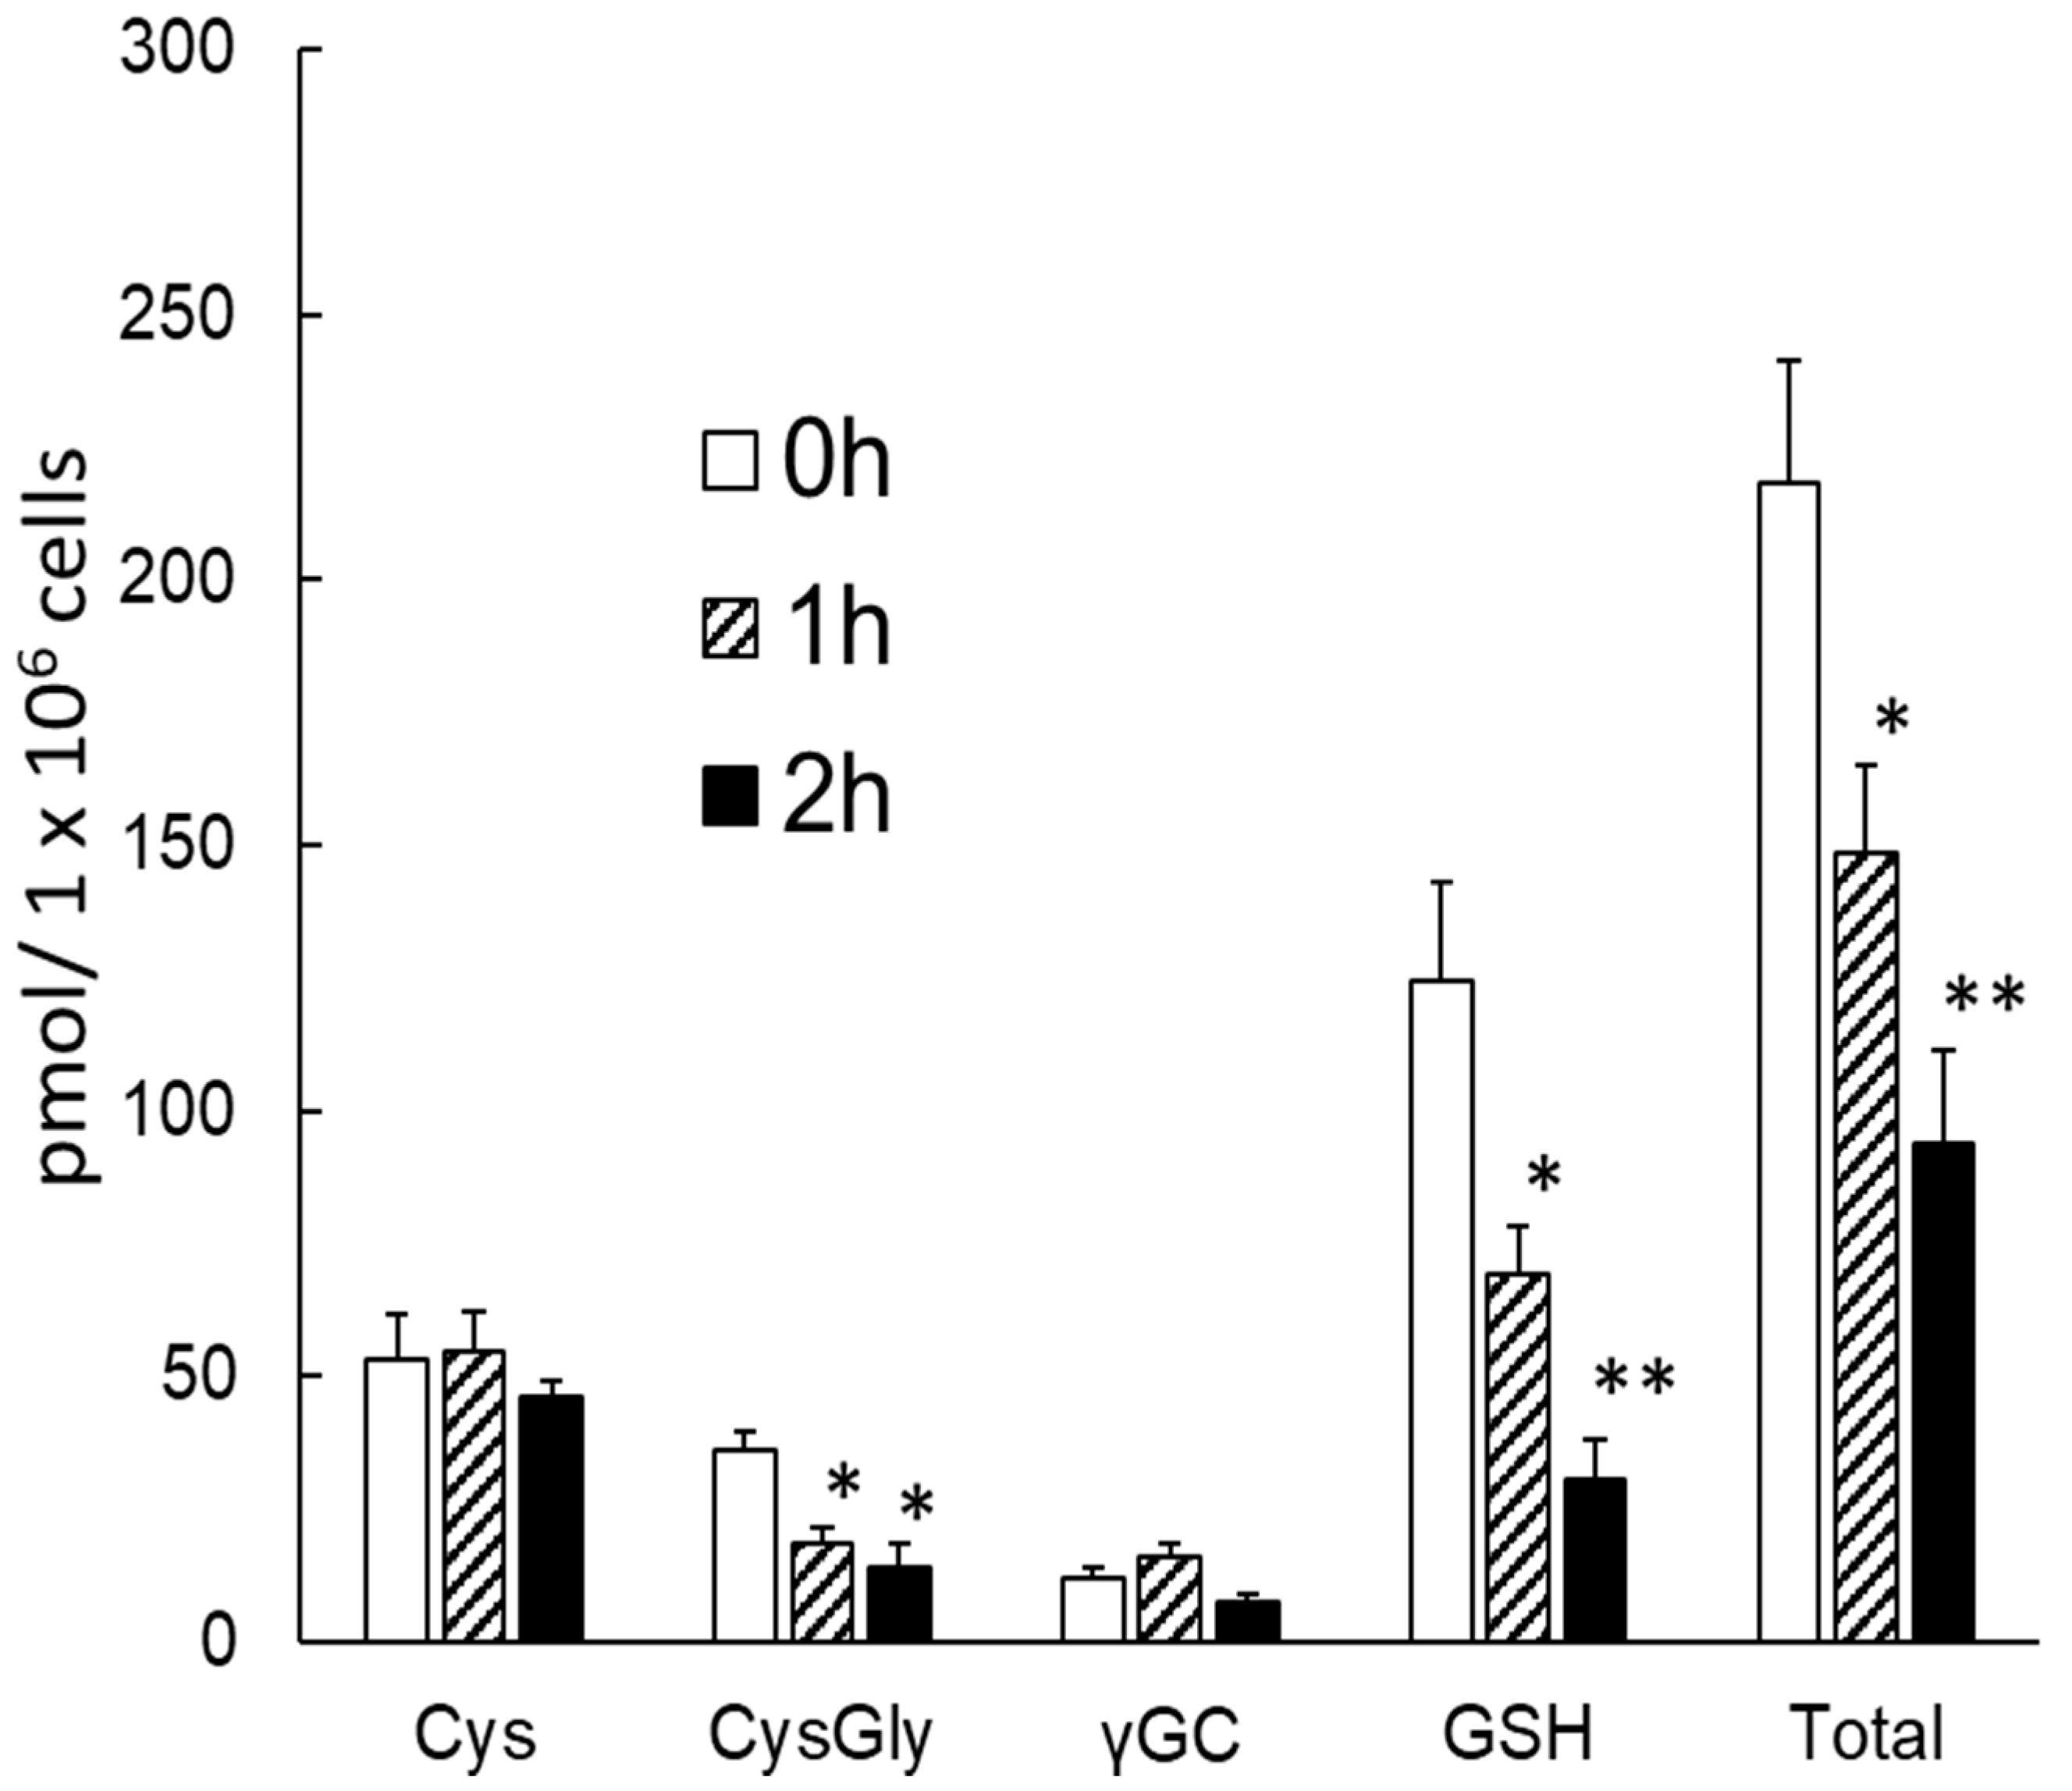
2.4. Investigation of Intracellular Thiols by N-Ethyl Maleimide (NEM) Addition
3. Materials and Methods
3.1. Chemicals
3.2. Cell Culture and Treatments
3.3. Derivatization Conditions
3.4. HPLC Conditions
3.5. Validation
4. Conclusions
Author Contributions
Funding
Conflicts of Interest
References
- Townsend, D.M.; Tew, K.D.; Tapiero, H. The importance of glutathione in human disease. Biomed. Pharmacother. 2003, 57, 145–155. [Google Scholar] [CrossRef]
- Gamcsik, M.P.; Kasibhatla, M.S.; Teeter, S.D.; Colvin, O.M. Glutathione levels in human tumors. Biomarkers 2012, 17, 671–691. [Google Scholar] [CrossRef] [PubMed]
- Oliveira, P.V.S.; Laurindo, F.R.M. Implications of plasma thiol redox in disease. Clin. Sci. 2018, 132, 1257–1280. [Google Scholar] [CrossRef] [PubMed]
- Kedzierska, M.; Glowacki, R.; Czernek, U.; Pazera, K.S.; Potemski, P.; Piekarski, J.; Jeziorski, A.; Olas, B. Changes in plasma thiol levels induced by different phases of treatment in breast cancer; the role of commercial extract from black chokeberry. Mol. Cell Biochem. 2013, 372, 47–55. [Google Scholar] [CrossRef] [PubMed]
- Stabler, S.; Koyama, T.; Zhao, Z.; Martinez-Ferrer, M.; Allen, R.H.; Luka, Z.; Loukachevitch, L.V.; Clark, P.E.; Wagner, C.; Bhowmick, N.A. Serum methionine metabolites are risk factors for metastatic prostate cancer progression. PLoS ONE 2011, 6, e22486. [Google Scholar] [CrossRef] [PubMed]
- Yin, C.X.; Xiong, K.M.; Huo, F.J.; Salamanca, J.C.; Strongin, R.M. Fluorescent Probes with Multiple Binding Sites for the Discrimination of Cys, Hcy, and GSH. Angew. Chem. Int. Ed. 2017, 56, 13188–13198. [Google Scholar] [CrossRef] [PubMed]
- Jung, H.S.; Chen, X.; Kim, J.S.; Yoon, J. Recent progress in luminescent and colorimetric chemosensors for detection of thiols. Chem. Soc. Rev. 2013, 42, 6019–6031. [Google Scholar] [CrossRef] [PubMed]
- Niu, L.Y.; Chen, Y.Z.; Zheng, H.R.; Wu, L.Z.; Tung, C.H.; Yang, Q.Z. Design strategies of fluorescent probes for selective detection among biothiols. Chem. Soc. Rev. 2015, 44, 6143–6160. [Google Scholar] [CrossRef]
- Cossetti, C.; Giovamberardino, G.D.; Rota, R.; Pastore, A. Pitfalls in the quantitative imaging of glutathione in living cells. Nat. Commun. 2018, 9, 1588. [Google Scholar] [CrossRef]
- Isokawa, M.; Kanamori, T.; Funatsu, T.; Tsunoda, M. Analytical methods involving separation techniques for determination of low-molecular-weight biothiols in human plasma and blood. J. Chromatogr. B 2014, 964, 103–115. [Google Scholar] [CrossRef]
- Forgacsova, A.; Galba, J.; Mojzisova, J.; Mikus, P.; Piestansky, J.; Kovac, A. Ultra-high performance hydrophilic interaction liquid chromatography—Triple quadrupole tandem mass spectrometry method for determination of cysteine, homocysteine, cysteinyl-glycine and glutathione in rat plasma. J. Pharm. Biomed. Anal. 2019, 164, 442–451. [Google Scholar] [CrossRef]
- Russo, M.S.T.; Napylov, A.; Paquet, A.; Vuckovic, D. Comparison of N-ethyl maleimide and N-(1-phenylethyl) maleimide for derivatization of biological thiols using liquid chromatography-mass spectrometry. Anal. Bioanal. Chem. 2020, 412, 1639–1652. [Google Scholar] [CrossRef]
- Borowczyk, K.; Olejarz, P.; Chwatko, G.; Szylberg, M.; Głowacki, R. A Simplified Method for Simultaneous Determination of α-Lipoic Acid and Low-Molecular-Mass Thiols in Human Plasma. Int. J. Mol. Sci. 2020, 21, 1049. [Google Scholar] [CrossRef]
- Isokawa, M.; Funatsu, T.; Tsunoda, M. Fast and simultaneous analysis of biothiols by high-performance liquid chromatography with fluorescence detection under hydrophilic interaction chromatography conditions. Analyst 2013, 138, 3802–3808. [Google Scholar] [CrossRef]
- Isokawa, M.; Shimosawa, T.; Funatsu, T.; Tsunoda, M. Determination and characterization of total thiols in mouse serum samples using hydrophilic interaction liquid chromatography with fluorescence detection and mass spectrometry. J. Chromatogr. B 2016, 1019, 59–65. [Google Scholar] [CrossRef]
- Isokawa, M.; Kobayashi, K.; Miyoshi, Y.; Mita, M.; Funatsu, T.; Hamase, K.; Tsunoda, M. Quantification of Biological Thiols in the Plasma of a Homocystinuria Model with Cystathionine β-Synthase Deficiency Utilizing Hydrophilic Interaction Liquid Chromatography and Fluorescence Detection. Chromatography 2016, 37, 147–151. [Google Scholar] [CrossRef]
- Chang, C.; Hamase, K.; Tsunoda, M. Analysis of Total Thiols in the Urine of a Cystathionine β-Synthase-Deficient Mouse Model of Homocystinuria Using Hydrophilic Interaction Chromatography. Molecules 2020, 25, 1735. [Google Scholar] [CrossRef]
- Kanamori, T.; Funatsu, T.; Tsunoda, M. Evaluation of the Effects of Sample Solutions and Injector Wash Solutions on Separation Efficiency in Hydrophilic Interaction Liquid Chromatography. Chromatography 2015, 36, 123–126. [Google Scholar] [CrossRef]
- Isokawa, M.; Funatsu, T.; Tsunoda, M. Evaluation of the Effects of Sample Dilution and Volume in Hydrophilic Interaction Liquid Chromatography. Chromatographia 2014, 77, 1553–1556. [Google Scholar] [CrossRef]
- Kanamori, T.; Funatsu, T.; Tsunoda, M. Determination of catecholamines and related compounds in mouse urine using column-switching HPLC. Analyst 2016, 141, 2568–2573. [Google Scholar] [CrossRef]
- Guo, X.-F.; Chen, J.-B.; Wang, H.; Zhang, H.-S.; Huang, W.-H.; Guo, J. Real-time and in-situ cell imaging of thiol compounds in living cells using maleimide BODIPY labeling. Talanta 2012, 99, 1046–1050. [Google Scholar] [CrossRef] [PubMed]
- Zinellu, A.; Sotgia, S.; Posadino, A.M.; Pasciu, V.; Perino, M.G.; Tadolini, B.; Deiana, L.; Carru, C. Highly sensitive simultaneous detection of cultured cellular thiols by laser induced fluorescence-capillary electrophoresis. Electrophoresis 2005, 26, 1063–1070. [Google Scholar] [CrossRef] [PubMed]
- D’Agostino, L.A.; Lam, K.P.; Lee, R.; McKibbin, P.B. Comprehensive plasma thiol redox status determination for metabolomics. J. Proteome Res. 2011, 10, 592–603. [Google Scholar] [CrossRef] [PubMed]
- Jiang, Z.; Liang, Q.; Luo, G.; Hu, P.; Li, P.; Wang, Y. HPLC–electrospray tandem mass spectrometry for simultaneous quantitation of eight plasma aminothiols: Application to studies of diabetic nephropathy. Talanta 2009, 77, 1279–1284. [Google Scholar] [CrossRef]
- Lou, Z.; Li, P.; Sun, X.; Yang, S.; Wang, B.; Keli, H. A fluorescent probe for rapid detection of thiols and imaging of thiols reducing repair and H2O2 oxidative stress cycles in living cells. Chem. Commun. 2013, 49, 391–393. [Google Scholar] [CrossRef]
- Hemmi, M.; Ikeda, Y.; Shindo, Y.; Nakajima, T.; Nishiyama, S.; Oka, K.; Sato, M.; Hiruta, Y.; Citterio, D.; Suzuki, K. Highly Sensitive Bioluminescent Probe for Thiol Detection in Living Cells. Chem. Asian J. 2018, 13, 648–655. [Google Scholar] [CrossRef]


| Thiol | Linearity | Intra-Day | Inter-Day | ||
|---|---|---|---|---|---|
| (nM, R2 > 0.999) | RSD (%) | Accuracy (%) | RSD (%) | Accuracy (%) | |
| Cys | 50–5000 | 4.3 | 98 | 13.7 | 105 |
| CysGly | 5–500 | 4.0 | 91 | 5.8 | 95 |
| γGC | 1–100 | 8.4 | 107 | 9.2 | 124 |
| GSH | 100–10,000 | 2.2 | 95 | 1.8 | 94 |
Publisher’s Note: MDPI stays neutral with regard to jurisdictional claims in published maps and institutional affiliations. |
© 2021 by the authors. Licensee MDPI, Basel, Switzerland. This article is an open access article distributed under the terms and conditions of the Creative Commons Attribution (CC BY) license (https://creativecommons.org/licenses/by/4.0/).
Share and Cite
Yamamoto, H.; Fujiwara, T.; Funatsu, T.; Tsunoda, M. Quantification of Intracellular Thiols by HPLC-Fluorescence Detection. Molecules 2021, 26, 2365. https://doi.org/10.3390/molecules26082365
Yamamoto H, Fujiwara T, Funatsu T, Tsunoda M. Quantification of Intracellular Thiols by HPLC-Fluorescence Detection. Molecules. 2021; 26(8):2365. https://doi.org/10.3390/molecules26082365
Chicago/Turabian StyleYamamoto, Hiroki, Takuya Fujiwara, Takashi Funatsu, and Makoto Tsunoda. 2021. "Quantification of Intracellular Thiols by HPLC-Fluorescence Detection" Molecules 26, no. 8: 2365. https://doi.org/10.3390/molecules26082365
APA StyleYamamoto, H., Fujiwara, T., Funatsu, T., & Tsunoda, M. (2021). Quantification of Intracellular Thiols by HPLC-Fluorescence Detection. Molecules, 26(8), 2365. https://doi.org/10.3390/molecules26082365