
Electrochemical Characterization of Aromatic Molecules with 1,4-Diaza Groups for Flow Battery Applications


Abstract
1. Introduction
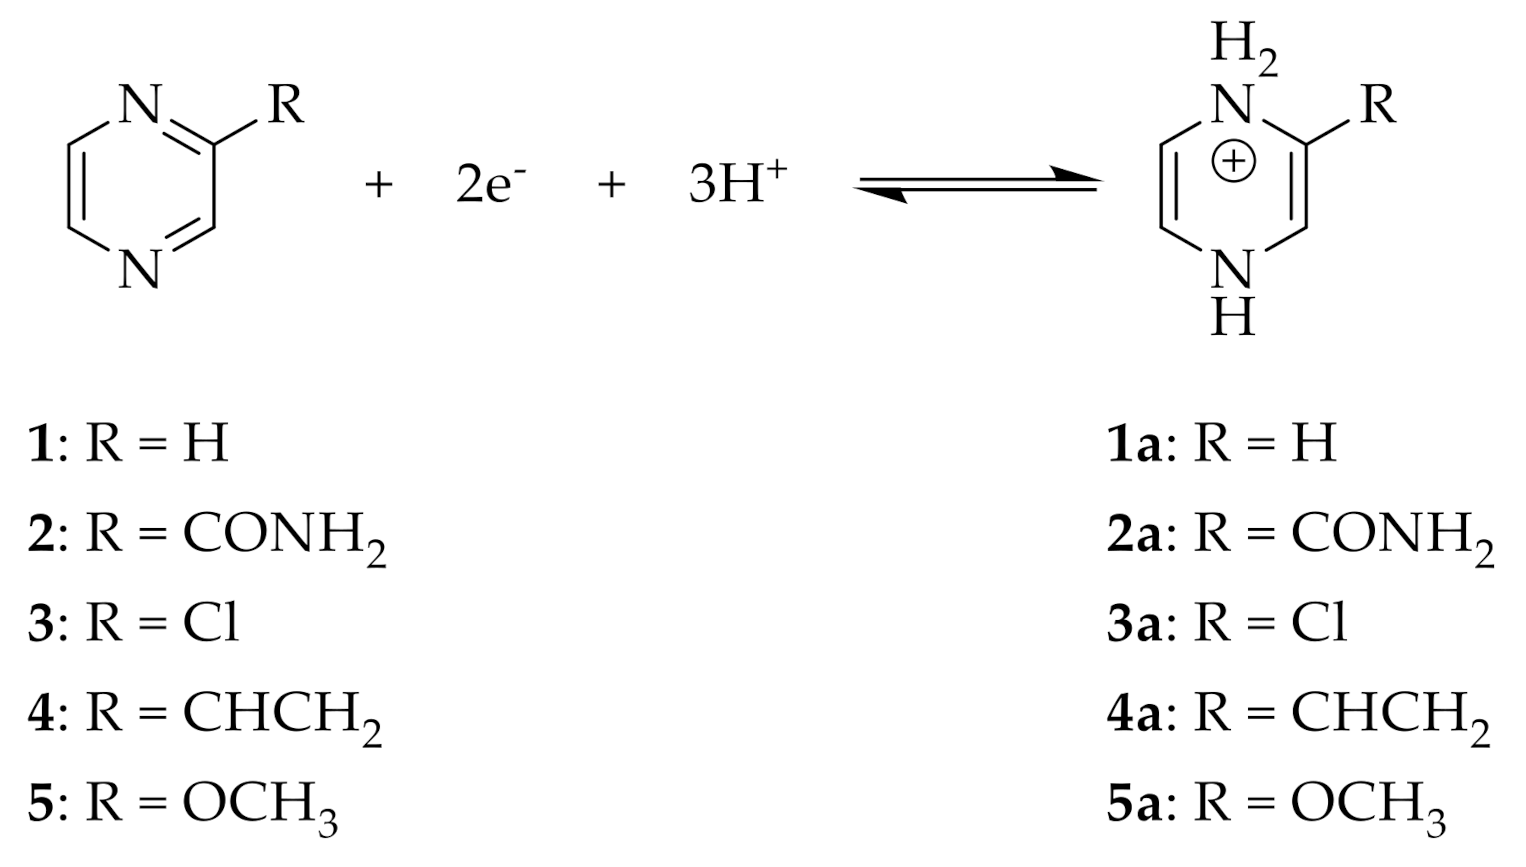
1.1. Pyrazine
1.2. Quinoxaline
2. Results
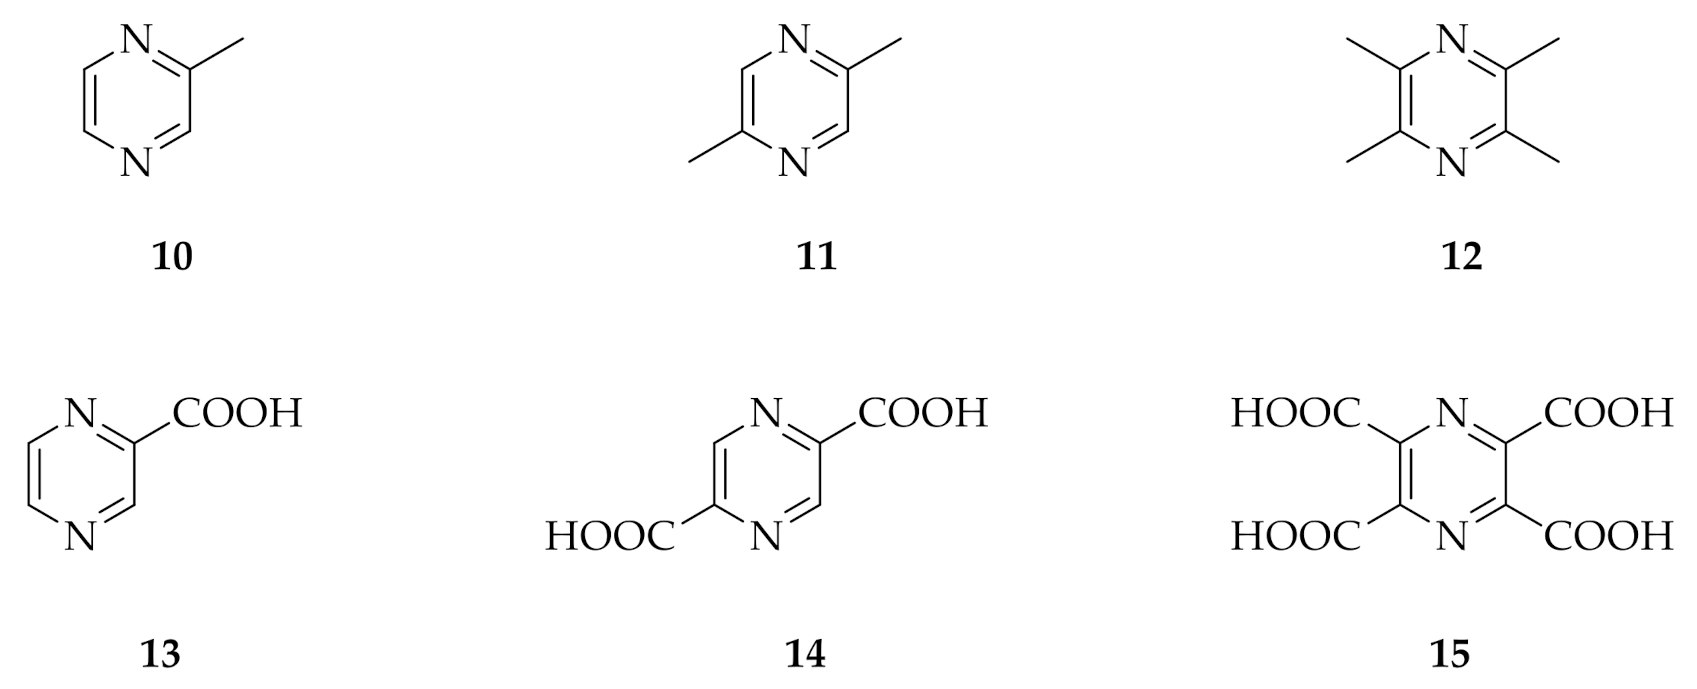
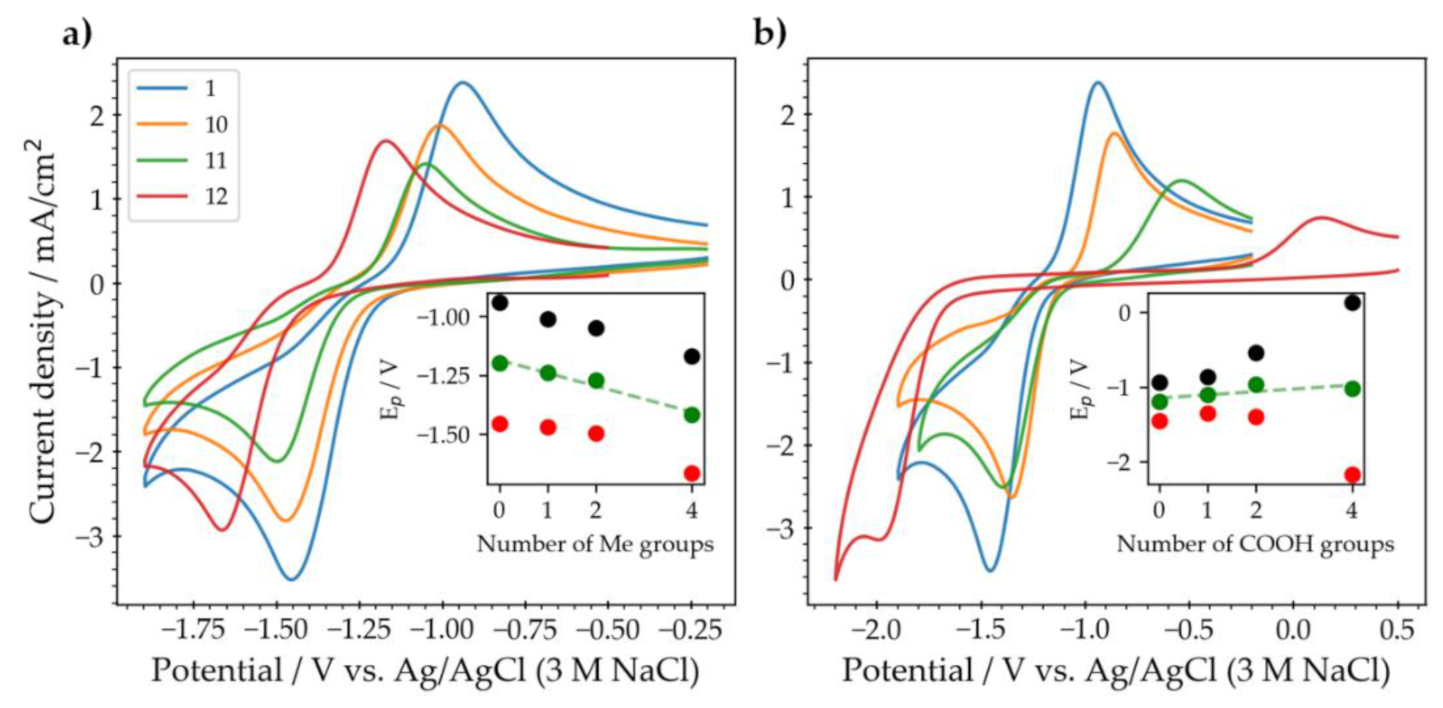
2.1. Substituted Pyrazines
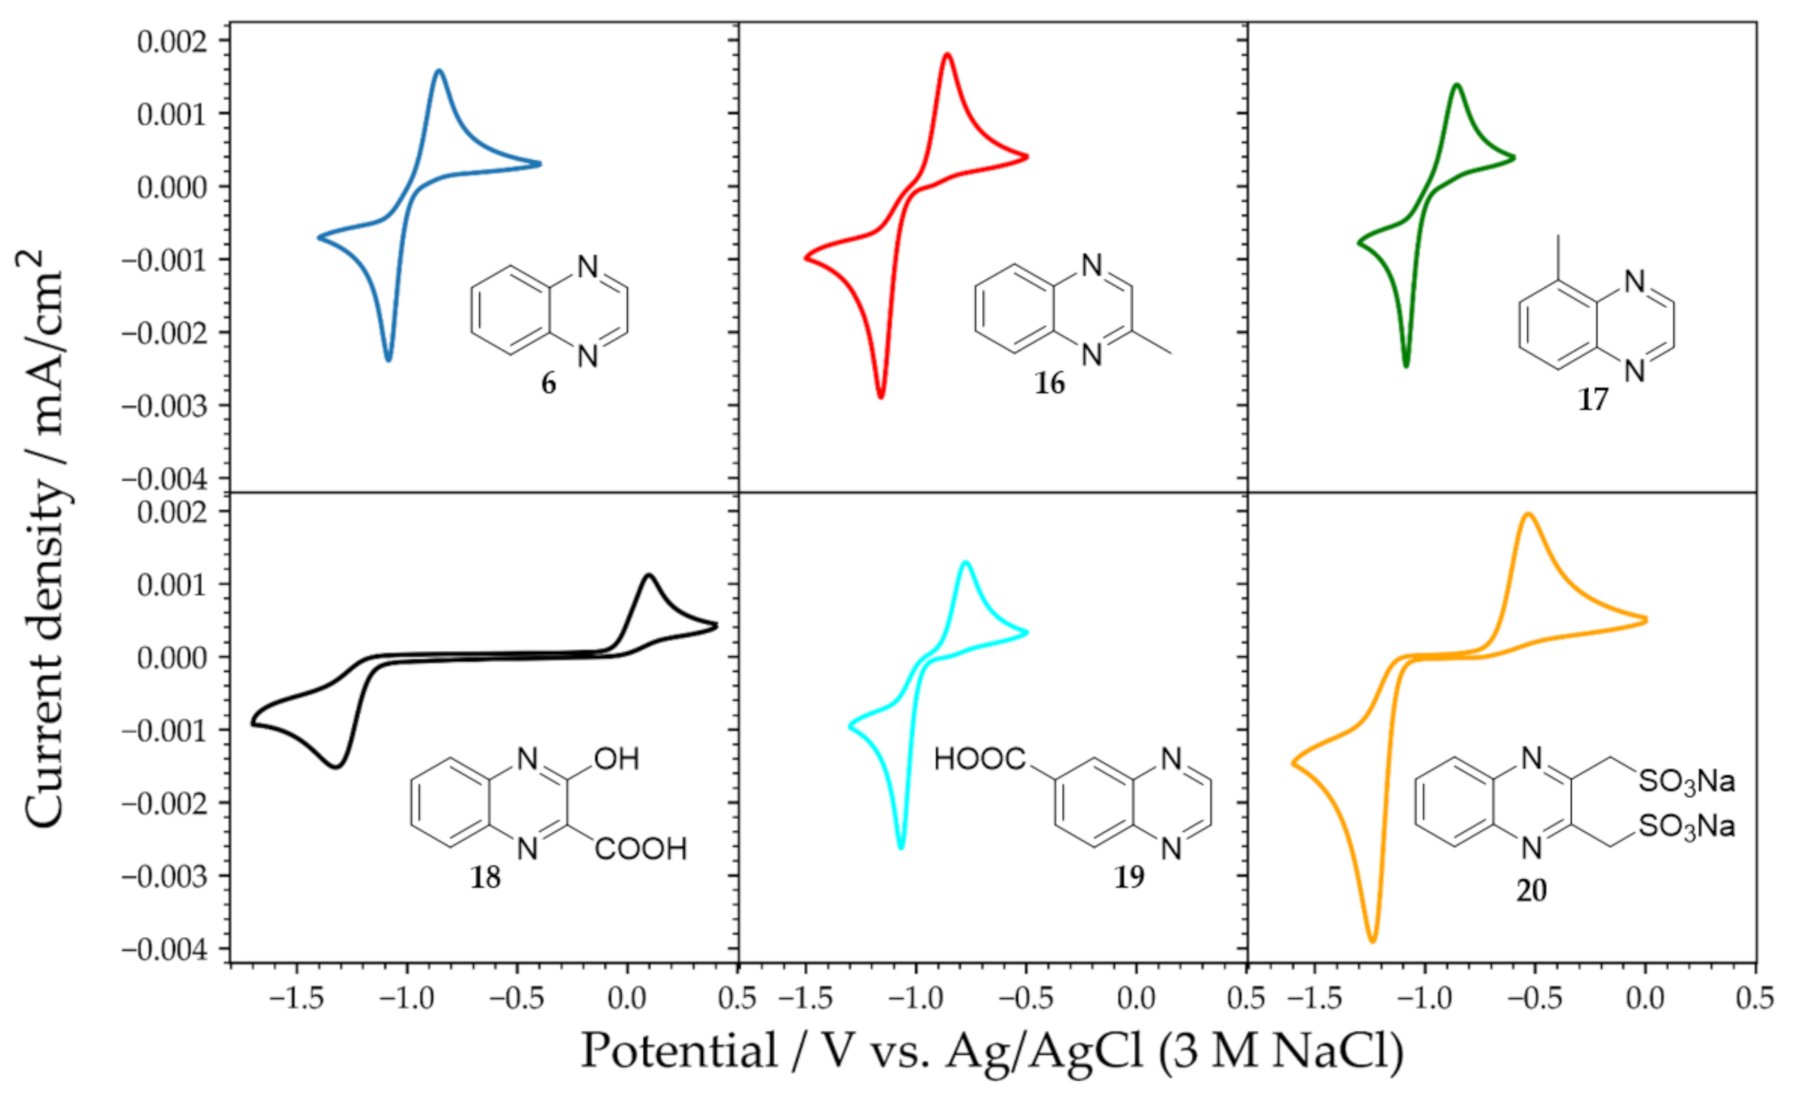
2.2. Substituted Quinoxalines in Unbuffered Conditions
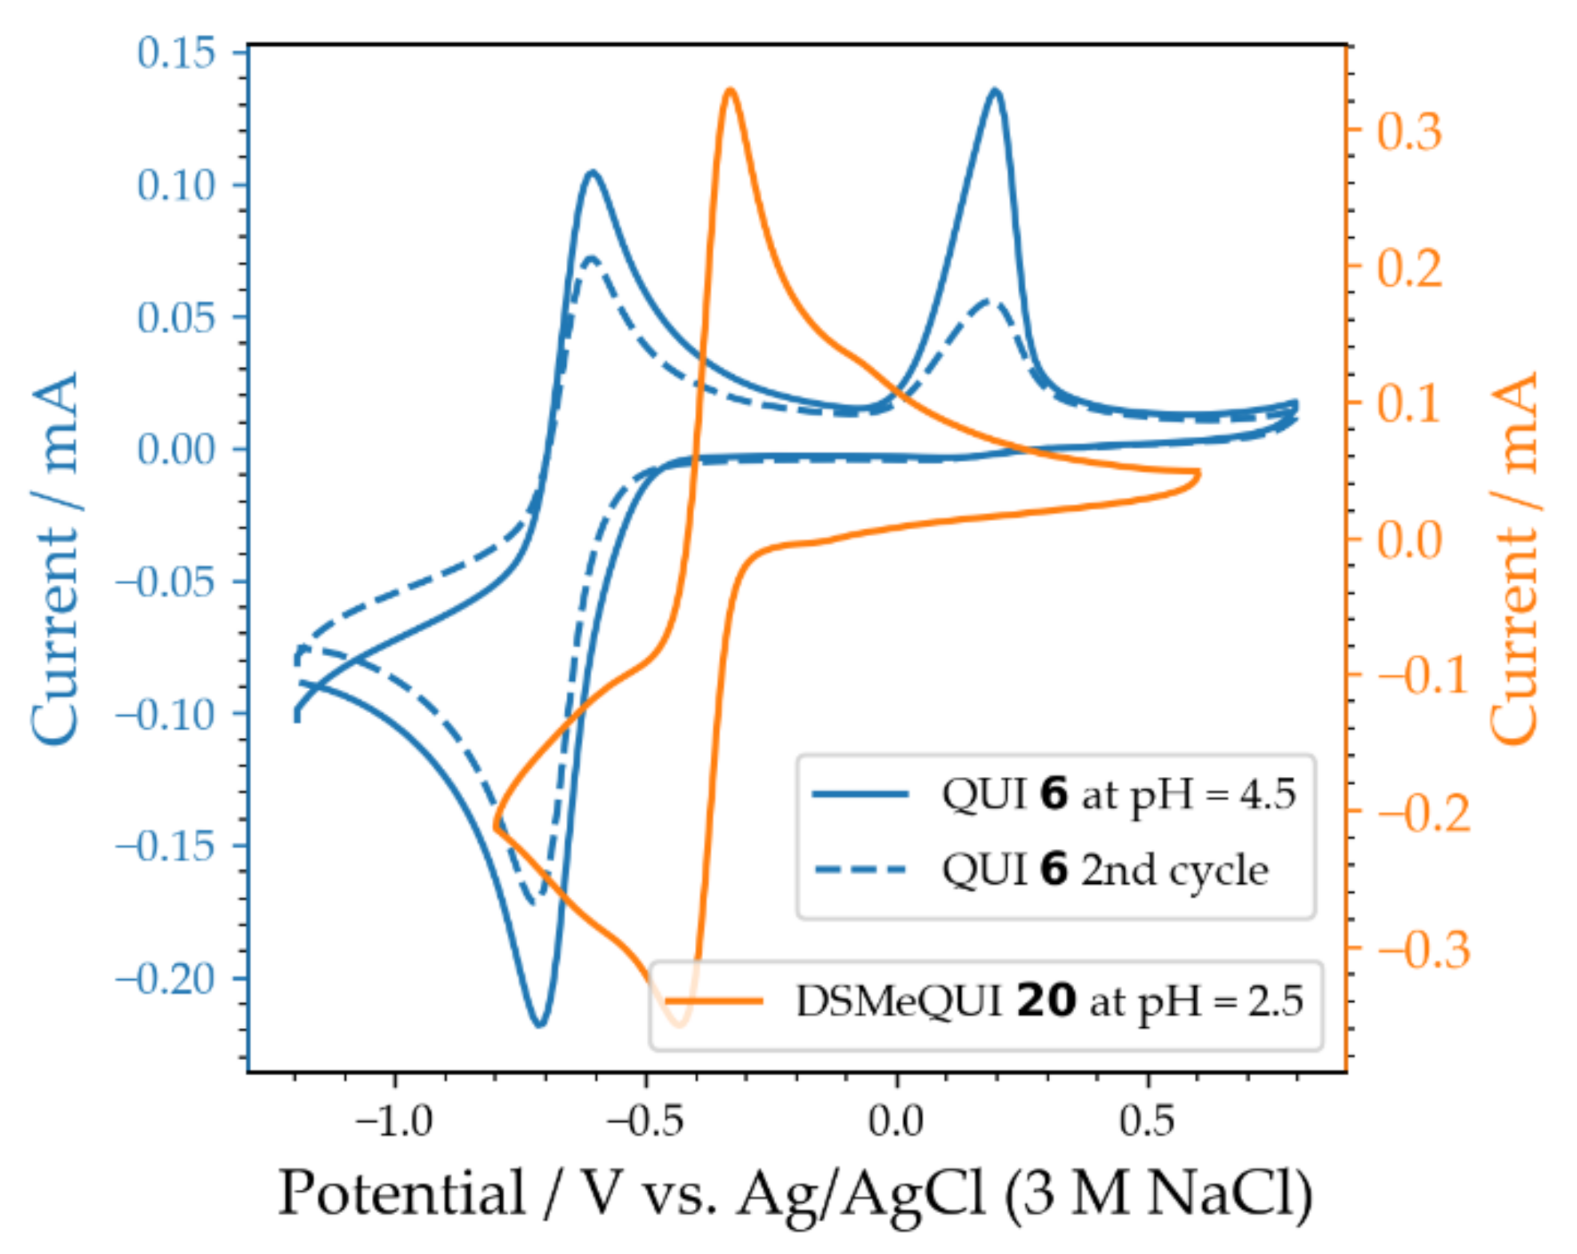
2.3. QUI 6 and DSMeQUI 20 in Buffered Solutions
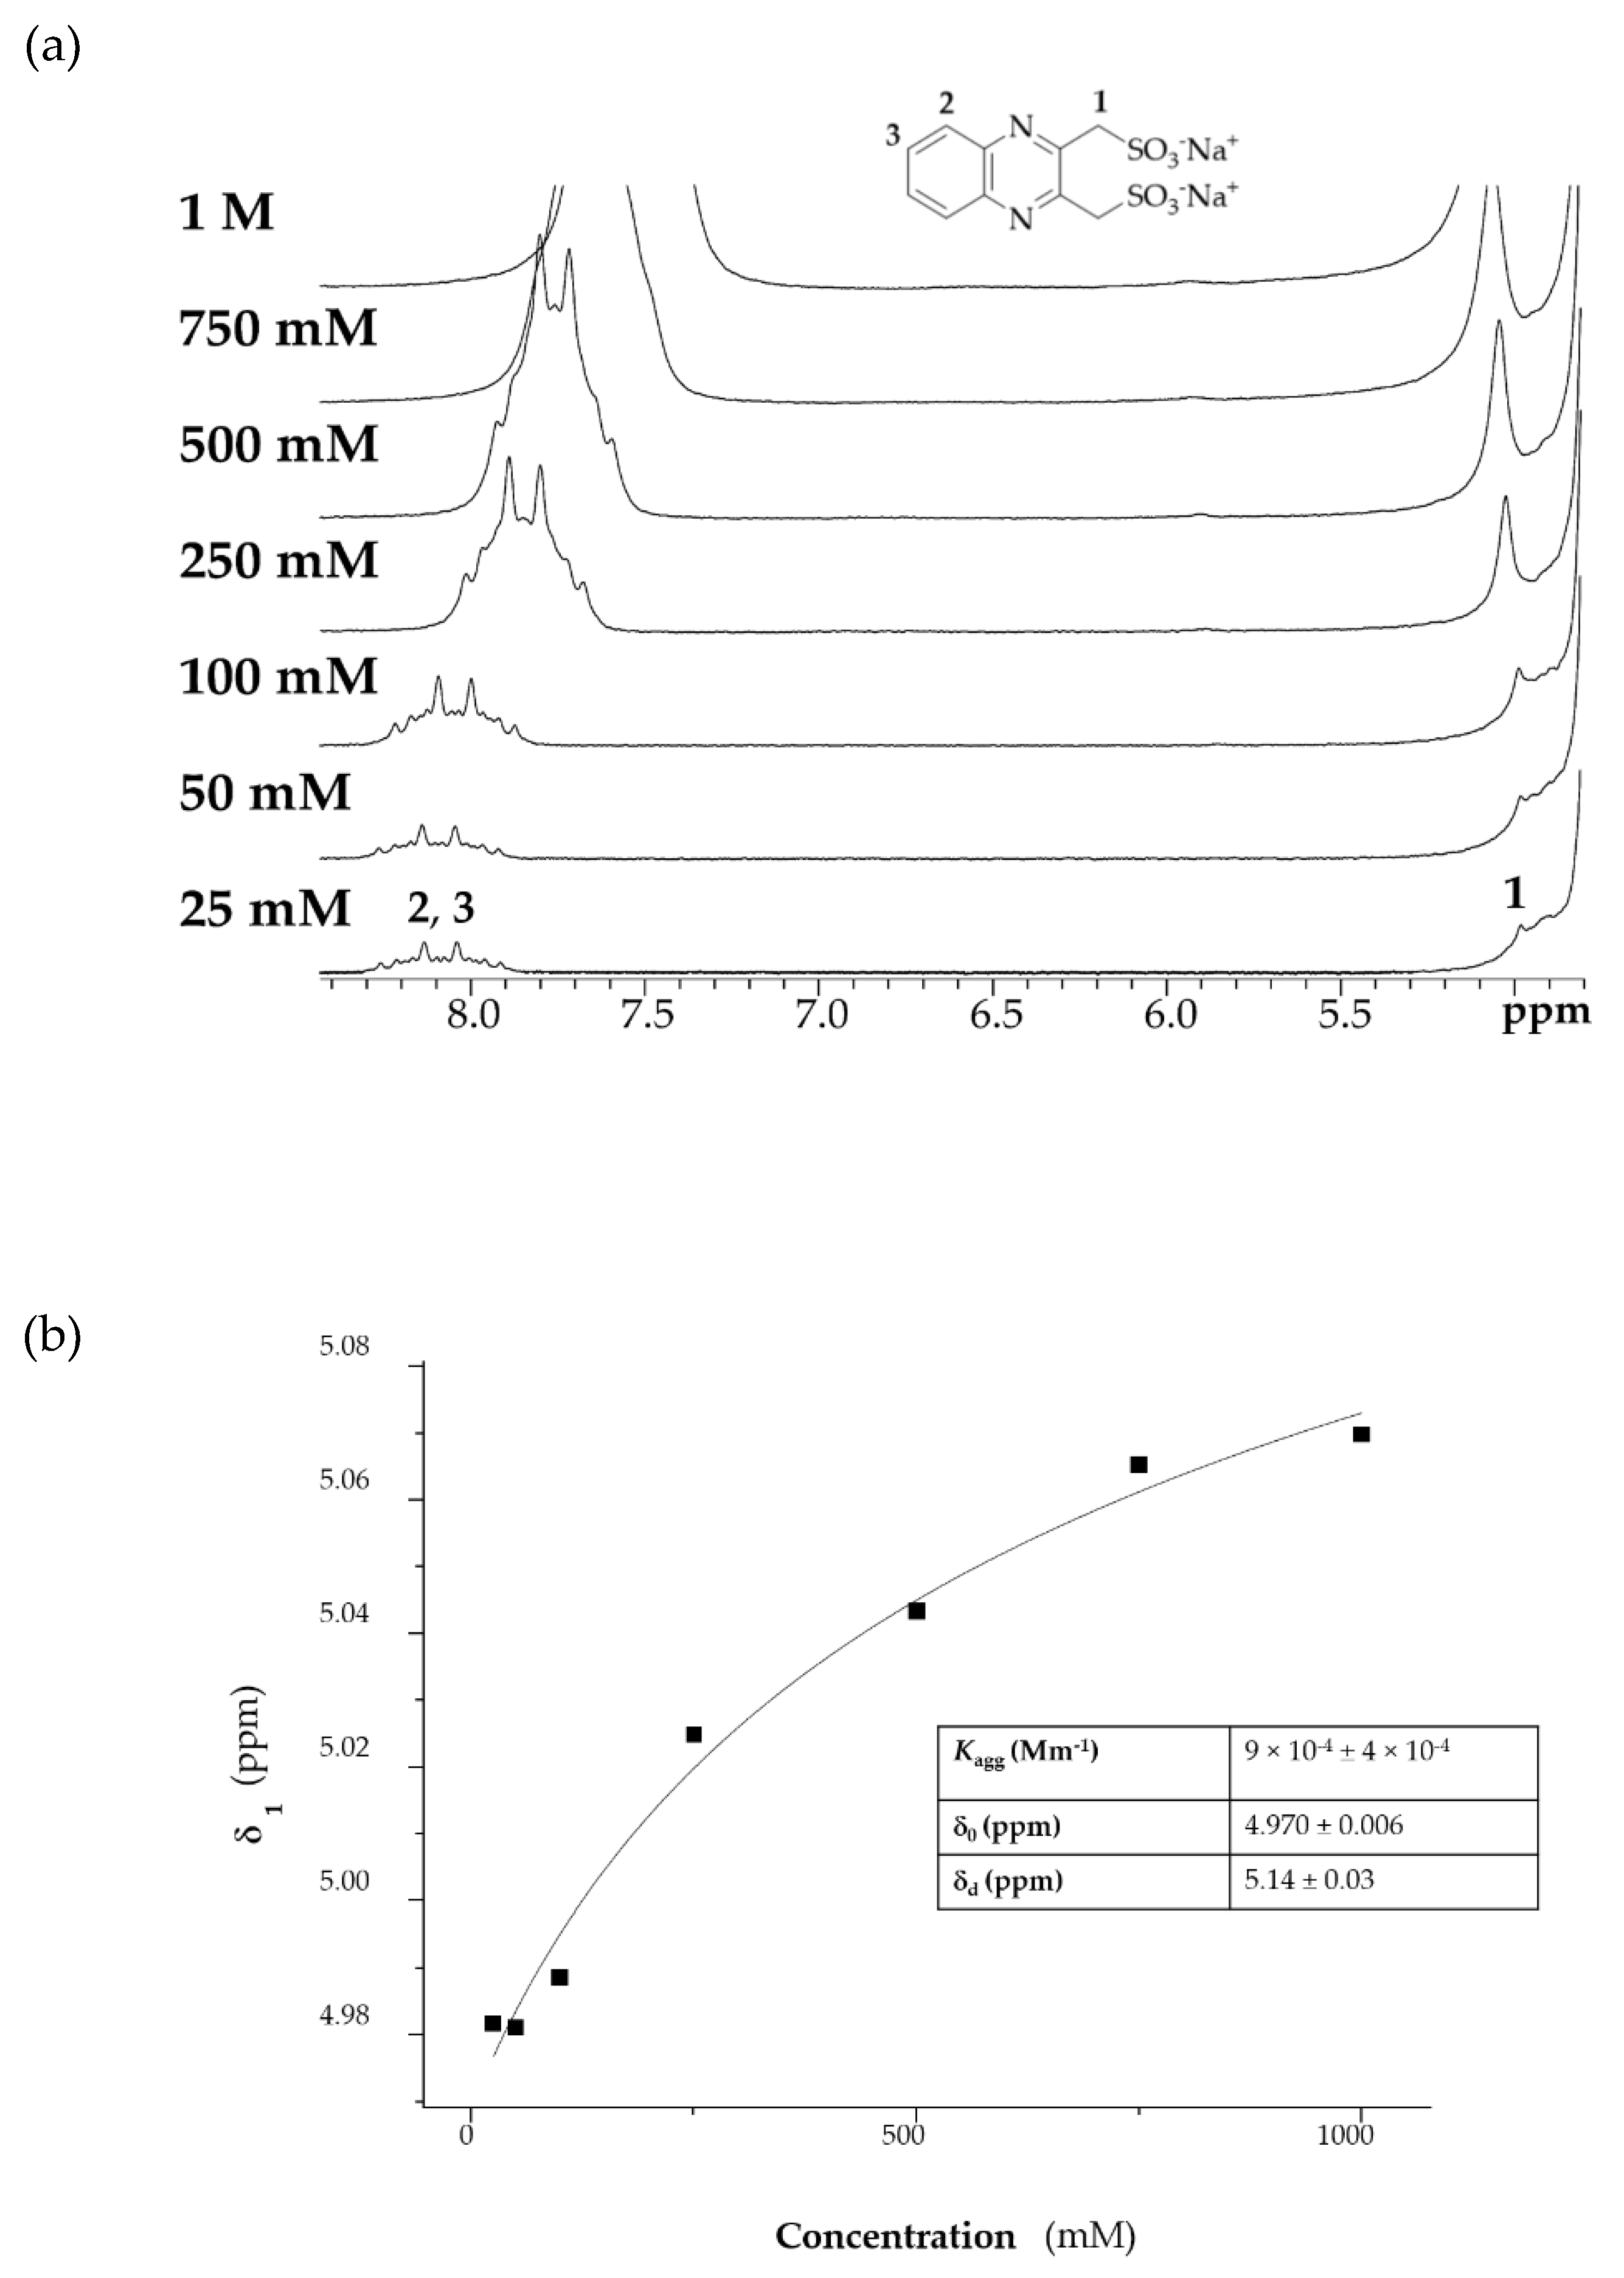
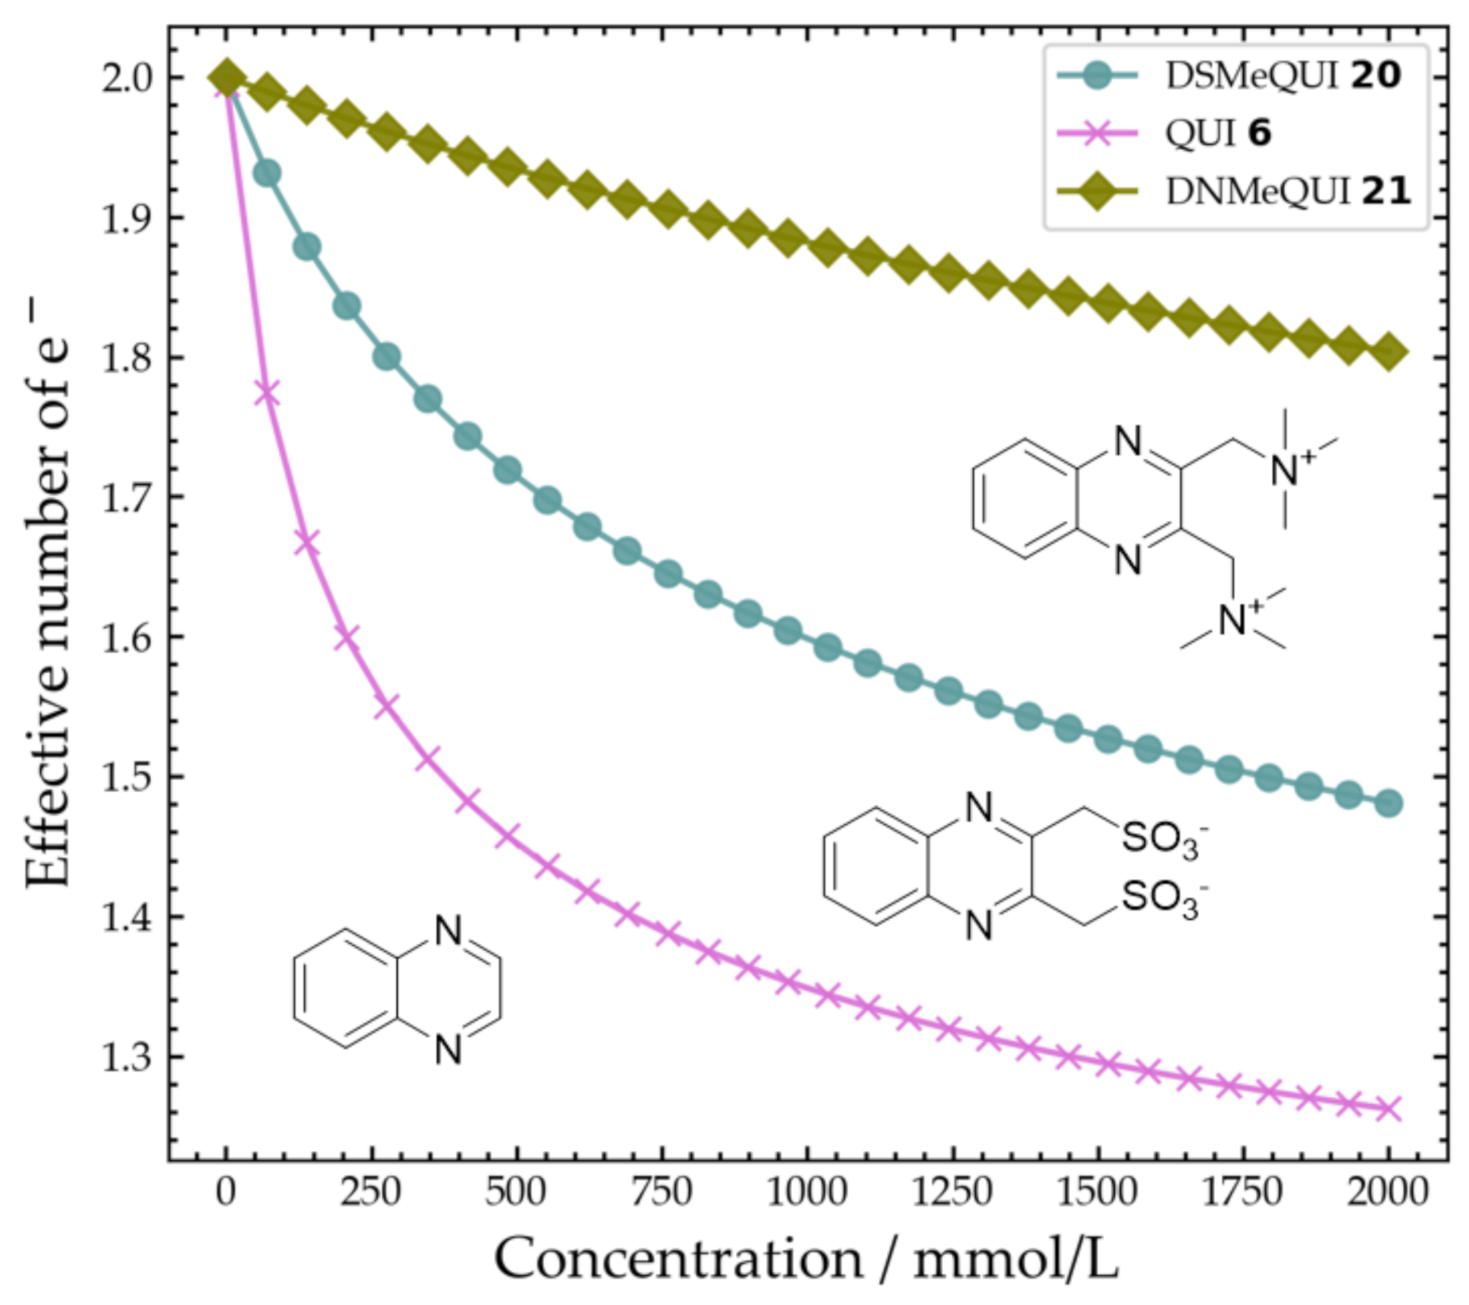
2.4. Concentration Dependent Response
3. Discussion
4. Materials and Methods
Supplementary Materials
Author Contributions
Funding
Institutional Review Board Statement
Informed Consent Statement
Data Availability Statement
Conflicts of Interest
Sample Availability
References
- Yang, B.; Murali, A.; Nirmalchandar, A.; Jayathilake, B. A Durable, Inexpensive and Scalable Redox Flow Battery Based on Iron Sulfate and Anthraquinone Disulfonic. J. Electrochem. Soc. 2020. [Google Scholar] [CrossRef]
- Zhang, C.; Niu, Z.; Peng, S.; Ding, Y.; Zhang, L.; Guo, X.; Zhao, Y.; Yu, G. Phenothiazine-Based Organic Catholyte for High-Capacity and Long-Life Aqueous Redox Flow Batteries. Adv. Mater. 2019, 31, 1–8. [Google Scholar] [CrossRef] [PubMed]
- Brushett, F.R.; Aziz, M.J.; Rodby, K.E. On Lifetime and Cost of Redox-Active Organics for Aqueous Flow Batteries. ACS Energy Lett. 2020, 5, 879–884. [Google Scholar] [CrossRef]
- Wu, M.; Jing, Y.; Wong, A.A.; Fell, E.M.; Jin, S.; Tang, Z.; Gordon, R.G.; Aziz, M.J. Extremely Stable Anthraquinone Negolytes Synthesized from Common Precursors. Chem 2020. [Google Scholar] [CrossRef]
- Ji, Y.; Goulet, M.A.; Pollack, D.A.; Kwabi, D.G.; Jin, S.; De Porcellinis, D.; Kerr, E.F.; Gordon, R.G.; Aziz, M.J. A Phosphonate-Functionalized Quinone Redox Flow Battery at Near-Neutral pH with Record Capacity Retention Rate. Adv. Energy Mater. 2019, 9, 1–7. [Google Scholar] [CrossRef]
- Quan, M.; Sanchez, D.; Wasylkiw, M.F.; Smith, D.K. Voltammetry of quinones in unbuffered aqueous solution: Reassessing the roles of proton transfer and hydrogen bonding in the aqueous electrochemistry of quinones. J. Am. Chem. Soc. 2007, 129, 12847–12856. [Google Scholar] [CrossRef]
- Hofmann, J.D.; Schmalisch, S.; Schwan, S.; Hong, L.; Wegner, H.A.; Mollenhauer, D.; Janek, J.; Schröder, D. Tailoring Dihydroxyphthalazines to Enable Their Stable and Efficient Use in the Catholyte of Aqueous Redox Flow Batteries. Chem. Mater. 2020. [Google Scholar] [CrossRef]
- Milshtein, J.D.; Su, L.; Liou, C.; Badel, A.F.; Brushett, F.R. Voltammetry study of quinoxaline in aqueous electrolytes. Electrochim. Acta 2015, 180, 695–704. [Google Scholar] [CrossRef]
- Hollas, A.; Wei, X.; Murugesan, V.; Nie, Z.; Li, B.; Reed, D.; Liu, J.; Sprenkle, V.; Wang, W. A biomimetic high-capacity phenazine-based anolyte for aqueous organic redox flow batteries. Nat. Energy 2018, 3, 508–514. [Google Scholar] [CrossRef]
- Lin, K.; Gómez-Bombarelli, R.; Beh, E.S.; Tong, L.; Chen, Q.; Valle, A.; Aspuru-Guzik, A.; Aziz, M.J.; Gordon, R.G. A redox-flow battery with an alloxazine-based organic electrolyte. Nat. Energy 2016, 1, 1–8. [Google Scholar] [CrossRef]
- Kwon, G.; Lee, S.; Hwang, J.; Ku, K.; Kwon, G.; Lee, S.; Hwang, J.; Shim, H.; Lee, B.; Lee, M.H. Multi-redox Molecule for High-Energy Redox Flow Batteries Multi-redox Molecule for High-Energy Redox Flow Batteries. Joule 2018, 1–12. [Google Scholar] [CrossRef]
- Dai, G.; He, Y.; Niu, Z.; He, P.; Zhang, C.; Zhao, Y.; Zhang, X.; Zhou, H. A Dual-Ion Organic Symmetric Battery Constructed from Phenazine-Based Artificial Bipolar Molecules. Angew. Chemie Int. Ed. 2019. [Google Scholar] [CrossRef]
- Clayden, J.; Greeves, N.; Warren, S. Organic Chemistry, 2nd ed.; Oxford University Press: Oxford, UK, 2012; ISBN 978-0-19-927029-3. [Google Scholar]
- Klatt, L.N.; Rouseff, R.L. Electrochemical Reduction of Pyrazine in Aqueous Media. J. Am. Chem. Soc. 1972, 94, 7295–7304. [Google Scholar] [CrossRef]
- Aleksic, M.; Pantic, J.; Kapetanovic, V. Evaluation of kinetic parameters and redox mechanism of quinoxaline at glassy carbon electrode. Facta Univ. Ser. Phys. Chem. Technol. 2014, 12, 55–63. [Google Scholar] [CrossRef]
- Swartz, J.; Anson, F.C. A comparison of the staircase voltammetric and polarographic responses of pyrazine and several substituted pyrazines in aqueous acid. J. Electroanal. Chem. Interfacial Electrochem. 1980, 114, 117–128. [Google Scholar] [CrossRef]
- Rupar, J.; Aleksić, M.M.; Nikolić, K.; Popović-Nikolić, M.R. Comparative electrochemical studies of kinetic and thermodynamic parameters of Quinoxaline and Brimonidine redox process. Electrochim. Acta 2018, 271, 220–231. [Google Scholar] [CrossRef]
- Fischer, O.; Thuy, T.H. Beitrag zum elektrochemischen Verhalten des Chinoxalins im wässrigen Medium. Collect. Czechoslov. Chem. Commun. 1976. [Google Scholar] [CrossRef]
- Ding, Y.; Zhang, C.; Zhang, L.; Zhou, Y.; Yu, G. Molecular engineering of organic electroactive materials for redox flow batteries. Chem. Soc. Rev. 2018, 47, 69–103. [Google Scholar] [CrossRef]
- Costentin, C.; Robert, M.; Savéant, J.M. Electrochemical approach to the mechanistic study of proton-coupled electron transfer. Chem. Rev. 2010, 110, 2145–2179. [Google Scholar] [CrossRef]
- Evans, D.H. One-electron and two-electron transfers in electrochemistry and homogeneous solution reactions. Chem. Rev. 2008, 108, 2113–2144. [Google Scholar] [CrossRef]
- Pang, S.; Wang, X.; Wang, P.; Ji, Y. Biomimetic Amino Acid Functionalized Phenazine Flow Batteries with Long Lifetime at Near-Neutral pH. Angew. Chemie Int. Ed. 2020. [Google Scholar] [CrossRef]
- Carney, T.J.; Collins, S.J.; Moore, J.S.; Brushett, F.R. Concentration-Dependent Dimerization of Anthraquinone Disulfonic Acid and Its Impact on Charge Storage. Chem. Mater. 2017, 29, 4801–4810. [Google Scholar] [CrossRef]
- Wiberg, C.; Carney, T.J.; Brushett, F.; Ahlberg, E.; Wang, E. Dimerization of 9,10-anthraquinone-2,7-Disulfonic acid (AQDS). Electrochim. Acta 2019, 317, 478–485. [Google Scholar] [CrossRef]
- Horman, I.; Dreux, B. Estimation of Dimerisation Constants from Complexatin-Induced Displacements of 1H-NMR Chemical Shifts: Dimerisation of Caffeine. Helv. Chim. Acta 1984, 67, 754–764. [Google Scholar] [CrossRef]
- Brauman, J.I.; Pandell, A.J. Mechanism of Permanganate Oxidation of Tertiary Hydrogen to Hydroxy1a. J. Am. Chem. Soc. 1970, 92, 329–335. [Google Scholar] [CrossRef]
- Parvez, M.M.; Haraguchi, N.; Itsuno, S. Molecular design of chiral quaternary ammonium polymers for asymmetric catalysis applications. Org. Biomol. Chem. 2012, 10, 2870–2877. [Google Scholar] [CrossRef]
- Schwiderski, R.L.; Rasmussen, S.C. Synthesis and characterization of thieno [3,4-b]pyrazine-based terthienyls: Tunable precursors for low band gap conjugated materials. J. Org. Chem. 2013, 78, 5453–5462. [Google Scholar] [CrossRef]


| Compound | Average Peak Potential (V) Vs. Ag/AgCl (3 M NaCl) |
|---|---|
| Quinoxaline (QUI) 6 | −0.970 |
| 2-Methylquinoxaline 16 | −1.012 |
| 5-Methylquinoxaline 17 | −0.972 |
| 2-Hydroxyquinoxaline-3-carboxylic acid 18 | −0.458 |
| Quinoxaline-6-carboxylic acid 19 | −0.923 |
| Sodium quinoxaline-2,3-diyldimethanesulfonate (DSMeQUI) 20 | −0.890 |
| Molecule | Kagg (mM−1) Horman and Dreux Model | Kagg (mM−1) Isodesmic Model |
|---|---|---|
| QUI 6 | 2.68 (±1.58) | 2.73 (±1.21) |
| DSMeQUI 20 | 0.56 (±0.32) | 0.73 (±0.35) |
| DNMeQUI 21 | 0.08 (±0.1) | 0.09 (±0.14) |
Publisher’s Note: MDPI stays neutral with regard to jurisdictional claims in published maps and institutional affiliations. |
© 2021 by the authors. Licensee MDPI, Basel, Switzerland. This article is an open access article distributed under the terms and conditions of the Creative Commons Attribution (CC BY) license (https://creativecommons.org/licenses/by/4.0/).
Share and Cite
Pasadakis-Kavounis, A.; Baj, V.; Hjelm, J. Electrochemical Characterization of Aromatic Molecules with 1,4-Diaza Groups for Flow Battery Applications. Molecules 2021, 26, 2227. https://doi.org/10.3390/molecules26082227
Pasadakis-Kavounis A, Baj V, Hjelm J. Electrochemical Characterization of Aromatic Molecules with 1,4-Diaza Groups for Flow Battery Applications. Molecules. 2021; 26(8):2227. https://doi.org/10.3390/molecules26082227
Chicago/Turabian StylePasadakis-Kavounis, Alexandros, Vanessa Baj, and Johan Hjelm. 2021. "Electrochemical Characterization of Aromatic Molecules with 1,4-Diaza Groups for Flow Battery Applications" Molecules 26, no. 8: 2227. https://doi.org/10.3390/molecules26082227
APA StylePasadakis-Kavounis, A., Baj, V., & Hjelm, J. (2021). Electrochemical Characterization of Aromatic Molecules with 1,4-Diaza Groups for Flow Battery Applications. Molecules, 26(8), 2227. https://doi.org/10.3390/molecules26082227