Article

Cu2O-Ag Tandem Catalysts for Selective Electrochemical Reduction of CO2 to C2 Products

1
Department of Applied Chemistry, University of Science and Technology of China, Hefei 230026, China
2
Institute of Science and Technology for New Energy, Xi’an Technological University, Xi’an 710021, China
3
State Key Laboratory of Silicon Materials, School of Materials Science and Engineering, Zhejiang University, Hangzhou 310027, China
*
Authors to whom correspondence should be addressed.
Molecules 2021, 26(8), 2175; https://doi.org/10.3390/molecules26082175
Submission received: 10 March 2021 / Revised: 5 April 2021 / Accepted: 7 April 2021 / Published: 9 April 2021
(This article belongs to the Special Issue The Chemistry of Sustainable Energy Conversion and Storage)

Abstract

:
The electrochemical carbon dioxide reduction reaction (CO2RR) to C2 chemicals has received great attention. Here, we report the cuprous oxide (Cu2O) nanocubes cooperated with silver (Ag) nanoparticles via the replacement reaction for a synergetic CO2RR. The Cu2O-Ag tandem catalyst exhibits an impressive Faradaic efficiency (FE) of 72.85% for C2 products with a partial current density of 243.32 mA·cm−2. The electrochemical experiments and density functional theory (DFT) calculations reveal that the introduction of Ag improves the intermediate CO concentration on the catalyst surface and meanwhile reduces the C-C coupling reaction barrier energy, which is favorable for the synthesis of C2 products.

1. Introduction

Fossil fuels have been increasingly consumed since the Industrial Revolution, while substantial greenhouse gas CO2 is inevitably emitted into the atmosphere as a byproduct, along with the severe climate change [1,2,3]. Nowadays, reducing the emission of CO2 and recycling CO2 to value-added products is becoming a significant challenge that government has to face [4,5,6]. It is urgent to search for a clean and efficient way to convert CO2 to form an artificial carbon recycling [7,8]. With the rapid development of the electrochemistry and electrochemical catalysis, the electrochemical CO2 reduction reaction (CO2RR) to highly valuable C2 chemicals and fuels powered by renewable energy sources [9,10] represents one of the most environmentally friendly and sustainable strategies [11,12]. However, the catalytic process involved multiple electrons transfer generally suffers from low selectivity and high overpotentials [13,14,15,16]. Therefore, developing the electrocatalysts with the high selectivity and activity has been the focus of research.
Cu-based catalysts are the most-commonly used catalysts for CO2 reduction to C2 products such as ethylene, ethanol and acetate, because of its unique catalytic capability stemming from the electronic structures of copper [16,17,18,19]. The regulation by means of the morphology [20,21,22], composition [23,24,25,26] and the chemical state [27,28,29] has been applied to improve the performance of Cu-based catalysts. It has been demonstrated that cuprous oxide (Cu2O) plays a critical role in improving the selectivity toward C2 products [30,31,32,33,34]. For example, in 2012, Li et al. synthesized the modified Cu electrodes by reducing Cu2O films [30]. The thin Cu2O layers in the electrodes exhibited higher CO2 reduction activity than pure Cu metal. Later, Kas et al. prepared Cu2O derived copper nanoparticles and they found the selectivity of ethylene and ethane largely depended on the parent Cu2O film thickness [31]. The oxidized Cu catalysts prepared by Mistry et al. showed a 60% Faradaic efficiency (FE) towards ethylene [32]. Operando characterization and experimental results show that the presence of Cu+ is key to lowering the onset potential and enhancing ethylene selectivity. In 2017, Xiao et al. used density functional theory (DFT) calculations to research on the advantages of Cu2O-derived electrodes [34]. The results show that Cu+ has the ability to promote CO2 activation and the Cu+ and Cu0 cooperatively improves the kinetics and thermodynamics of both CO2 activation and CO dimerization, thereby boosting the efficiency and selectivity of CO2RR. While Cu2O exhibits the enhanced performance in the activity and selectivity for CO2 reduction to C2 products, it still cannot meet the decent selectivity and activity for the industry.
Since CO is an important reaction intermediate for the C-C coupling reaction in CO2RR to C2 products, increasing the near-surface CO concentration (and consequently CO surface coverage) is a key factor that can enhance the selectivity towards C2 products [35,36,37]. Considering that Ag owns the ability to reduce CO2 to produce CO [38,39,40], cooperating Cu2O with Ag may be an effective strategy to improve the selectivity of C2 products. Previous studies have reported a lot of Cu-Ag catalysts [41,42,43,44,45], and recently a Cu-Ag tandem catalyst was synthesized by Chen et al., which resulted in a four-fold enhancement of C2 products formation on Cu [43]. The Ag-incorporated biphasic Cu2O-Cu catalysts synthesized by Lee et al. reached an FE for C2 products of 49% [44]. Later, improved FEs for ethylene and ethanol of nearly 55% and 26% were achieved using nanoporous Cu-Ag alloys [45]. While the FE of C2 products have been improved, the activity remains low and the current densities are not high enough to meet the commercial purpose. Moreover, the reaction mechanism for converting CO2 to C2 products on the Cu2O-Ag catalyst also needs to be further revealed.
In this work, we prepared Ag modified Cu2O (Cu2O-Ag) tandem catalysts with a size of ~50 nm by a replacement reaction for CO2RR. The electrochemical studies reveal that introducing Ag into Cu2O can substantially boost the generation of CO and improve the FE of C2 products to 72.85% at −1.18 V (vs. RHE). The maximum FE of acetate reaches 15.03% at −1.18 V (vs. RHE) on the Cu2O-Ag catalyst, which is three times higher than that of the Cu2O catalyst at the same potential. The experiments results and DFT calculations show that high coverage of CO on the catalyst surface reduces the C-C coupling barrier energy, which is helpful in the synthesis of the C2 products.

2. Results and Discussion

Figure 1a shows the scanning electron microscopy (SEM) image of the prepared Cu2O-Ag catalysts, which displays uniform cubic morphology. The average size of the densely distributed nanocubes is ~50 nm. Transmission electron microscopy (TEM) image in Figure 1b shows that the Cu2O-Ag has the regular shapes with the average edge length of 50 ± 8 nm (Figure S1a,b). The morphologies and structures of Cu2O nanocubes (Figures S1c,d and S2a,b) are similar to that of the Cu2O-Ag nanocubes, suggesting that the Cu2O-Ag nanocubes preserve the original morphologies and structures of Cu2O. Moreover, the lattice fringes of Cu2O-Ag and Cu2O were observed by high–resolution transmission electron microscopy (HRTEM). The interplanar spacing of 0.245 and 0.217 nm of Cu2O-Ag is assigned to the (111) and (200) plane of Cu2O (Figure 1b), respectively, which are also observed in the Cu2O nanocubes (Figure S2c), further confirming that the phase of Cu2O is preserved after adding Ag. Figure 1c and S2d exhibit the X-ray diffraction (XRD) patterns for Cu2O-Ag and Cu2O, respectively. Both of these catalysts exhibit similar profiles, where the diffraction peaks at 2θ = 29.6°, 36.4°, 42.3°, 61.4° and 73.5° belong to the planes of Cu2O(110), (111), (200), (220) and (210) (JCPDS 05-0667), respectively. After introducing Ag, the new peaks at 2θ = 38.0°, 44.3°, 64.4° and 77.3° corresponding to planes of Ag(111), (200), (220) and (310) (JCPDS 04-0783) appear, indicating the formation of Ag sites in the Cu2O-Ag catalysts. Energy dispersive X-ray spectroscopy (EDS) elemental mapping was further used to prove the existence and distribution of Ag. SEM-EDS elemental mapping images (Figure S3) confirm the existence of Cu and Ag elements, which are homogeneously distributed among the catalysts. HRTEM-EDS (Figure 1d–g) elemental mapping images show that Ag particles exist among Cu2O nanocubes and the particle size of Ag is smaller than that of Cu2O nanocubes. These results clearly reveal that the Cu2O-Ag catalyst has been prepared with separated Cu2O nanocubes and Ag nanoparticles.
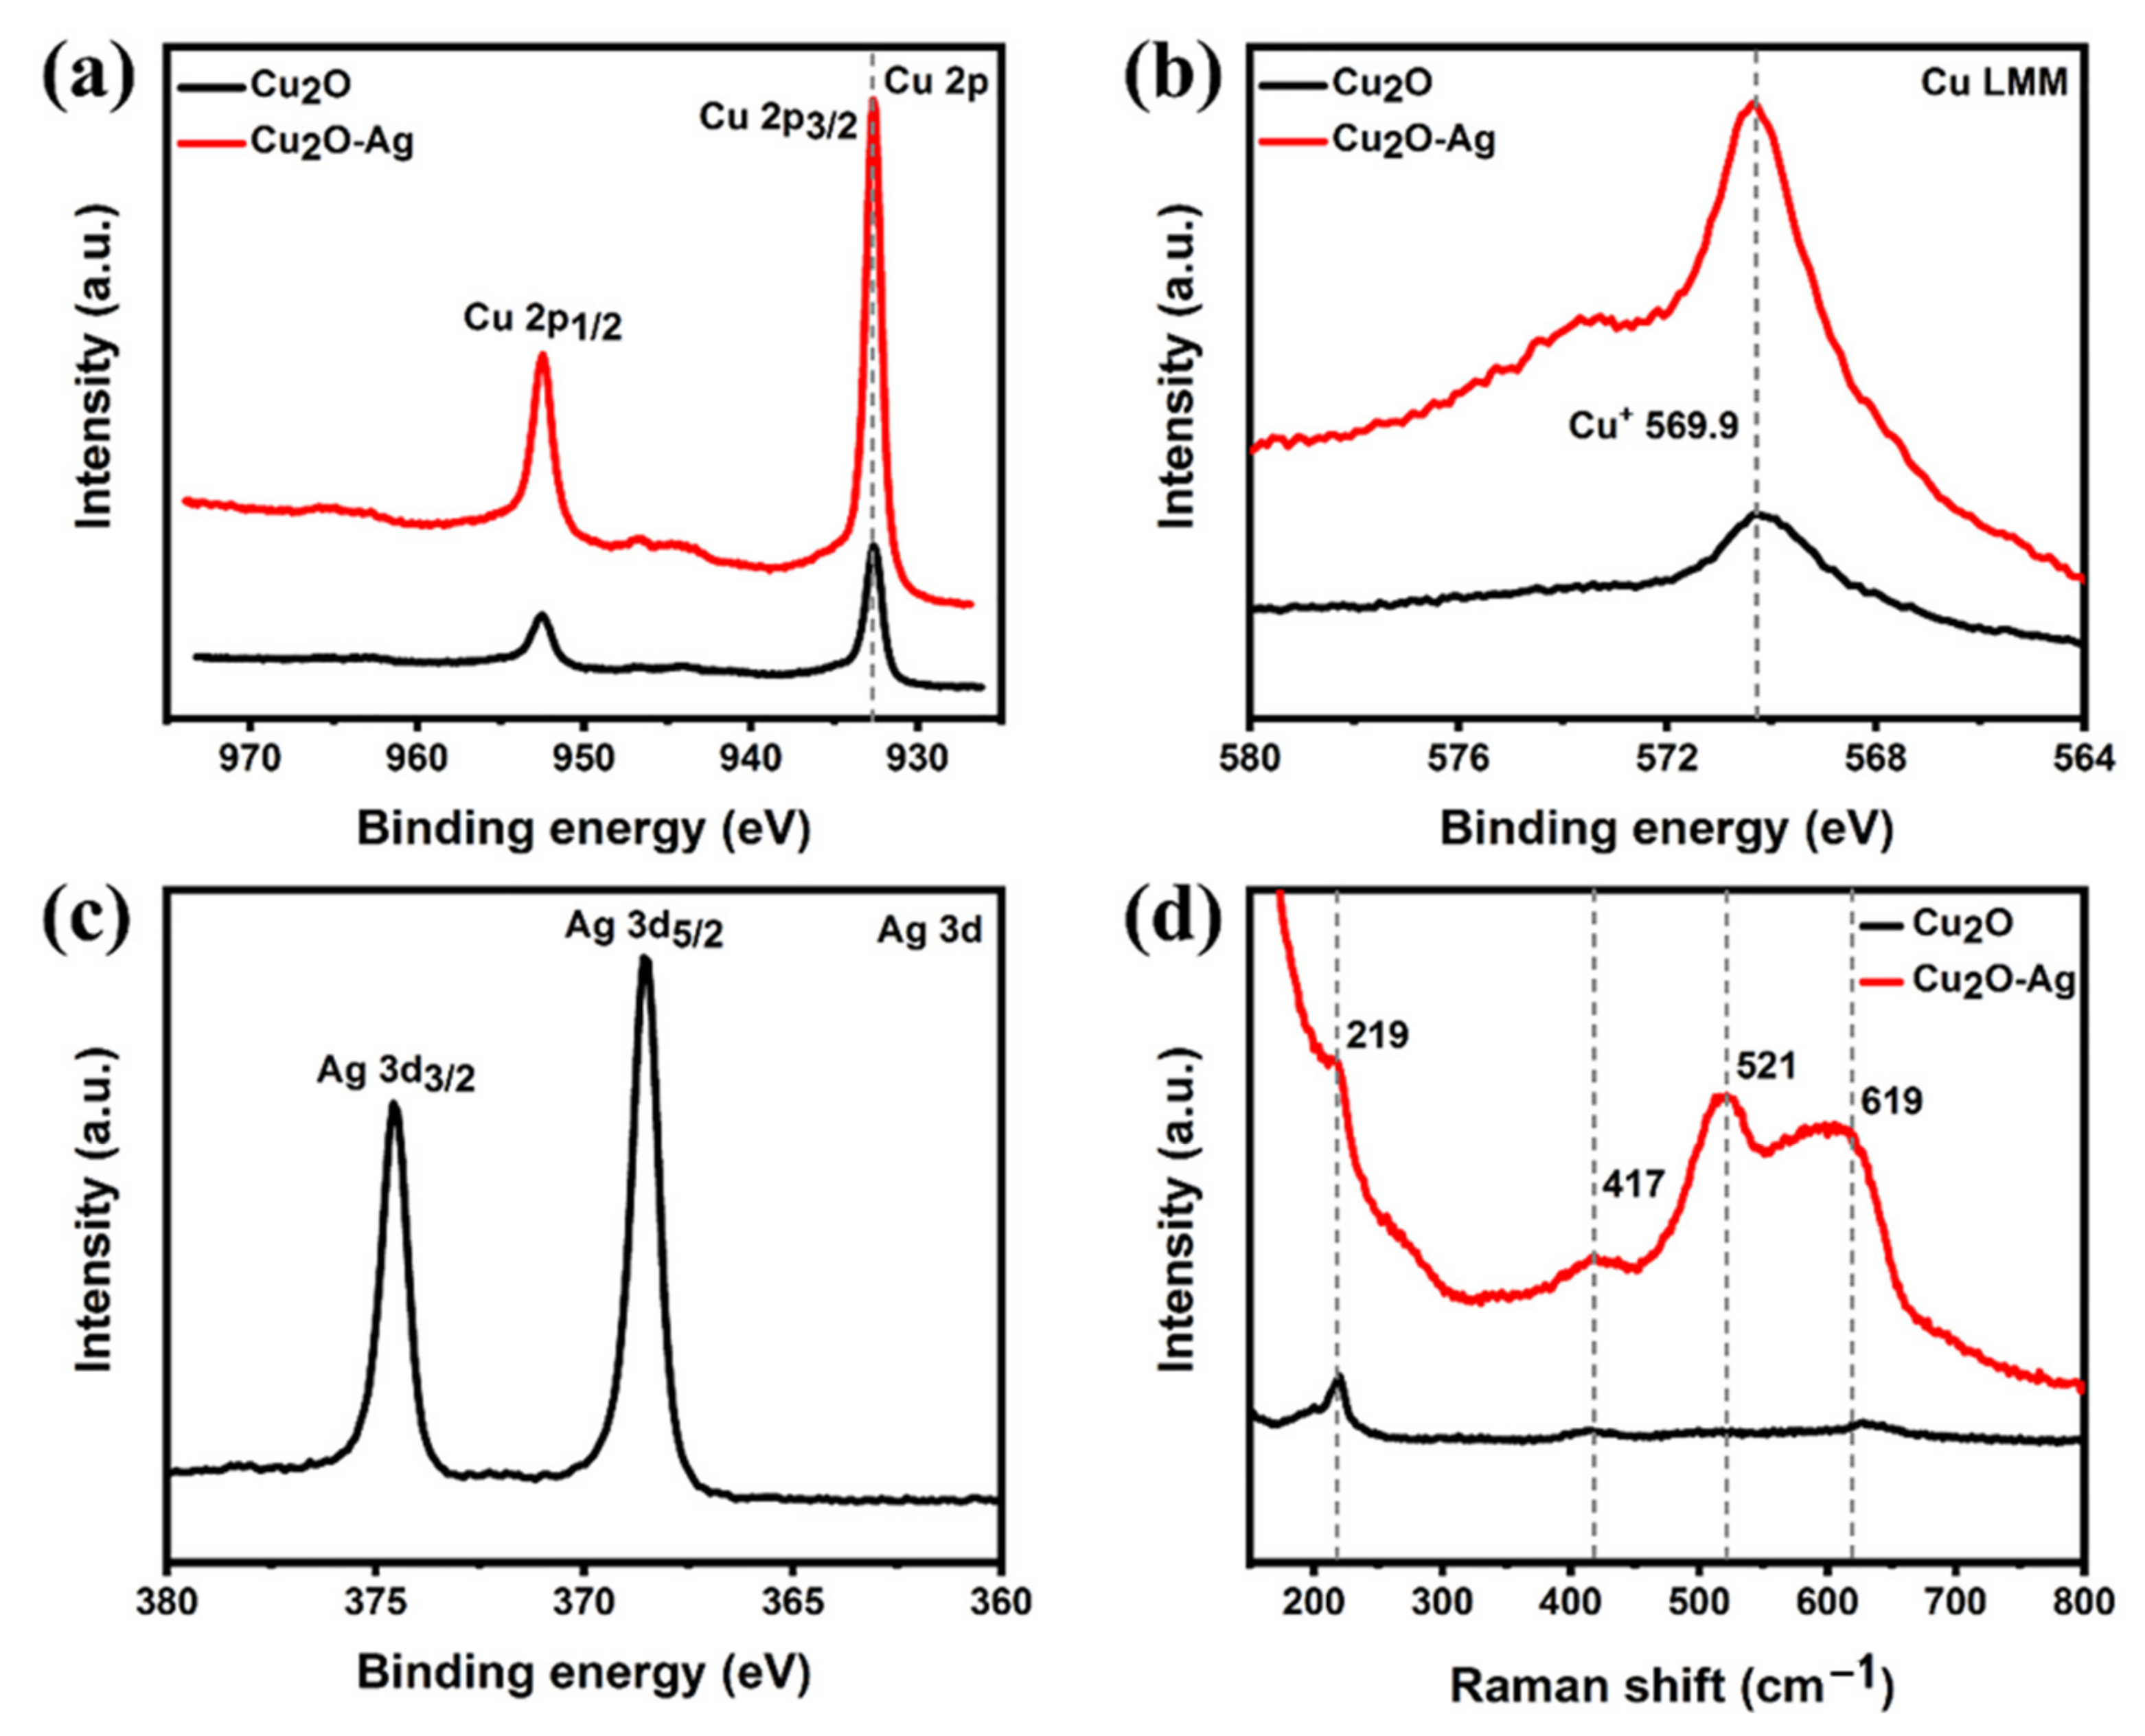
The X-ray photon spectroscopy (XPS) spectrum was further conducted to probe the chemical and composition states of Cu2O-Ag and Cu2O catalysts. Figure 2a shows the Cu 2p spectra of Cu2O-Ag and Cu2O. Both catalysts display one pair of spin-orbit doublet peaks of Cu 2p, which can be assigned to Cu 2p3/2 and Cu 2p1/2, respectively. The peaks located at 932.7 and 952.5 eV are attributed to the Cu 2p3/2 and Cu 2p1/2 of the Cu2O (Cu+) or Cu (Cu0), respectively [46]. After introducing Ag, the binding energies of Cu 2p3/2 and Cu 2p1/2 only exhibit a little shift to the lower energy region. It is difficult to distinguish the Cu+ and Cu0 chemical state through XPS because the difference of the binding energies between Cu+ and Cu0 is only 0.1 eV [46]. Auger electron spectroscopy (AES) was used to further verify the chemical state of Cu. Figure 2b clearly shows the signal of Cu+ state at 569.9 eV for both samples, which is different from the metallic Cu0 state at 568.0 eV in the reported literature [47]. The Ag 3d3/5 and 3d3/2 peaks of the Cu2O-Ag are located at 368.6 and 374.6 eV (Figure 2c), which are consistent with the literature values of metallic Ag [48]. Furthermore, Raman spectra were also used to confirm the oxide state of Cu. In Figure 2d, both samples exhibit Raman peaks at around 219, 417, 521 and 619 cm−1, which correspond to the 2Γ12, 4Γ12, Γ+25 and Γ12 + Γ+25 phonon modes of Cu2O [49], respectively. These results are in good agreement with the previous XRD and HRTEM measurements, confirming the formation of the Cu2O sample and the Cu2O-Ag tandem catalyst.
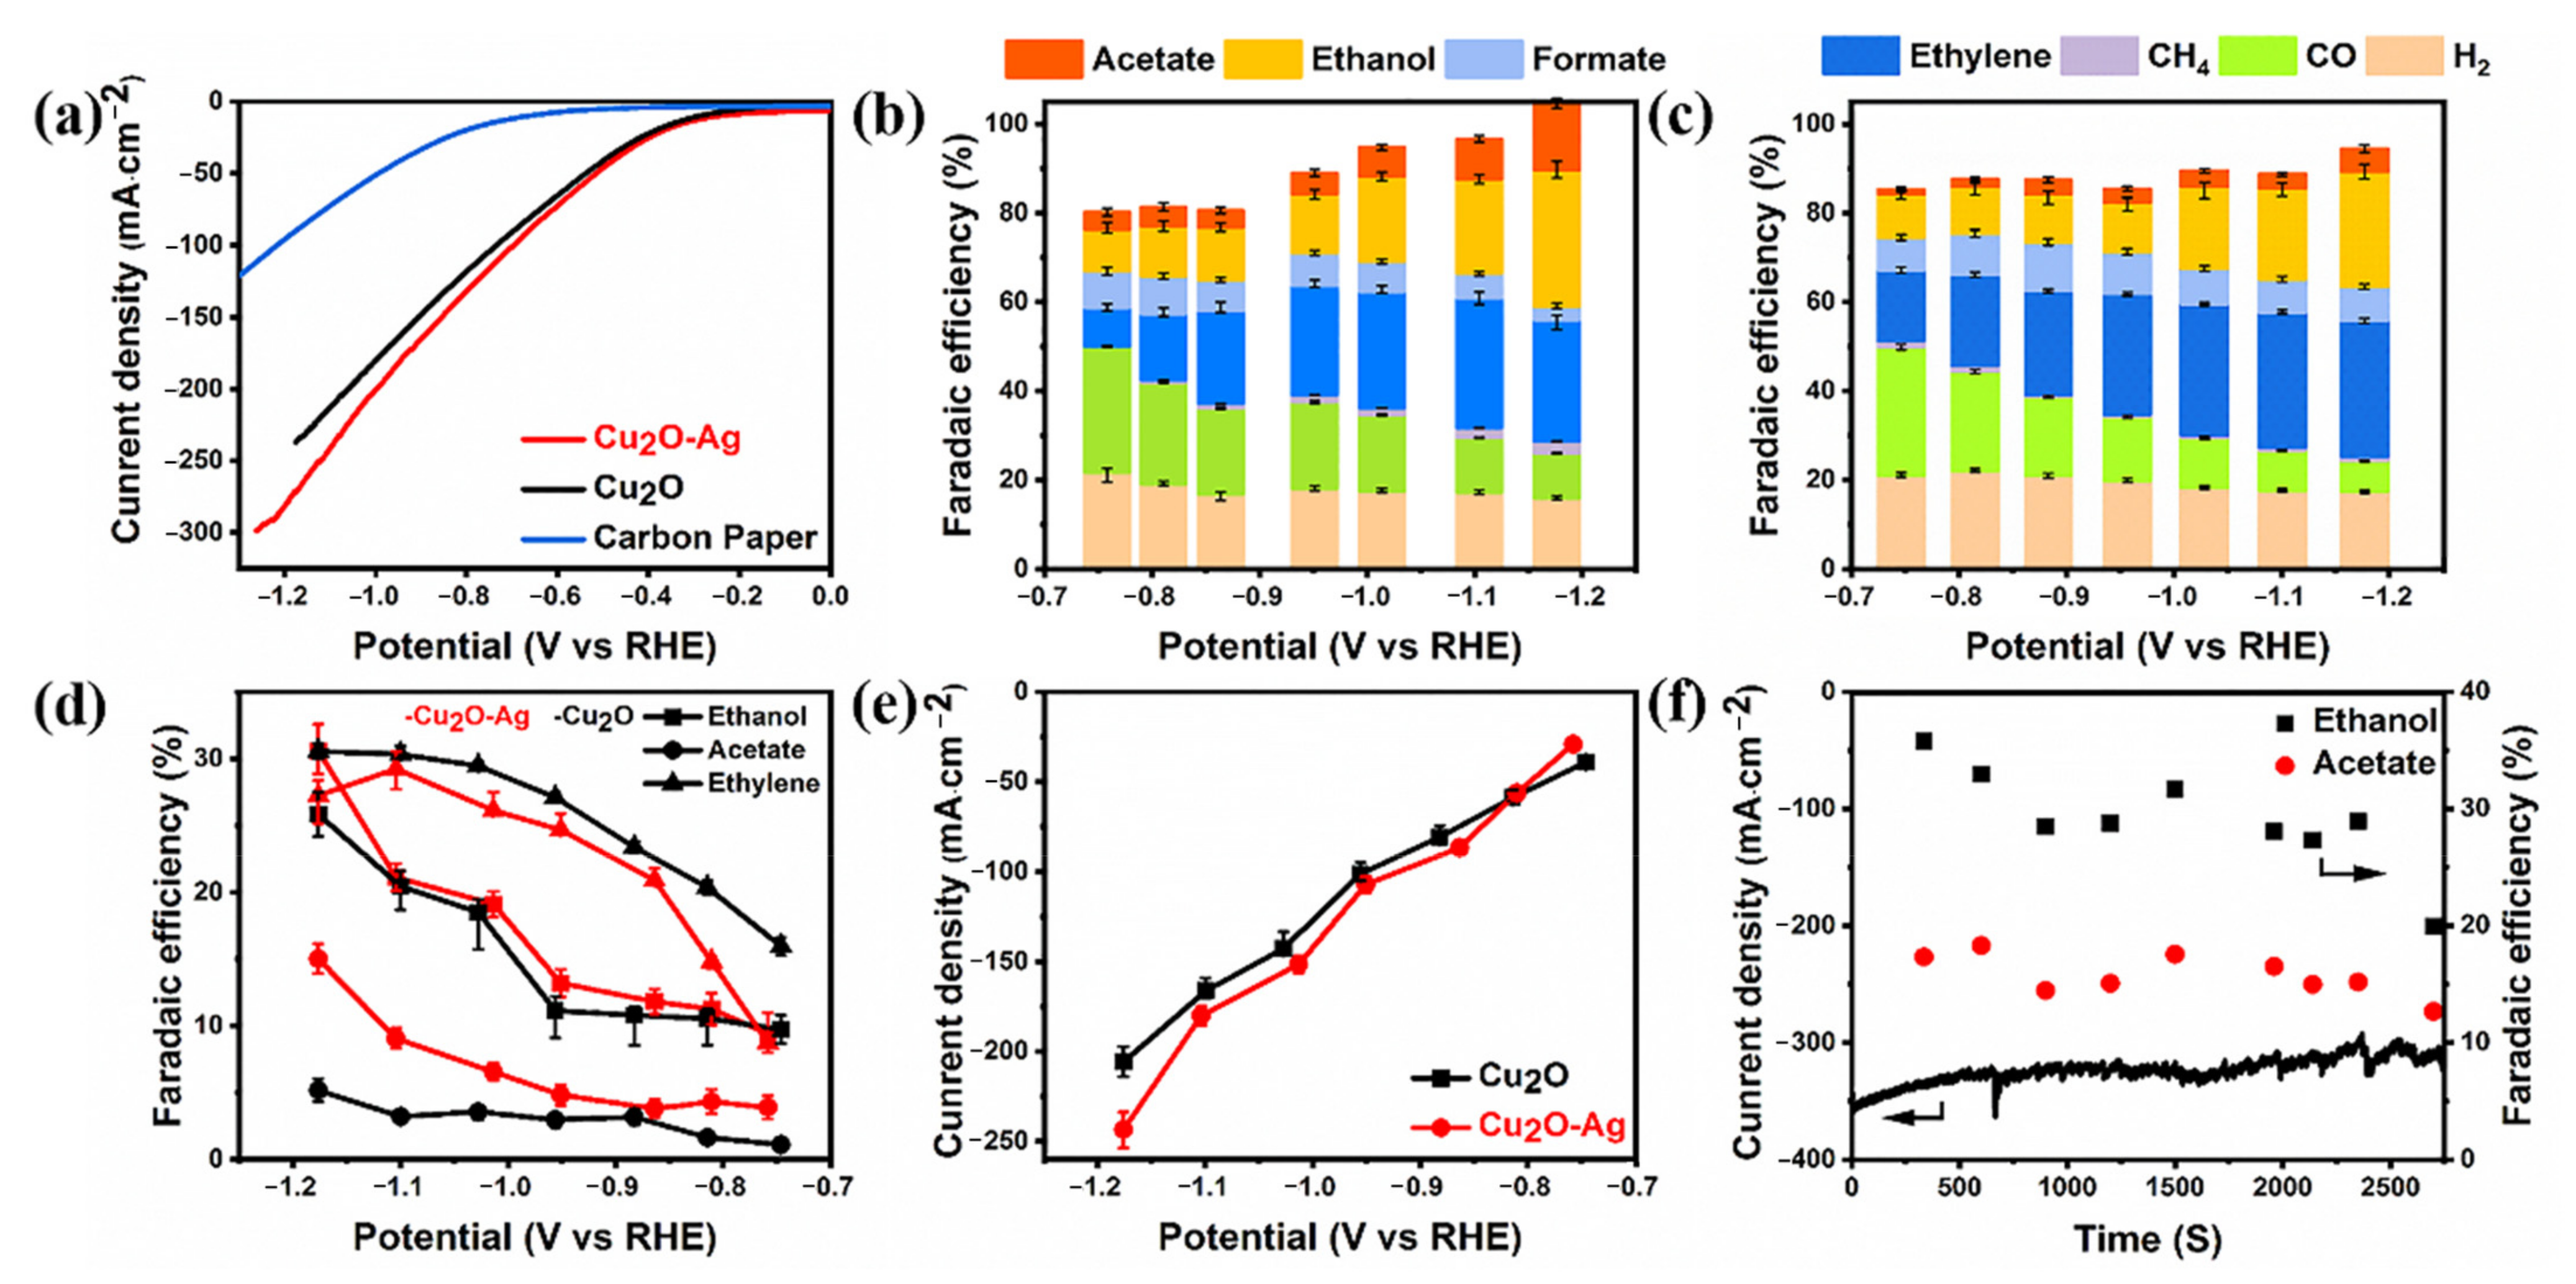
The selectivity and activity of CO2RR were tested in a commercial flow-cell using gas diffusion electrode (GDE) at constant applied electrode potentials in aqueous 1 M KOH electrolyte. A cation-exchange membrane (Nafion N115, DuPont) separates the cathode compartment from the anode compartment. The catalyst powder dispersed in methanol are applied on a hydrophobic carbon paper using as the gas diffusion layer (GDL) and the GDL is used as the GDE. CO2 is flowing through the cell at the backside of the GDL. The ambient CO2 pressure minimizes mass transport limitations and enables high currents compared to H-type electrolytic cell test [50]. As shown in Figure 3a, the linear sweep voltammetry (LSV) curves were obtained at 10 mV·s−1 in 1 M KOH electrolyte on the Cu2O-Ag and Cu2O catalyst, respectively. Both catalysts show the sharp reduction peaks for CO2 reduction and higher current densities compared to blank carbon paper. As the potential decreases from −0.40 to −1.15 V (vs. RHE), the total current densities of Cu2O-Ag and Cu2O increase from 25.31 mA·cm−2 to 260.80 mA·cm−2 and from 22.16 to 229.40 mA·cm−2, respectively. Therefore, the Cu2O-Ag and Cu2O catalysts show the similar trends in total current densities, but the current densities of Cu2O-Ag are higher than that of Cu2O.
The FE values of CO2 reduction products on the Cu2O-Ag and Cu2O catalysts are shown in Figure 3b,c, respectively. For Cu2O-Ag catalysts, CO and H2 are the dominant products with total 50.01 ~ 37.57% FE at low overpotentials from −0.76 V to −0.95 V (vs. RHE). However, the FEs of CO and H2 decrease to 10.15% and 15.92% as the potential decreases to −1.18 V (vs. RHE). Importantly, the FE of all C2 products increases from 21.74% at −0.76 V to 72.85% at −1.18 V (vs. RHE). Ethylene and ethanol are the primary C2 products with the FEs of 27.23% and 30.60% at −1.18 V (vs. RHE) (Figure 3d), respectively. The FE of acetate also increases from 3.90% to 15.02% as the potential decreases from −0.76 V to −1.18 V (vs. RHE) (Figure 3d). Compared with the Cu2O-Ag catalyst, the Cu2O catalyst shows slightly lower FE of CO and higher FE of H2, ranging from 28.81% and 21.04% at −0.75 V to 6.86% and 17.43% at −1.18 V (vs. RHE), respectively, while the FEs of ethylene, ethanol and acetate increase from 15.95%, 9.74% and 1.01% at −0.75 V to 30.55%, 25.84% and 5.18% at −1.18 V (vs. RHE) (Figure 3d), respectively. While the FEs of all C2 products increases from 26.70% at −0.75 V to 61.57% at −1.18 V (vs. RHE), which shows a similar trend to the Cu2O-Ag catalyst, the Cu2O-Ag catalyst has the higher FE of C2 products and lower FE of H2.
Furthermore, as shown in Figure 3d,e, the Cu2O-Ag catalyst reaches a maximum C2 products FE of 72.85% at −1.18 V (vs. RHE) with the partial current density of 243.32 mA·cm−2, involving 27.23% ethylene, 30.60% ethanol and 15.02% acetate. Compared to Cu2O-Ag, the total C2 products FE of Cu2O is 61.57% with the partial current density of 205.64 mA·cm−2, involving 30.55% ethylene, 25.84% ethanol and only 5.18% acetate. Obviously, the FE of acetate on the Cu2O-Ag is about three times higher than that on the Cu2O, suggesting a more prominent ability of Cu2O-Ag than Cu2O for CO2 reduction to acetate.
The stability of the Cu2O-Ag catalyst was tested at −1.18 V (vs. RHE) (Figure 3f). The catalyst shows a good performance without the decay of the current density and C2 product FEs in 40 min. The FEs of ethanol and acetate remain over 30% and 15% for over 2400 s with a total current density of over 300 mA cm−2. As shown in Figures S4 and S5, the catalyst morphology and crystal facet were changed at 5 min after CO2RR and continuously changed with the reaction progress, while the performance is basically unchanged. Hence, the change in catalyst morphology and crystal facet might not be the main reason of performance degradation and the decrease of C2 products FE and the current density may be due to the loss of hydrophobicity over the GDLs and the salinization of electrolyte [51,52,53,54]. From the above results, it can be concluded that the Cu2O-Ag is more active and selective for CO2RR to C2 products than the Cu2O catalyst, especially producing acetate.
After the CO2RR test, SEM and XRD were used to probe the change of morphologies and compositions of both catalysts. The SEM images show that the morphologies of Cu2O in both Cu2O-Ag and Cu2O catalyst are changed to irregular particles after the catalytic reaction (Figure S6). Small nanocubes agglomerate together to form larger and irregular shape particles under the negative potential conditions with a particle size of over 100 nm and each particle can be clearly distinguished from others. At the negative potentials, the Cu2O is easily reduced [55]. As shown in Figure S7, the new peaks at 43.2° and 50.3° corresponding to Cu (JCPDS 04-0836) in XRD patterns are showed, indicating that most of Cu2O is reduced to Cu after CO2RR. However, Ag peaks and Cu2O peaks are still existed in XRD patterns, which means that Ag and a small amount of Cu2O are preserved after CO2RR. EDS elemental mapping (Figure S8a–c) also confirms that Ag still exists and is homogeneously distributed on the GDL. The content of Ag investigated by inductively coupled plasma-atomic emission spectrometry (ICP-AES) decreases from 9.72% to 7.39% after CO2RR (Table S1). The reason for the decreased Ag content might be that it is flushed away by electrolytes. XPS results of Cu2O-Ag after CO2RR in Figure S9 show the characteristic metallic Ag peaks and mixed Cu0 + Cu+ peaks, confirming the existence of Ag and reduction of Cu2O to Cu, and the XPS spectrum of Cu2O after CO2RR also shows the mixed Cu0 + Cu+ peaks (Figure S10) [56,57,58].
In order to investigate the mechanism of higher FEs of C2 products, the following experiments are further studied. As shown in Figure 3, the introduction of Ag promotes producing C2 products. The FE of acetate increases as the mass ratios of Ag increase (Figure S11). When Ag is introduced into Cu2O, it acts as the CO active site, creating a high surface concentration of CO, which benefits CO dimerization and the synthesis of C2 products [59]. The produced CO can be transferred neighboring Cu, along with C-C coupling reaction to produce C2 products, which results in the highly selective CO dimerization. Moreover, a higher CO concentration also benefits from increasing the reaction rate of the C-C coupling step and FEs of C2 products. As shown in Figure 4a,b, the Cu2O-Ag catalyst produces more CO at high overpotentials than Cu2O, corresponding to the increases of acetate FE. At the potential of −1.18 V (vs. RHE), the FE of CO for Cu2O-Ag catalyst is 10.15%, corresponding to 15.02% acetate. In contrast, the Cu2O catalyst produce 6.86% FE of CO, corresponding to 5.18% FE of acetate. These experimental results show that the FE of CO is related to that of acetate and a high CO concentration may be helpful to the synthesis of C2 products, which is further revealed by the following DFT calculations.
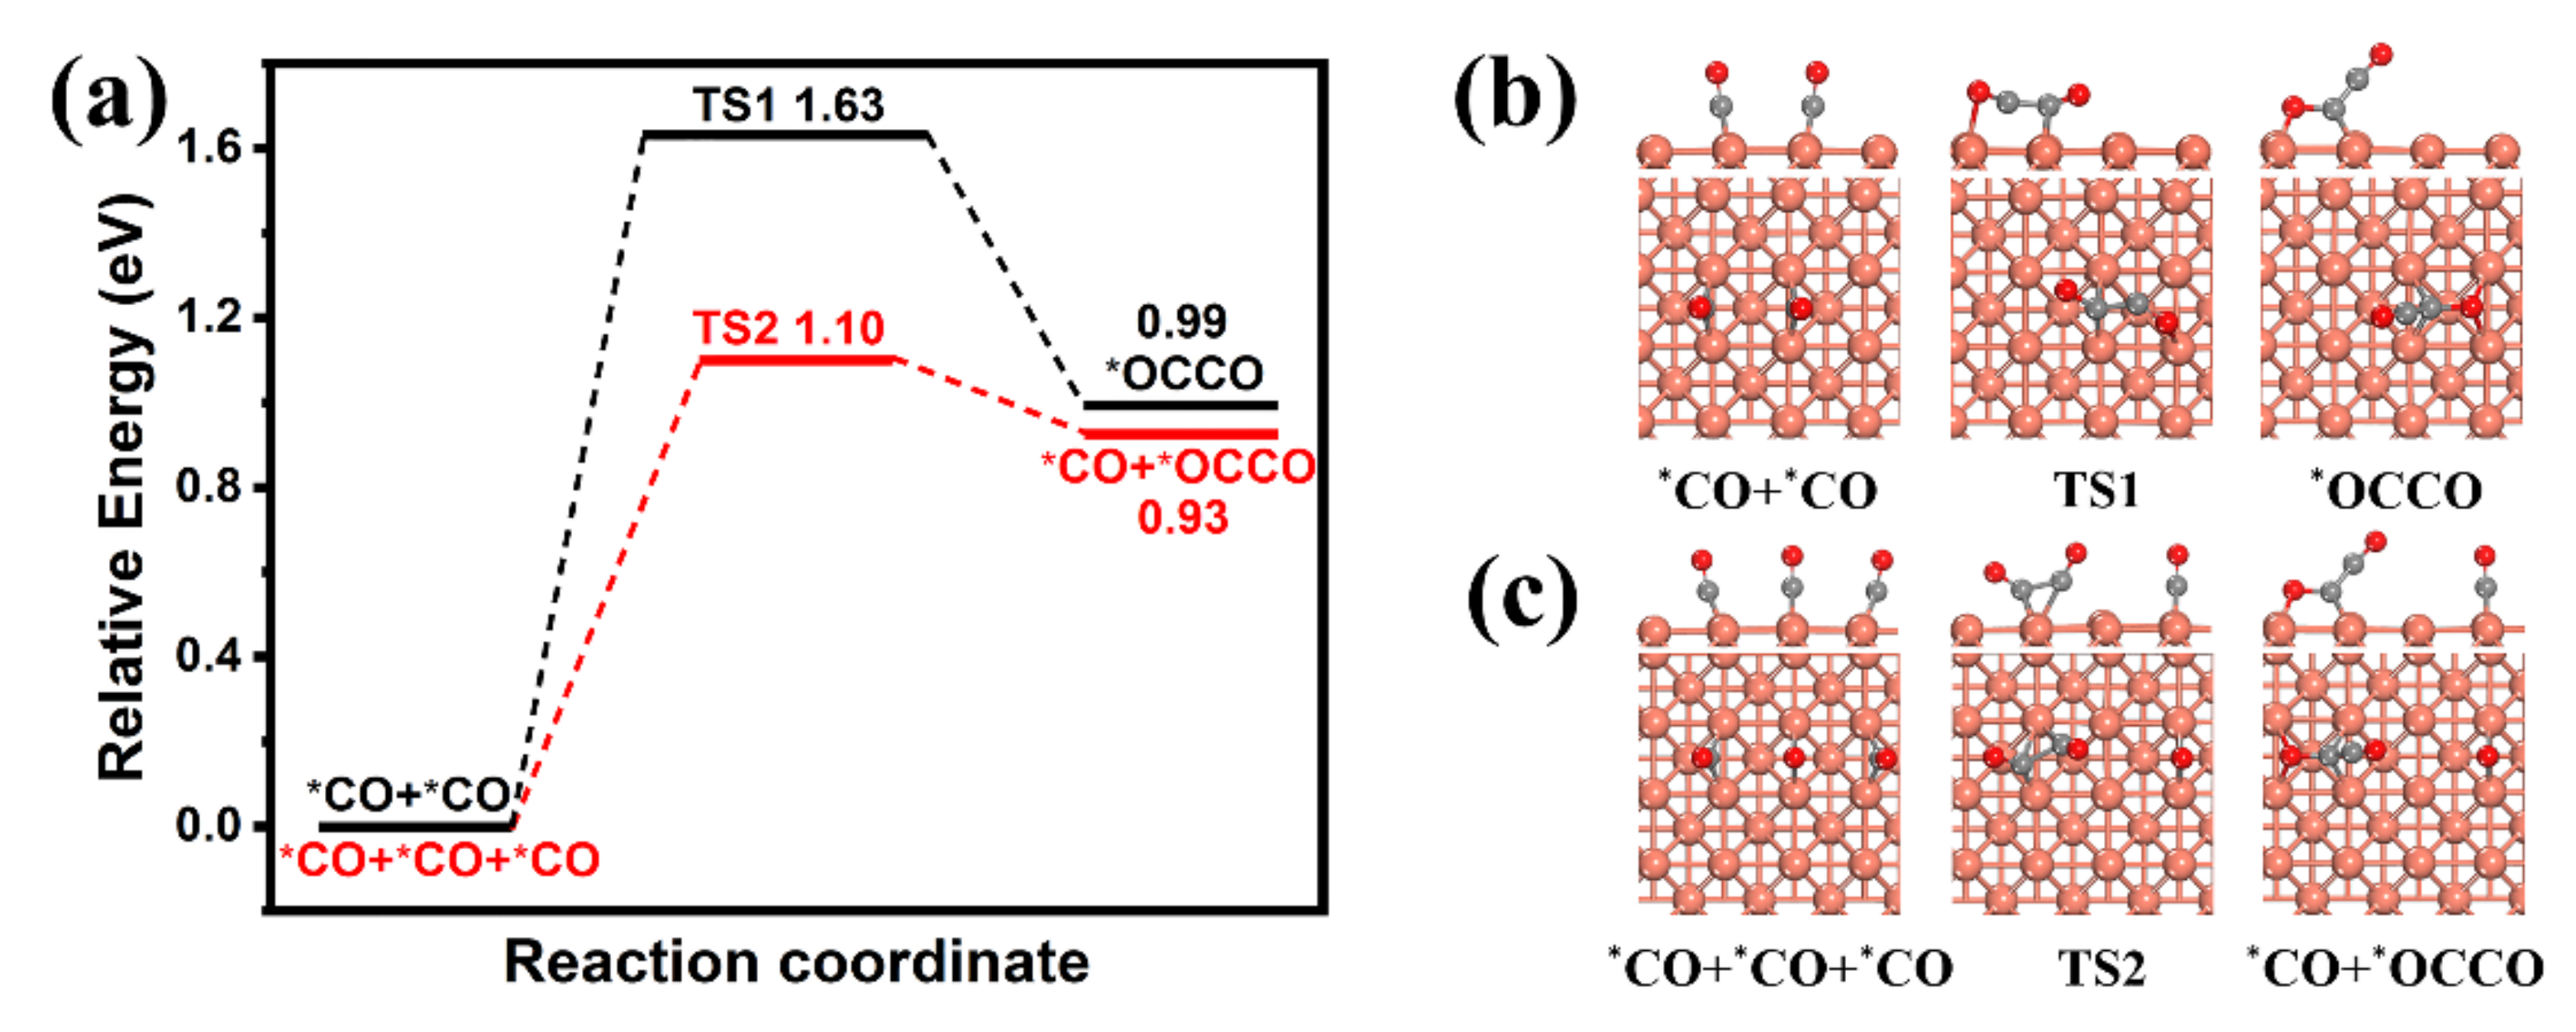
Cu2O and Ag are regarded as an important active site for converting CO2 to CO [34,60]. Therefore, in our study, not only Cu2O, but also Ag, can act as active sites producing CO from CO2. More CO can react with each other on Cu surface to form C-C bond and further C2 product. DFT calculations were applied to investigate the effect of CO coverage on the C-C coupling step over the Cu catalyst, which is the key fundamental step for the synthesis of C2 products. Considering the reduction of Cu2O to Cu during the CO2 reduction process, the Cu surface, with the (100) plane having the p(3 × 3) size, was constructed to model the catalyst [61]. The most stable adsorption site of CO on Cu(100) surface is firstly explored. As shown in Figure S12, CO is preferred to adsorb at the bridge site, which accords well with the previous study [62]. In order to model the effect of the high CO concentration on Cu producing and spilling from Ag, we compared the reaction barrier energies of the C-C coupling step at the CO coverage of 3/9 ML with 2/9 ML, which represents the high and low CO concentration on the catalyst surface, respectively. As shown in Figure 5, there is the lower C-C coupling barrier energy (1.10 eV) on 3/9 ML than that (1.63 eV) on 2/9 ML, which indicates that the high coverage of CO promotes the C-C coupling step and the C2 products. However, the barrier energy of C-C coupling reaction on the p(2 × 2) Cu2O(100) surface (3.03 eV) at the CO coverage of 1/2 ML is much higher than those on the Cu surface at different coverages (1.63 and 1.10 eV) (Figure S13), which suggests that Cu is more favorable for the C-C coupling reaction than Cu2O.

3. Materials and Methods

3.1. Materials

Copper sulfate (CuSO4·5H2O, 99%), sodium hydroxide (NaOH, 99%), ascorbic acid (C6H8O6, 99.7%) and silver nitrate (AgNO3, 99.95%) were purchased from Shanghai Sinopharm Chemical Reagent Co., Ltd. (Shanghai, China) and were used without purification.

3.2. Synthesis of Cu2O Nanocubes

The Cu2O nanocubes were synthesized by a previously reported method [63]. In a typical synthesis, 0.3 g CuSO4·5H2O was dissolved in 400 mL deionized water (DIW) and stirred for 30 min at 20 °C. Then, 1 mL 4.8 M NaOH solution was added slowly. After 5 min, 1 mL 1.2 M ascorbic acid was injected. The solution was further stirred for 30 min and the solution color was turned from blue to orange. The sample was washed with DIW and ethanol at least 3 times, respectively. Then, it was dried at 60 °C in a vacuum oven overnight.

3.3. Synthesis of Cu2O-Ag Nanocubes

The Cu2O nanocubes were synthesized following the above-mentioned steps. After the Cu2O nanocubes solution was prepared, a certain amount of silver nitrate solution (35 mL, 2 mmol) was injected. The solution color was turned from orange to black immediately and then stirred for 5 min. The sample was washed with DIW and ethanol at least 3 times. Then, it was dried at 60 °C in a vacuum oven overnight.

3.4. Material Characterizations

The prepared samples were characterized by the following techniques. X-ray diffraction (XRD) measurements were performed on a Philips X’Pert Pro Super diffractometer (Philips, Almelo, The Netherlands) using Cu Kα radiation (λ  =  1.54178 Å). The morphological structures were collected using a JEOL-2010-JSM-6700F scanning electron microscopy (SEM) (JEOL, Tokyo, Japan) and Hitachi H7650 transmission electron microscopy (TEM) (Hitachi, Tokyo, Japan). Energy dispersive X-ray spectroscopy (EDS) mapping and high–resolution transmission electron microscopy (HRTEM) images were acquired on Talos F200X (FEI, Hillsboro, OR, USA) and JEMARM 200F microscope (JEOL, Tokyo, Japan). Raman spectra were recorded on a Renishaw RM 3000 Micro-Raman system (Renishaw, Gloucestershire, UK) with a 532 nm excitation laser. X-ray photon spectroscopy (XPS) and Auger electron spectroscopy (AES) were performed at Thermo Scientific ESCALAB 250Xi X-ray Photoelectron Spectrometer (Thermo, Waltham, MA, USA).

3.5. Electrochemical Measurements

All the electrochemical measurements were performed in a three-electrode system on CHI 760E electrochemical workstation (Chenhua, Shanghai, China). The potentials were measured against an Ag/AgCl reference electrode and converted to the reversible hydrogen electrode (RHE) using the equation:
E (vs. RHE) = E (vs. Ag/AgCl) + 0.197 + (0.059 × pH)
A gas diffusion layer (GDL) was used as the catalyst support. We dispersed 5 mg catalyst powder in 1 mL methanol and 40 μL 5 wt% Nafion. The ink was sonicated for 30 min and dripped on the top of GDL (1 cm2). Then, the GDL was dried in a vacuum oven at 60 °C for 4 h. The GDL was weighed before and after catalyst deposition and loading contents were 1 mg cm−2.
The electrolysis investigations were carried out in a flow cell purchased from Gaossunion (Gaossunion, Wuhan, China). The cathode (GDL) and anode (nickel foam) compartments were separated by an anion exchange membrane. The CO2 gas chamber was located behind the cathode chamber and separated from the catholyte with a GDL. The CO2 flow rates were set at 20 mL min−1. Electrolytes were circulated through cathode and anode through the cell at 10 mL min−1 using peristaltic pump. 1 M KOH (25 mL) was used as electrolyte solutions. All electrolyte solutions were prepared with deionized water (18.2 MΩ cm).

3.6. Product Analysis

Gas and liquid products were quantified by gas chromatography (GC) (GC9560, Awa, Shanghai, China) and nuclear magnetic resonance (NMR) spectroscopy (AVANCE 400, Bruker, Fällanden, Switzerland), respectively. Faradaic efficiencies (FE) of gas and liquid products were calculated using the following equation:
FE (%) = eFn/Q × 100% = eFn/It × 100%
where e is the number of electrons transferred, F is the Faraday constant, n is the amount of product in moles, Q is the charge, I is the current and t is the electrolysis time.

3.7. Theoretical Calculation

Density functional theory (DFT) calculation, performed by the Vienna Ab-initio Simulation Package (VASP 5.3) code (University of Vienna, Vienna, Austria), was used in this study [64,65,66]. The electron exchange-correlation potential was conducted by the Perdew-Burke-Ernzerhof (PBE) functional of generalized gradient approximation (GGA) [67,68]. The kinetic energy cut-off energy was set to 520 eV for the plane-wave basis set and the DFT dispersion correction (DFT-D3) [69] method was used to treat the van der Waals interactions. Brillouin zone integration was sampled with the 9 × 9 × 9 and 3 × 3 × 1 Monkhorst-Pack mesh k-point for bulk and surface calculations, respectively. The convergence of geometric optimization was checked with the forces less than 0.01 eV·Å−1 and the energy difference less than 1 × 10⁻⁵ eV. The climbing-image nudged elastic band method (CI-NEB) [70,71] was employed to obtain the approximate transition statessaddle point, followed by the dimer method [72], which was carried out to further optimize the transition states with the convergence criteria of the force acting on the atom less than 0.05 eV Å. Meanwhile, the transition state was verified using the single imaginary frequency. In addition, a U-J value of 3 eV was used for DFT+U correction on the Cu2O(100) surface. The adsorption energy (Eads), activation energy (Ea) and reaction energy (ΔE) were obtained by the formulas:
Eads = ECO/substrateECOEsubstrate
Ea = ETSEIS
ΔE = EFSEIS
where Eads is the adsorption energy of *CO on the surface, ECO/substrate is the total energy of substrate and CO, ECO is the energy of CO, Esubstrate is the energy of substrate; Ea and ΔE are the barrier and the reaction energy, respectively; EIS, ETS and EFS are the energy of initial state, transition state and final state, respectively.

4. Conclusions

In summary, we prepared a Cu2O-Ag tandem catalyst for CO2 electrochemical reduction reaction through a facile synthetic method. The tandem catalyst made up of Cu2O and Ag nanoparticles improves the selectivity and activity of CO2 reduction toward C2 products compared to Cu2O catalyst. At the potential of −1.18 V (vs. RHE), the Cu2O-Ag catalyst shows a maximum C2 products FE of 72.85% with a partial current density of −243.32 mA·cm−2. It has an FE of 15.02% towards acetate, which is three times higher than that of Cu2O. Based on further experiments and DFT calculation, we found that increased CO concentration, produced on the Ag sites, plays an important role towards the production of acetate. The study shows a simple method to improve C2 production and provides deeper insights into designing the catalysts for CO2 electrochemical reduction.

Supplementary Materials

The following data are available online, Figure S1. (a) TEM image and (b) size distribution of Cu2O-Ag nanocubes; (c) TEM image and (d) size distribution of Cu2O nanocubes. Figure S2. (a) SEM image of Cu2O nanocubes; (b) TEM image of Cu2O nanocubes; (c) HRTEM image of Cu2O nanocubes; (d) XRD pattern of Cu2O nanocubes. Figure S3. (a–c) SEM-EDS elemental mapping of Cu2O-Ag nanocubes, showing the distribution of elemental (b) Cu and (c) Ag within the particles. Figure S4. The SEM images of the Cu2O-Ag during CO2RR. (a) 0 min, (b) 5 min, (c) 10 min, (d) 15 min, (e) 20 min, (f) 25 min, (g) 30 min, (h) 35 min, (i) 40 min. Scale bar = 500 nm. Figure S5. The XRD pattrens of the Cu2O-Ag during CO2RR. Figure S6. SEM images of (a) Cu2O-Ag nanocubes and (b) Cu2O nanocubes after CO2RR. Figure S7. XRD patterns of (a) Cu2O-Ag nanocubes and (b) Cu2O nanocube after CO2RR. Figure S8. (a–c) SEM-EDS elemental mapping of Cu2O-Ag nanocubes of elemental (b) Cu and (c) Ag after CO2RR. Table S1. Cu and Ag contents of Cu2O-Ag nanocubes before and after CO2RR. Figure S9. XPS spectra for (a) Cu and (b) Ag of Cu2O-Ag nanocubes after CO2RR. Figure S10. XPS spectra for Cu of Cu2O nanocubes after CO2RR. Figure S11. Faradaic efficiency of acetate of the different mass ratios of Ag in the Cu2O-Ag nanocubes. Figure S12. Adsorption energy and corresponding configuration of CO at three type sites on Cu(100) surface. Figure S13. (a) Reaction energy barrier diagram of the C-C coupling step on the Cu2O(100) surface with the (b)corresponding configurations of two *CO forming an *OCCO. Light red, copper; grey, carbon; red, oxygen; TS, transition state.

Author Contributions

Experimental design and implementation, D.N. and G.W.; DFT calculation design and implementation, C.W. and X.H.; data analysis, D.N., Z.L. and Y.F.; characterization, D.N., B.L. and D.S.; writing—original draft preparation, D.N. and C.W.; writing—reviewing and editing, D.N. and X.H.; supervision G.W. and H.P.; All authors contributed to discussion of the results and manuscript preparation. All authors have read and agreed to the published version of the manuscript.

Funding

The research is supported by the Natural Science Fund of China (21771169), the National Key Research and Development Program of China (2017YFA0206703), Anhui Provincial Natural Science Foundation (BJ2060190077), the Fundamental Research Funds for the Central Universities (WK2060000015), and the Collaborative Innovation program of Hefei Science Center, CAS.

Institutional Review Board Statement

Not applicable.

Informed Consent Statement

Not applicable.

Data Availability Statement

The data presented in this study are available in the article and supplementary material.

Acknowledgments

All authors are very thankful to the support from Natural Science Fund of China and other funds. All authors also thank the Supercomputing Center of University of Science and Technology of China.

Conflicts of Interest

The authors declare no conflict of interest. The funders had no role in the design of the study; in the collection, analyses, or interpretation of data; in the writing of the manuscript, or in the decision to publish the results.

Sample Availability

Samples of the compound are available from the authors.

References

  1. Baker, H.S.; Millar, R.J.; Karoly, D.J.; Beyerle, U.; Guillod, B.P.; Mitchell, D.; Shiogama, H.; Sparrow, S.; Woollings, T.; Allen, M.R. Higher CO2 concentrations increase extreme event risk in a 1.5 °C world. Nat. Clim. Change 2018, 8, 604–608. [Google Scholar] [CrossRef] [Green Version]
  2. Rogelj, J.; Huppmann, D.; Krey, V.; Riahi, K.; Clarke, L.; Gidden, M.; Nicholls, Z.; Meinshausen, M. A new scenario logic for the Paris Agreement long-term temperature goal. Nature 2019, 573, 357–363. [Google Scholar] [CrossRef] [PubMed]
  3. Shakun, J.D.; Clark, P.U.; He, F.; Marcott, S.A.; Mix, A.C.; Liu, Z.; Otto-Bliesner, B.; Schmittner, A.; Bard, E. Global warming preceded by increasing carbon dioxide concentrations during the last deglaciation. Nature 2012, 484, 49–54. [Google Scholar] [CrossRef] [PubMed]
  4. Montzka, S.A.; Dlugokencky, E.J.; Butler, J.H. Non-CO2 greenhouse gases and climate change. Nature 2011, 476, 43–50. [Google Scholar] [CrossRef] [PubMed]
  5. Rogelj, J.; McCollum, D.L.; O’Neill, B.C.; Riahi, K. 2020 emissions levels required to limit warming to below 2 °C. Nat. Clim. Change 2012, 3, 405–412. [Google Scholar] [CrossRef]
  6. Tavoni, M.; Kriegler, E.; Riahi, K.; van Vuuren, D.P.; Aboumahboub, T.; Bowen, A.; Calvin, K.; Campiglio, E.; Kober, T.; Jewell, J.; et al. Post-2020 climate agreements in the major economies assessed in the light of global models. Nat. Clim. Change 2014, 5, 119–126. [Google Scholar] [CrossRef]
  7. Bushuyev, O.S.; De Luna, P.; Dinh, C.T.; Tao, L.; Saur, G.; van de Lagemaat, J.; Kelley, S.O.; Sargent, E.H. What should we make with CO2 and how can we make it? Joule 2018, 2, 825–832. [Google Scholar] [CrossRef] [Green Version]
  8. Olah, G.A.; Prakash, G.K.; Goeppert, A. Anthropogenic chemical carbon cycle for a sustainable future. J. Am. Chem. Soc. 2011, 133, 12881–12898. [Google Scholar] [CrossRef]
  9. Barnhart, C.J.; Dale, M.; Brandt, A.R.; Benson, S.M. The energetic implications of curtailing versus storing solar- and wind-generated electricity. Energy Environ. Sci. 2013, 6, 2804–2810. [Google Scholar] [CrossRef] [Green Version]
  10. Brouwer, A.S.; van den Broek, M.; Seebregts, A.; Faaij, A. Impacts of large-scale Intermittent Renewable Energy Sources on electricity systems, and how these can be modeled. Renew. Sustain. Energy Rev. 2014, 33, 443–466. [Google Scholar] [CrossRef]
  11. Chu, S.; Cui, Y.; Liu, N. The path towards sustainable energy. Nat. Mater. 2016, 16, 16–22. [Google Scholar] [CrossRef]
  12. Kondratenko, E.V.; Mul, G.; Baltrusaitis, J.; Larrazábal, G.O.; Pérez-Ramírez, J. Status and perspectives of CO2 conversion into fuels and chemicals by catalytic, photocatalytic and electrocatalytic processes. Energy Environ. Sci. 2013, 6, 3112–3135. [Google Scholar] [CrossRef] [Green Version]
  13. Birdja, Y.Y.; Pérez-Gallent, E.; Figueiredo, M.C.; Göttle, A.J.; Calle-Vallejo, F.; Koper, M.T.M. Advances and challenges in understanding the electrocatalytic conversion of carbon dioxide to fuels. Nat. Energy 2019, 4, 732–745. [Google Scholar] [CrossRef]
  14. Jones, J.-P.; Prakash, G.K.S.; Olah, G.A. Electrochemical CO2 reduction: Recent advances and current trends. Isr. J. Chem. 2014, 54, 1451–1466. [Google Scholar] [CrossRef]
  15. Kibria, M.G.; Edwards, J.P.; Gabardo, C.M.; Dinh, C.T.; Seifitokaldani, A.; Sinton, D.; Sargent, E.H. Electrochemical CO2 reduction into chemical feedstocks: From mechanistic electrocatalysis models to system design. Adv. Mater. 2019, 31, 1807166. [Google Scholar] [CrossRef]
  16. Gao, D.; Arán-Ais, R.M.; Jeon, H.S.; Roldan Cuenya, B. Rational catalyst and electrolyte design for CO2 electroreduction towards multicarbon products. Nat. Catal. 2019, 2, 198–210. [Google Scholar] [CrossRef]
  17. Nitopi, S.; Bertheussen, E.; Scott, S.B.; Liu, X.; Engstfeld, A.K.; Horch, S.; Seger, B.; Stephens, I.E.L.; Chan, K.; Hahn, C.; et al. Progress and perspectives of electrochemical CO2 reduction on copper in aqueous electrolyte. Chem. Rev. 2019, 119, 7610–7672. [Google Scholar] [CrossRef] [Green Version]
  18. Qiao, J.; Liu, Y.; Hong, F.; Zhang, J. A review of catalysts for the electroreduction of carbon dioxide to produce low-carbon fuels. Chem. Soc. Rev. 2014, 43, 631–675. [Google Scholar] [CrossRef]
  19. Raciti, D.; Wang, C. Recent advances in CO2 reduction electrocatalysis on copper. ACS Energy Lett. 2018, 3, 1545–1556. [Google Scholar] [CrossRef]
  20. De Luna, P.; Quintero-Bermudez, R.; Dinh, C.-T.; Ross, M.B.; Bushuyev, O.S.; Todorović, P.; Regier, T.; Kelley, S.O.; Yang, P.; Sargent, E.H. Catalyst electro-redeposition controls morphology and oxidation state for selective carbon dioxide reduction. Nat. Catal. 2018, 1, 103–110. [Google Scholar] [CrossRef] [Green Version]
  21. Kim, J.; Choi, W.; Park, J.W.; Kim, C.; Kim, M.; Song, H. Branched copper oxide nanoparticles induce highly selective ethylene production by electrochemical carbon dioxide reduction. J. Am. Chem. Soc. 2019, 141, 6986–6994. [Google Scholar] [CrossRef]
  22. Wang, Y.; Shen, H.; Livi, K.J.T.; Raciti, D.; Zong, H.; Gregg, J.; Onadeko, M.; Wan, Y.; Watson, A.; Wang, C. Copper nanocubes for CO2 reduction in gas diffusion electrodes. Nano Lett. 2019, 19, 8461–8468. [Google Scholar] [CrossRef]
  23. Chen, X.; Henckel, D.A.; Nwabara, U.O.; Li, Y.; Frenkel, A.I.; Fister, T.T.; Kenis, P.J.A.; Gewirth, A.A. Controlling speciation during CO2 reduction on Cu-alloy electrodes. ACS Catal. 2019, 10, 672–682. [Google Scholar] [CrossRef]
  24. Ma, S.; Sadakiyo, M.; Heima, M.; Luo, R.; Haasch, R.T.; Gold, J.I.; Yamauchi, M.; Kenis, P.J. Electroreduction of carbon dioxide to hydrocarbons using bimetallic Cu-Pd catalysts with different mixing patterns. J. Am. Chem. Soc. 2017, 139, 47–50. [Google Scholar] [CrossRef]
  25. Ren, D.; Ang, B.S.-H.; Yeo, B.S. Tuning the selectivity of carbon dioxide electroreduction toward ethanol on oxide-derived CuxZn catalysts. ACS. Catal. 2016, 6, 8239–8247. [Google Scholar] [CrossRef]
  26. Zhou, Y.; Che, F.; Liu, M.; Zou, C.; Liang, Z.; De Luna, P.; Yuan, H.; Li, J.; Wang, Z.; Xie, H.; et al. Dopant-induced electron localization drives CO2 reduction to C2 hydrocarbons. Nat. Chem. 2018, 10, 974–980. [Google Scholar] [CrossRef]
  27. Chou, T.C.; Chang, C.C.; Yu, H.L.; Yu, W.Y.; Dong, C.L.; Velasco-Velez, J.J.; Chuang, C.H.; Chen, L.C.; Lee, J.F.; Chen, J.M.; et al. Controlling the oxidation state of the Cu electrode and reaction intermediates for electrochemical CO2 reduction to ethylene. J. Am. Chem. Soc. 2020, 142, 2857–2867. [Google Scholar] [CrossRef]
  28. Ren, D.; Deng, Y.; Handoko, A.D.; Chen, C.S.; Malkhandi, S.; Yeo, B.S. Selective electrochemical reduction of carbon dioxide to ethylene and ethanol on copper(I) oxide catalysts. ACS. Catal. 2015, 5, 2814–2821. [Google Scholar] [CrossRef]
  29. Yang, P.P.; Zhang, X.L.; Gao, F.Y.; Zheng, Y.R.; Niu, Z.Z.; Yu, X.; Liu, R.; Wu, Z.Z.; Qin, S.; Chi, L.P.; et al. Protecting copper oxidation state via intermediate confinement for selective CO2 electroreduction to C2+ fuels. J. Am. Chem. Soc. 2020, 142, 6400–6408. [Google Scholar] [CrossRef] [PubMed]
  30. Li, C.W.; Kanan, M.W. CO2 reduction at low overpotential on Cu electrodes resulting from the reduction of thick Cu2O films. J. Am. Chem. Soc. 2012, 134, 7231–7234. [Google Scholar] [CrossRef] [PubMed]
  31. Kas, R.; Kortlever, R.; Milbrat, A.; Koper, M.T.; Mul, G.; Baltrusaitis, J. Electrochemical CO2 reduction on Cu2O-derived copper nanoparticles: Controlling the catalytic selectivity of hydrocarbons. Phys. Chem. Chem. Phys. 2014, 16, 12194–12201. [Google Scholar] [CrossRef]
  32. Li, C.W.; Ciston, J.; Kanan, M.W. Electroreduction of carbon monoxide to liquid fuel on oxide-derived nanocrystalline copper. Nature 2014, 508, 504–507. [Google Scholar] [CrossRef]
  33. Mistry, H.; Varela, A.S.; Bonifacio, C.S.; Zegkinoglou, I.; Sinev, I.; Choi, Y.W.; Kisslinger, K.; Stach, E.A.; Yang, J.C.; Strasser, P.; et al. Highly selective plasma-activated copper catalysts for carbon dioxide reduction to ethylene. Nat. Commun. 2016, 7, 12123. [Google Scholar] [CrossRef]
  34. Xiao, H.; Goddard, W.A., III; Cheng, T.; Liu, Y. Cu metal embedded in oxidized matrix catalyst to promote CO2 activation and CO dimerization for electrochemical reduction of CO2. Proc. Natl. Acad. Sci. USA 2017, 114, 6685–6688. [Google Scholar] [CrossRef] [Green Version]
  35. Li, J.; Wang, Z.; McCallum, C.; Xu, Y.; Li, F.; Wang, Y.; Gabardo, C.M.; Dinh, C.-T.; Zhuang, T.-T.; Wang, L.; et al. Constraining CO coverage on copper promotes high-efficiency ethylene electroproduction. Nat. Catal. 2019, 2, 1124–1131. [Google Scholar] [CrossRef]
  36. Morales-Guio, C.G.; Cave, E.R.; Nitopi, S.A.; Feaster, J.T.; Wang, L.; Kuhl, K.P.; Jackson, A.; Johnson, N.C.; Abram, D.N.; Hatsukade, T.; et al. Improved CO2 reduction activity towards C2+ alcohols on a tandem gold on copper electrocatalyst. Nat. Catal. 2018, 1, 764–771. [Google Scholar] [CrossRef]
  37. Wang, X.; de Araujo, J.F.; Ju, W.; Bagger, A.; Schmies, H.; Kuhl, S.; Rossmeisl, J.; Strasser, P. Mechanistic reaction pathways of enhanced ethylene yields during electroreduction of CO2-CO co-feeds on Cu and Cu-tandem electrocatalysts. Nat. Nanotechnol. 2019, 14, 1063–1070. [Google Scholar] [CrossRef]
  38. Ham, Y.S.; Choe, S.; Kim, M.J.; Lim, T.; Kim, S.-K.; Kim, J.J. Electrodeposited Ag catalysts for the electrochemical reduction of CO2 to CO. Appl. Catal. B Environ. 2017, 208, 35–43. [Google Scholar] [CrossRef]
  39. Sun, K.; Wu, L.; Qin, W.; Zhou, J.; Hu, Y.; Jiang, Z.; Shen, B.; Wang, Z. Enhanced electrochemical reduction of CO2 to CO on Ag electrocatalysts with increased unoccupied density of states. J. Mater. Chem. A 2016, 4, 12616–12623. [Google Scholar] [CrossRef]
  40. Mahyoub, S.A.; Qaraah, F.A.; Chen, C.; Zhang, F.; Yan, S.; Cheng, Z. An overview on the recent developments of Ag-based electrodes in the electrochemical reduction of CO2 to CO. Sustain. Energy Fuels 2020, 4, 50–67. [Google Scholar] [CrossRef]
  41. Martić, N.; Reller, C.; Macauley, C.; Löffler, M.; Reichert, A.M.; Reichbauer, T.; Vetter, K.-M.; Schmid, B.; McLaughlin, D.; Leidinger, P.; et al. Ag2Cu2O3—A catalyst template material for selective electroreduction of CO to C2+ products. Energy Environ. Sci. 2020, 13, 2993–3006. [Google Scholar] [CrossRef]
  42. Wang, Y.; Wang, D.; Dares, C.J.; Marquard, S.L.; Sheridan, M.V.; Meyer, T.J. CO2 reduction to acetate in mixtures of ultrasmall (Cu)n,(Ag)m bimetallic nanoparticles. Proc. Natl. Acad. Sci. USA 2018, 115, 278–283. [Google Scholar] [CrossRef] [Green Version]
  43. Chen, C.; Li, Y.; Yu, S.; Louisia, S.; Jin, J.; Li, M.; Ross, M.B.; Yang, P. Cu-Ag tandem catalysts for high-rate CO2 electrolysis toward multicarbons. Joule 2020, 4, 1688–1699. [Google Scholar] [CrossRef]
  44. Lee, S.; Park, G.; Lee, J. Importance of Ag–Cu biphasic boundaries for selective electrochemical reduction of CO2 to ethanol. ACS. Catal. 2017, 7, 8594–8604. [Google Scholar] [CrossRef]
  45. Hoang, T.T.H.; Verma, S.; Ma, S.; Fister, T.T.; Timoshenko, J.; Frenkel, A.I.; Kenis, P.J.A.; Gewirth, A.A. Nanoporous copper-silver alloys by additive-controlled electrodeposition for the selective electroreduction of CO2 to ethylene and ethanol. J. Am. Chem. Soc. 2018, 140, 5791–5797. [Google Scholar] [CrossRef]
  46. Ghodselahi, T.; Vesaghi, M.A.; Shafiekhani, A.; Baghizadeh, A.; Lameii, M. XPS study of the Cu@Cu2O core-shell nanoparticles. Appl. Surf. Sci. 2008, 255, 2730–2734. [Google Scholar] [CrossRef]
  47. Jung, H.; Lee, S.Y.; Lee, C.W.; Cho, M.K.; Won, D.H.; Kim, C.; Oh, H.S.; Min, B.K.; Hwang, Y.J. Electrochemical fragmentation of Cu2O nanoparticles enhancing selective C-C coupling from CO2 reduction reaction. J. Am. Chem. Soc. 2019, 141, 4624–4633. [Google Scholar] [CrossRef]
  48. Sun, D.; Li, P.; Yang, B.; Xu, Y.; Huang, J.; Li, Q. Monodisperse AgPd alloy nanoparticles as a highly active catalyst towards the methanolysis of ammonia borane for hydrogen generation. RSC. Adv. 2016, 6, 105940–105947. [Google Scholar] [CrossRef] [Green Version]
  49. Yu, P.Y.; Shen, Y.R. Resonance Raman studies in Cu2O. I. the phonon-assisted 1s yellow excitonic absorption edge. Phys. Rev. B 1975, 12, 1377–1394. [Google Scholar] [CrossRef]
  50. Ren, S.; Joulie, D.; Salvatore, S.; Torbensen, K.; Wang, M.; Robert, M.; Beilinguette, C.P. Molecular electrocatalysts can mediate fast, selective CO2 reduction in a flow cell. Science 2019, 365, 367–369. [Google Scholar] [CrossRef]
  51. Jouny, M.; Luc, W.; Jiao, F. High-rate electroreduction of carbon monoxide to multi-carbon products. Nat. Catal. 2018, 1, 748–755. [Google Scholar] [CrossRef]
  52. Verma, S.; Hamasaki, Y.; Kim, C.; Huang, W.; Lu, S.; Jhong, H.-R.M.; Gewirth, A.A.; Fujigaya, T.; Nakashima, N.; Kenis, P.J.A. Insights into the low overpotential electroreduction of CO2 to CO on a supported gold catalyst in an alkaline flow electrolyzer. ACS Energy Lett. 2017, 3, 193–198. [Google Scholar] [CrossRef]
  53. Gao, Y.; Wu, Q.; Liang, X.; Wang, Z.; Zheng, Z.; Wang, P.; Liu, Y.; Dai, Y.; Whangbo, M.H.; Huang, B. Cu2O nanoparticles with both {100} and {111} facets for enhancing the selectivity and activity of CO2 electroreduction to ethylene. Adv. Sci. 2020, 7, 1902820. [Google Scholar] [CrossRef] [PubMed] [Green Version]
  54. Hori, Y.; Takahashi, I.; Koga, O.; Hoshi, N. Electrochemical reduction of carbon dioxide at various series of copper single crystal electrodes. J. Mol. Catal. A Chem. 2003, 199, 39–47. [Google Scholar] [CrossRef]
  55. Moller, T.; Scholten, F.; Thanh, T.N.; Sinev, I.; Timoshenko, J.; Wang, X.; Jovanov, Z.; Gliech, M.; Roldan Cuenya, B.; Varela, A.S.; et al. Electrocatalytic CO2 reduction on CuOx nanocubes: Tracking the evolution of chemical state, geometric structure, and catalytic selectivity using operando spectroscopy. Angew. Chem. Int. Ed. Engl. 2020, 59, 17974–17983. [Google Scholar] [CrossRef]
  56. Biesinger, M.C.; Lau, L.W.M.; Gerson, A.R.; Smart, R.S.C. Resolving surface chemical states in XPS analysis of first row transition metals, oxides and hydroxides: Sc, Ti, V., Cu and Zn. Appl. Surf. Sci. 2010, 257, 887–898. [Google Scholar] [CrossRef]
  57. Zeng, J.; Castellino, M.; Bejtka, K.; Sacco, A.; Di Martino, G.; Farkhondehfal, M.A.; Chiodoni, A.; Hernández, S.; Pirri, C.F. Facile synthesis of cubic cuprous oxide for electrochemical reduction of carbon dioxide. J. Mater. Sci. 2021, 56, 1255–1271. [Google Scholar] [CrossRef]
  58. Biesinger, M.C. Advanced analysis of copper X-ray photoelectron spectra. Surf. Interface Anal. 2017, 49, 1325–1334. [Google Scholar] [CrossRef]
  59. Peterson, A.A.; Nørskov, J.K. Activity descriptors for CO2 electroreduction to methane on transition-metal catalysts. J. Phys. Chem. Lett. 2012, 3, 251–258. [Google Scholar] [CrossRef]
  60. Singh, M.R.; Goodpaster, J.D.; Weber, A.Z.; Head-Gordon, M.; Bell, A.T. Mechanistic insights into electrochemical reduction of CO2 over Ag using density functional theory and transport models. Proc. Natl. Acad. Sci. USA 2017, 114, E8812–E8821. [Google Scholar] [CrossRef] [Green Version]
  61. Jedidi, A.; Rasul, S.; Masih, D.; Cavallo, L.; Takanabe, K. Generation of Cu–In alloy surfaces from CuInO2 as selective catalytic sites for CO2 electroreduction. J. Mater. Chem. A 2015, 3, 19085–19092. [Google Scholar] [CrossRef] [Green Version]
  62. Zhong, D.; Zhao, Z.; Zhao, Q.; Cheng, D.; Liu, B.; Zhang, G.; Deng, W.; Dong, H.; Zhang, L.; Li, J.; et al. Coupling of Cu(100) and (110) facets promotes carbon dioxide conversion to hydrocarbons and alcohols. Angew. Chem. Int. Ed. Engl. 2020, 60, 4879–4885. [Google Scholar] [CrossRef]
  63. Chang, I.C.; Chen, P.-C.; Tsai, M.-C.; Chen, T.-T.; Yang, M.-H.; Chiu, H.-T.; Lee, C.-Y. Large-scale synthesis of uniform Cu2O nanocubes with tunable sizes by in-situ nucleation. CrystEngComm 2013, 15, 2363–2366. [Google Scholar] [CrossRef]
  64. Kresse, G.; Hafner, J. Ab Initio molecular dynamics for liquid metals. Phys. Rev. B Condens. Matter Mater. Phys. 1993, 47, 558–561. [Google Scholar] [CrossRef]
  65. Kresse, G.; Furthmuller, J. Efficiency of ab-initio total energy calculations for metals and semiconductors using a plane-wave basis set. Comput. Mater. Sci. 1996, 6, 15–50. [Google Scholar] [CrossRef]
  66. Perdew, J.P.; Burke, K.; Ernzerhof, M. Generalized gradient approximation made simple. Phys. Rev. Lett. 1996, 77, 3865–3868. [Google Scholar] [CrossRef] [Green Version]
  67. Kresse, G.; Joubert, D. From ultrasoft pseudopotentials to the projector augmented-wave method. Phys. Rev. B Condens. Matter Mater. Phys. 1999, 59, 1758–1775. [Google Scholar] [CrossRef]
  68. Blochl, P.E. Projector augmented-wave method. Phys. Rev. B Condens. Matter Mater. Phys. 1994, 50, 17953–17979. [Google Scholar] [CrossRef] [Green Version]
  69. Grimme, S.; Antony, J.; Ehrlich, S.; Krieg, H. A consistent and accurate ab initio parametrization of density functional dispersion correction (DFT-D) for the 94 elements H-Pu. J. Chem. Phys. 2010, 132, 154104. [Google Scholar] [CrossRef] [Green Version]
  70. Mills, G.; Jonsson, H.; Schenter, G.K. Reversible work transition state theory: Application to dissociative adsorption of hydrogen. Surf. Sci. 1995, 324, 305–337. [Google Scholar] [CrossRef] [Green Version]
  71. Henkelman, G.; Uberuaga, B.P.; Jónsson, H. A climbing image nudged elastic band method for finding saddle points and minimum energy paths. J. Chem. Phys. 2000, 113, 9901–9904. [Google Scholar] [CrossRef] [Green Version]
  72. Henkelman, G.; Jónsson, H. A dimer method for finding saddle points on high dimensional potential surfaces using only first derivatives. J. Chem. Phys. 1999, 111, 7010–7022. [Google Scholar] [CrossRef]
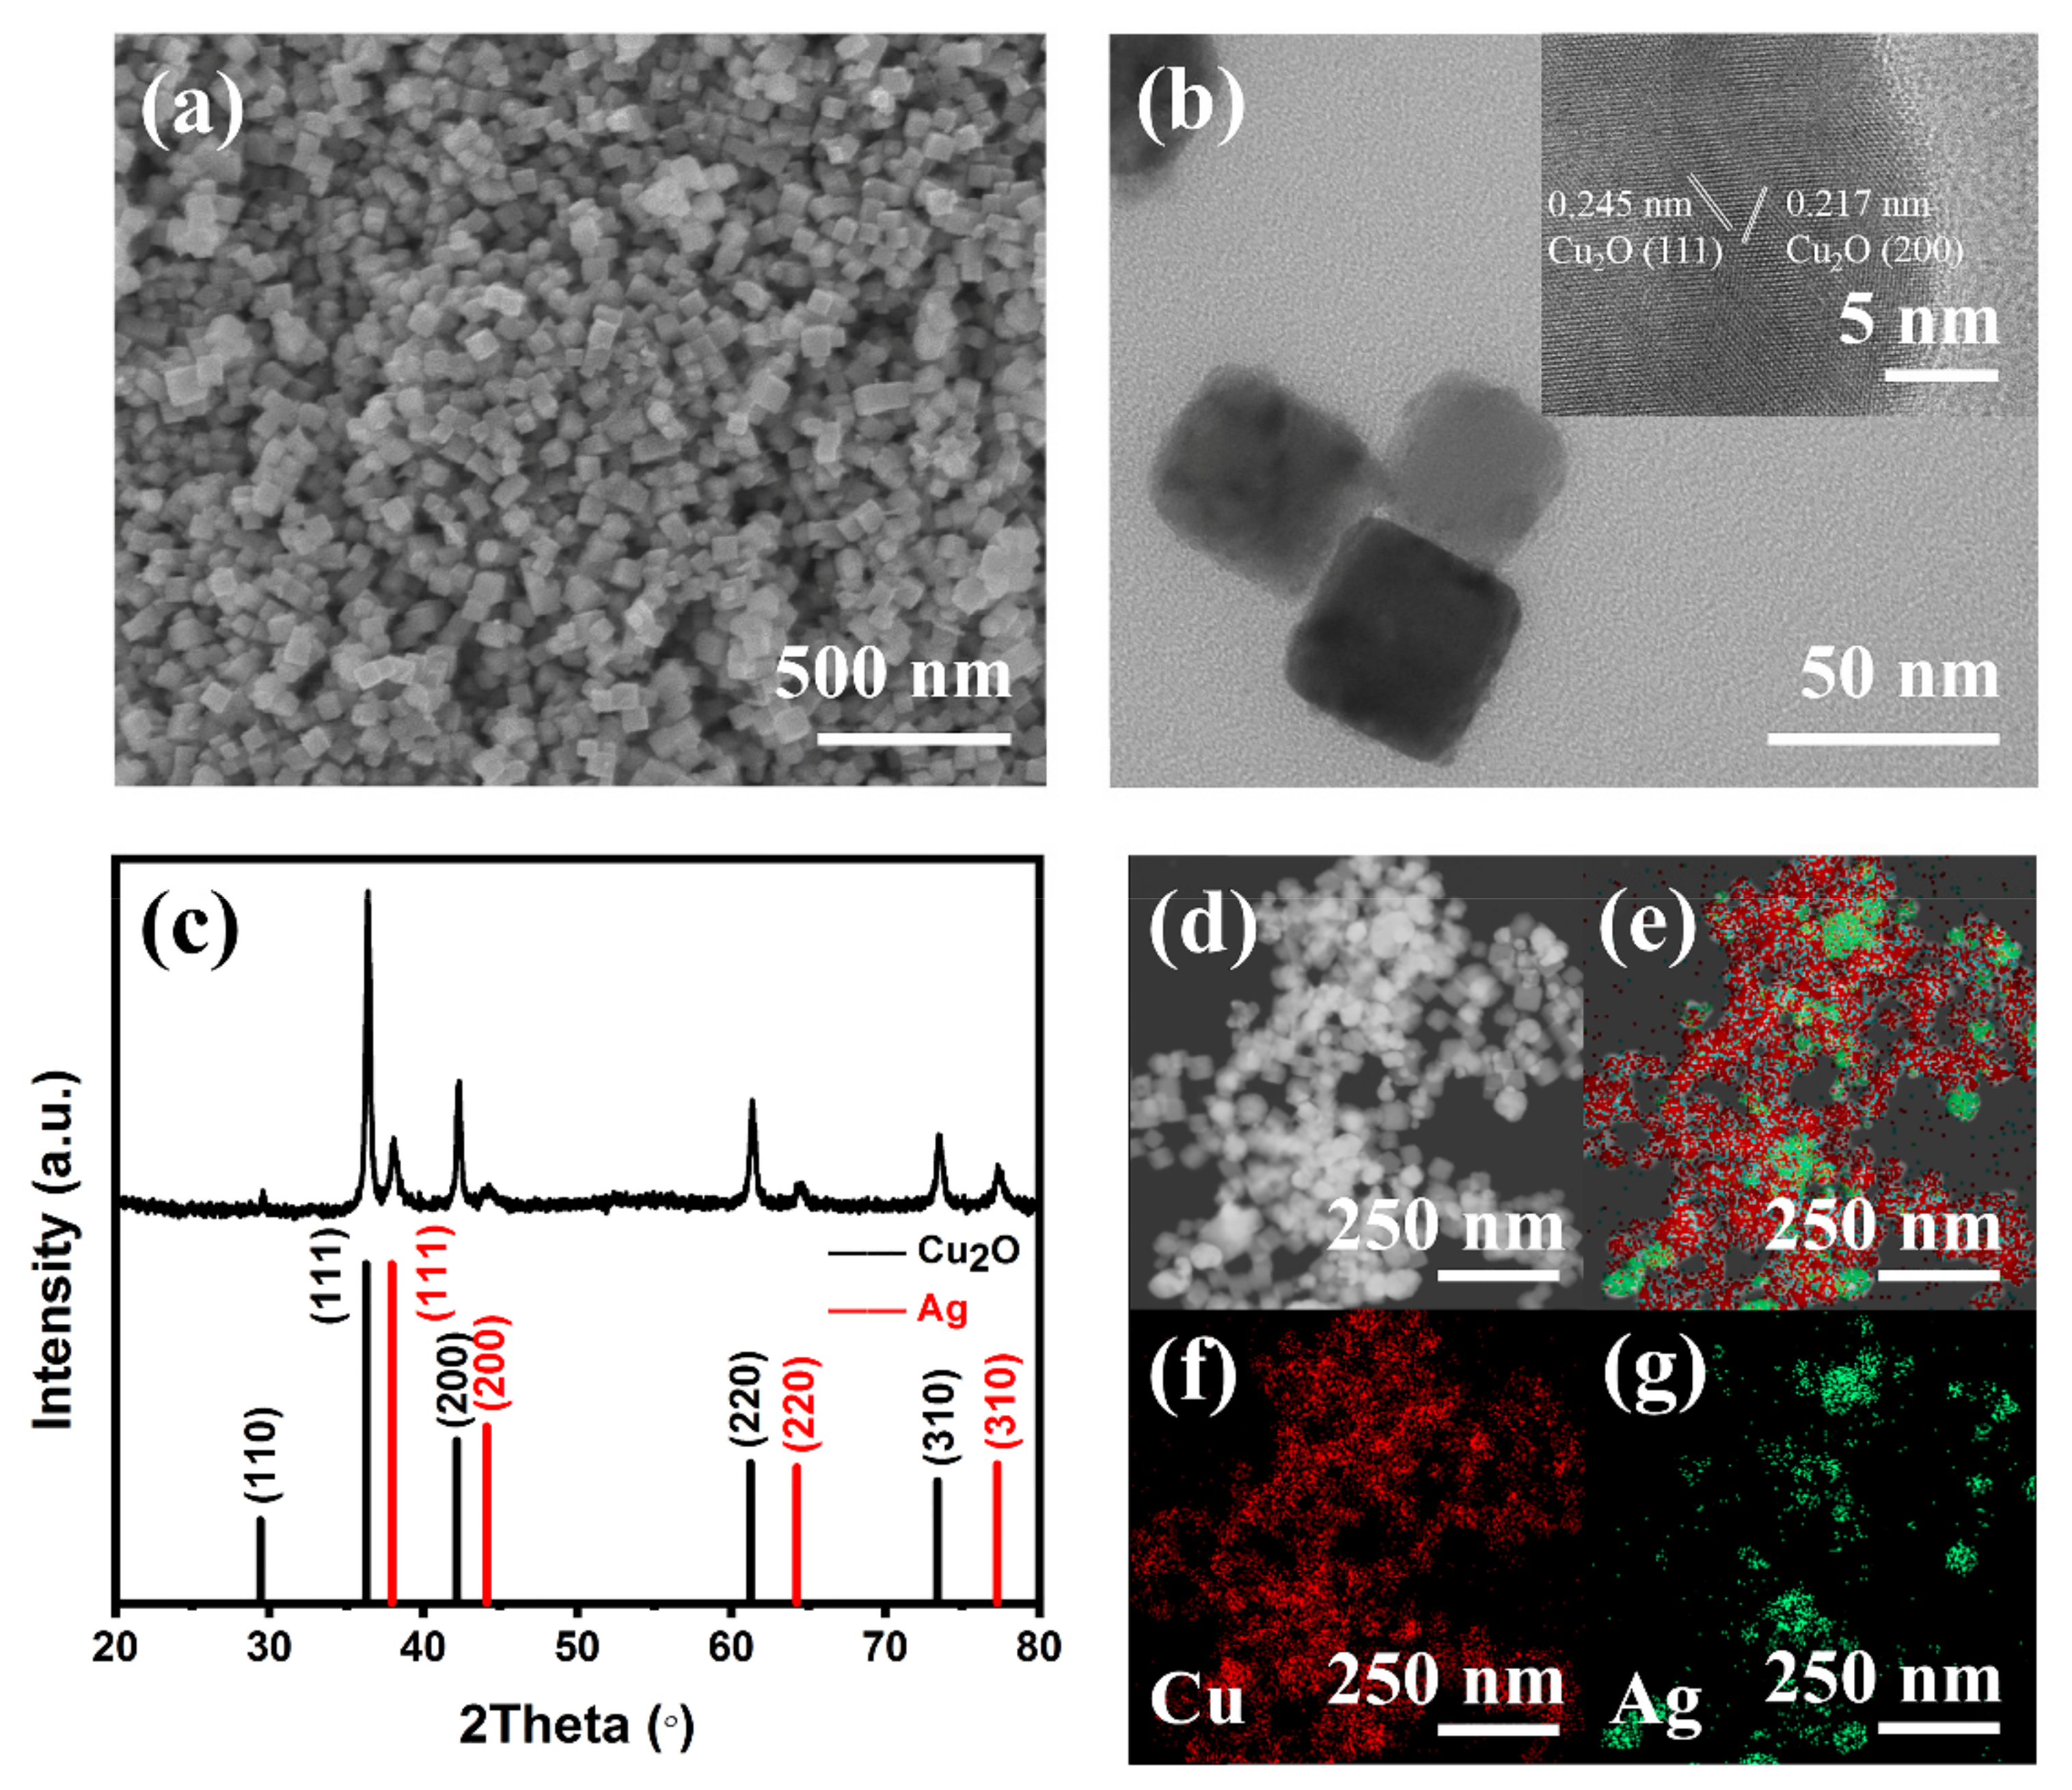
Figure 1. (a) SEM image of Cu2O-Ag nanocubes. (b) TEM and (inset) HRTEM images of Cu2O-Ag nanocubes. (c) XRD pattern of Cu2O-Ag nanocubes. (dg) HRTEM-EDS elemental mapping of Cu2O-Ag nanocubes, identifying homogeneously distributed (f) Cu and (g) Ag.
Molecules 26 02175 g001
Figure 2. (a) XPS Cu 2p spectra. (b) Auger spectra of Cu LMM. And (c) XPS Ag 3d spectra of Cu2O-Ag nanocubes. (d) Raman spectra of Cu2O-Ag and Cu2O nanocubes, respectively.
Molecules 26 02175 g002
Figure 3. (a) LSV curves on the Cu2O-Ag and Cu2O nanocubes in 1 M KOH electrolytes. Blue curves obtained from the blank GDL in 1 M KOH electrolytes. (b) Faradaic efficiencies of all CO2RR products on the Cu2O-Ag nanocubes. (c) Faradaic efficiencies of all CO2RR products on the Cu2O nanocubes. (d) Faradaic efficiencies of ethylene, acetate and ethanol of Cu2O-Ag and Cu2O nanocubes at different applied potentials. (e) Partial current densities of C2 products of Cu2O-Ag and Cu2O nanocubes at different applied potentials. (f) Stability test in 1M KOH electrolytes at −1.18 V versus RHE.
Molecules 26 02175 g003
Figure 4. CO and acetate Faradaic efficiencies on (a) Cu2O and (b) Cu2O-Ag nanocubes at different applied potentials.
Molecules 26 02175 g004
Figure 5. (a) Reaction barrier energies of C-C coupling step at the low and high CO concentrations; the corresponding configurations of initial state, transition state and final state on the CO coverage of (b) 2/9 ML and (c) 3/9 ML. Light red, copper; grey, carbon; red, oxygen; TS, transition state; * represents adsorbates).
Molecules 26 02175 g005
Publisher’s Note: MDPI stays neutral with regard to jurisdictional claims in published maps and institutional affiliations.