
Predictive Capability of QSAR Models Based on the CompTox Zebrafish Embryo Assays: An Imbalanced Classification Problem

 ,
,  ,
,  ,
,  ,
, 

Abstract
1. Introduction
2. Results
3. Discussion
4. Materials and Methods
4.1. Data Set and Chemical Representation
4.2. Machine Learning Methods
4.3. Modelling
5. Conclusions
Supplementary Materials
Author Contributions
Funding
Institutional Review Board Statement
Informed Consent Statement
Data Availability Statement
Conflicts of Interest
Sample Availability
Appendix A
References
- Williams, A.J.; Grulke, C.M.; Edwards, J.; McEachran, A.D.; Mansouri, K.; Baker, N.C.; Patlewicz, G.; Shah, I.; Wambaugh, J.F.; Judson, R.S.; et al. The CompTox Chemistry Dashboard: A community data resource for environmental chemistry. J. Cheminform. 2017, 9, 1–27. [Google Scholar] [CrossRef] [PubMed]
- Morger, A.; Mathea, M.; Achenbach, J.H.; Wolf, A.; Buesen, R.; Schleifer, K.J.; Landsiedel, R.; Volkamer, A. KnowTox: Pipeline and case study for confident prediction of potential toxic effects of compounds in early phases of development. J. Cheminform. 2020, 12, 1–17. [Google Scholar] [CrossRef]
- Thomas, R.S.; Bahadori, T.; Buckley, T.J.; Cowden, J.; Dionisio, K.L.; Frithsen, J.B.; Grulke, C.M.; Maureen, R.; Harrill, J.A.; Higuchi, M.; et al. The next generation blueprint of computational toxicology at the U.S. Environmental Protection Agency. Toxicol. Sci. 2020, 169, 1–29. [Google Scholar] [CrossRef]
- Padilla, S.; Corum, D.; Padnos, B.; Hunter, D.L.; Beam, A.; Houck, K.A.; Sipes, N.; Kleinstreuer, N.; Knudsen, T.; Dix, D.J.; et al. Zebrafish developmental screening of the ToxCastTM Phase I chemical library. Reprod. Toxicol. 2012, 33, 174–187. [Google Scholar] [CrossRef]
- Noyes, P.D.; Garcia, G.R.; Tanguay, R.L. Zebrafish as an: In vivo model for sustainable chemical design. Green Chem. 2016, 18, 6410–6430. [Google Scholar] [CrossRef] [PubMed]
- Pham, D.H.; De Roo, B.; Nguyen, X.B.; Vervaele, M.; Kecskés, A.; Ny, A.; Copmans, D.; Vriens, H.; Locquet, J.P.; Hoet, P.; et al. Use of Zebrafish Larvae as a Multi-Endpoint Platform to Characterize the Toxicity Profile of Silica Nanoparticles. Sci. Rep. 2016, 6, 1–13. [Google Scholar] [CrossRef]
- Ducharme, N.A.; Peterson, L.E.; Benfenati, E.; Reif, D.; McCollum, C.W.; Gustafsson, J.Å.; Bondesson, M. Meta-analysis of toxicity and teratogenicity of 133 chemicals from zebrafish developmental toxicity studies. Reprod. Toxicol. 2013, 41, 98–108. [Google Scholar] [CrossRef]
- Klüver, N.; Vogs, C.; Altenburger, R.; Escher, B.I.; Scholz, S. Development of a general baseline toxicity QSAR model for the fish embryo acute toxicity test. Chemosphere 2016, 164, 164–173. [Google Scholar] [CrossRef] [PubMed]
- Liu, T.; Yan, F.; Jia, Q.; Wang, Q. Norm index-based QSAR models for acute toxicity of organic compounds toward zebrafish embryo. Ecotoxicol. Environ. Saf. 2020, 203, 110946. [Google Scholar] [CrossRef]
- Qiao, K.; Fu, W.; Jiang, Y.; Chen, L.; Li, S.; Ye, Q.; Gui, W. QSAR models for the acute toxicity of 1,2,4-triazole fungicides to zebrafish (Danio rerio) embryos. Environ. Pollut. 2020, 265, 114837. [Google Scholar] [CrossRef]
- Ghorbanzadeh, M.; Zhang, J.; Andersson, P.L. Binary classification model to predict developmental toxicity of industrial chemicals in zebrafish. J. Chemom. 2016, 30, 298–307. [Google Scholar] [CrossRef]
- Lavado, G.J.; Gadaleta, D.; Toma, C.; Golbamaki, A.; Toropov, A.A.; Toropova, A.P.; Marzo, M.; Baderna, D.; Arning, J.; Benfenati, E. Zebrafish AC50 modelling: (Q)SAR models to predict developmental toxicity in zebrafish embryo. Ecotoxicol. Environ. Saf. 2020, 202, 110936. [Google Scholar] [CrossRef] [PubMed]
- Toropov, A.A.; Toropova, A.P.; Benfenati, E. The index of ideality of correlation: QSAR model of acute toxicity for zebrafish (Danio rerio) embryo. Int. J. Environ. Res. 2019, 13, 387–394. [Google Scholar] [CrossRef]
- Malev, O.; Lovrić, M.; Stipaničev, D.; Repec, S.; Martinović-Weigelt, D.; Zanella, D.; Ivanković, T.; Đuretec, V.S.; Barišić, J.; Li, M.; et al. Toxicity prediction and effect characterization of 90 pharmaceuticals and illicit drugs measured in plasma of fish from a major European river (Sava, Croatia). Environ. Pollut. 2020, 115162. [Google Scholar] [CrossRef]
- Babić, S.; Barišić, J.; Stipaničev, D.; Repec, S.; Lovrić, M.; Malev, O.; Martinović-Weigelt, D.; Čož-Rakovac, R.; Klobučar, G. Assessment of river sediment toxicity: Combining empirical zebrafish embryotoxicity testing with in silico toxicity characterization. Sci. Total Environ. 2018, 643, 435–450. [Google Scholar] [CrossRef] [PubMed]
- Henn, K.; Braunbeck, T. Dechorionation as a tool to improve the fish embryo toxicity test (FET) with the zebrafish (Danio rerio). Comp. Biochem. Physiol. C Toxicol. Pharmacol. 2011, 153, 91–98. [Google Scholar] [CrossRef] [PubMed]
- Nishimura, Y.; Inoue, A.; Sasagawa, S.; Koiwa, J.; Kawaguchi, K.; Kawase, R.; Maruyama, T.; Kim, S.; Tanaka, T. Using zebrafish in systems toxicology for developmental toxicity testing. Congenit. Anom. 2016, 56, 18–27. [Google Scholar] [CrossRef]
- Truong, L.; Reif, D.M.; Mary, L.S.; Geier, M.C.; Truong, H.D.; Tanguay, R.L. Multidimensional in vivo hazard assessment using zebrafish. Toxicol. Sci. 2014, 137, 212–233. [Google Scholar] [CrossRef] [PubMed]
- Villalobos, S.A.; Hamm, J.T.; Teh, S.J.; Hinton, D.E. Thiobencarb-induced embryotoxicity in medaka (Oryzias latipes): Stage- specific toxicity and the protective role of chorion. Aquat. Toxicol. 2000, 48, 309–326. [Google Scholar] [CrossRef]
- Scholz, S.; Klüver, N.; Kühne, R. Analysis of the Relevance and Adequateness of Using Fish Embryo Acute Toxicity (FET) Test Guidance (OECD 236) to Fulfil the Information Requirements and Addressing Concerns under REACH; European Chemicals Agency: Helsinki, Finland, 2016. [Google Scholar]
- Panzica-Kelly, J.M.; Zhang, C.X.; Augustine-Rauch, K.A. Optimization and performance assessment of the chorion-off [Dechorinated] Zebrafish Developmental toxicity assay. Toxicol. Sci. 2015, 146, 127–134. [Google Scholar] [CrossRef] [PubMed]
- Tran, C.M.; Lee, H.; Lee, B.; Ra, J.S.; Kim, K.T. Effects of the chorion on the developmental toxicity of organophosphate esters in zebrafish embryos. J. Hazard. Mater. 2021, 401, 123389. [Google Scholar] [CrossRef]
- Golbraikh, A.; Muratov, E.; Fourches, D.; Tropsha, A. Data set modelability by QSAR. J. Chem. Inf. Model. 2014, 54, 1–4. [Google Scholar] [CrossRef]
- Marcou, G.; Horvath, D.; Varnek, A. Kernel Target Alignment Parameter: A New Modelability Measure for Regression Tasks. J. Chem. Inf. Model. 2016, 56, 6–11. [Google Scholar] [CrossRef]
- Ruiz, I.L.; Gómez-Nieto, M.Á. Study of the Applicability Domain of the QSAR Classification Models by Means of the Rivality and Modelability Indexes. Molecules 2018, 23, 2756. [Google Scholar] [CrossRef]
- Thomas, R.S.; Black, M.B.; Li, L.; Healy, E.; Chu, T.M.; Bao, W.; Andersen, M.E.; Wolfinger, R.D. A comprehensive statistical analysis of predicting in vivo hazard using high-throughput in vitro screening. Toxicol. Sci. 2012, 128, 398–417. [Google Scholar] [CrossRef] [PubMed]
- Ruiz, I.L.; Gómez-Nieto, M.Á. Study of Data Set Modelability: Modelability, Rivality, and Weighted Modelability Indexes. J. Chem. Inf. Model. 2018, 58, 1798–1814. [Google Scholar] [CrossRef] [PubMed]
- Boughorbel, S.; Jarray, F.; El-Anbari, M. Optimal classifier for imbalanced data using Matthews Correlation Coefficient metric. PLoS ONE 2017, 12. [Google Scholar] [CrossRef] [PubMed]
- Czodrowski, P. Count on kappa. J. Comput. Aided. Mol. Des. 2014, 28, 1049–1055. [Google Scholar] [CrossRef]
- Lučić, B.; Batista, J.; Bojović, V.; Lovrić, M.; Sović Kržić, A.; Bešlo, D.; Nadramija, D.; Vikić-Topić, D. Estimation of Random Accuracy and its Use in Validation of Predictive Quality of Classification Models within Predictive Challenges. Croat. Chem. Acta 2019, 92. [Google Scholar] [CrossRef]
- Kurosaki, K.; Wu, R.; Uesawa, Y. A toxicity prediction tool for potential agonist/antagonist activities in molecular initiating events based on chemical structures. Int. J. Mol. Sci. 2020, 21, 7853. [Google Scholar] [CrossRef]
- Rácz, A.; Bajusz, D.; Héberger, K. Effect of Dataset Size and Train/Test Split Ratios in QSAR/QSPR Multiclass Classification. Molecules 2021, 26, 1111. [Google Scholar] [CrossRef]
- Abdelaziz, A.; Spahn-Langguth, H.; Schramm, K.W.; Tetko, I.V. Consensus modeling for HTS assays using in silico descriptors calculates the best balanced accuracy in Tox21 challenge. Front. Environ. Sci. 2016, 4, 1–12. [Google Scholar] [CrossRef]
- Idakwo, G.; Thangapandian, S.; Luttrell, J.; Li, Y.; Wang, N.; Zhou, Z.; Hong, H.; Yang, B.; Zhang, C.; Gong, P. Structure–activity relationship-based chemical classification of highly imbalanced Tox21 datasets. J. Cheminform. 2020, 12, 1–19. [Google Scholar] [CrossRef]
- Hemmerich, J.; Asilar, E.; Ecker, G.F. Conformational Oversampling as Data Augmentation for Molecules. In Artificial Neural Networks and Machine Learning–ICANN 2019: Workshop and Special Sessions; Tetko, I., Kůrková, V., Karpov, P., Theis, F., Eds.; Springer: Cham, Switzerland; New York, NY, USA, 2019; Volume 11731. [Google Scholar] [CrossRef]
- Fernandez, M.; Ban, F.; Woo, G.; Hsing, M.; Yamazaki, T.; Leblanc, E.; Rennie, P.S.; Welch, W.J.; Cherkasov, A. Toxic Colors: The Use of Deep Learning for Predicting Toxicity of Compounds Merely from Their Graphic Images. J. Chem. Inf. Model. 2018, 58, 1533–1543. [Google Scholar] [CrossRef] [PubMed]
- Mayr, A.; Klambauer, G.; Unterthiner, T.; Hochreiter, S. DeepTox: Toxicity prediction using deep learning. Front. Environ. Sci. 2016, 3. [Google Scholar] [CrossRef]
- Rogers, D.; Hahn, M. Extended-Connectivity Fingerprints. J. Chem. Inf. Model. 2010, 50, 742–754. [Google Scholar] [CrossRef]
- Kausar, S.; Falcao, A.O. Analysis and comparison of vector space and metric space representations in QSAR modeling. Molecules 2019, 24, 1698. [Google Scholar] [CrossRef] [PubMed]
- Gütlein, M.; Kramer, S. Filtered circular fingerprints improve either prediction or runtime performance while retaining interpretability. J. Cheminform. 2016, 8, 1–16. [Google Scholar] [CrossRef] [PubMed]
- Landrum, G. RDKit: Colliding Bits III. Available online: http://rdkit.blogspot.com/2016/02/colliding-bits-iii.html (accessed on 23 December 2019).
- Žuvela, P.; Lovric, M.; Yousefian-Jazi, A.; Liu, J.J. Ensemble Learning Approaches to Data Imbalance and Competing Objectives in Design of an Industrial Machine Vision System. Ind. Eng. Chem. Res. 2020, 59, 4636–4645. [Google Scholar] [CrossRef]
- Lovrić, M.; Pavlović, K.; Žuvela, P.; Spataru, A.; Lučić, B.; Kern, R.; Wong, M.W. Machine learning in prediction of intrinsic aqueous solubility of drug-like compounds: Generalization, complexity or predictive ability? chemrxiv 2020. [Google Scholar] [CrossRef]
- Huang, R.; Xia, M.; Nguyen, D.-T.; Zhao, T.; Sakamuru, S.; Zhao, J.; Shahane, S.A.; Rossoshek, A.; Simeonov, A. Tox21Challenge to Build Predictive Models of Nuclear Receptor and Stress Response Pathways as Mediated by Exposure to Environmental Chemicals and Drugs. Front. Environ. Sci. 2016, 3, 85. [Google Scholar] [CrossRef]
- Matsuzaka, Y.; Uesawa, Y. Molecular Image-Based Prediction Models of Nuclear Receptor Agonists and Antagonists Using the DeepSnap-Deep Learning Approach with the Tox21 10K Library. Molecules 2020, 25, 2764. [Google Scholar] [CrossRef]
- Wang, Z.; Boulanger, L.; Berger, D.; Gaudreau, P.; Marrie, R.A.; Potter, B.; Wister, A.; Wolfson, C.; Lefebvre, G.; Sylvestre, M.P.; et al. Development and internal validation of a multimorbidity index that predicts healthcare utilisation using the Canadian Longitudinal Study on Aging. BMJ Open 2020, 10, 1–9. [Google Scholar] [CrossRef] [PubMed]
- Correlation and regression. Available online: https://www.bmj.com/about-bmj/resources-readers/publications/statistics-square-one/11-correlation-and-regression (accessed on 3 March 2021).
- Hulzebos, E.; Sijm, D.; Traas, T.; Posthumus, R.; Maslankiewicz, L. Validity and validation of expert (Q)SAR systems. SAR QSAR Environ. Res. 2005, 16, 385–401. [Google Scholar] [CrossRef] [PubMed]
- Patlewicz, G.; Ball, N.; Booth, E.D.; Hulzebos, E.; Zvinavashe, E.; Hennes, C. Use of category approaches, read-across and (Q)SAR: General considerations. Regul. Toxicol. Pharmacol. 2013, 67, 1–12. [Google Scholar] [CrossRef]
- Lo Piparo, E.; Worth, A. Review of QSAR Models and Software Tools for predicting Developmental and Reproductive Toxicity. JRC Rep. EUR 2010, 24522. [Google Scholar] [CrossRef]
- Han, J.; Wang, Q.; Wang, X.; Li, Y.; Wen, S.; Liu, S.; Ying, G.; Guo, Y.; Zhou, B. The synthetic progestin megestrol acetate adversely affects zebrafish reproduction. Aquat. Toxicol. 2014, 150, 66–72. [Google Scholar] [CrossRef]
- McGee, S.P.; Cooper, E.M.; Stapleton, H.M.; Volz, D.C. Early zebrafish embryogenesis is susceptible to developmental TDCPP exposure. Environ. Health Perspect. 2012, 120, 1585–1591. [Google Scholar] [CrossRef]
- Wang, Q.; Liang, K.; Liu, J.; Yang, L.; Guo, Y.; Liu, C.; Zhou, B. Exposure of zebrafish embryos/larvae to TDCPP alters concentrations of thyroid hormones and transcriptions of genes involved in the hypothalamic-pituitary-thyroid axis. Aquat. Toxicol. 2013, 126, 207–213. [Google Scholar] [CrossRef]
- Noyes, P.D.; Haggard, D.E.; Gonnerman, G.D.; Tanguay, R.L. Advanced morphological - behavioral test platform reveals neurodevelopmental defects in embryonic zebrafish exposed to comprehensive suite of halogenated and organophosphate flame retardants. Toxicol. Sci. 2015, 145, 177–195. [Google Scholar] [CrossRef]
- Wilson, L.B.; Truong, L.; Simonich, M.T.; Tanguay, R.L. Systematic Assessment of Exposure Variations on Observed Bioactivity in Zebrafish Chemical Screening. Toxics 2020, 8, 87. [Google Scholar] [CrossRef]
- Mandrell, D.; Truong, L.; Jephson, C.; Sarker, M.R.; Moore, A.; Lang, C.; Simonich, M.T.; Tanguay, R.L. Automated zebrafish chorion removal and single embryo placement: Optimizing Throughput of zebrafish developmental toxicity screens. J. Lab. Autom. 2012, 17, 66–74. [Google Scholar] [CrossRef] [PubMed]
- Kim, K.-T.; Tanguay, R.L. The role of chorion on toxicity of silver nanoparticles in the embryonic zebrafish assay. Environ. Health Toxicol. 2014, 29, e2014021. [Google Scholar] [CrossRef]
- Volz, D.C.; Hipszer, R.A.; Leet, J.K.; Raftery, T.D. Leveraging Embryonic Zebrafish to Prioritize ToxCast Testing. Environ. Sci. Technol. Lett. 2015, 2, 171–176. [Google Scholar] [CrossRef]
- Lovrić, M.; Molero, J.M.; Kern, R. PySpark and RDKit: Moving towards Big Data in Cheminformatics. Mol. Inform. 2019, 38. [Google Scholar] [CrossRef] [PubMed]
- Fourches, D.; Muratov, E.; Tropsha, A. Trust, but verify: On the importance of chemical structure curation in cheminformatics and QSAR modeling research. J. Chem. Inf. Model. 2010, 50, 1189–1204. [Google Scholar] [CrossRef] [PubMed]
- Lovrić, M. CompTox Zebrafish Developmental Toxicity Processed Data. 2021. Available online: https://zenodo.org/record/4400418#.YE619J0zaUk (accessed on 25 January 2021).
- Landrum, G. RDKit: Open-Source Cheminformatics Software. Available online: http://rdkit.org/ (accessed on 25 January 2021).
- Hastie, T.; Tibshirani, R.; Friedman, J. The Elements of Statistical Learning; Springer Series in Statistics; Springer: New York, NY, USA, 2009; ISBN 978-0-387-84857-0. [Google Scholar]
- Murtagh, F. Multilayer perceptrons for classification and regression. Neurocomputing 1991, 2, 183–197. [Google Scholar] [CrossRef]
- Breiman, L. Random Forests. Mach. Learn. 2001, 45, 5–32. [Google Scholar] [CrossRef]
- Pedregosa, F.; Michel, V.; Grisel, O.; Blondel, M.; Prettenhofer, P.; Weiss, R.; Vanderplas, J.; Cournapeau, D.; Varoquaux, G.; Gramfort, A.; et al. Scikit-learn: Machine Learning in Python. J. Mach. Learn. Res. 2011, 12, 2825–2830. [Google Scholar] [CrossRef]
- Mansouri, K.; Kleinstreuer, N.; Abdelaziz, A.M.; Alberga, D.; Alves, V.M.; Andersson, P.L.; Andrade, C.H.; Bai, F.; Balabin, I.; Ballabio, D.; et al. CoMPARA: Collaborative Modeling Project for Androgen Receptor Activity. Environ. Health Perspect. 2020, 128, 027002. [Google Scholar] [CrossRef]
- He, H.; Garcia, E.A. Learning from imbalanced data. IEEE Trans. Knowl. Data Eng. 2009, 21, 1263–1284. [Google Scholar] [CrossRef]
- Snoek, J.; Larochelle, H.; Adams, R.P. Practical Bayesian Optimization of Machine Learning Algorithms. In Proceedings of the 26th Annual Conference on Neural Information Processing Systems 2012, NIPS 2012, Lake Tahoe, NV, USA, 3–6 December 2012; Advances in Neural Information Processing Systems: Lake Tahoe, NV, USA, 2012; Volume 4, pp. 2951–2959. [Google Scholar]
- Lovric, M.; Banic, I.; Lacic, E.; Kern, R.; Pavlovic, K.; Turkalj, M. Predicting treatment outcomes using explainable machine learning in children with asthma. Authorea Prepr. 2020. [Google Scholar] [CrossRef]


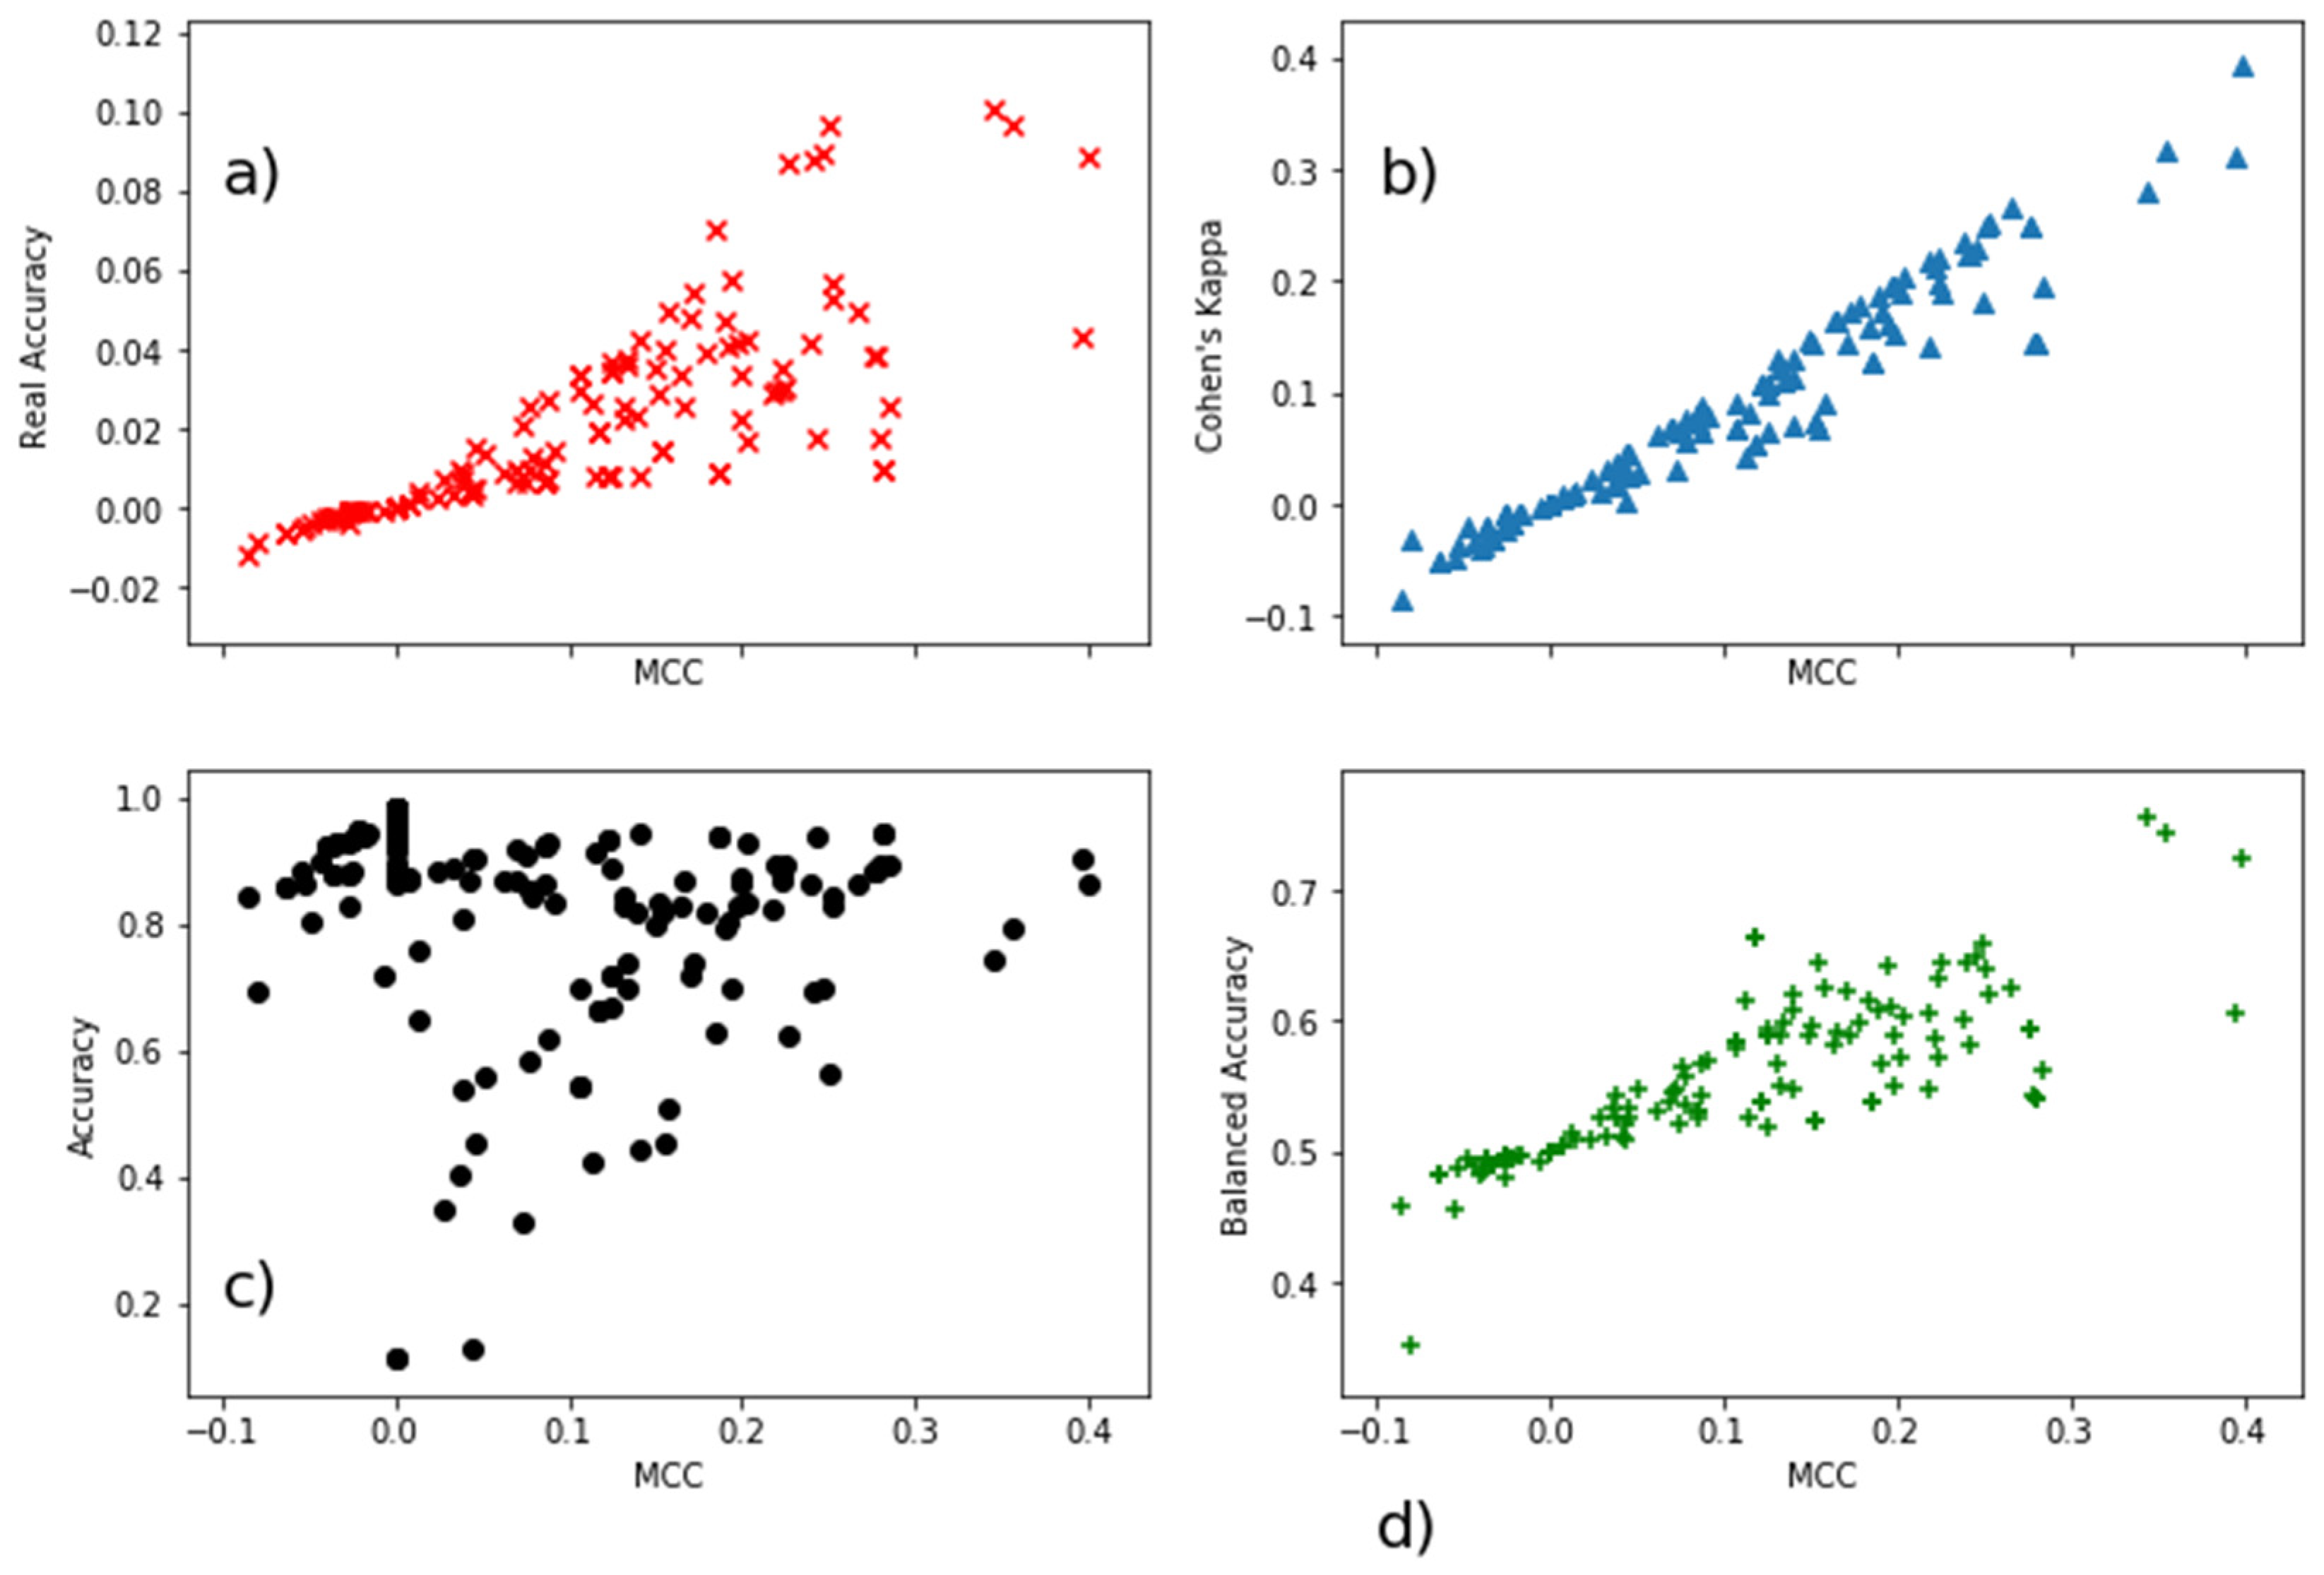
| Real Accuracy | MCC | Cohen’s Kappa | Accuracy | Balanced Accuracy | |
|---|---|---|---|---|---|
| Real Accuracy | 1 | 0.84 | 0.86 | −0.39 | −0.28 |
| MCC | 0.84 | 1 | 0.97 | −0.24 | −0.19 |
| Cohen’s Kappa | 0.86 | 0.97 | 1 | −0.18 | −0.21 |
| Accuracy | −0.39 | −0.24 | −0.18 | 1 | 0.59 |
| Balanced Accuracy | −0.28 | −0.19 | −0.21 | 0.59 | 1 |
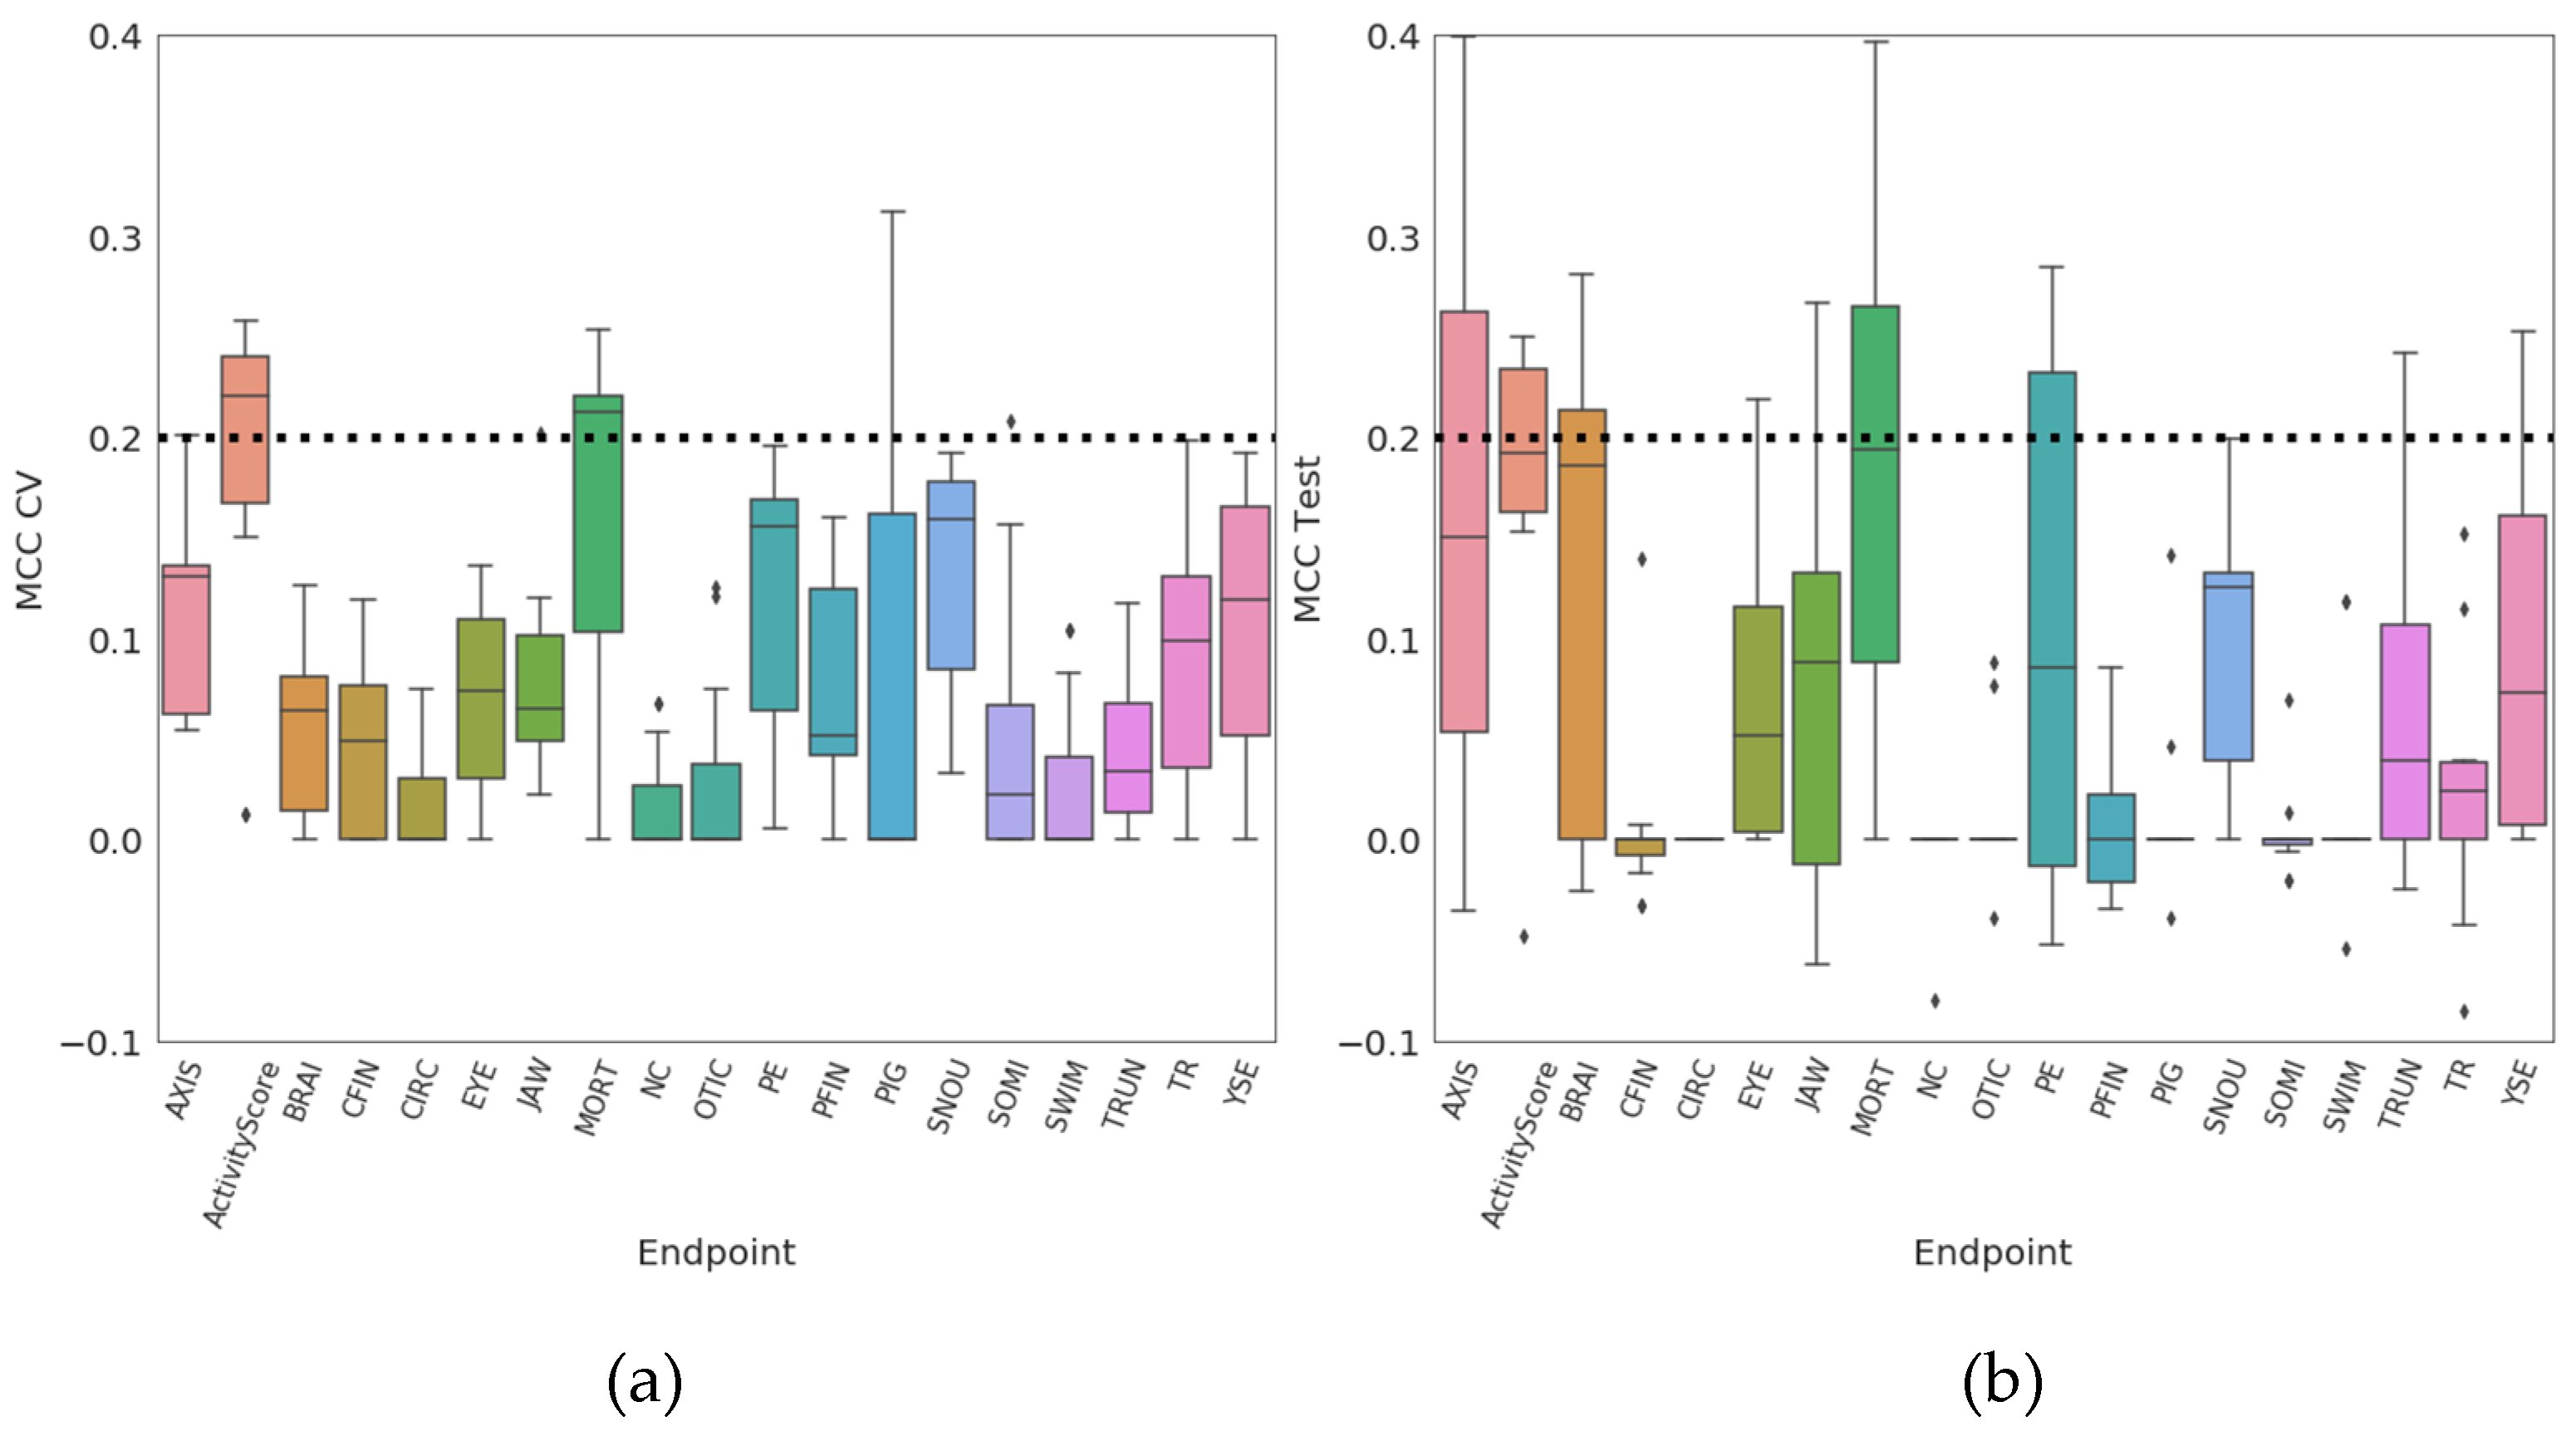
| Endpoint | Negative (0) | Positive (1) | Missing Values |
|---|---|---|---|
| AXIS | 882 | 108 | 28 |
| ActivityScore | 812 | 187 | 19 |
| BRAI | 930 | 60 | 28 |
| CFIN | 942 | 48 | 28 |
| CIRC | 972 | 18 | 28 |
| EYE | 913 | 77 | 28 |
| JAW | 881 | 109 | 28 |
| MORT | 884 | 115 | 19 |
| NC | 977 | 13 | 28 |
| OTIC | 949 | 41 | 28 |
| PE | 874 | 116 | 28 |
| PFIN | 936 | 54 | 28 |
| PIG | 945 | 45 | 28 |
| SNOU | 883 | 107 | 28 |
| SOMI | 952 | 38 | 28 |
| SWIM | 958 | 32 | 28 |
| TRUN | 934 | 56 | 28 |
| TR | 912 | 78 | 28 |
| YSE | 867 | 123 | 28 |
| Positive (Model) (1) | Negative (Model) (0) | |
|---|---|---|
| Positive (Experimental) (1) | TP | FN |
| Negative (Experimental) (0) | FP | TN |
| Classifier | Feature Set | * Scaling | ** Feat. Sel. | Endpoints |
|---|---|---|---|---|
| Logistic regression | Fingerprints | No | No | 19 |
| Multilayer perceptron | Fingerprints | No | No | 19 |
| Random forest | Descriptors | No | No | 19 |
| Random forest | Descriptors | No | Yes | 19 |
| Random forest | Fingerprints | No | No | 19 |
| Logistic regression | Descriptors | Yes | No | 19 |
| Logistic regression | Descriptors | Yes | Yes | 19 |
| Multilayer perceptron | Descriptors | Yes | No | 19 |
| Multilayer perceptron | Descriptors | Yes | Yes | 19 |
| Random forest | Descriptors | Yes | No | 19 |
| Random forest | Descriptors | Yes | Yes | 19 |
Publisher’s Note: MDPI stays neutral with regard to jurisdictional claims in published maps and institutional affiliations. |
© 2021 by the authors. Licensee MDPI, Basel, Switzerland. This article is an open access article distributed under the terms and conditions of the Creative Commons Attribution (CC BY) license (http://creativecommons.org/licenses/by/4.0/).
Share and Cite
Lovrić, M.; Malev, O.; Klobučar, G.; Kern, R.; Liu, J.J.; Lučić, B. Predictive Capability of QSAR Models Based on the CompTox Zebrafish Embryo Assays: An Imbalanced Classification Problem. Molecules 2021, 26, 1617. https://doi.org/10.3390/molecules26061617
Lovrić M, Malev O, Klobučar G, Kern R, Liu JJ, Lučić B. Predictive Capability of QSAR Models Based on the CompTox Zebrafish Embryo Assays: An Imbalanced Classification Problem. Molecules. 2021; 26(6):1617. https://doi.org/10.3390/molecules26061617
Chicago/Turabian StyleLovrić, Mario, Olga Malev, Göran Klobučar, Roman Kern, Jay J. Liu, and Bono Lučić. 2021. "Predictive Capability of QSAR Models Based on the CompTox Zebrafish Embryo Assays: An Imbalanced Classification Problem" Molecules 26, no. 6: 1617. https://doi.org/10.3390/molecules26061617
APA StyleLovrić, M., Malev, O., Klobučar, G., Kern, R., Liu, J. J., & Lučić, B. (2021). Predictive Capability of QSAR Models Based on the CompTox Zebrafish Embryo Assays: An Imbalanced Classification Problem. Molecules, 26(6), 1617. https://doi.org/10.3390/molecules26061617