Article

Structural, Optical and Electrical Properties of Cu0.6CoxZn0.4−xFe2O4 (x = 0.0, 0.1, 0.2, 0.3, 0.4) Soft Ferrites

by
W. Aslam Farooq
1,*,
Muhammad Sajjad Ul Hasan
2,
Muhammad Iftikhar Khan
2,
Ahmad Raza Ashraf
3,
Muhammad Abdul Qayyum
3,
Nafeesah Yaqub
1,
Mona A. Almutairi
1,
Muhammad Atif
1 and
Atif Hanif
4
1
Department of Physics and Astronomy, College of Science, King Saud University, Riyadh 11451, Saudi Arabia
2
Department of Physics, The University of Lahore, Lahore 53700, Pakistan
3
Department of Chemistry, Division of Science and Technology, University of Education, Lahore 54770, Pakistan
4
Botany and Microbiology Department, College of Science, King Saud University, Riyadh 11451, Saudi Arabia
*
Author to whom correspondence should be addressed.
Molecules 2021, 26(5), 1399; https://doi.org/10.3390/molecules26051399
Submission received: 5 January 2021 / Revised: 16 February 2021 / Accepted: 25 February 2021 / Published: 5 March 2021

Abstract

:
A series of cobalt-inserted copper zinc ferrites, Cu0.6CoxZn0.4−xFe2O4 (x = 0.0, 0.1, 0.2, 0.3, 0.4) having cubic spinel structure were prepared by the coprecipitation method. Various characterization techniques, including XRD, FTIR, UV-vis and I–V were used to investigate structural optical and electrical properties, respectively. The lattice constant was observed to be decreased as smaller ionic radii Co2+ (0.74 Å) replaced the higher ionic radii Zn2+ (0.82 Å). The presence of tetrahedral and octahedral bands was confirmed by FTIR spectra. Optical bandgap energy was determined in the range of 4.44–2.05 eV for x = 0.0 to 0.4 nanoferrites, respectively. DC electrical resistivity was measured and showed an increasing trend (5.42 × 10⁸ to 6.48 × 10⁸ Ω·cm) with the addition of cobalt contents as cobalt is more conductive than zinc. The range of DC electrical resistivity (108 ohm-cm) makes these nanomaterials potential candidates for telecommunication devices.

Graphical Abstract

1. Introduction

Ferrites, a group of familiar magnetic materials with general formula MFe2O4, are used extensively in electrical, electronics, medical and, industrial applications due to their chemical constancy, economical production cost and, improved electric, magnetic and thermal characteristics. Soft ferrites are attractive materials with modest magnetization, larger anisotropy and fine electrical insulation. Many researchers have explained the optical, electrical and magnetic properties of zinc doped ferrites. Ferrites behave like insulators at room temperature and are semiconductors at a higher temperature. The electrical and magnetic properties of zinc ferrites can be improved through partial insertion of divalent ions like Cu, Co, Ni, Mn and Mg. Santosh Bhukalet et al. reported the copper-doped CoZn ferrites prepared by sol–gel auto combustion technique and found that all nanomaterials have semiconducting nature [1]. K. Anu et al. synthesized Zn-doped cobalt ferrites by applying a two-step process and investigated the variations in electrical and magnetic properties [2]. B. B. V. S. Vera Prasad et al. reported the fabrication of Cu-inserted copper zinc ferrites by auto combustion method [3]. They determined the decrease in saturation magnetization with the addition of copper contents. Muhammad Farooq Warsi et al. fabricated erbium-doped NiCo spinel ferrites by using a coprecipitation route and found adecrease in DC electrical resistivity in the range of 6.20 × 10⁷–0.03 × 10⁷ ohm-cm [4]. They observed that these materials are potential candidates for various technological devices. Sandeep B. Somvanshi et al. designed magnesium-inserted soft zinc ferrites and resolved thermal, structural, optical and spectral characteristics [5]. They concluded the increase in optical bandgap energy in the range of 1.96–2.39 eV. Structural, optical and electrical properties of La3+-inserted ZnMgNi soft ferrites were discussed by M. S. Hasan et al. [6].
The materials inserted in the current composition enhance the electrical and optical properties. Also, the DC electrical resistivity in the range of 108 ohm-cm makes Cu-Co-Zn ferrites potential candidates for telecommunication devices.The synthesis route, size of particles and distribution of metal ions on tetrahedral and octahedral sites play vital role in determining the characteristics of soft ferrites. Zinc occupies a tetrahedral site, while the rest of metals, copper and cobalt, partially occupy tetrahedral and octahedral sites. A careful study of the literature shows that various methods have been used by researchers to synthesize the nanomaterials, such as coprecipitation, sol–gel, hydrothermal, microemulsion, mechanical milling etc. [7,8]. Coprecipitation is a popular, emerging, and economical synthesis method having enormous potential [6]. Limpidness and homogeneity are the significant properties of materials synthesized by coprecipitation that provides better impacts to this technique. In recent research work we have fabricated Co2+-inserted Cu0.6CoxZn0.4−xFe2O4 soft ferrites where x = 0.0, 0.1, 0.2, 0.3, 0.4 applying coprecipitationtechnique. Furthermore, structural, optical and electrical parameters of Co-inserted Cu-Zn-Ni soft ferrites were examined.

2. Results and Discussion
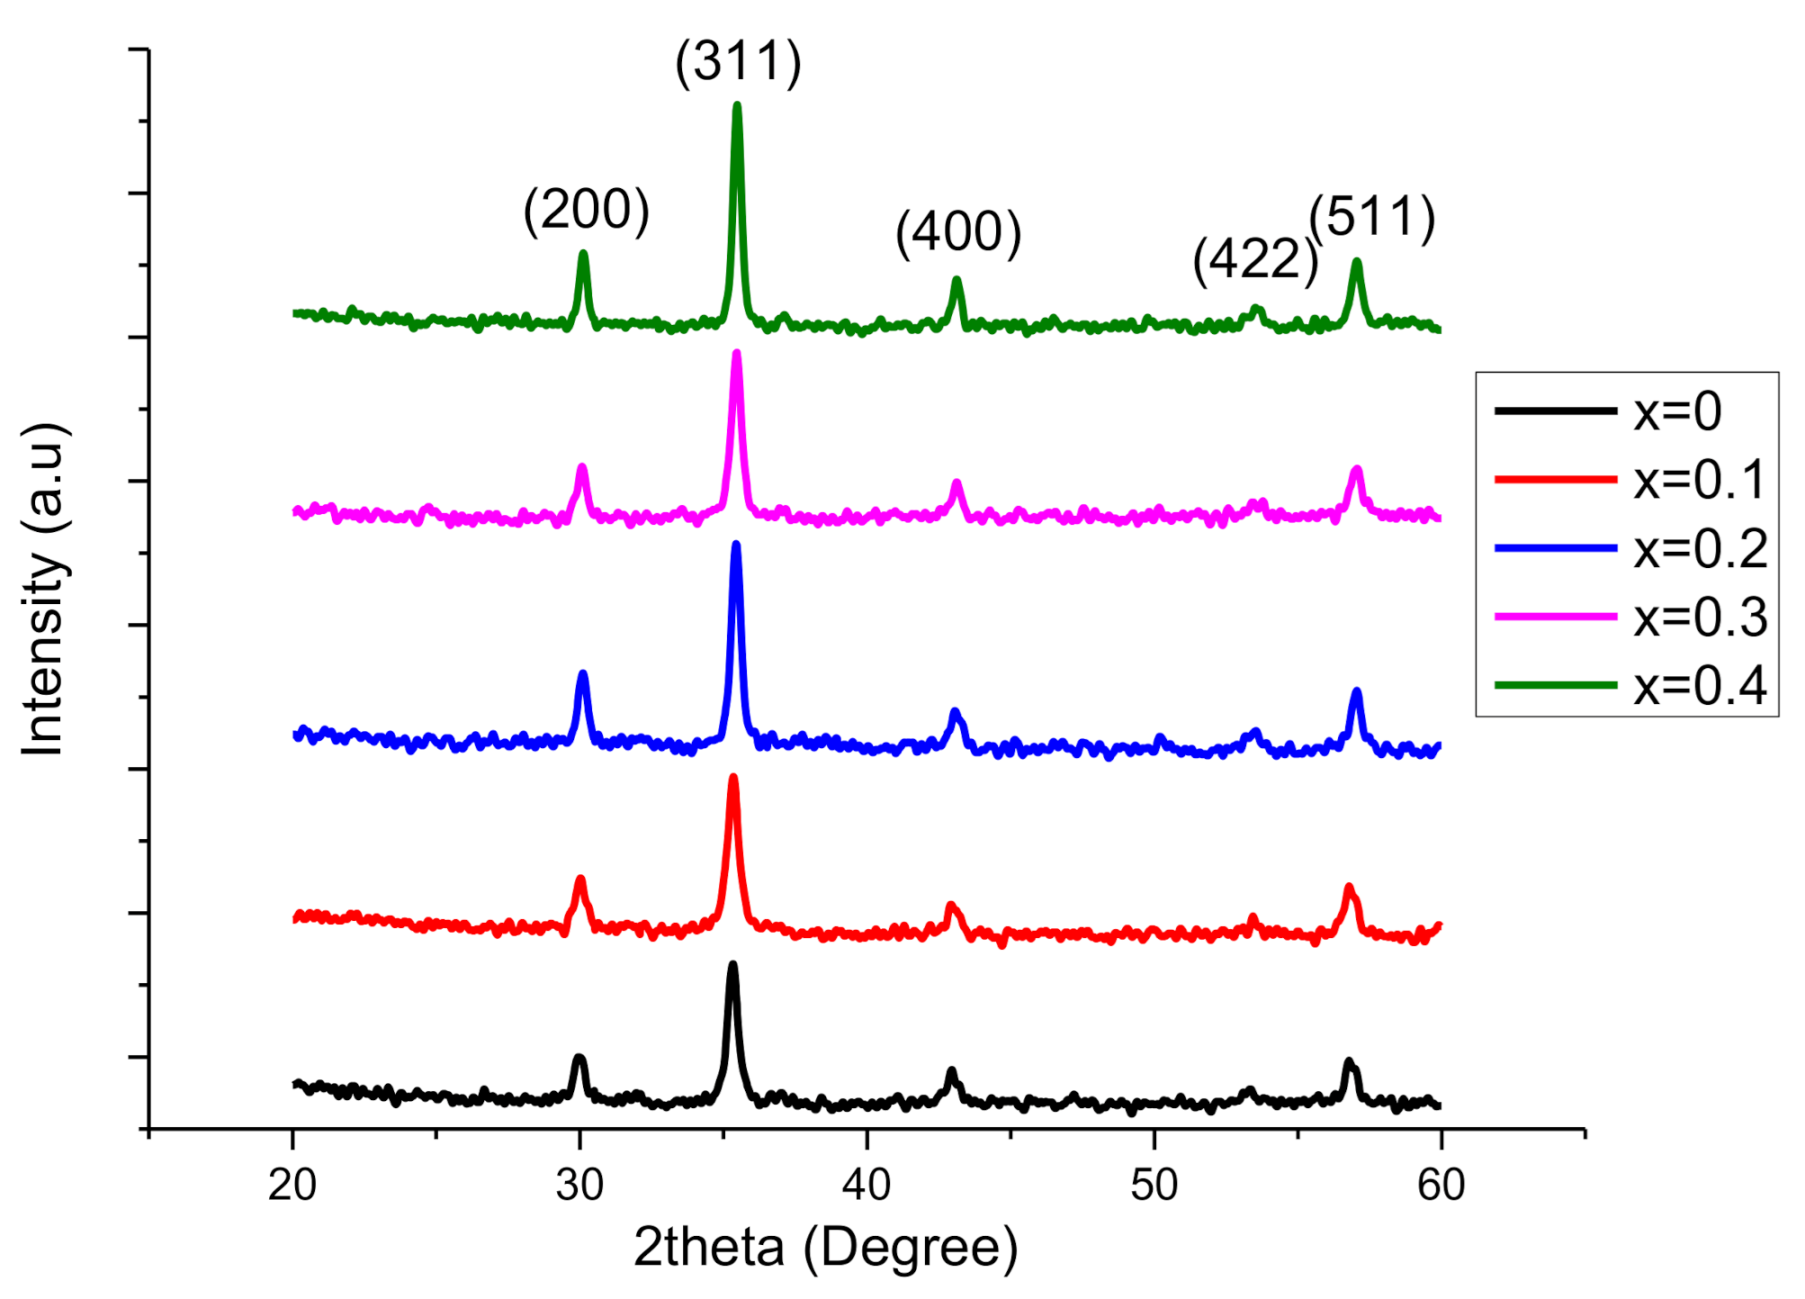
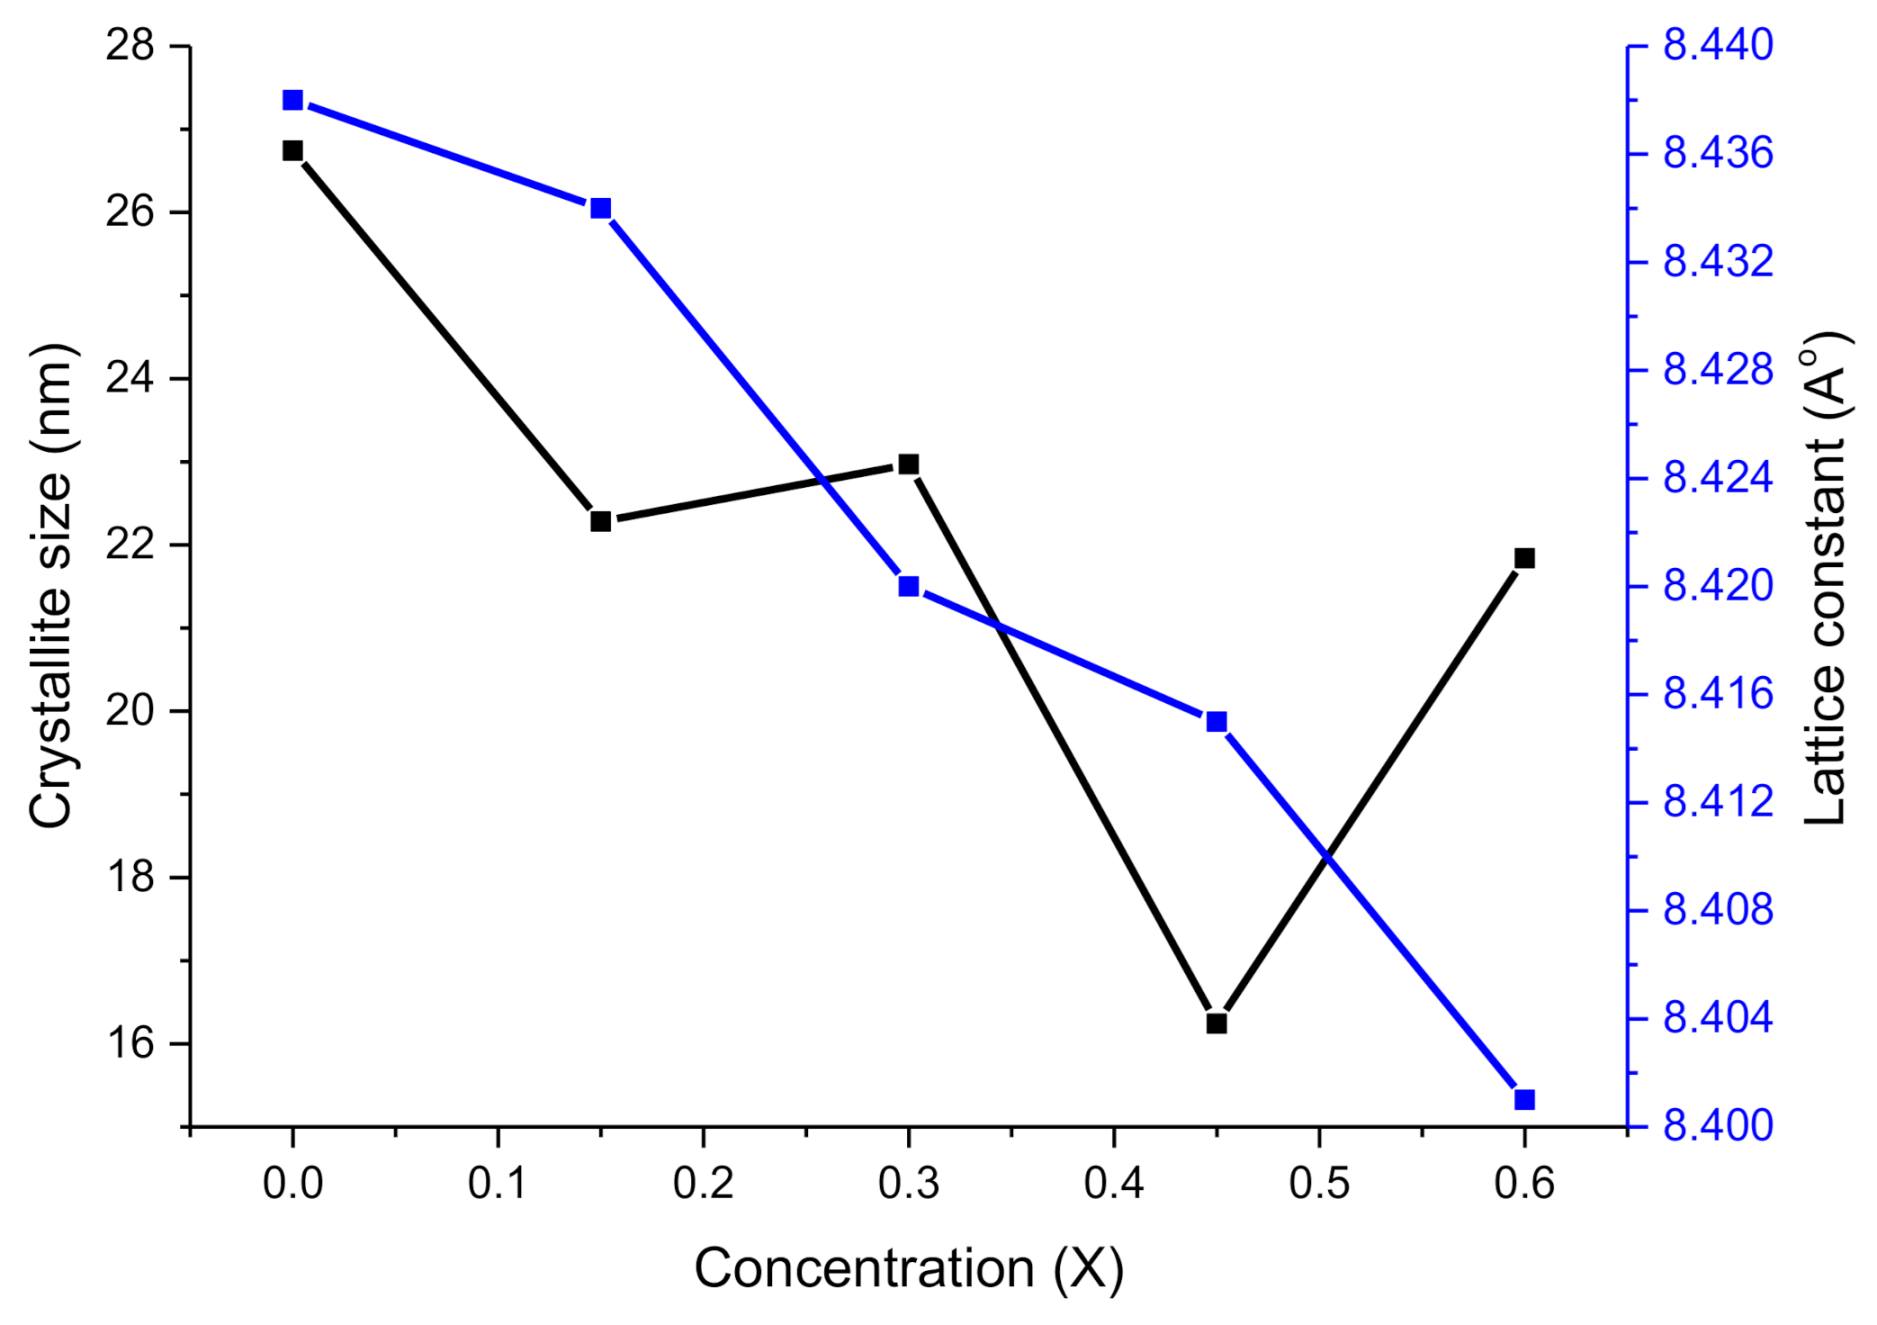
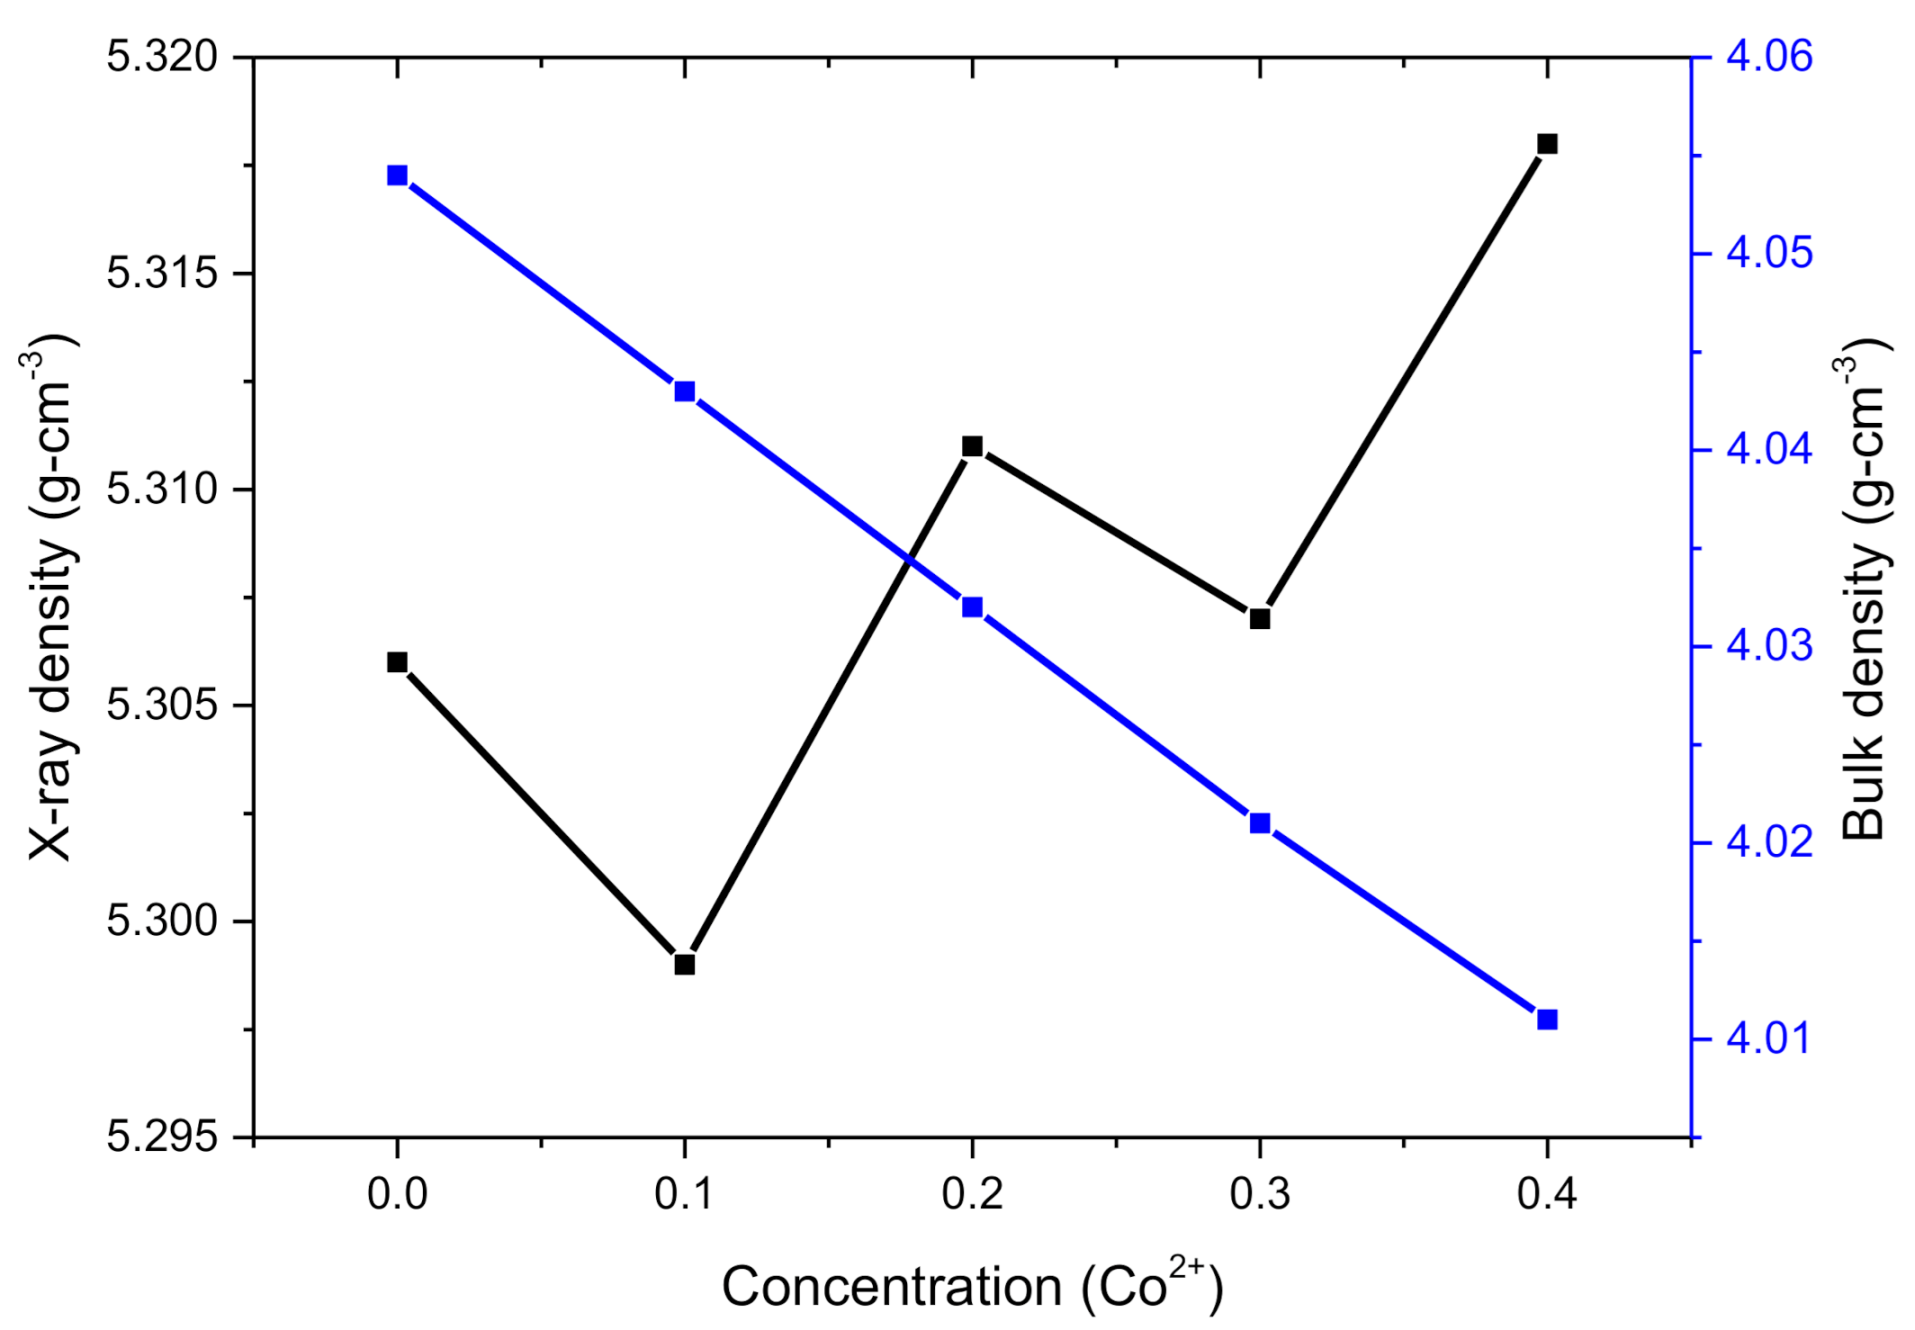
2.1. XRD Analysis

The XRD patterns of Co-doped Cu0.6CoxZn0.4−xFe2O4 soft ferrites where x = 0.0, 0.1, 0.2, 0.3, 0.4 synthesized by coprecipitation technique are shown in Figure 1. The formation of single-phase cubic spinel structure is confirmed by prominent diffraction peaks (220), (311), (400), (422) and (511). XRD pattern confirmed that cobalt is effectively inserted into the spinel structure. By using Scherrer’s relation, the average crystallite size (D) was determined as [9]:
D = 0.9 λ β c o s θ
where λ and β indicate wavelength (1.542 Å) and full width at half maximum (FWHM) of peaks, respectively. Bragg’s law was used to investigate inter planer spacing or distance between crystal planes (d) as [10],
d =   n λ 2 s i n θ
where n = 1 is the order of reflection for cubic structure and θ is the diffraction angle obtained from the XRD pattern. Table 1 shows the calculated values of average crystallite size and the lattice constant by using XRD data. Crystallite size confirmed that nanoferrites have a cubic spinel structure. The average crystallite size was determined in the range of 26.74–16.24 nm for x = 0.0 to 0.4 nanoferrites, correspondingly. Such decreasing behavior of crystallite size is due to the difference in ionic radii of Co2+ (0.74 Å) and Zn2+ (0.82 Å). Due to such difference in ionic radii during the replacement of Co by Zn on the lattice strain, some of the Co ions may reside at grain boundaries and generate stress there. Such behavior may cause a reduction in the crystallite size [11]. Lattice constant (a) was established by applying the equation as:
a =   d h 2 + k 2 + l 2
where d is the interplanar spacing, (hkl) are Miller indices also (a = b = c) and (α = β = γ = 90°). It can be observed from Figure 1 that the most prominent peak (311) is shifting towards the right as the value of 2θ is rising. Such rising factors bring diminution in interplanar spacing, as illustrated in Table 1. Lattice constants are observed in the range of 8.438–8.401 Å. It can be examined that lattice parameters have a decreasing style with the enrichment of Co2+ contents. This decreasing trend is attributed to the substitution of smaller ionic radii Co2+ (0.74 Å) with higher ionic radii Zn2+ (0.82 Å). In addition, the shifting of the most prominent peak (311) and decreasing behavior of interplanar spacing causes the decrease in lattice constant. Furthermore, the doping percentage (0.1%) is very small; hence very small decreasing behavior is shown by the lattice constant. Figure 2 shows the trends demonstrated by average crystallite size and lattice constant with the increase of Cobalt contents. Various other parameters like the volume of the unit cell (V), X-ray density (dx) and bulk density (db) were also determined as enlisted in Table 1 by using the relations as:
V =   a 3
d x =   8 M N A V
d b =   m π r 2 h
where M, NA and V are a molecular mass of compositions, Avogadro’s number is 6.0221 × 10²³ g mol−1 and volume of the unit cell, respectively. In addition, m is mass, r is the radius, and h is the width of nanoferrites pallets. It can be observed from the Table that the volume of the unit cells for spinel ferrites has the same declining trend as the lattice constant. X-ray density was found greater than the bulk density; however, they are presenting opposite natures by means of an increase in Co2+ concentration. Bulk density showed a reducing trend because Co has a lower atomic weight (58.93 amu) and density (8.86 g cm−3) as compared to Zn with atomic weight (65.38 amu) and density (8.91 g cm−3) [12]. Figure 3 demonstrates the trends of dx and db with the increase of Co2+ concentration. Porosity was determined by using the relation as:
P % = 1   d b d x × 100
It can be seen from Table 1 that porosity increased with the increase of cobalt contents. This parameter increase is due to the lower atomic mass of cobalt (58.93 amu) than zinc (65.38 amu).

2.2. Fourier-Transformation Infrared Spectroscopy (FTIR)

FTIR is an excellent method to examine cation allocation at tetrahedral and octahedral sites in soft ferrites. Narrow symmetries in crystalline solids and the existence or extinction of Fe2+ ions are also determined by this tool [13]. Two major absorption bands ν1 and ν2, were shown by the IR spectra of the specimen as in Figure 4. Higher and lower frequency bands (ν1 and ν2) are associated with oxygen-tetrahedron (Fe-O) and oxygen-octahedron (O-Fe-O) bending vibrations, respectively [14]. Both ν1 and ν2 are mostly ascribed to Fe3+-(A/B)-O2− vibrations due to their maximumvalency (+3) in spinel structures. The wave number ranges for ν1 and ν2 are 476.62–462.94 cm−1 and 540.97–524.32 cm−1 correspondingly with Co2+ insertion for present fabricated ferrites. The disparity was noticed in ν1 and ν2 with the increase in the insertion of cobalt contents. The decreasing trend shown by ν2 is due to altering size in the octahedron. The shifting of Fe3+ with Co2+ ions towards the octahedral site causes a decrease in ν2 size. In the same way, the rest of the Co2+ ions reside at the tetrahedral site and cause shrink in ν1. The alterations in Fe3+-O2− bond length at A-site 0.189 nm and at B-site 0.199 nm are responsible for the modifications in-band locations of ν1 and ν2, respectively [12]. The inverse spinel structure is signified by bands ν1 and ν2, where Fe3+ ions are dispersed at A and B sites are based on stoichiometric ratios [15].
The decrease in frequency band ν1 is due to the difference of ionic radii of Co2+ (0.74 Å) and Zn2+ (0.82 Å) at the tetrahedral site and M-O vibrations [12]. The locations of wave numbers (ν1 and ν2), along with the intensities and force constants, are illustrated in Table 2. The force constants were determined by the application of the following relations:
K = 4 π 2 ν 2 C 2 m
where ν, C and m are wave number, speed of light and mass of Fe3+-O2− ions (2.061 × 10⁻²³ g), respectively. It can be observed from Table 2 that determined values of force constants for tetrahedral and octahedral bands are demonstrating decreasing trends. Such decreasing trend may be due to the decrease in ionic radii of tetrahedral and octahedral sites. In addition, the change in Fe3+-O2− internuclear lengths alters the band positions at A and B sites [16,17].

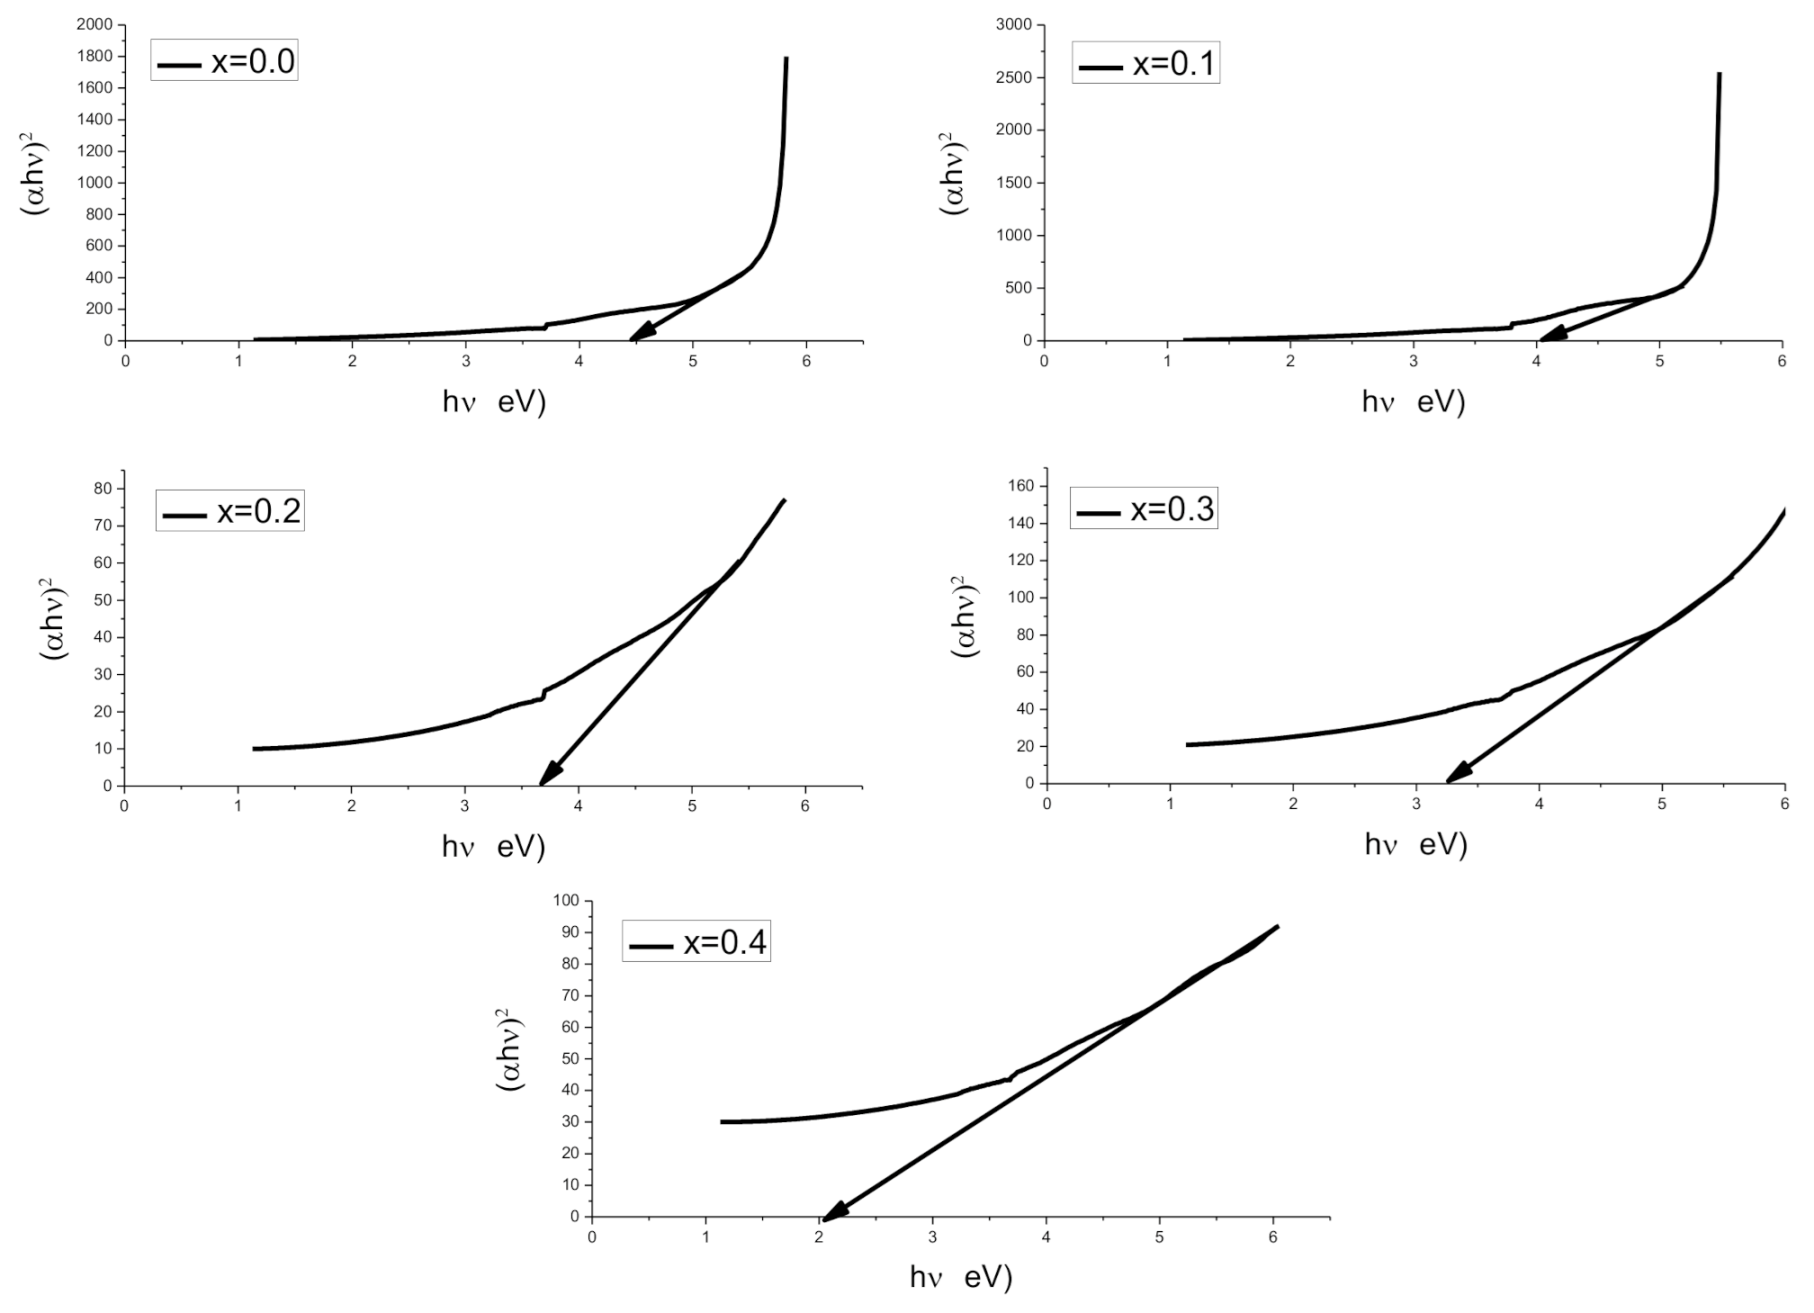
2.3. UV-Vis Spectroscopy

Tauc’s relation was used to determine bandgap energy (Eg) of Co2+-doped Cu0.6CoxZn0.4−xFe2O4 soft ferrites where x = 0.0, 0.1, 0.2, 0.3, 0.4 as given below:
E g = h v λ
α h v = B ( h v E g ) m
where h, ν, B and m are Planck’s constant, frequency and constants, respectively. In this work, Eg has been obtained by drawing a plot between (αhν)2 and incident photon energy (). Eg is decreased by the replacement of Zn2+ with Co2+ concentration, as represented in Tauc’s plot of Figure 5. It is due to the fact that Co is more conductive than Zn. The declining trend of Eg for X = 0.00–0.60 is shown in Table 3. Furthermore, it can be observed from the figure that by the enhancement of Co contents, the curve is becoming more linear.

2.4. Electrical Properties

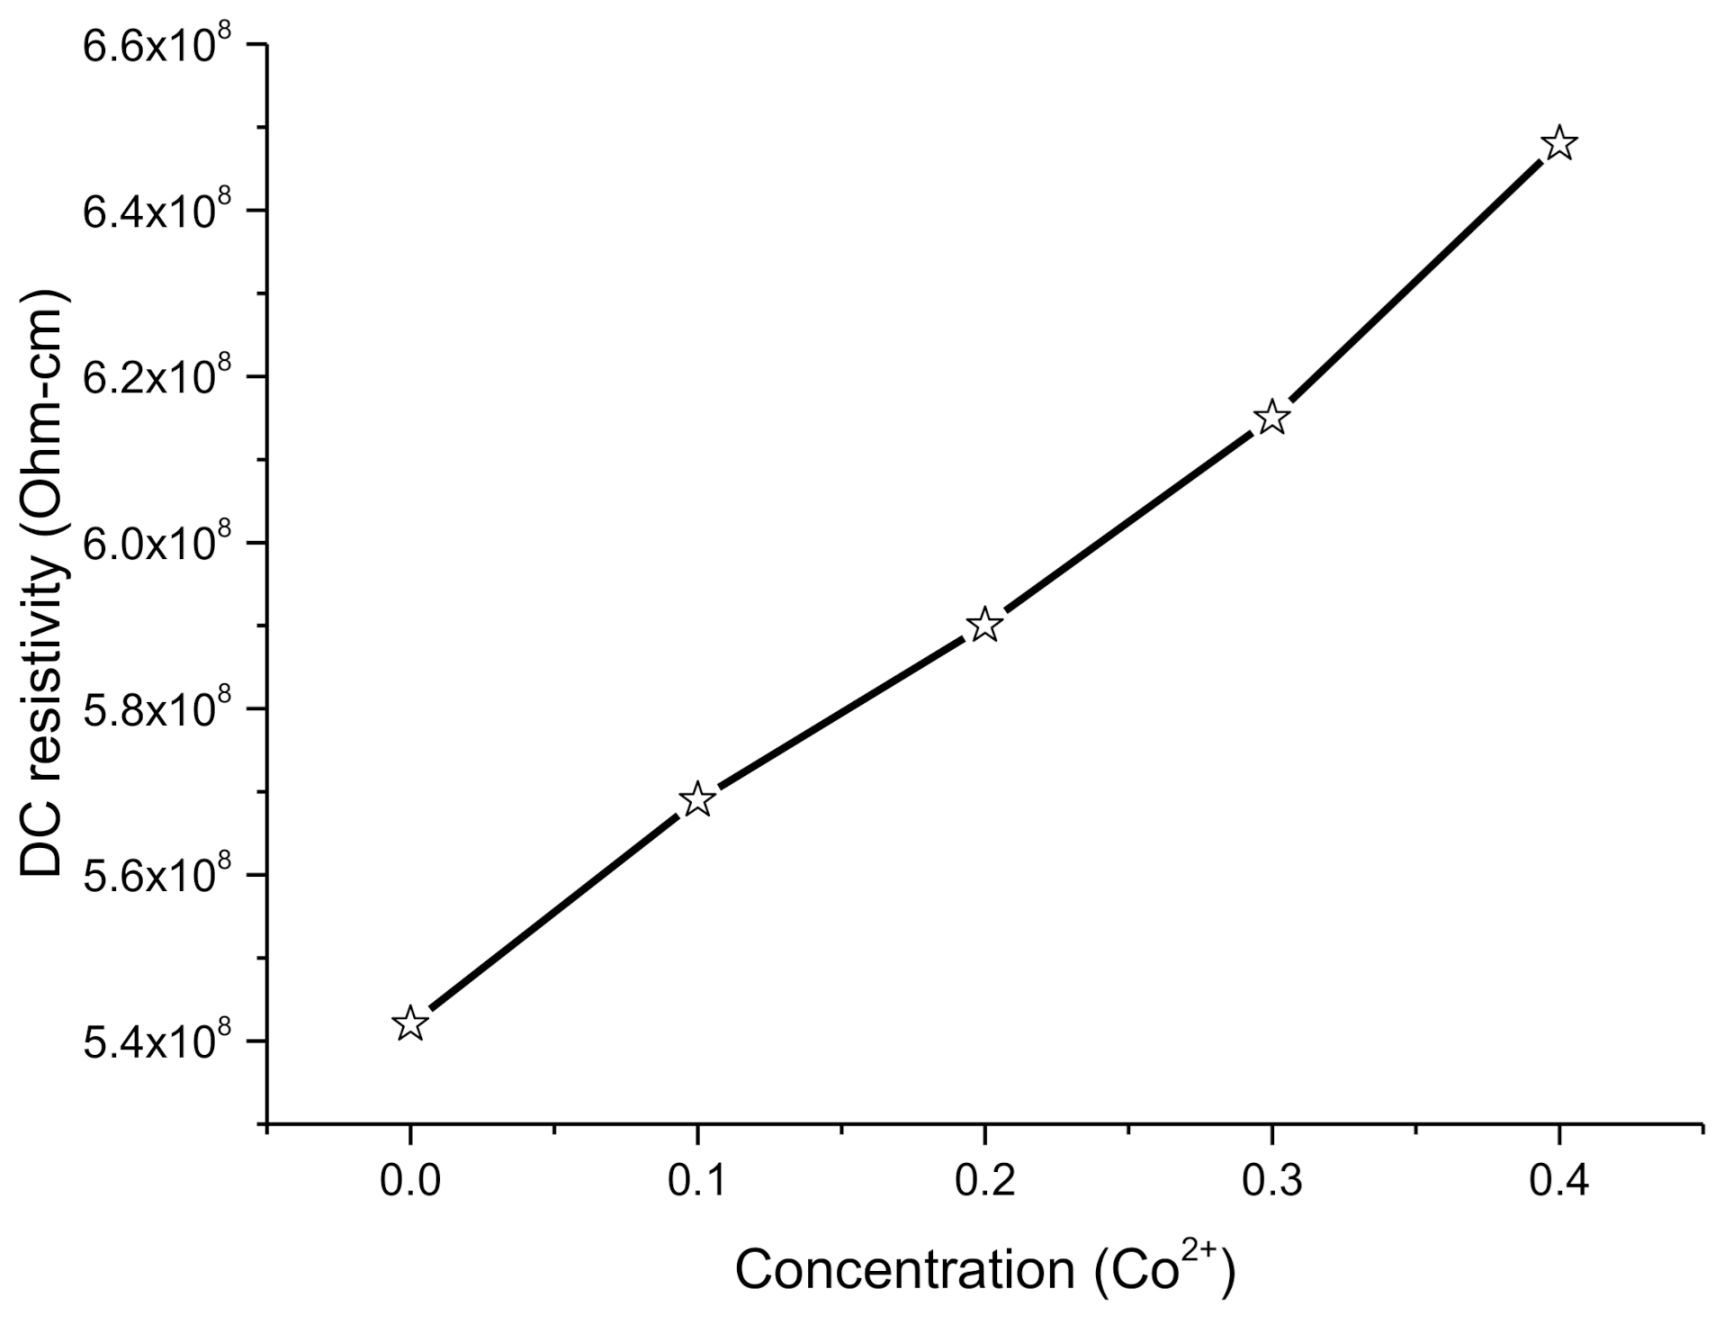
2.4.1. DC Electrical Resistivity

In Co2+ substituted Cu0.6CoxZn0.4-xFe2O4 soft ferrites where x = 0.0, 0.1, 0.2, 0.3, 0.4 synthesized by coprecipitation technique. DC resistivity (ρDC) was carried out by application of four-probe methods at 313 K temperature. ρDC was investigated by employing the equation below as:
ρ D C =   π l n 2 · V I · t
where V and I are current, and voltage and t is the thickness of nanoferrite pallets. Table 3 shows inspected values of DC electrical resistivities forCo2+-doped nanoferrites. The DC electrical resistivity (ρDC) of Co2+ is 5.6 × 10⁻⁸ ohm-cm, while the resistivity (ρDC) of Zn2+ is 5.5 × 10⁻⁸ ohm-cm. It can be observed that ρDC of cobalt is greater than the zinc. Hence, the overall behavior of resistivity must be increased. It can be examined that ρDC is increasing with the increase of Co2+ contents for x = 0.0 to 0.4. The hopping of electrons is responsible for the conduction process in nanoferrites. This conduction process occurs due to the hopping of electrons among Fe2+ and Fe3+ electrons. As Fe2+ ions partially occupy both tetrahedral A-site and octahedral B-site whereas, Co2+ and Zn2+ also partially occupy A-site and B-site. Hence, at A-site, with the increase in Co2+ contents, the Zn2+ contents at B-site decline. Hence, the movement of iron ions from A-site to B-site fulfills the lack of Zn2+ ions at B-site. The decrease in conduction mechanism is because of enhancement in divalent and trivalent iron ions at B-site in soft ferrites, causing the decrease in DC electrical resistivity. Hence, the decrease in DC resistivity confirms the semiconducting behavior of fabricated nanomaterials [18].
The demonstrated behavior of ρDC is also because of factors like grain size and grain boundaries. The grains are superior conductive to the grain boundaries. The incessant series of ions makes the mobility of charge carriers easier. In addition, the resistivity has an inverse relation with the square of grain size. The reduction in grain size may increase the grain boundaries and increase the resistivity [3,19].

2.4.2. Effect of Co on DC Resistivity

The increase of Co concentration in the Co-Cu-Zn ferrites from 0.0–0.4 the DC resistivity (ρDC) was found to increase in the range of 5.42 × 10⁸–6.48 × 10⁸ Ω·cm, as illustrated in the Arrhenius plot of Figure 6. The observed behavior of ρDC with the increase of Co concentration can be described by Verwey and De Boer’s hopping principle [17]. This principle states that the hopping of electrons among the ions of similar elements in different valence conditions, e.g., Fe2+ and Fe3+ ions, scattered erratically over crystallographic lattice sites and create electronic conduction in ferrites [20]. The distances among the ions due to hopping and activation energy are two factors involved in the probability of hopping. The exchange interactions Co2+↔ Co1+ + e1−, Cu2+↔ Cu1+ + e1−, Zn2+↔ Zn1+ + e1−, Fe3+↔ Fe2+ + e1−, etc. are caused for p-type charge transporters in ferrite phases. Co is partially distributed on A and B sites and is responsible for partially replacing the Fe3+ ions on the B-site. Hence, the increasein Co ions replacement at B-site causes the decrease in Fe3+ ions on theB-site. Furthermore, the decrease in activation energy with the increase of Co concentration causes the few Fe ions to relocate from A to B site and reducing the Fe ions at B-site. Hence the cations switching level among Fe2+ and Fe3+ enhances. As a result, resistivity increases with the increase of Co contents inCo-Cu-Zn nanoferrites. In addition, the illustrated resistivity range (108 Ω-cm) of fabricated ferrites is highly applicable in telecommunication devices [21,22].

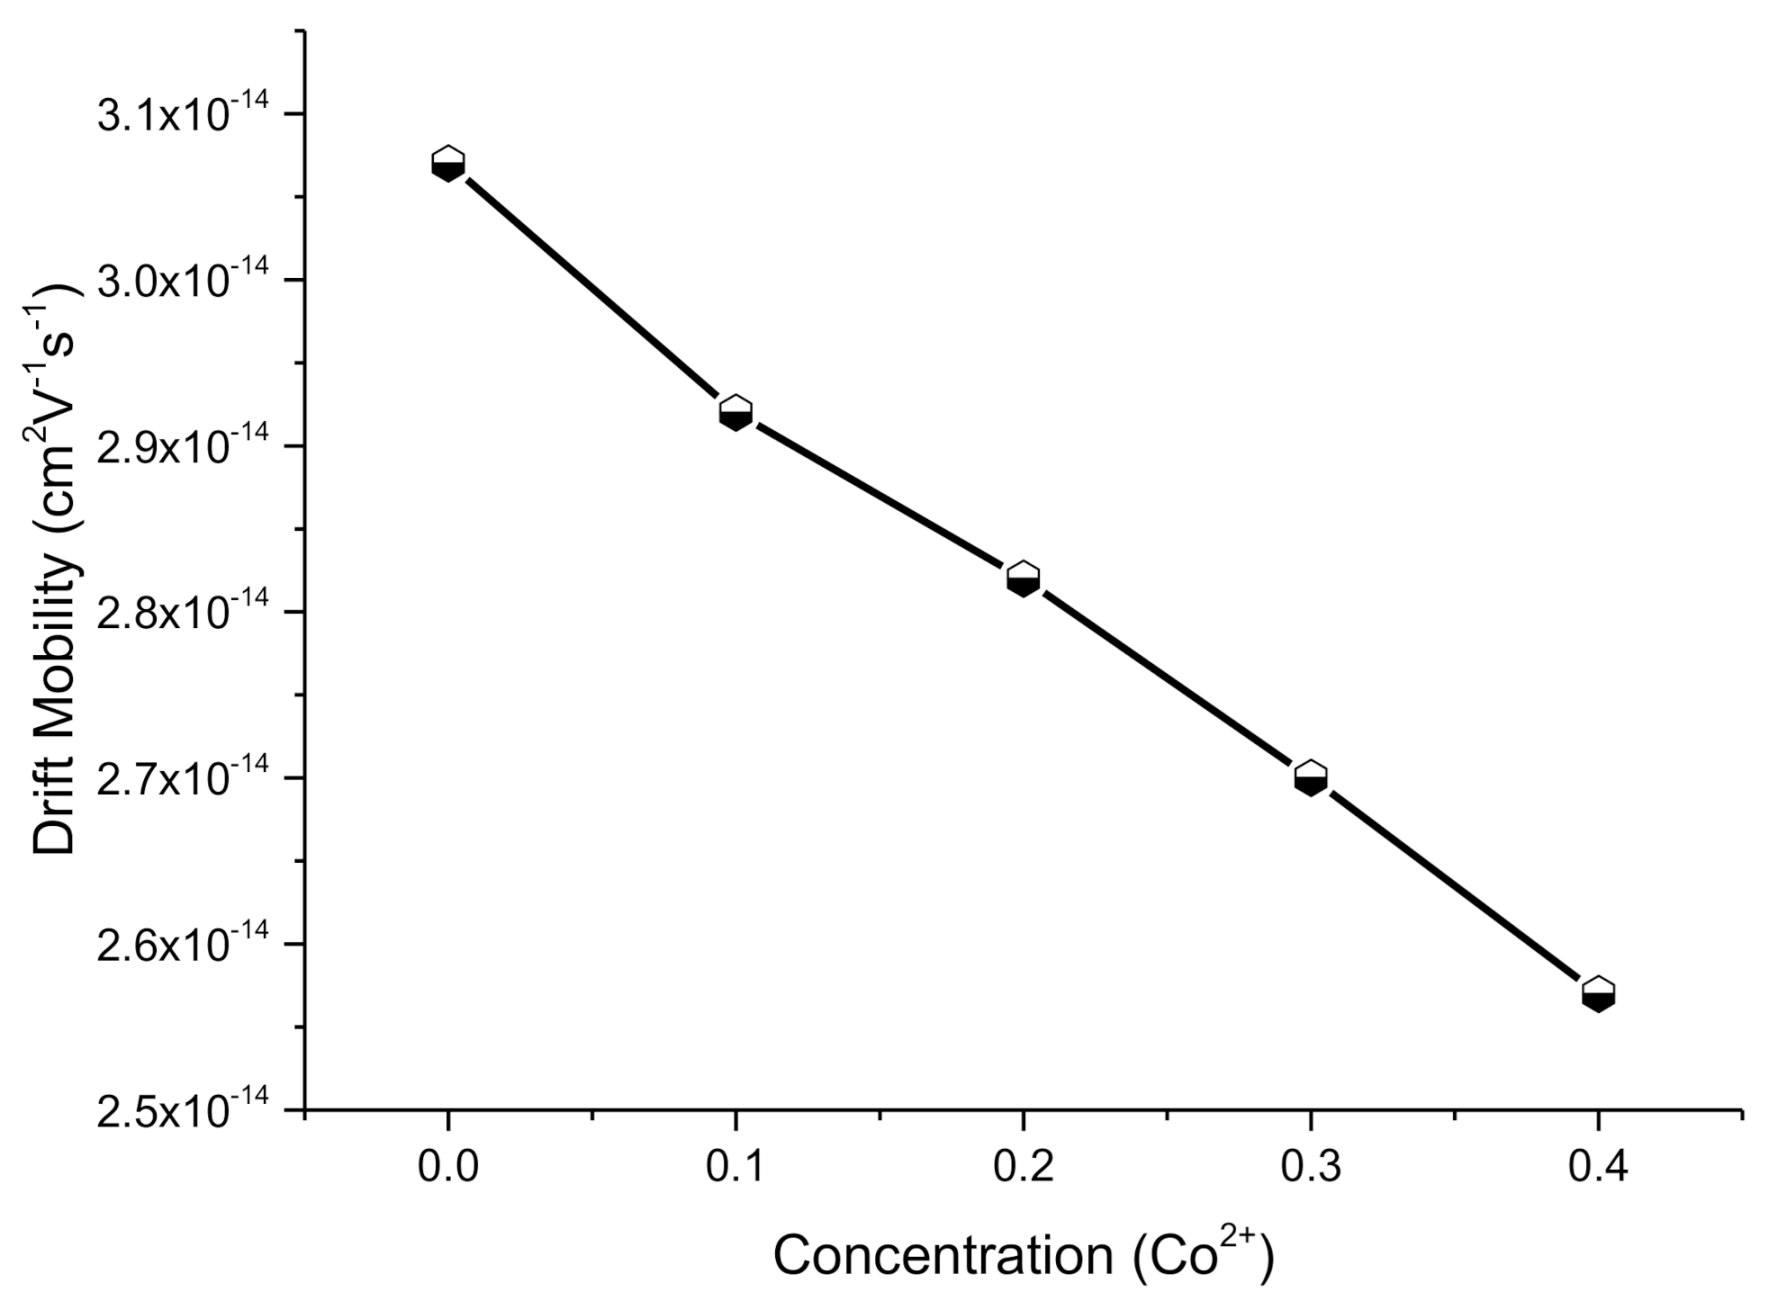
2.4.3. Drift Mobility

The following relation was utilized to determine the drift mobility (μd) as:
μ d =   1 η e ρ D C
where η and e are the concentration of charge carriers and charge of electrons, respectively. The concentration of charge carriers (η) can be established by using the relation as:
η =   N A ρ b P F e M
where NA is the Avogadro number having value 2.022 × 10²³ mol−1, ρb is bulk density, PFe is a number of compositional trivalent iron atoms, and M is the molecular weight of composed nanoferrites. The determined drift mobility (μd) values for all Co-doped Co-Cu-Zn soft ferrites were found to increaseas enlisted in Table 3. Drift mobility reduced from 3.07 × 10⁻¹⁴ to 2.57 × 10⁻¹⁴ cm2V−1s−1 for x = 0.0–0.4 nanoparticles, respectively. Results indicated that the specimens with greater resistivity have short mobility and vice versa. With anincrease in temperature, the μd decreased. The decreasing trend shown in Figure 7 shows that alteration in charge carrier mobility was due to dissimilarity in resistivity by means of temperature. Thus, with arise in temperature, the charge carriers started hopping between the sites, illustrating the increase in resistivity and enhancement in drift mobility for nanoferrites.

3. Materials and Methods

Co2+-substituted Cu0.6CoxZn0.4−xFe2O4 where x = 0.0, 0.1, 0.2, 0.3, 0.4 nanoparticles were synthesized by coprecipitation method. Nitrates of copper, cobalt, zinc and iron were usedto prepare Co-doped Cu0.6CoxZn0.4−xFe2O4 nanoferrites. The stoichiometric ratios of desired salts were dissolved in deionized water. The solutions were stirred at 80 °C, and sodium hydroxide (NaOH) mixed in water was added to maintaina pH of 11. The resulting solutions were placed in a water bath at 80 °C for 24 h, followedby filtration. The particles were cleaned with deionized water followed by ethanol until apH of 7 was achieved. The obtained crystals were dried in the oven and ground into afine powder. The resulting powder of each sample was sintered at 800 °C for 8 h. The whole synthesis process is shown in Figure 8.
The structures of nanoferrites were determined using various techniques. X-ray powder diffraction (Bruker D8) scheme with Cu Kα supply having wavelength 1.5406 Å was used to authenticate arrangements of single-phase spinel cubic formation in all synthesized nanoferrites. Numerous structural parameters, including crystallite size, lattice constant, density (bulk and X-ray), porosityand dislocation density, were computed by XRD analysis. In order to determine the bulk density, pallets of nanoferrites were fabricated with radius (r = 0.35 cm) and width (h = 0.153 cm). For this purpose, a hydraulic press machine was used at 13 t pressure for 30 min for each pallet. UV-vis spectroscopy was used to determine bandgap energy (Eg) of all specimens. Adsorption bands and force constant were calculated by (Perkin) FTIR spectroscopy. The four-probe I–V technique was utilized to study the DC electrical resistivity and drift mobility.

4. Conclusions

Ferrite nanoparticles were prepared by the coprecipitation method. The insertion of cobalt in Cu0.6CoxZn0.4−xFe2O4 ferrites brought novel modifications in structural, optical and electrical characteristics. XRD, FTIR, UV-vis and four-probe I–V techniques were used to characterize the samples. The lattice constant decreased with the increase of cobalt due to the smaller ionic radius of cobalt than the zinc. Crystallite size, X-ray density, bulk density and porosity were also measured. Both absorption bands (tetrahedral and octahedral), along with their corresponding intensities, decreased with the increase of cobalt contents leading to adecrease in force constants for composed nanoferrites. DC electrical resistivity increased with the increase of cobalt concentration, confirming the semiconductor nature of composed nanoferrites. The determined range of DC electrical resistivity indicated that these fabricated materials are highly applicable in telecommunication devices.

Author Contributions

Conceptualization, W.A.F. and M.A.; methodology, A.R.A.; software, M.S.U.H.; validation, M.I.K., W.A.F. and A.H.; formal analysis, M.A.Q.; investigation, W.A.F.; resources, M.A.A.; data curation, N.Y.; writing—original draft preparation, M.I.K., M.A.; writing—review and editing, M.S.U.H., and A.R.A.; visualization, A.H.; supervision, W.A.F.; project administration, M.A.; funding acquisition, W.A.F. All authors have read and agreed to the published version of the manuscript.

Funding

This research was funded by the Deanship of Scientific Research at King Saud University, grant number RG-1345-059.

Data Availability Statement

No new data were created or analyzed in this study.

Acknowledgments

The authors would like to extend their sincere appreciation to the Deanship of Scientific Research at King Saud University for funding under Research Group Project No. RG-1435-059.

Conflicts of Interest

The authors declare no conflict of interest.

Sample Availability

Not available.

References

  1. Bhukal, S.; Singhal, S. Magnetically separable copper substituted cobalt–zinc nano-ferrite photocatalyst with enhanced photocatalytic activity. Mater. Sci. Semicond. Process. 2014, 26, 467–476. [Google Scholar] [CrossRef]
  2. Anu, K.; Hemalatha, J. Magnetic and electrical conductivity studies of zinc doped cobalt ferrite nanofluids. J. Mol. Liq. 2019, 284, 445–453. [Google Scholar] [CrossRef]
  3. Prasad, B.V.; Ramesh, K.; Srinivas, A. Co0.5-xCuxZn0.5Fe2O4 (0 ≤ x ≤ 0.25) nano crystalline ferrites: Structural, magnetic and electric properties. Solid State Sci. 2020, 107, 106325. [Google Scholar] [CrossRef]
  4. Warsi, M.F.; Iftikhar, A.; Yousuf, M.A.; Sarwar, M.I.; Yousaf, S.; Haider, S.; Aboud, M.F.A.; Shakir, I.; Zulfiqar, S. Erbium substituted nickel–cobalt spinel ferrite nanoparticles: Tailoring the structural, magnetic and electrical parameters. Ceram. Int. 2020, 46, 24194–24203. [Google Scholar] [CrossRef]
  5. Somvanshi, S.B.; Khedkar, M.V.; Kharat, P.B.; Jadhav, K. Influential diamagnetic magnesium (Mg2+) ion substitution in nano-spinel zinc ferrite (ZnFe2O4): Thermal, structural, spectral, optical and physisorption analysis. Ceram. Int. 2020, 46, 8640–8650. [Google Scholar] [CrossRef]
  6. Hasan, M.; Arshad, M.; Ali, A.; Mahmood, K.; Amin, N.; Ali, S.; Khan, M.; Mustafa, G.; Khan, M.; Saleem, M. Mg and La co-doped ZnNi spinel ferrites for low resistive applications. Mater. Res. Express 2018, 6, 016302. [Google Scholar] [CrossRef]
  7. Kaiser, M. Influence of V2O5 ion addition on the conductivity and grain growth of Ni–Zn–Cu ferrites. Curr. Appl. Phys. 2010, 10, 975–984. [Google Scholar] [CrossRef]
  8. Ponhan, W.; Maensiri, S. Fabrication and magnetic properties of electrospun copper ferrite (CuFe2O4) nanofibers. Solid State Sci. 2009, 11, 479–484. [Google Scholar] [CrossRef]
  9. Amin, N.; Hasan, M.S.U.; Majeed, Z.; Latif, Z.; un Nabi, M.A.; Mahmood, K.; Ali, A.; Mehmood, K.; Fatima, M.; Akhtar, M. Structural, electrical, optical and dielectric properties of yttrium substituted cadmium ferrites prepared by Co-Precipitation method. Ceram. Int. 2020, 46, 20798–20809. [Google Scholar] [CrossRef]
  10. Khan, M.; Waqas, M.; Naeem, M.; Hasan, M.; Iqbal, M.; Mahmood, A.; Ramay, S.M.; Al-Masry, W.; Abubshait, S.A.; Abubshait, H.A. Magnetic behavior of Ga doped yttrium iron garnet ferrite thin films deposited by sol-gel technique. Ceram. Int. 2020, 46, 27318–27325. [Google Scholar] [CrossRef]
  11. Rajeshwari, A.; Punithavthy, I.K.; Jeyakumar, S.J.; Lenin, N.; Vigneshwaran, B. Dependance of lanthanum ions on structural, magnetic and electrical of manganese based spinel nanoferrites. Ceram. Int. 2020, 46, 6860–6870. [Google Scholar] [CrossRef]
  12. Sujatha, C.; Reddy, K.V.; Babu, K.S.; Reddy, A.R.; Suresh, M.B.; Rao, K. Effect of Mg substitution on electromagnetic properties of NiCuZn ferrite. J. Magn. Magn. Mater. 2013, 340, 38–45. [Google Scholar] [CrossRef]
  13. Iyer, R.; Desai, R.; Upadhyay, R. Low temperature synthesis of nanosized Mn1-xCdxFe2O4 ferrites. NISCAIR Online Period. Repos. 2009, 2, 180–185. [Google Scholar]
  14. Hemeda, O.M.; Barakat, M.M.; Hemeda, D.M. Structural, electrical and spectral studies on double rare-earth orthoferrites La_ {1-x} Nd_xFeO_3. Turk. J. Phys. 2004, 27, 537–550. [Google Scholar]
  15. Patil, S.; Mahajan, V.; Ghatage, A.; Lotke, S. Structure and magnetic properties of Cd and Ti/Si substituted cobalt ferrites. Mater. Chem. Phys. 1998, 57, 86–91. [Google Scholar] [CrossRef]
  16. Shannon, R.D. Revised effective ionic radii and systematic studies of interatomic distances in halides and chalcogenides. Acta Crystallogr. Sect. A Cryst. Phys. Diffr. Theor. Gen. Crystallogr. 1976, 32, 751–767. [Google Scholar] [CrossRef]
  17. Verwey, E.; De Boer, J. Cation arrangement in a few oxides with crystal structures of the spinel type. Recl. Trav. Chim. Pays Bas 1936, 55, 531–540. [Google Scholar] [CrossRef]
  18. Raghasudha, M.; Ravinder, D.; Veerasomaiah, P. Electrical resistivity studies of Cr doped Mg nano-ferrites. Mater. Discov. 2015, 2, 50–54. [Google Scholar] [CrossRef]
  19. Yousuf, M.A.; Baig, M.M.; Waseem, M.; Haider, S.; Shakir, I.; Khan, S.U.-D.; Warsi, M.F. Low cost micro-emulsion route synthesis of Cr-substituted MnFe2O4 nanoparticles. Ceram. Int. 2019, 45, 22316–22323. [Google Scholar] [CrossRef]
  20. Lakshman, A.; Rao, P.S.; Rao, B.P.; Rao, K. Electrical properties of In3+ and Cr3+ substituted magnesium–manganese ferrites. J. Phys. D Appl. Phys. 2005, 38, 673. [Google Scholar] [CrossRef]
  21. Kambale, R.; Shaikh, P.; Kamble, S.; Kolekar, Y. Effect of cobalt substitution on structural, magnetic and electric properties of nickel ferrite. J. Alloy. Compd. 2009, 478, 599–603. [Google Scholar] [CrossRef]
  22. Mallapur, M.; Shaikh, P.; Kambale, R.; Jamadar, H.; Mahamuni, P.; Chougule, B. Structural and electrical properties of nanocrystalline cobalt substituted nickel zinc ferrite. J. Alloy. Compd. 2009, 479, 797–802. [Google Scholar] [CrossRef]
Figure 1. XRD patterns of Cu0.6CoxZn0.4−xFe2O4 soft ferrites where x = 0.0, 0.1, 0.2, 0.3, 0.4.
Molecules 26 01399 g001
Figure 2. Trends for crystallite size and lattice constant with the increase of Co2+ concentration.
Molecules 26 01399 g002
Figure 3. X-ray density and bulk density for Co2+-inserted soft ferrites.
Molecules 26 01399 g003
Figure 4. FTIR spectra of synthesized nanoferrites.
Molecules 26 01399 g004
Figure 5. Bandgap energies (Eg) of Cu0.6CoxZn0.4−xFe2O4 soft ferrites where x = 0.0, 0.1, 0.2, 0.3, 0.4.
Molecules 26 01399 g005
Figure 6. DC electrical resistivity for Cu0.6CoxZn0.4-xFe2O4 soft ferrites where x = 0.0, 0.1, 0.2, 0.3, 0.4.
Molecules 26 01399 g006
Figure 7. Drift mobility for Cu0.6CoxZn0.4−xFe2O4 soft ferrites where x = 0.0, 0.1, 0.2, 0.3, 0.4.
Molecules 26 01399 g007
Figure 8. Schematic of the experimental setup.
Molecules 26 01399 g008
Table 1. of (311) peak, lattice constant (aexp), crystallite size (D), unit cell volume (V), d-spacing (d), X-ray and bulk densities (dx and db) and porosity (P) for Cu0.6CoxZn0.4−xFe2O4 soft ferrites where x = 0.0, 0.1, 0.2, 0.3, 0.4.
ParameterX = 0.000.10.20.30.4
of (311) peak35.3235.3435.4035.4335.48
aexp (Å)8.4388.4348.4208.4158.401
D (nm)26.7422.2822.9716.2421.84
V (Å)3600.78599.93596.98595.88592.91
d (Å)2.5442.5422.5382.5352.533
dx(g-cm−3)5.3065.2995.3115.3075.318
db (g-cm−3)4.0544.0434.0324.0214.011
P (%)23.5923.7024.0824.2324.57
Table 2. FTIR band spectrum showing absorption bands (ν1 and ν2), intensities (I1 and I2) and force constants (KT and Ko).
XV1
(cm−1)
I1
(%)
KT × 105
(Dyne cm−1)
V2
(cm−1)
I2
(%)
Ko × 105
(Dyne cm−1)
0.0540.9762.742.15476.6264.051.66
0.1538.7359.732.13473.8367.191.64
0.2537.4954.442.12472.8662.111.63
0.3524.7762.312.03467.8763.141.60
0.4524.3247.462.02462.9447.271.56
Table 3. Bandgap energy (Eg), electrical resistivity (ρDC) and drift mobility (µd) for nanoferrites.
ParametersResults
X0.00.10.20.30.4
Eg (eV)4.444.053.643.232.05
ρDC(Ω·cm)5.42 × 1085.69 × 1085.90 × 1086.15 × 1086.48 × 108
µd (cm2V−1s−1)3.07 × 10−142.92 × 10−142.82 × 10−142.70 × 10−142.57 × 10⁻¹⁴
Publisher’s Note: MDPI stays neutral with regard to jurisdictional claims in published maps and institutional affiliations.

