Abstract
It has been reported that monoamine neurotransmitters can be produced by gut microbiota, and that several related metabolites of amino acids in these pathways are associated with nervous system (NVS) diseases. Herein, we focused on three pathways, namely, phenylalanine (Phe), tryptophan (Trp), and glutamic acid (Glu), and established an underivatized liquid chromatography–tandem mass spectrometry (LC-MS/MS) method for the quantification of nineteen monoamine neurotransmitters and related metabolites in the gut microbiota. The neurotransmitters and related metabolites included Phe, tyrosine (Tyr), l-dopa (Dopa), dopamine (DA), 3-methoxytyramine, Trp, hydroxytryptophan, 5-hydroxytryptamine (5-HT), 5-hydroxyindole-3-acetic acid (5-HIAA), kynurenine (KN), kynurenic acid (KYNA), melatonin, tryptamine (TA), indole-3-lactic acid (ILA), indole-3-acetic acid (IAA), indolyl-3-propionic acid (IPA), Glu, gamma-aminobutyric acid (GABA), and acetylcholine (Ach). A fluoro-phenyl bonded column was used for separation, and the mobile phase consisted of methanol:acetonitrile (1:1) and water, with 0.2% formic acid in both phases. The compounds exhibited symmetric peak shapes and sufficient sensitivity under a total analysis time of 8.5 min. The method was fully validated with acceptable linearity, accuracy, precision, matrix effect, extraction recovery, and stability. The results showed that neurotransmitters, such as Dopa, DA, 5-HT, GABA, and Ach, were present in the gut microbiota. The metabolic pathway of Trp was disordered under depression, with lower levels of 5-HT, 5-HIAA, KN, KYNA, TA, ILA, IAA, IPA, and Glu, and a higher ratio of KYNA/KN. In addition, some first-line NVS drugs, such as sertraline, imipramine, and chlorpromazine, showed regulatory potential on these pathways in the gut microbiota.
1. Introduction
Nervous system (NVS) diseases are causing increasing problems globally [1]. According to the reports of the World Health Organization, fast-paced work or increased pressure cause depression, anxiety, schizophrenia, etc.; while the neurodegenerative diseases caused by aging (such as Alzheimer’s disease and Parkinson’s disease) have influenced the quality of daily life to a considerable extent [2]. The development of disease in NVS is always accompanied by an abnormal transportation and metabolism of neurotransmitters at specific locations in the brain [3]. However, the mechanisms of these diseases are complex and associated with multiple aspects, including genetic, environmental, and physiological factors [4,5]. The mechanisms of NVS diseases have not been fully clarified [6,7].
In recent years, the concept of the “gut–brain” axis has provided new insight into the pathogenic mechanism of NVS diseases. The metabolism of the gut microbes is closely related to emotion and behavior [8], and a chemical dialog connects the host and gut microbiome [3,8]. First, several monoamine neurotransmitters, such as gamma-aminobutyric acid (GABA) [9], tryptamine (TA) [10], catecholamines, and serotonin (5-HT) [11], have been reported to be generated or metabolized by gut microbes. These absorbed molecules in vivo could regulate central and peripheral NVS functions via signaling pathways [12]. Second, gut microbes themselves, or their monoamine metabolites on amino acid catabolism pathways (kynurenine, etc.) can activate neural pathways or the immune system and then affect the neuronal transcription in the host’s brain, leading to the changes in host behavior [13,14]. On the other hand, the central NVS can regulate the status of the gastrointestinal tract or enteric NVS by secreting signal molecules, mediated by sympathetic and parasympathetic branches or the hypothalamus–pituitary–adrenal axis, which correspondingly affect the colonization or the metabolism of intestinal bacteria [15]. Though much remains to be explored, these metabolites on amino acid pathways have been uncovered as signals in the gut microbiota, and they play essential roles in the microbiota–host crosstalk [16].
The reported main amino acid pathways in the NVS and gut microbiota included three pathways: the phenylalanine (Phe) pathway, glutamic acid (Glu) pathway, and tryptophan (Trp) pathway [8,16]. In the Phe pathway in vivo, ingested Phe could be transformed into tyrosine (Tyr) through hydroxylation, and then l-dopa (Dopa) and dopamine (DA) were produced, which were further metabolized into 3-methoxytyramine (MT) [17]. MT is a novel neuromodulator involved in the control of movement [17,18]. Several neurotransmitters could be generated or transformed by gut microbes [19,20]. In the metabolic pathway of Glu, Glu and its metabolite GABA are known as key excitatory or inhibitory neurotransmitters in the NVS, and dysfunctions in signal transduction are closely related to depression [9,21]. Acetylcholine (Ach), an important compound for transmitting information between neurons, participated in the regulation of learning and memory [22], and has been reported to be produced by Lactobacillus [23]. The metabolism of Trp has been illustrated in several research studies [8,16,24], and multiple pathways are involved. (1) 5-Hydroxytryptophan (5-HTP) and 5-hydroxytryptamine (5-HT), derived from Trp by a hydroxylase, are related to anxiety and depression, and the subsequent metabolite 5-hydroxyindole-3-acetic acid (5-HIAA) is associated with aggressive and depressive behaviors [25,26]. Another metabolite, melatonin (MLT), is involved in the regulation of sleep [27]. (2) Kynurenine (KN) and kynurenic acid (KYNA) can be generated by bacterial indoleamine 2,3-dioxygenase (IDO) 1 [16], and both of them are regulators in central NVS and gastrointestinal functions [28,29,30]. (3) Tryptamine (TA), produced by the bacterial decarboxylase from Trp, is responsible for mental and physical stress [31], and its derivatives generated in gut microbiota, such as indole-3-acetic acid (IAA), indole-3-propionic acid (IPA), and indole-3-lactic acid (ILA), are signal molecules that regulate intestinal permeability and host immunity, thereby affecting the function of the NVS [16,24]. The roles of these above mentioned monoamine neurotransmitters and metabolites in the pathogenesis of NVS disease (mediated by gut microbiota) are being increasingly unveiled [8,16,20,21,23,24]. Deciphering the internal associations between these pathways might facilitate pathological research and drug development targeting gut microbiota. While a rapid and accurate method, or platform, for the quantification of these molecules is essential.
For years, fluorescence detection (EC) and electrochemical detection (ECD) have been common methods for analyzing monoamine neurotransmitters in body fluids, since they allow quick and inexpensive detection [32,33]. However, their main limitations are that only a subset of molecules can be detected within one sample, and the sensitivity of different neurotransmitters varies greatly [34]. With the development of liquid chromatography–tandem mass spectrometry (LC-MS/MS), several methods have been published targeting neurotransmitters in brain or extracellular fluid [34,35,36,37,38]. However, publications on the level of monoamines in gut microbiota have been sporadic. To our knowledge, no comprehensive method has been reported to quantify these functional monoamines, validated in fecal or intestinal bacterial samples, and for targeting all three pathways on phenylalanine, tryptophan, and glutamic acid. Here, we aimed to establish a simple and sensitive LC–MS/MS method for these nineteen monoamine neurotransmitters and related functional metabolites in the gut microbiota, and aimed to apply it to NVS research and drug screening.
2. Results and Discussion
2.1. Method Development
The development and optimization of this method for the nineteen monoamine neurotransmitters and related metabolites (in Figure 1) included three parts: (1) chromatographic conditions, (2) mass spectrometric conditions, and (3) sample preparation. In this study, considering that most of the metabolites were highly polarized, they could hardly be retained on conventional C18 columns, and matrix interference may have occurred. Therefore, a HSS PFP column was used to achieve the separation, the stationary phase of which was high-strength bonded silica with pentafluorophenyl ligand. The separation principle was composed of multiple factors, including hydrogen bonds, dipole–dipole interactions, and aromatic (π−π) and hydrophobic interactions. Then, polar metabolites with similar structures could be successfully separated without interference between peaks, eliminating the complex steps of derivatization treatment. Moreover, this column is favorable for nonprofessional researchers to operate when compared with hydrophilic interaction liquid chromatography columns, which have higher durability like frequently used C18 columns. The column temperature was maintained at 35 °C, as suggested.
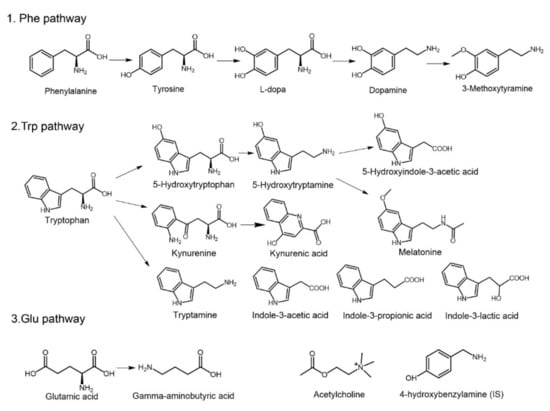
Figure 1.
Structures and pathways of the nineteen monoamine neurotransmitters and related metabolites. Phenylalanine (Phe), tyrosine (Tyr), l-dopa (Dopa), dopamine (DA), 3-methoxytyramine (MT), tryptophan (Trp), hydroxytryptophan (5-HTP), 5-hydroxytryptamine (5-HT), 5-hydroxyindole-3-acetic acid (5-HIAA), kynurenine (KN), kynurenic acid (KYNA), melatonin (MLT), tryptamine (TA), indole-3-lactic acid (ILA), indole-3-acetic acid (IAA), indolyl-3-propionic acid (IPA), glutamic acid (Glu), gamma-aminobutyric acid (GABA), acetylcholine (Ach), and 4-hydroxybenzylamine (internal standard, IS).
In terms of the selection of mobile phase, because almost all the neurotransmitters contained amino and hydroxyl groups, the mass spectrometric response of these compounds would increase under acidic conditions, and therefore, the pH value of the mobile phase was adjusted to acidity. Finally, a 0.2% concentration of formic acid was chosen because of its preferable peak shape and acceptable response by comparing various levels of formic acid, acetic acid (0.05%, 0.1%, 0.2%, 0.5%), or the combination of an acid with ammonium formate/ammonium acetate (1 mM, 2 mM, 5 mM, 10 mM). In addition, the combination of methanol and acetonitrile (v:v = 1:1) was selected for better response and proper retention time.
The mass spectrometric conditions, including gas flow, gas pressure, and interface temperature, were adjusted according to the response of the metabolites. The collision energy (CE) of detection for each metabolite was optimized separately (as shown in Table 1). In the pretreatment process, the peak shape and stability of the compounds were taken into consideration. Protein precipitation by acetonitrile showed better performance than that by methanol, while some metabolites, such as 5-HT, 5-HIAA, and IAA etc., were unstable upon analysis. Formic acid or ascorbic acid has been reported to increase the stability of neurotransmitters in brain samples [39,40]. However, addition of ascorbic acid led to an increase in the response of 5-HIAA and 5-HT over time, and lowered the response of 5-HTP in the matrix of the gut microbiota. Finally, 2% formic acid was added (to acetonitrile) to stabilize these metabolites before analysis. The drying and resolvation procedures were constructed to obtain a good peak shape and preferable sensitivity.

Table 1.
Optimized multiple reaction monitoring (MRM) condition and mass spectrometer parameters (CE: Collision energy).
2.2. Method Validation
Currently, there is no unified guideline for the methodical validation of endogenous substances, although this is indispensable in biological analysis. Some strategies have been reported, including (1) adding authentic analytes into the real matrix, (2) adding surrogate analytes via stable isotope-labeled internal standards into the real matrix, and (3) using a surrogate matrix by adding authentic analytes [41]. The second strategy is accepted as the most accurate and convenient strategy for analyzing endogenous substances, while it is relatively expensive and difficult to acquire all nineteen stable isotope-labeled compounds. Preliminary experiments showed that these endogenous analytes could not be completely removed by conventional procedures, including the adsorption of activated carbon or hydrolysis under alkaline conditions. Furthermore, any surrogate matrix, whether water, buffer, synthetic matrix, or treated matrix, may have different matrix effects compared with the untreated authentic matrix, leading to a possible system error in the true level of these compounds in practical samples. Herein, authentic analytes were added to the real matrix for method validation.
2.2.1. Specificity and Carryover
The specificity of this method is shown using graphs of standards in solvent, authentic samples, and standard-spiked authentic samples (Figure 2a–c). Specificity was evaluated by adding standards to the matrix, and comparing the retention time of the peak that correspondingly increased in area. The retention time of each analyte in the intestinal bacterial sample was identical after addition of standards, and no endogenous interference was observed in the real matrix under current conditions (Figure 2a–c). The carryover effect results showed that after consecutive injections of high concentrations of analytes, no residual effects existed, as shown in Figure 2d.
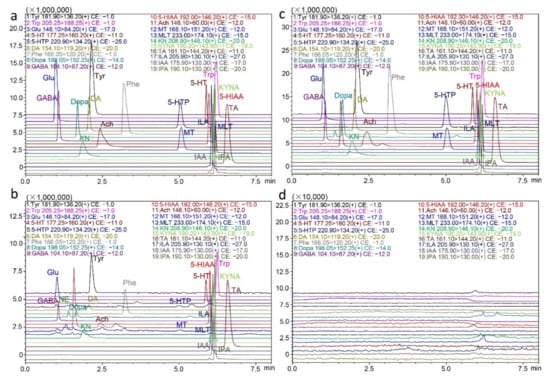
Figure 2.
Representative extracted ion chromatograms of the nineteen neurotransmitters and metabolites. (a) In standards, (b) in practical fecal samples, (c) in fecal samples spiked with standards, and (d) in blank solvent injected after consecutive injections of high concentrations of analytes.
2.2.2. Linearity and LLOQ
The linearity of the calibration curve was calculated by the least square method in mixed intestinal bacterial samples, with a weighting factor of 1/X for fitting. The retention time (Rt), linear range and correlation coefficient are listed in Table 2. The correlation coefficients of all the analytes were above 0.99, and the nonzero calibrators of every analyte met the acceptance criteria in each validation run, indicating satisfactory linearity over the whole range. Specifically, considering that the levels of those metabolites varied greatly in the intestinal bacterial samples, the linear range of the compounds was established according to their baseline levels. For example, amino acids such as Glu, Tyr, Phe, and Trp were present at micrograms per milliliter in the matrix, and their linear range was correspondingly higher (500–50,000 ng/mL) after adjustment. The lowest limit of quantification (LLOQ) of this method was the lowest point in the calibration curve, ranging from 0.01 ng/mL to 500 ng/mL (with acceptable accuracy and precision). The instrumental lowest limit of detection (LLOD) and LLOQ data were collected in a blank solvent, due to the lack of analyte-free matrix. Results are shown in Table 2 (instrumental LLOD for each analyte, 0.005–5 ng/mL; instrumental LLOQ for each analyte, 0.01–10 ng/mL).
Table 2.
Retention time, and linear range for each compound.
2.2.3. Accuracy and Precision
The intra- and inter-day accuracy and precision assays were performed on three consecutive days with five repeats. The results of each analyte are summarized in Table 3. The intra-day accuracy results (relative error, RE) of the nineteen compounds were within −11.58%–11.49% of the nominal level, and the relative standard derivation (RSD) was in the range of 1.56%–10.15%. The inter-day accuracy results (RE) were within −11.27%–6.69% of the nominal value, and the RSD values were in the range of 2.16%–10.42%. The accuracy and precision results met the quantitative requirements.
Table 3.
Accuracy, precision, matrix effects, extraction recovery, and stability (RE: Relative error; RSD: Relative standard deviation).
2.2.4. Matrix Effect and Extraction Recovery
Matrix effect and recovery assays are important components of method validation in biological analysis, while in terms of endogenous metabolites, the treatment procedures and calculation method are different. Three concentrations of quality control (QC) were used for the matrix effect and recovery studies. The ratio of the increased area of analytes with matrix versus the peak area without matrix was regarded as the matrix effect. The results showed that the matrix effect was consistent at different levels and in the range of 68.24–117.71%, as shown in Table 3. The ratio of the peak area of the QC samples versus the standards directly added to the post-treated matrix was regarded as extraction recovery, and the recovery was in the range of 83.14–117.21% (in Table 3).
2.2.5. Stability
The stability assays were evaluated in three aspects: the short-term stability of samples at 4 °C for 12 h after being added to acetonitrile, the short-term stability of samples at 4 °C for 12 h after sample preparation, and the relatively long-term stability of samples at −70 °C for 2 weeks before sample preparation. The results indicated that all the analytes were stable under these conditions within a range of 85–115% of the nominal value (in Table 3). Repeated freezing–thawing of samples should be avoided for the reason of changes in analyte content.
2.3. Neurotransmitters of Rats with Depression in the Gut Microbiota
The newly established method was used to investigate differences under mental illnesses. Then, a rat model of chronic unpredictable stress depression was established. After an eight-week unpredictable stimulation, the depression model was successfully established. Then, fresh fecal samples from both the model and control groups were collected for analysis. The variations in behavior were monitored and recorded by the sucrose preference test. Rats with depression showed a significantly lower trend to drink sucrose water (in Figure 3a), suggesting anhedonia in the rats.
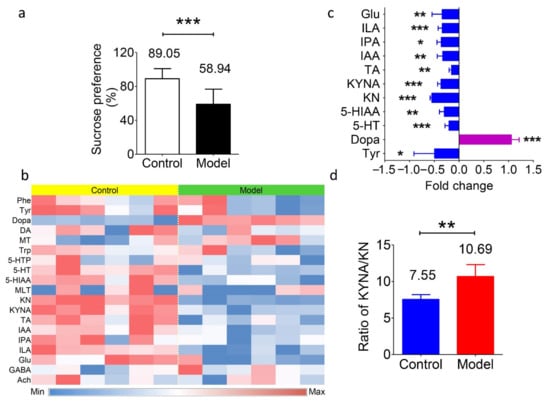
Figure 3.
Levels of transmitters and metabolites in fecal samples of the depression model and normal control Sprague-Dawley rats. (a) Percentage of sucrose preference in the normal control group (89.05%) and depression model group (58.94%). *** p < 0.001. (b) Heatmap of the nineteen transmitters and metabolites in fecal samples from both groups. Blue represents a lower level, and red represents a higher level. (c) The fold change of the substance levels in the model group versus the control group with significance. * p < 0.05, ** p < 0.01, *** p < 0.001. (d) Value of the KYNA/KN ratio in the model group (10.69) and the control group (7.55). * p < 0.01. Data in a, c, and d are shown as the means ± SD and were analyzed by two-tailed Student’s t test.
Table 4 shows the presence of the neurotransmitters in the gut microbiota. Apart from the abundant presence of amino acids (Phe, Tyr, Trp, and Glu), the concentrations of transmitters varied a lot in the rat fecal samples, including Dopa (1660 ± 253 ng/g), DA (263.8 ± 76.3 ng/g), MLT (1.48 ± 1.88 ng/g), 5-HT (806.5 ± 34.1 ng/g), GABA (11.89 ± 0.51 μg/g), and Ach (8.04 ± 6.96 ng/g). The level of MT, derived from Phe, was 11.19 ± 1.36 ng/g. However, the other metabolites in this pathway, such as adrenaline and norepinephrine etc., were undetectable, which is different from the in vivo results. In terms of the Trp metabolites, the levels of 5-HIAA and 5-HTP (which are derived from 5-HT) in feces were 17.76 ± 2.18 μg/g and 13.82 ± 5.14 ng/g, respectively; KN and KYNA (which are derived from Trp) were 139.3 ± 10.5 ng/g and 1051 ± 116 ng/g, respectively; and the levels of TA, IAA, ILA, and IPA ranged from 1067 ± 111 ng/g to 8833 ± 1531 ng/g. While, if the animals were depressed, then differences in the concentrations of these metabolites were observed, and the results are summarized in Figure 3b,c. The average concentrations of all these amino acids showed a decreasing trend of −36% for Phe, −49% for Tyr (P < 0.05), −29% for Trp, and −34% for Glu (p < 0.01). The level of Dopa showed a significant increase in the model group, with an average of +105% (p < 0.001). Regarding the Trp metabolic pathway, the levels of 5-HT and 5-HIAA were downregulated by −20% (p < 0.001) and −30% (p < 0.01), respectively, in the depression model. The levels of KN and KYNA decreased as well (63.0 vs. 139.3 ng/g and 668 vs. 1051 ng/g, respectively, p < 0.001). In addition, the production of IAA, IPA, and ILA was significantly decreased (−33%, −36%, and −34%, respectively; p < 0.01, p < 0.05, and p < 0.001). These data suggest the variations in the gut microbiota or in the function of the gut under disease. Apart from the above results, the ratio of KYNA/KN levels was elevated in the depression model (in Figure 3d). This result was consistent with the hypothesis that the KYNA/KN ratio is a potential marker for the degree of depression [42].
Table 4.
The level of transmitters and metabolites in the rat feces of normal control and depression model rats.
Several previous studies have shown that abnormal behaviors are not only manifested in changes in brain neurotransmitter levels but are also accompanied by intestinal dysfunction and imbalance of the gut flora [43,44,45]. This phenomenon could be partly explained by the “gut–brain axis” theory, which proposes that a series of signaling pathways mediate the communication between the intestinal bacteria and brain. Interestingly, under depression, changes in the metabolic pathways in the gut microbiota seemed to be concentrated on Trp. This phenomenon is similar to the well-known observation that the levels of 5-HT, 5-HIAA, or their corresponding receptors in brain are disordered under depression [46,47]. Meanwhile, the downregulation of “Trp metabolic” bacteria, namely, Clostridium spp., Bifidobacterium spp., Escherichia spp., Ruminococcus spp., and Lactobacilli spp., etc., have been reported by several independent investigations in depression patients [48,49,50]. However, whether the change in the composition of the gut microbiota is the reason for, or the result of, the development of mental illness requires further and deeper exploration.
2.4. Screening of Postlisting Drugs In Vitro
Several guideline suggested first-line drugs that treat NVS diseases have been screened for their regulatory potential of gut microbiota [51]. Sertraline and fluoxetine are selective serotonin reuptake inhibitors (SSRIs), and imipramine is a nerve terminal reuptake inhibitor; the indications of these three drugs are depression in adults. Levodopa is a typical anti-Parkinson’s disease drug, using direct transmitter supplementation. Clozapine is a nonclassical neuroblocker for schizophrenia, and chlorpromazine is an antagonist of central dopamine receptors in alleviating schizophrenia symptoms. In Figure 4a, all the samples are within the 95% confidence level, and among them, sertraline, imipramine, and chlorpromazine exhibited preferable regulatory potential for neurotransmitters and metabolites. The transmitters or metabolites that showed variations in level are shown in the heatmap (Figure 4b). Both groups of the SSRIs showed a significant increase in the levels of GABA (p < 0.001) and Dopa (p < 0.01 and p < 0.001), an increase in DA plus KN, and a decrease in Glu in the gut microbiota. High-dose imipramine (100 μM) showed an obvious downregulation of the KYNA/KN ratio (p < 0.001). Levodopa did not have an obvious effect on the metabolites in the Trp or Glu pathways, and similar results were observed in the clozapine groups. In addition, the high dose of chlorpromazine induced the production of DA (p < 0.05) and KN (p < 0.01), and simultaneously decreased the Glu level (p < 0.05) in the gut microbiota.
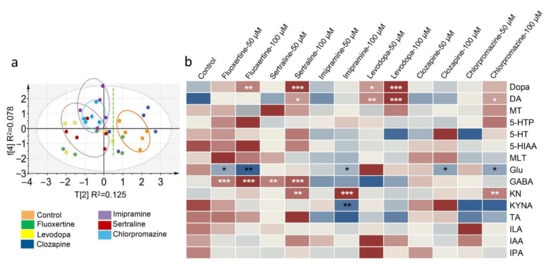
Figure 4.
Differences in the levels of transmitters and metabolites in the gut microbiota after first-line drug treatment. (a) Principal component analysis score plot showing the diversity of the compound levels among the control group and drug-treated groups (100 μM). (b) Heatmap of the compound level. Significant differences of all the drug-treated groups were analyzed by comparison with the control group, and “*” labeled in white means an increase in level, while “*” in black means a decrease in level. * p < 0.05, ** p < 0.01, *** p < 0.001. Data in b were analyzed by two-tailed Student’s t test.
3. Materials and Methods
3.1. Reagents and Materials
Melatonin (MLT), acetylcholine (Ach), and gamma-aminobutyric acid (GABA) were purchased from Solarbio Scientific Ltd. (Beijing, China). l-dopa (Dopa), dopamine (DA), hydroxytryptophan (5-HTP), 5-hydroxytryptamine (5-HT), and 4-hydroxybenzylamine (internal standard, IS) were obtained from J&K Scientific Ltd. (Beijing, China). Phenylalanine (Phe), tyrosine (Tyr), glutamic acid (Glu), and tryptophan (Trp) were obtained from the National Institutes for Food and Drug Control (Beijing, China). 3-Methoxytyramine (MT), 5-hydroxyindole-3-acetic acid (5-HIAA), kynurenine (KN), kynurenic acid (KYNA), and tryptamine (TA) were obtained from Shanghai Haohong Biological Medicine Technology Co., LTD (Shanghai, China). Indole-3-lactic acid (ILA), indole-3-acetic acid (IAA), and indolyl-3-propionic acid (IPA) were purchased from Shanghai Macklin Biochemical Co., Ltd. (Shanghai, China). The purities of all the reference standards were greater than 98%. Formic acid (100%) was purchased from Merck (Darmstadt, Germany). Acetonitrile and methanol were obtained from Fisher Scientific (HPLC grade, Fair Lawn, NJ, USA). Deionized distilled water was purchased from Hangzhou Wahaha Group Co. Ltd. (Hangzhou, China). All the other chemical reagents were obtained from Sinopharm Chemical Reagent Co., Ltd. (Beijing, China) at the purest degree available. The structural formulas of the nineteen monoamine compounds and IS are shown in Figure 1.
3.2. Animals
Sprague-Dawley rats (180–220 g, 8 weeks, male) were supplied by Beijing Vital River Laboratory Animal Technology Co., Ltd. (Beijing, China). All the animals had free access to food and water. The temperature was maintained at 22–24 °C with a 12 h light/dark cycle, and the relative humidity was 40–60%. Fresh fecal samples were collected in sterile nitrogen-filled self-sealing bags and kept at −70 °C. The research complied with the Institutional Guidelines and Ethics, and Laboratory Institutional Animal Care and Use Committees of the Chinese Academy of Medical Sciences and Peking Union Medical College (No. 00003053).
3.3. Instruments and LC-MS/MS Conditions
Liquid chromatography with tandem mass spectrometry LC-MS/MS 8060 (Shimadzu Corporation, Kyoto, Japan) with an electrospray ionization (ESI) source was conducted for analysis. An xSelect HSS PFP column (with fluoro-phenyl bonded) was used for separation (100 mm × 2.0 mm × 1.8 μm, Waters, Milford, USA). The flow rate was 0.3 mL/min, and the column temperature was maintained at 35 °C. The mobile phase was formic acid:water (0.2:100, v/v) as phase A, and methanol:acetonitrile (1:1) with 0.2% formic acid as phase B. The binary gradient elution conditions were as follows (A:B): 0.01 min, 98:2; 3.50 min, 98:2; 4.00 min, 10:90; 4.50 min, 2:98; 6.00 min, 2:98; 6.50 min, 98:2; 8.50 min, and controller stop. Multiple reaction monitoring (MRM) in the positive mode was performed for detection, and the optimized MRM parameters for each compound are shown in Table 1. The mass condition parameters were set as follows: nebulizer gas, 2.7 L/min; drying gas, 10.0 L/min; heating gas, 10.0 L/min; interface temperature, 300 °C; collision-induced dissociation (CID) gas, 230 kPa; DL temperature, 250 °C; heat block temperature, 400 °C; and interface voltage, −4.5 kV. The autosampler was maintained at 4 °C.
3.4. Stock Solutions, Calibration Curve Standards
The neurotransmitter standards, including Dopa, DA, MT, Trp, 5-HTP, 5-HT, 5-HIAA, MLT, KN, TA, ILA, IAA, IPA, GABA, and Ach, were dissolved in a 0.2% formic acid–water solution to obtain a concentration of 1.00 mg/mL. Phe, Tyr, Glu, and KYNA were dissolved in a 0.2% formic acid–methanol solution to a final concentration of 1.00 mg/mL. The stock solution was prepared by thoroughly mixing the standards according to the proportion, with Phe, Tyr, Trp, and Glu 50,000 ng/mL; 5-HIAA, ILA, IAA, IPA, and GABA 2000 ng/mL; Dopa, DA, 5-HTP, 5-HT, KN, TA, and Ach 500 ng/mL; MT, 200 ng/mL; KYNA, 100 ng/mL; and MLT, 10 ng/mL. Eight calibration curve standards (working solutions) were prepared by series dilution, and the final concentrations of Dopa in the mixed standards were as follows: 500 ng/mL, 200 ng/mL, 100 ng/mL, 50 ng/mL, 10 ng/mL, 5 ng/mL, 2 ng/mL, and 0.5 ng/mL. The levels of other substances in the working solutions achieved the corresponding values. The concentrations of the QC for each compound, namely, the low-concentration quality control (LQC), middle-concentration quality control (MQC), and high-concentration quality control (HQC), are listed.
3.5. Sample Preparation
Fresh fecal samples were prepared by diluting with 5-fold (w:v = 1:5) formic acid–water (v:v = 0.2:100). After thoroughly mixing by vortexing and centrifuging at 12,000× g for 5 min, the diluted fecal sample (50 μL) was immediately added to 150 μL cold acetonitrile (with 2% formic acid and 100 ng/mL 4-hydroxybenzylamine as IS). The resulting solution was centrifuged at 12,000× g for 5 min at 4 °C, and the supernatant was collected into another 1.5 mL tube. Then, the solvent of the collected solution was removed under a flow of nitrogen. The residue was redissolved in 50 μL of the initial mobile phase (with 2% formic acid added) and centrifuged at 12,000× g for 5 min at 4 °C. Five microliters of the supernatant was injected for analysis. For QC samples, fecal samples from six rats were first mixed and diluted with a 5-fold (weight:volume = 1:5) of formic acid–water (v:v = 0.2:100). Then, 50 μL of the working solutions with different levels of standards were added to an aliquot of the mixed fecal sample (50 μL). Then, 150 μL of cold acetonitrile (with 2% formic acid and 100 ng/mL IS) was added and treated as described above.
3.6. Method Validation
3.6.1. Specificity and Carryover
Specificity was evaluated by spiking standards into the fecal matrix, and comparing the chromatograms of the spiked samples with those of the unspiked matrix and standards in solvent. The carryover effect was investigated by injecting the blank solvent after five consecutive injections of HQCs, and a residual response not exceeding 20% of instrumental LLOQ was regarded as acceptable [52].
3.6.2. Linearity
The eight levels of calibration curve standards used for evaluating linearity included Phe, Tyr, Trp and Glu 50,000, 20,000, 10,000, 5000, 1000, 500, 200, and 50 ng/mL; 5-HIAA, ILA, IAA, IPA and GABA 2000, 800, 400, 200, 40, 20, 8, and 2 ng/mL; Dopa, DA, 5-HTP, 5-HT, KN, TA and Ach 500, 200, 100, 50, 10, 5, 2, and 0.5 ng/mL; MT 200, 80, 40, 20, 4, 2, 0.8, and 0.2 ng/mL; KYNA 100, 40, 20, 10, 2, 1, 0.4, and 0.1 ng/mL; and MLT 10, 4, 2, 1, 0.2, 0.1, 0.04, and 0.01 ng/mL. The nonzero calibration curve was built by plotting the peak area ratio of analyte to IS (Y) versus the nominal level (X) [53]. The correlation coefficient (R2) was obtained to evaluate linearity, and a weighting factor of 1/X was used for fitting. The linear range was accepted when the relative error of the calibrators was within ±15% by comparison with the theoretical concentrations, except at the lowest limit of quantification (LLOQ, ± 20%) in each run [35,52]. The lowest level of standards on the validated calibration curve was defined as the LLOQ of this method at which an acceptable accuracy (RE) and precision (RSD) could be obtained [54].
3.6.3. Limits of Detection and Quantification (Instrumental)
The instrumental LLOD and LLOQ were assessed according to the guidelines that a signal-to-noise ratio (S/N) of each compound above three was recorded as the LLOD, and S/N above ten was regarded as LLOQ of the instrument [55]. As fecal samples free from the nineteen compounds were not available, solvent standards were used to evaluate the instrumental LLOD and LLOQ.
3.6.4. Accuracy and Precision
Accuracy and precision included two parts: intra-day and inter-day accuracy and precision. Three levels of QC samples (LQCs, MQCs, and HQCs) in five repeats were evaluated on one day and three consecutive days. Accuracy was evaluated by comparing the measured value (C1) and theoretical value (C2), and it is expressed as relative error, RE = (C1 − C2)/C2 × 100%. Precision is expressed as RSD (%). The accuracy and precision result was accepted when the RE and RSD of QCs were within ±15% by comparison with the theoretical concentrations in each run [56].
3.6.5. Matrix Effects and Extraction Recovery
For endogenous metabolites, the matrix effects and extraction recovery were determined using unspiked samples and standard-spiked samples (LQCs, MQCs, HQCs) in five repeats [52]. The matrix effect was assessed by separately determining the response (peak area) of each compound in unspiked samples (A1), standard-spiked samples (A2), and standards free from matrix (A3) after extraction. The value of the matrix effect was calculated by A2/(A1 + A3) × 100%. The extraction recovery of each analyte was evaluated in five replicates by comparing the peak area of standard-spiked samples before (A4) and after extraction (A5), and recovery was calculated by A5/A4 × 100%. The spiked samples for A5 were prepared by QCs. The spiked samples for A4 were prepared as follows: a diluted fecal sample (50 μL) was added to 150 μL cold acetonitrile (with 2% formic acid and 100 ng/mL IS). After centrifugation and drying, the residue was dissolved in 50 μL of standards at the corresponding levels. Recovery above 60% and deviation in different levels within 15% were regarded as acceptable [57].
3.6.6. Stability
Stability was evaluated using spiked samples (LQCs, MQCs, and HQCs) in triplicate that were placed at 4 °C for 12 h after the addition of cold acetonitrile (2% formic acid) or after preparation (in waiting for the analysis), or maintained at −70 °C for 2 weeks before treatment. Stability was calculated by the ratio of the peak area of each compound after placement to the measured value of the corresponding samples before placement. Data in the range of 85–115% after placement were regarded stable [52,53].
3.7. Establishment of the Depression Model
Twelve Sprague-Dawley rats (male, 8 weeks) were randomly separated into two groups to establish a chronic unpredictable stress depression model. Six rats were set as the normal control group (Group 1), and the other six rats were set as the depression model group (Group 2). Animals in group 2 were exposed to two different kinds of unpredictable stresses every day: light/dark reversed, food and water deprivation, ice water swimming, electric shock, behavioral constraints, cold stimulation, clip tail, wet bedding, and slope [58,59]. After continuous modeling for 8 weeks, the sucrose preference test was performed to examine the model after 8 weeks [58,59]. Then, fecal samples were collected from each group for the analysis of the nineteen neurotransmitters and metabolites by LC-MS/MS.
3.8. Screening and Evaluation of Postlisting Compounds
Six postlisting drugs, including sertraline hydrochloride (Shanghai Macklin Biochemical Co., Ltd., Shanghai, China), clozapine (Shanghai Yuanye Biological Technology Co., LTD, Shanghai, China), levodopa (J&K Technology Co. LTD, Beijing, China), chlorpromazine hydrochloride (Macklin, Shanghai, China), imipramine hydrochloride (Macklin, Shanghai, China), and fluoxertine hydrochloride (Yuanye, Shanghai, China), were used for drug screening. Five grams of the colon contents from six Sprague-Dawley rats (male, eight weeks) was collected under sterile conditions to isolate intestinal bacteria. After adding 100 mL of sterile anaerobic culture medium (Solarbio Biotechnology Co., LTD, Beijing, China) under a nitrogen atmosphere, the resulting mixture was filtered through gauze to remove the food debris. The intestinal bacterial culture was preincubated for 30 min. Then, 10 μL of standards (in methanol, 5 mM and 10 mM) was added to 990 μL of the intestinal bacterial culture and incubated for 12 h under anaerobic conditions [60]. Finally, the resulting culture was immediately mixed with cold acetonitrile (with 2% formic acid and IS) and treated as described above.
3.9. Statistical Analysis
Statistical analysis was performed by GraphPad Prism version 5.72 (GraphPad Software, La Jolla, CA, USA) and SIMCA version 14 (MKS Umetrics AB, Umea, Sweden). Data are expressed as the mean ± standard deviation (SD) and were analyzed by two-tailed Student’s t test. A P value less than 0.05 was regarded as statistically significant for all the tests. The heatmap was constructed to express the compound levels in different colors, of which blue represents a lower level and red represents a higher level. The drug screening data were first normalized to the sum of total intensity, and then subjected to principal component analysis (PCA). The PCA score plot was built based on the 35 samples (n = 5 in each group, including the control group and six groups with 100 μM drug treatment) and those targeted features measured in the samples. The total variance retained in the four PCs was 0.833 with Q2 = 0.436.
4. Conclusions
Herein, a novel, simple, and underivatized LC-MS/MS method for the quantification of nineteen monoamine neurotransmitters and metabolites related to the NVS was developed. The method was suitable for intestinal bacterial samples and focused on three pathways, namely, Phe, Trp, and Glu. The compounds were separated on a fluoro-phenyl bonded column, and the linear range for each compound was adjusted according to its level in practical samples. After optimization of the detecting conditions and pretreatment procedures, the compounds exhibited symmetric peak shapes and sufficient sensitivity under a total analysis time of 8.5 min. The method was fully validated with acceptable linearity, accuracy, precision, matrix effect, extraction recovery, and stability. The results of the fecal samples showed that neurotransmitters such as Dopa, DA, 5-HT, GABA, and Ach were present in the gut microbiota. The metabolic pathway of Trp was disordered under depression, with lower levels of 5-HT, 5-HIAA, KN, KYNA, TA, ILA, IAA, IPA, Glu, and Tyr, and a higher ratio of KYNA/KN. In addition, some first-line NVS drugs, such as sertraline, imipramine, and chlorpromazine, showed regulatory potential on these pathways in the gut microbiota as well.
Author Contributions
Conceptualization and methodology, Y.W.; software, S.-R.M., P.H., L.-B.P., and H.Y.; method development and validation, S.-R.M., R.P., and H.X.; writing-original manuscript, S.-R.M. and Y.W.; animal model and sample supplement, J.-B.Y., Z.-W.Z. and J.F.; investigation and analysis, S.-R.M. and L.-B.P. All authors have read and agreed to the published version of the manuscript.
Funding
The project was supported by CAMS Innovation Fund for Medical Sciences (CIFMS) (Nos. 2016-I2M-3-011), the National Natural Science Foundation of China (No. 81973290, 82070362), Beijing Key Laboratory of Non-Clinical Drug Metabolism and PK/PD study (Z141102004414062), the Key Project of Beijing Natural Science Foundation (No.7181007), and Drug Innovation Major Project (No. 2018ZX09711001-002-002).
Institutional Review Board Statement
The animal study was conducted according to the guidelines of the Declaration of Helsinki, and the ethics of both institutional guidelines and Chinese Council on Animal Care. And it has been approved by the Laboratory Institutional Animal Care and Use Committees of the Chinese Academy of Medical Sciences and Peking Union Medical College (No. 00003053).
Informed Consent Statement
Not applicable.
Data Availability Statement
The data in this study are available in this article.
Acknowledgments
The authors thank Shimadzu (China) Co., Lid for the technological supports.
Conflicts of Interest
The authors declare no conflict of interest.
Sample Availability
The standards of the nineteen monoamines are available from the authors.
Abbreviations
Ach, Acetylcholine; CID, Collision induced dissociation; CE, Collision energy; DA, Dopamine; Dopa, l-dopa; ESI, Electrospray ionization; GABA, Gamma-aminobutyric acid; Glu, Glutamic acid; 5-HIAA, 5-5-Hydroxyindole-3-acetic acid; 5-HT, 5-Hydroxytryptamine; 5-HTP, Hydroxytryptophan; HQC, High-concentration quality control; IAA, Indole-3-acetic acid; ILA, Indole-3-lactic acid; IPA, Indolyl-3-propionic acid; IS, Internal standard; KN, Kynurenine; KYNA, Kynurenic acid; LC-MS/MS, Liquid chromatography–tandem mass spectrometry; LLOD, Lowest limit of detection; LLOQ, Lowest limit of quantification; LQC, Low-concentration quality control; MLT, Melatonine; MQC, Middle-concentration quality control; MRM, Multiple reaction monitoring; MT, 3-Methoxytyramine; MW: Molecular weight; NVS, Nervous system; PCA, Principal component analysis; Phe, Phenylalanine; QC, Quality control; RE, Relative error; RSD, Relative standard derivation; Rt, Retention time; SD, Standard deviation; S/N, Noise ratio; SSRI: Selective serotonin reuptake inhibitors; TA, Tryptamine; Trp, Tryptophan; Tyr, Tyrosine.
References
- Richter, D.; Wall, A.; Bruen, A.; Whittington, R. Is the global prevalence rate of adult mental illness increasing? Systematic review and meta-analysis. Acta Psychiatr. Scand. 2019, 140, 393–407. [Google Scholar] [CrossRef]
- GBD 2016 Disease and Injury Incidence and Prevalence Collaborators. Global, regional, and national incidence, prevalence, and years lived with disability for 328 diseases and injuries for 195 countries, 1990–2016: A systematic analysis for the Global Burden of Disease Study 2016. Lancet 2017, 390, 1211–1259. [Google Scholar] [CrossRef]
- Carabotti, M.; Scirocco, A.; Maselli, M.A.; Severi, C. The gut-brain axis: Interactions between enteric microbiota, central and enteric nervous systems. Ann. Gastroenterol. 2015, 28, 203–209. [Google Scholar]
- Mehler, M.F. Epigenetic principles and mechanisms underlying nervous system functions in health and disease. Prog. Neurobiol. 2008, 86, 305–341. [Google Scholar] [CrossRef]
- Yuan, J.; Yankner, B.A. Apoptosis in the nervous system. Nature 2000, 407, 802–809. [Google Scholar] [CrossRef]
- Nithianantharajah, J.; Hannan, A.J. Enriched environments, experience-dependent plasticity and disorders of the nervous system. Nat. Rev. Neurosci. 2006, 7, 697–709. [Google Scholar] [CrossRef]
- Shulman, J.M.; De Jager, P.L.; Feany, M.B. Parkinson’s disease: Genetics and pathogenesis. Annu. Rev. Pathol. 2011, 6, 193–222. [Google Scholar] [CrossRef]
- Liu, Y.; Hou, Y.; Wang, G.; Zheng, X.; Hao, H. Gut microbial metabolites of aromatic amino acids as signals in host-microbe interplay. Trends Endocrinol. Metab. 2020, 31, 818–834. [Google Scholar] [CrossRef]
- Stilling, R.M.; Dinan, T.G.; Cryan, J.F. Microbial genes, brain & behaviour–epigenetic regulation of the gut–brain axis. Genes Brain Behav. 2014, 13, 69–86. [Google Scholar]
- Williams, B.B.; Van Benschoten, A.H.; Cimermancic, P.; Donia, M.S.; Zimmermann, M.; Taketani, M.; Ishihara, A.; Kashyap, P.C.; Fraser, J.S.; Fischbach, M.A. Discovery and characterization of gut microbiota decarboxylases that can produce the neurotransmitter tryptamine. Cell Host Microbe 2014, 16, 495–503. [Google Scholar] [CrossRef]
- Sudo, N. Biogenic amines: Signals between commensal microbiota and gut physiology. Front. Endocrinol. 2019, 10, 504. [Google Scholar] [CrossRef]
- Lebedev, A.V.; Nilsson, J.; Lindström, J.; Fredborg, W.; Akenine, U.; Hillilä, C.; Andersen, P.; Spulber, G.; de Lange, E.C.M.; van den Berg, D.J.; et al. Effects of daily l-dopa administration on learning and brain structure in older adults undergoing cognitive training: A randomised clinical trial. Sci. Rep. 2020, 10, 1–11. [Google Scholar] [CrossRef]
- Cryan, J.F.; O’mahony, S.M. The microbiome-gut-brain axis: From bowel to behavior. Neurogastroenterol. Motil. 2011, 23, 187–192. [Google Scholar] [CrossRef] [PubMed]
- Mayer, E.A.; Tillisch, K.; Gupta, A. Gut/brain axis and the microbiota. J. Clin. Investig. 2015, 125, 926–938. [Google Scholar] [CrossRef] [PubMed]
- Foster, J.A.; Neufeld, K.M. Gut–brain axis: How the microbiome influences anxiety and depression. Trends Neurosci. 2013, 36, 305–312. [Google Scholar] [CrossRef]
- Agus, A.; Planchais, J.; Sokol, H. Gut microbiota regulation of tryptophan metabolism in health and disease. Cell Host Microbe 2018, 23, 716–724. [Google Scholar] [CrossRef]
- Zheng, J.; Mandal, R.; Wishart, D.S. A sensitive, high-throughput LC-MS/MS method for measuring catecholamines in low volume serum. Anal. Chim. Acta 2018, 1037, 159–167. [Google Scholar] [CrossRef] [PubMed]
- Sotnikova, T.D.; Beaulieu, J.M.; Espinoza, S.; Masri, B.; Zhang, X.; Salahpour, A.; Barak, L.S.; Caron, M.G.; Gainetdinov, R.R. The dopamine metabolite 3-methoxytyramine is a neuromodulator. PLoS ONE 2010, 5, e13452. [Google Scholar] [CrossRef]
- Yoshida, H.; Tanaka, Y.; Nakayama, K. Production of 3, 4-dihydroxyphenyl-L-alanine (L-DOPA) and its derivatives by Vibrio tyrosinaticus. Agr. Biol. Chem. 1973, 37, 2121–2126. [Google Scholar] [CrossRef][Green Version]
- O’Neill, C. Gut microbes metabolize Parkinson’s disease drug. Science 2019, 364, 1030–1031. [Google Scholar] [CrossRef]
- Strandwitz, P.; Kim, K.H.; Terekhova, D.; Liu, J.K.; Sharma, A.; Levering, J.; McDonald, D.; Dietrich, D.; Ramadhar, T.R.; Lekbua, A. GABA-modulating bacteria of the human gut microbiota. Nat. Microbiol. 2019, 4, 396–403. [Google Scholar] [CrossRef]
- Gold, P.E. Acetylcholine modulation of neural systems involved in learning and memory. Neurobiol. Learn. Mem. 2003, 80, 194–210. [Google Scholar] [CrossRef]
- Stephenson, M.; Rowatt, E.; Harrison, K. The production of acetylcholine by a strain of Lactobacillus plantarum. Microbiology 1947, 1, 279–298. [Google Scholar] [CrossRef]
- Roager, H.M.; Licht, T.R. Microbial tryptophan catabolites in health and disease. Nat. Commun. 2018, 9, 1–10. [Google Scholar] [CrossRef] [PubMed]
- Miczek, K.A.; Mos, J.; Olivier, B. Brain 5-HT and inhibition of aggressive behavior in animals: 5-HIAA and receptor subtypes. Psychopharmacol. Bull. 1989, 25, 399–403. [Google Scholar] [PubMed]
- Carroll, B.J.; Greden, J.F.; Feinberg, M. Suicide, neuroendocrine dysfunction and CSF 5-HIAA concentrations in depression. In Recent Advances in Neuropsycho-Pharmacology; Pergamon: Göteborg, Sweden, 1981; pp. 307–313. [Google Scholar]
- Dubocovich, M.L. Pharmacology and function of melatonin receptors. FASEB J. 1988, 2, 2765–2773. [Google Scholar] [CrossRef]
- Schwarcz, R.; Stone, T.W. The kynurenine pathway and the brain: Challenges, controversies and promises. Neuropharmacology 2017, 112, 237–247. [Google Scholar] [CrossRef] [PubMed]
- Klein, C.; Patte-Mensah, C.; Taleb, O.; Bourguignon, J.J.; Schmitt, M.; Bihel, F.; Maitre, M.; Mensah-Nyagan, A.G. The neuroprotector kynurenic acid increases neuronal cell survival through neprilysin induction. Neuropharmacology 2013, 70, 254–260. [Google Scholar] [CrossRef]
- Kennedy, P.J.; Cryan, J.F.; Dinan, T.G.; Clarke, G. Kynurenine pathway metabolism and the microbiota-gut-brain axis. Neuropharmacology 2017, 112, 399–412. [Google Scholar] [CrossRef]
- Greenshaw, A.J.; Dewhurst, W.G. Tryptamine receptors: Fact, myth or misunderstanding. Brain Res. Bull. 1987, 18, 253–256. [Google Scholar] [CrossRef]
- Baranwal, A.; Chandra, P. Clinical implications and electrochemical biosensing of monoamine neurotransmitters in body fluids, in vitro, in vivo, and ex vivo models. Biosens. Bioelectron. 2018, 121, 137–152. [Google Scholar] [CrossRef]
- Ma, L.; Zhao, T.; Zhang, P.; Liu, M.; Shi, H.; Kang, W. Determination of monoamine neurotransmitters and metabolites by high-performance liquid chromatography based on Ag(III) complex chemiluminescence detection. Anal. Biochem. 2020, 593, 113594. [Google Scholar] [CrossRef] [PubMed]
- Helmschrodt, C.; Becker, S.; Perl, S.; Schulz, A.; Richter, A. Development of a fast liquid chromatography-tandem mass spectrometry method for simultaneous quantification of neurotransmitters in murine microdialysate. Anal. Bioanal. Chem. 2020, 412, 7777–7787. [Google Scholar] [CrossRef]
- Han, X.M.; Qin, Y.J.; Zhu, Y.; Zhang, X.L.; Wang, N.X.; Rang, Y.; Zhai, X.J.; Lu, Y.N. Development of an underivatized LC-MS/MS method for quantitation of 14 neurotransmitters in rat hippocampus, plasma and urine: Application to CUMS induced depression rats. J. Pharm. Biomed. Anal. 2019, 174, 683–695. [Google Scholar] [CrossRef]
- Wojnicz, A.; Avendaño Ortiz, J.; Casas, A.I.; Freitas, A.E.; G López, M.; Ruiz-Nuño, A. Simultaneous determination of 8 neurotransmitters and their metabolite levels in rat brain using liquid chromatography in tandem with mass spectrometry: Application to the murine Nrf2 model of depression. Clin. Chim. Acta 2016, 453, 174–181. [Google Scholar] [CrossRef]
- Bergh, M.S.S.; Bogen, I.L.; Lundanes, E.; Øiestad, A.M.L. Validated methods for determination of neurotransmitters and metabolites in rodent brain tissue and extracellular fluid by reversed phase UHPLC–MS/MS. J. Chromatogr. B Analyt. Technol. Biomed. Life Sci. 2016, 1028, 120–129. [Google Scholar] [CrossRef] [PubMed]
- Forgacsova, A.; Galba, J.; Garruto, R.M.; Majerova, P.; Katina, S.; Kovac, A. A novel liquid chromatography/mass spectrometry method for determination of neurotransmitters in brain tissue: Application to human tauopathies. J. Chromatogr. B Analyt. Technol. Biomed. Life Sci. 2018, 1073, 154–162. [Google Scholar] [CrossRef]
- Uutela, P.; Reinilä, R.; Harju, K.; Piepponen, P.; Ketola, R.A.; Kostiainen, R. Analysis of intact glucuronides and sulfates of serotonin, dopamine, and their phase I metabolites in rat brain microdialysates by liquid chromatography-tandem mass spectrometry. Anal. Chem. 2009, 81, 8417–8425. [Google Scholar] [CrossRef] [PubMed]
- Nakatani, Y.; Sato-Suzuki, I.; Tsujino, N.; Nakasato, A.; Seki, Y.; Fumoto, M.; Arita, H. Augmented brain 5-HT crosses the blood–brain barrier through the 5-HT transporter in rat. Eur. J. Neurosci. 2008, 27, 2466–2472. [Google Scholar] [CrossRef]
- Wang, L.S.; Zhang, M.D.; Tao, X.; Zhou, Y.F.; Liu, X.M.; Pan, R.L.; Liao, Y.H.; Chang, Q. LC-MS/MS-based quantification of tryptophan metabolites and neurotransmitters in the serum and brain of mice. J. Chromatogr. B Analyt. Technol. Biomed. Life Sci. 2019, 1112, 24–32. [Google Scholar] [CrossRef] [PubMed]
- Savitz, J.; Drevets, W.C.; Wurfel, B.E.; Ford, B.N.; Bellgowan, P.S.; Victor, T.A.; Bodurka, J.; Teague, T.K.; Dantzer, R. Reduction of kynurenic acid to quinolinic acid ratio in both the depressed and remitted phases of major depressive disorder. Brain Behav. Immun. 2015, 46, 55–59. [Google Scholar] [CrossRef]
- Kelly, J.R.; Borre, Y.; O’ Brien, C.; Patterson, E.; El Aidy, S.; Deane, J.; Kennedy, P.J.; Beers, S.; Scott, K.; Moloney, G.; et al. Transferring the blues: Depression-associated gut microbiota induces neurobehavioural changes in the rat. J. Psychiatr. Res. 2016, 82, 109–118. [Google Scholar] [CrossRef]
- Dinan, T.G.; Cryan, J.F. Melancholic microbes: A link between gut microbiota and depression? Neurogastroenterol. Motil. 2013, 25, 713–719. [Google Scholar] [CrossRef] [PubMed]
- Naseribafrouei, A.; Hestad, K.; Avershina, E.; Sekelja, M.; Linløkken, A.; Wilson, R.; Rudi, K. Correlation between the human fecal microbiota and depression. Neurogastroenterol. Motil. 2014, 26, 1155–1162. [Google Scholar] [CrossRef] [PubMed]
- Fakhoury, M. Revisiting the serotonin hypothesis: Implications for major depressive disorders. Mol. Neurobiol. 2016, 53, 2778–2786. [Google Scholar] [CrossRef]
- Owens, M.J.; Nemeroff, C.B. Role of serotonin in the pathophysiology of depression: Focus on the serotonin transporter. Clin. Chem. 1994, 40, 288–295. [Google Scholar] [CrossRef] [PubMed]
- Dehhaghi, M.; Panahi, H.K.S.; Guillemin, G.J. Microorganisms, tryptophan metabolism, and kynurenine pathway: A complex interconnected loop influencing human health status. Int. J. Tryptophan Res. 2019, 12, 1178646919852996. [Google Scholar] [CrossRef]
- Cheung, S.G.; Goldenthal, A.R.; Uhlemann, A.C.; Mann, J.J.; Miller, J.M.; Sublette, M.E. Systematic review of gut microbiota and major depression. Front. Psychiatry 2019, 10, 34. [Google Scholar] [CrossRef]
- Jiang, H.; Ling, Z.; Zhang, Y.; Mao, H.; Ma, Z.; Yin, Y.; Wang, W.; Tang, W.; Tan, Z.; Shi, J.; et al. Altered fecal microbiota composition in patients with major depressive disorder. Brain Behav. Immun. 2015, 48, 186–194. [Google Scholar] [CrossRef] [PubMed]
- National Health Commission of the People’s Republic of China. Guidelines for the Diagnosis and Treatment of Mental Disorders; National Health Commission of the People’s Republic of China: Beijing, China, 2020.
- U.S. Food and Drug Administration. Bioanalytical Method Validation, Guidance for Industry; U.S. Food and Drug Administration: Silver Spring, MD, USA, 2018; pp. 20–26.
- Ma, S.R.; Tong, Q.; Zhao, Z.X.; Cong, L.; Yu, J.B.; Fu, J.; Han, P.; Pan, L.B.; Gu, R.; Peng, R.; et al. Determination of berberine-upregulated endogenous short-chain fatty acids through derivatization by 2-bromoacetophenone. Anal. Bioanal. Chem. 2019, 411, 3191–3207. [Google Scholar] [CrossRef]
- Asgari, A.; Kobarfard, F.; Keyhanfar, F.; Mohebbi, S.; Noubarani, M. Determination of mebudipine in human plasma by liquid chromatography-tandem mass spectrometry. Iran. J. Pharm. Res. 2015, 14, 739–746. [Google Scholar] [PubMed]
- Hong, J.Y.; Park, N.H.; Oh, M.S.; Lee, H.S.; Pyo, H.; Hong, J. Profiling analysis of biogenic amines and their acidic metabolites in mouse brain tissue using gas chromatography–tandem mass spectrometry. J. Chromatogr. B Analyt. Technol. Biomed. Life Sci. 2013, 940, 94–103. [Google Scholar] [CrossRef]
- Wen, C.; Zhang, Q.; He, Y.; Deng, M.; Wang, X.; Ma, J. Gradient elution LC-MS determination of dasatinib in rat plasma and its pharmacokinetic study. Acta Chromatogr. 2015, 1, 1–11. [Google Scholar] [CrossRef]
- Diana Di Mavungu, J.; Monbaliu, S.; Scippo, M.L.; Maghuin-Rogister, G.; Schneider, Y.J.; Larondelle, Y.; Callebaut, A.; Robbens, J.; Van Peteghem, C.; De Saeger, S. LC-MS/MS multi-analyte method for mycotoxin determination in food supplements. Food Addit. Contam. Part A Chem. Anal. Control Expo. Risk Assess. 2009, 26, 885–895. [Google Scholar] [CrossRef] [PubMed]
- Yu, J.B.; Zhao, Z.X.; Peng, R.; Pan, L.B.; Fu, J.; Ma, S.R.; Han, P.; Cong, L.; Zhang, Z.W.; Sun, L.X.; et al. Gut microbiota-based pharmacokinetics and the antidepressant mechanism of paeoniflorin. Front. Pharmacol. 2019, 10, 268. [Google Scholar] [CrossRef]
- Zhao, Z.X.; Fu, J.; Ma, S.R.; Peng, R.; Yu, J.B.; Cong, L.; Pan, L.B.; Zhang, Z.G.; Tian, H.; Che, C.T.; et al. Gut-brain axis metabolic pathway regulates antidepressant efficacy of albiflorin. Theranostics 2018, 8, 5945–5959. [Google Scholar] [CrossRef]
- Wang, Y.; Tong, Q.; Ma, S.R.; Zhao, Z.X.; Pan, L.B.; Cong, L.; Han, P.; Peng, R.; Yu, H.; Lin, Y.; et al. Oral berberine improves brain dopa/dopamine levels to ameliorate Parkinson’s disease by regulating gut microbiota. Signal Transduct. Target. Ther. 2021, 6, 1–20. [Google Scholar] [CrossRef] [PubMed]
Publisher’s Note: MDPI stays neutral with regard to jurisdictional claims in published maps and institutional affiliations. |
© 2021 by the authors. Licensee MDPI, Basel, Switzerland. This article is an open access article distributed under the terms and conditions of the Creative Commons Attribution (CC BY) license (http://creativecommons.org/licenses/by/4.0/).