Article

Response Surface Methodology: Photocatalytic Degradation Kinetics of Basic Blue 41 Dye Using Activated Carbon with TiO2

by
Emmanuel Kweinor Tetteh
*,
Elorm Obotey Ezugbe
,
Dennis Asante-Sackey
,
Edward Kwaku Armah
and
Sudesh Rathilal
Green Engineering and Sustainability Research Group, Department of Chemical Engineering, Faculty of Engineering and The Built Environment, Durban University of Technology, Durban 4001, South Africa
*
Author to whom correspondence should be addressed.
Molecules 2021, 26(4), 1068; https://doi.org/10.3390/molecules26041068
Submission received: 15 December 2020 / Revised: 3 February 2021 / Accepted: 9 February 2021 / Published: 18 February 2021
(This article belongs to the Special Issue Advanced Materials and Technologies for Wastewater Treatment)

Abstract

:
Water decontamination still remains a major challenge to some developing countries not having centralized wastewater systems. Therefore, this study presents the optimization of photocatalytic degradation of Basic Blue 41 dye in an aqueous medium by an activated carbon (AC)-TiO2 photocatalyst under UV irradiation. The mesoporous AC-TiO2 synthesized by a sonication method was characterized by X-ray diffraction (XRD) and Fourier-transform infrared (FTIR) spectroscopy for crystal phase identification and molecular bond structures, respectively. The efficiency of the AC-TiO2 was evaluated as a function of three input variables viz. catalyst load (2–4 g), reaction time (15–45 min) and pH (6–9) by using Box-Behnken design (BBD) adapted from response surface methodology. Using color and turbidity removal as responses, a 17 run experiment matrix was generated by the BBD to investigate the interaction effects of the three aforementioned input factors. From the results, a reduced quadratic model was generated, which showed good predictability of results agreeable to the experimental data. The analysis of variance (ANOVA), signposted the selected models for color and turbidity, was highly significant (p < 0.05) with coefficients of determination (R2) values of 0.972 and 0.988, respectively. The catalyst load was found as the most significant factor with a high antagonistic impact on the process, whereas the interactive effect of reaction time and pH affected the process positively. At optimal conditions of catalyst load (2.6 g), reaction time (45 min), and pH (6); the desirability of 96% was obtained by a numerical optimization approach representing turbidity removal of 93% and color of 96%.

1. Introduction

With the recent industrial revolution, large volumes of wastewater produced by textile industries containing high levels of pollutants such as dyes and pigments, pose a great threat to human health and the environment. Globally, it has been estimated that about 800,000 tons of dyes and pigments are produced per year, whereby about 25% of them end up in the environment via wastewater discharges [1,2]. This poses a great threat to the environment and a serious health concern. Thus, in the textile industries, during the dyeing processes, large volumes of water are used with the end-product wastewater containing high levels of organics and toxic compounds. These wastewaters, when discharged into water bodies without treatment, end up affecting the dissolved oxygen levels for aquatic life [3].
Subsequently, dyes at concentrations even as low as 1 ppm can contribute to high strength color associated with reduced oxygen dissolution and sunlight diffusion which is necessary for aquatic life [3,4,5]. Therefore, there is the need to treat these colored effluents to remove the dyes before discharging them into water bodies [5]. Basic Blue 41 dye (BB41) is a dye typically used for dyeing wool and silk [4,6]. Discharges of effluents with the dye has recently been reported as a public health concern causing eye burns, nausea, vomiting, and diarrhea [2,7].
Finding an effective treatment method for wastewater-containing dyes is paramount as numerous treatment technologies have been established for the discoloration and degradation of dyes in wastewater [8,9,10]. Some of these techniques include adsorption, reverse osmosis, ultrafiltration, chlorination [9,10] and biological methods, such as aerobic and anaerobic treatments [11]. Nonetheless, most of these traditional techniques eliminate pollutants by simply transferring them from one phase to another without any conversion into environmentally-friendly end products [12,13]. These created intermediates usually require some form of secondary treatment or polishing step. Advanced oxidation processes (AOPs) such as Fenton, photo-Fenton catalytic reactions, UV/H2O2, and UV/O3 are effective methods for treating wastewater-containing dyes [14,15]. Comparatively, the removal of organic contaminants via photocatalytic degradation has proven to be more efficient than these conventional processes as it results in the total mineralization of a wide range of organic pollutants and the fact that it produces harmless compounds such as CO2 and H2O [13,15].
Among the numerous semiconductors (TiO2, ZnO, WO3, etc.), titanium dioxide (TiO2) is a promising photocatalyst due to its unique biological and chemical stability, low price and ready availability [9,16,17,18]. Narayanasamy and Murugesan [19] and Natarajan, et al. [20], reported photocatalytic degradation of yellow dye using TiO2 thin films under visible light, where the degradation efficiency decreased with an increase in catalyst load. Similarly, other studies have exposed TiO2 photocatalysts to UV light for discoloration of different types of dyes in wastewater such as Direct Red 23, Toluidine Blue, Safranin Orange, and Methylene Blue [21,22,23]. Apart from the catalyst load, several other factors which includes pH, temperature, wavelength, reaction time, and the pollutant concentration can influence the photocatalytic efficiency [24,25,26]. In response to this fact, optimization becomes an option to improve photocatalytic degradation efficiency. Herein response surface methodology (RSM) is proven as an effectual tool for process optimization with multi-complex operational factors [26,27,28]. A Box Behnken design (BBD), a type of RSM, has shown to be very efficient as compared to the central composite design (CCD) in estimating the correlation coefficient (R2) for a specified model, reduced experimental errors and good data fitness in the design, modeling and optimization of a process [24,28].
However, after degradation it is difficult to settle immobilized TiO2 nanoparticles in solution, so enhancing water clarity requires an extended period of time [21,23]. The probability of this resulting in the formation of non-degradable toxic intermediates seems very high, which is, therefore, increasing environmental and human health concern [18,22]. Ideally, due to the adsorption potential of activated carbon (AC), combining AC and photocatalytic systems [19] is an option for treating pollutants and minimizes the cumulative cost of disposal of wastewater residue. To the best of our knowledge, there is little knowledge in the literature on the use of activated carbon (AC) doped with TiO2 for photocatalytic degradation of BB41 via RSM optimization techniques. Therefore, this study presents the optimizing of photocatalytic degradation of BB41 in an aqueous medium by AC-TiO2 photocatalyst under UV light irradiation using RSM. Furthermore, the kinetic degradability of raw TiO2 and AC-TiO2 is comparatively explored.

2. Materials and Methods

2.1. Regeants and Materials

2.1.1. Chemicals

Basic Blue 41 (BB41, CAS Number 12270-13-2) of 40% dye with absorbance (λ = 617 nm) and molecular weight (C20H26N4O6S2) of 482.57 g/mol, hydrochloric acid (HCl) and sodium hydroxide (NaOH) were purchased from Sigma Aldrich (Durban, South Africa). All chemicals used, unless otherwise stated, were of analytical grade. The locally manufactured TiO2 supplied by Huntsman Tioxide (Durban, South Africa), is made up of anatase (75%) and rutile (25%) with mean particle size of 25 nm, specific surface area and density of 48 m2/g and 4.26 g/cm3, respectively. Activated carbon (AC) with specific surface area, pore-volume, and an ash content of 1576 m2/g, 0.967, and 3%, respectively, were supplied by a local South African industry (RTB Chemicals, Pietermaritzburg, South Africa).

2.1.2. Synthetized Textile Effluent

A stock solution of 2.5 M BB41 was prepared by diluting 30.16 g of the dye in 5 L deionized water coupled with 20 L of local wastewater [3]. HCl and NaOH were used for pH adjustment, measured with a Hannah pH—meter HI98130 (Hanna Instruments, Woonsocket, RI, USA). The main composition of the synthesized effluent was pH (7.55), COD (176.87 mg/L), color (54.8 Pt.Co) and turbidity (12.28 NTU). The COD and color was measured with a HACH DR 3900 (Hach Company, Loveland, CO, USA), while turbidity was measured by using a HI 98703 Portable Turbidimeter (Hanna Instruments, Veneto, Italy).

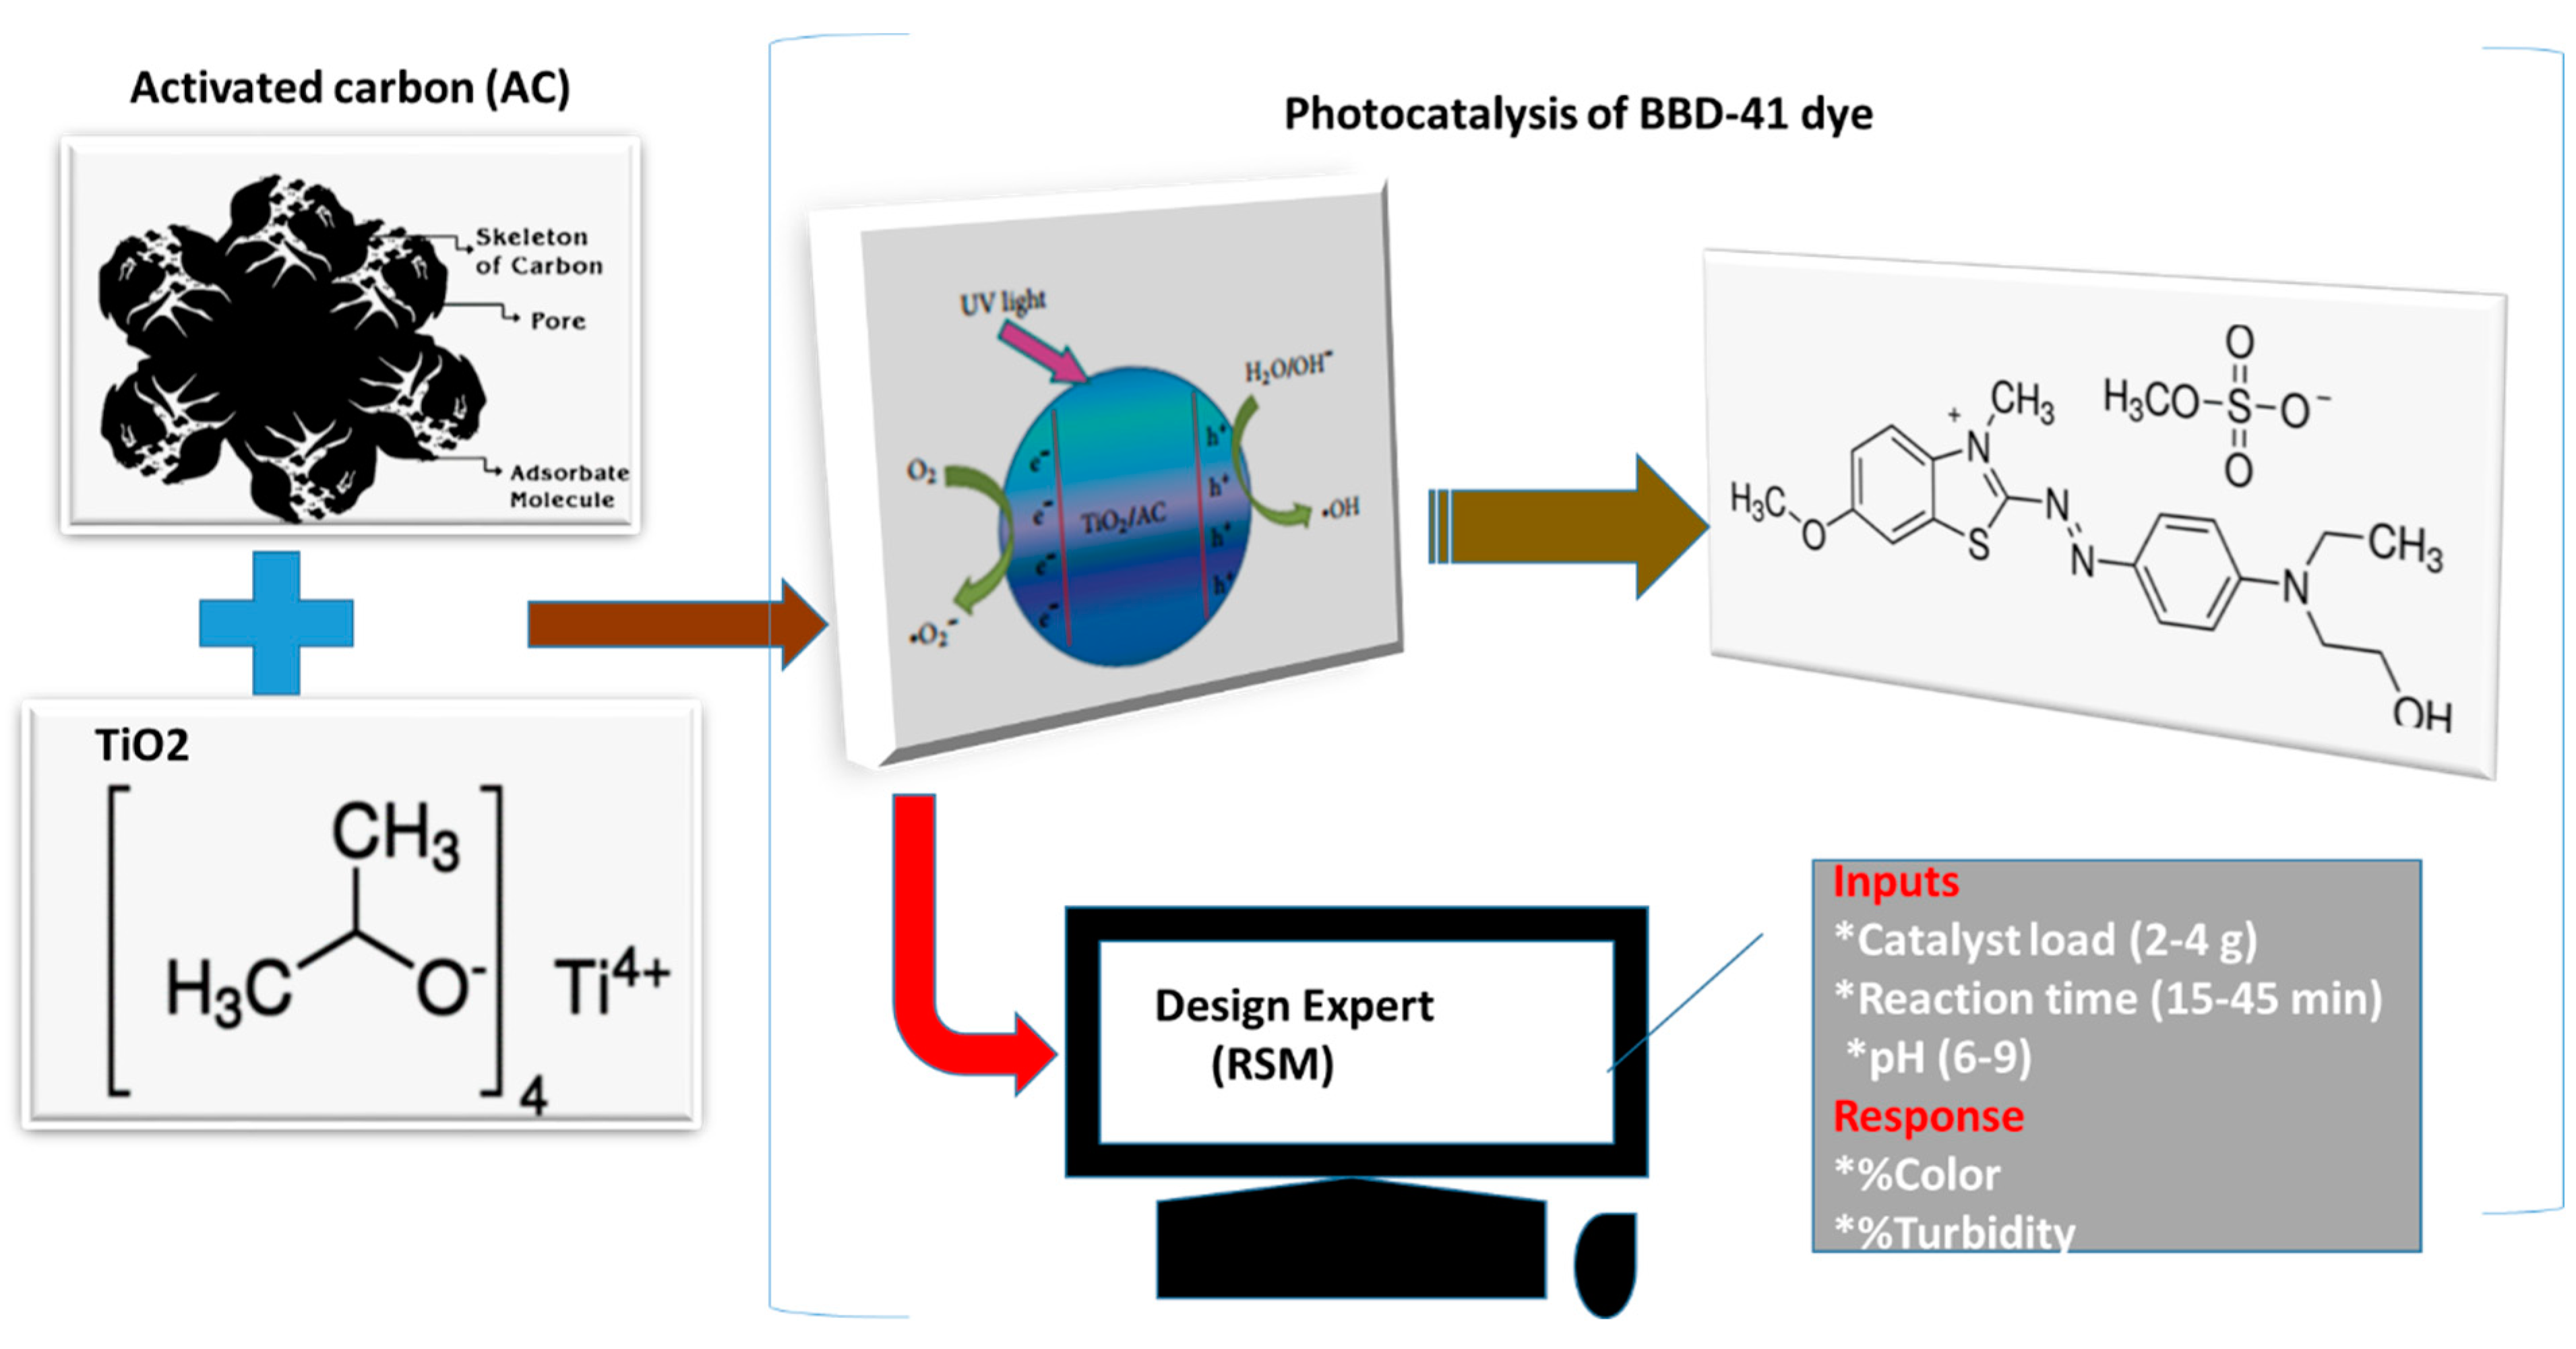
2.1.3. AC-TiO2 Composite Preparation and Characterization

The AC-TiO2 nanocomposite was prepared by the co-precipitation method assisted with a low temperature of 90 °C [29]. In brief, 30 g and 10 g of AC and TiO2, respectively was added to 200 mL of deionized water and sonicated at 45 kHz for 1 h. Successive overnight drying at 100 °C resulting in the AC-TiO2 composite was washed with deionized water/ethanol, filtered, and dried for 1 h at 110 °C to remove any excess impurities. Preceding, the AC-TiO2 was calcined at 600 °C for 1 h at a ramp speed of 15 s. The mineralogical constituent and phase magnitude of the composite was determined by X-ray diffraction (XRD) equipment (D8 Advance AXS, Bruker, Elmford, NY, USA) coupled with J-J scan and copper anode filter (Cu-Kα radiation: λ = 1.5406 Å) at the rate of 0.033°/min over a range of 5 to 70° (2θ). Fourier Transform Infrared spectroscopy (FTIR) analysis was carried out to identify the functional groups of the AC-TiO2 composite. This was carried out with a FTIR 8400 FTIR-spectrometer (Shimadzu, Columbia, MD, USA) in the wave-number range of 300–4000 cm−1 with a resolution of 4 cm−1.

2.2. Experimental Procedure

2.2.1. Photocatalytic Degradation

The photocatalytic degradation experiment was carried out in batch-wise mode using six 1 L reactors coupled with UV-T8 blacklight—blue bulb of wavelength 400 nm and power of 18 W, (Philips, Eindhoren, The Netherlands), under constant stirring at a speed of 150 rpm [24]. The reactor was placed in a closed chamber with the UV-light placed at a distance of less than 2 cm. To establish the photocatalytic kinetics, 3 g of each catalyst (TiO2 and AC-TiO2) was added to 500 mL dye solution. The irradiation time (10–60 min) was varied while the solution was constantly stirred. At each time interval of 10 min, supernatant samples were collected with a syringe and filtered through a Whatman filter (Grade 5; 2.5 µm). The kinetics degradation efficiency was monitored in terms of the COD removal, by using Equation (1). To estimate the rate of reaction constants for the first-order kinetic model (2), a plot of l n C o C   v s   t was developed:
Removal   efficiency   ( % )   =   C 0   C f C 0   ×   100
l n C o C =   k 1 t
where, k 1 is the first-order rate constant (min−1),     C 0 is the initial COD concentration, t is time and C f is the concentration at the specified time.

2.2.2. Design of Experiments

The photocatalytic efficiency (Figure 1) was investigated based on the experimental design with the three operating factors (Table 1). This was carried out by using the Box-Behnken design (BBD) by Design-Expert software (version 11.1.0.1) (Stat-Ease, Inc., MN, USA). The BBD is a factorial combination with a minimum of three factors that were studied under the randomized response surface methodology. The effect of three independent factors such as A: catalyst load (2–4 g), B: reaction time (15–45 min), and C: pH (6–9) was examined on photocatalysis with turbidity (Y1) and colour (Y2) as the responses. All the experiments were carried out in duplicate and average values obtained are reported.
From Table 1, the total number of the experiments was estimated by Equation (3). Seventeen experimental runs were obtained according to a three-level scale such as low (−1), medium (0), and high (+1) coupled with five center points (Cps). The responses (Y1 and Y2) were expressed as a function of the input variables (A, B, and C) by fitting the data obtained on a polynomial quadratic model (4). The empirical model developed depicts the influence of the input variables on the response within the design space [24]. Analysis of variance (ANOVA) was employed to evaluate the significance of the results statistically by considering p < 0.05 [26]:
N E =   k 2   +   k   +   C p
where   N E ,   k   and   C p   represents the total number of experiments, the number of factors, and the replicated number of center points. To analyze the pivotal relationship between the dependent and independent variables, the polynomial quadratic expressed in Equation (4) was utilized:
Y =   β 0   +   i = 1 K β i x i + i = 1 K β i i x i 2 + i = 1 K 1 j = 2 K β i j x i x j + ε
where, Y is a response variable, β 0   is a constant, β i is the regression coefficient, k is the number of independent variables, and ε is the unknown error constant. Also, the coded values of the independent variables were expressed by Equation (5):
x i = X i X i o Δ X i ,   i = 1 , 2 , 3 , k
where, xi are the coded values and Xi the real values of independent variables, Xio the real value in the center plane, and Δ X i the step change. The model’s overall prediction efficiency is commonly assessed by the coefficients of determination (R2), which can be calculated by Equation (6):
R 2 = S S r e s i d u a l   e r r o r S S t o t a l    
This coefficient is used to measure the total response variation of predicted values from the mean response. However, the addition of variables to the model increases R2 values irrespective of its statistical significance.

3. Results and Discussion

In this study, photocatalytic degradation of BB41 dye with a hybridized photocatalyst (AC-TiO2) was optimized using response surface methodology. This feasibility study was carried out to strengthen the knowledge of using TiO2 for photocatalysis and absorption processes. The results obtained are presented under Section 3.1, Section 3.2 and Section 3.3, respectively, denoting the physiochemical properties of the AC-TiO2 composite, photocatalytic kinetics, and response surface methodology.

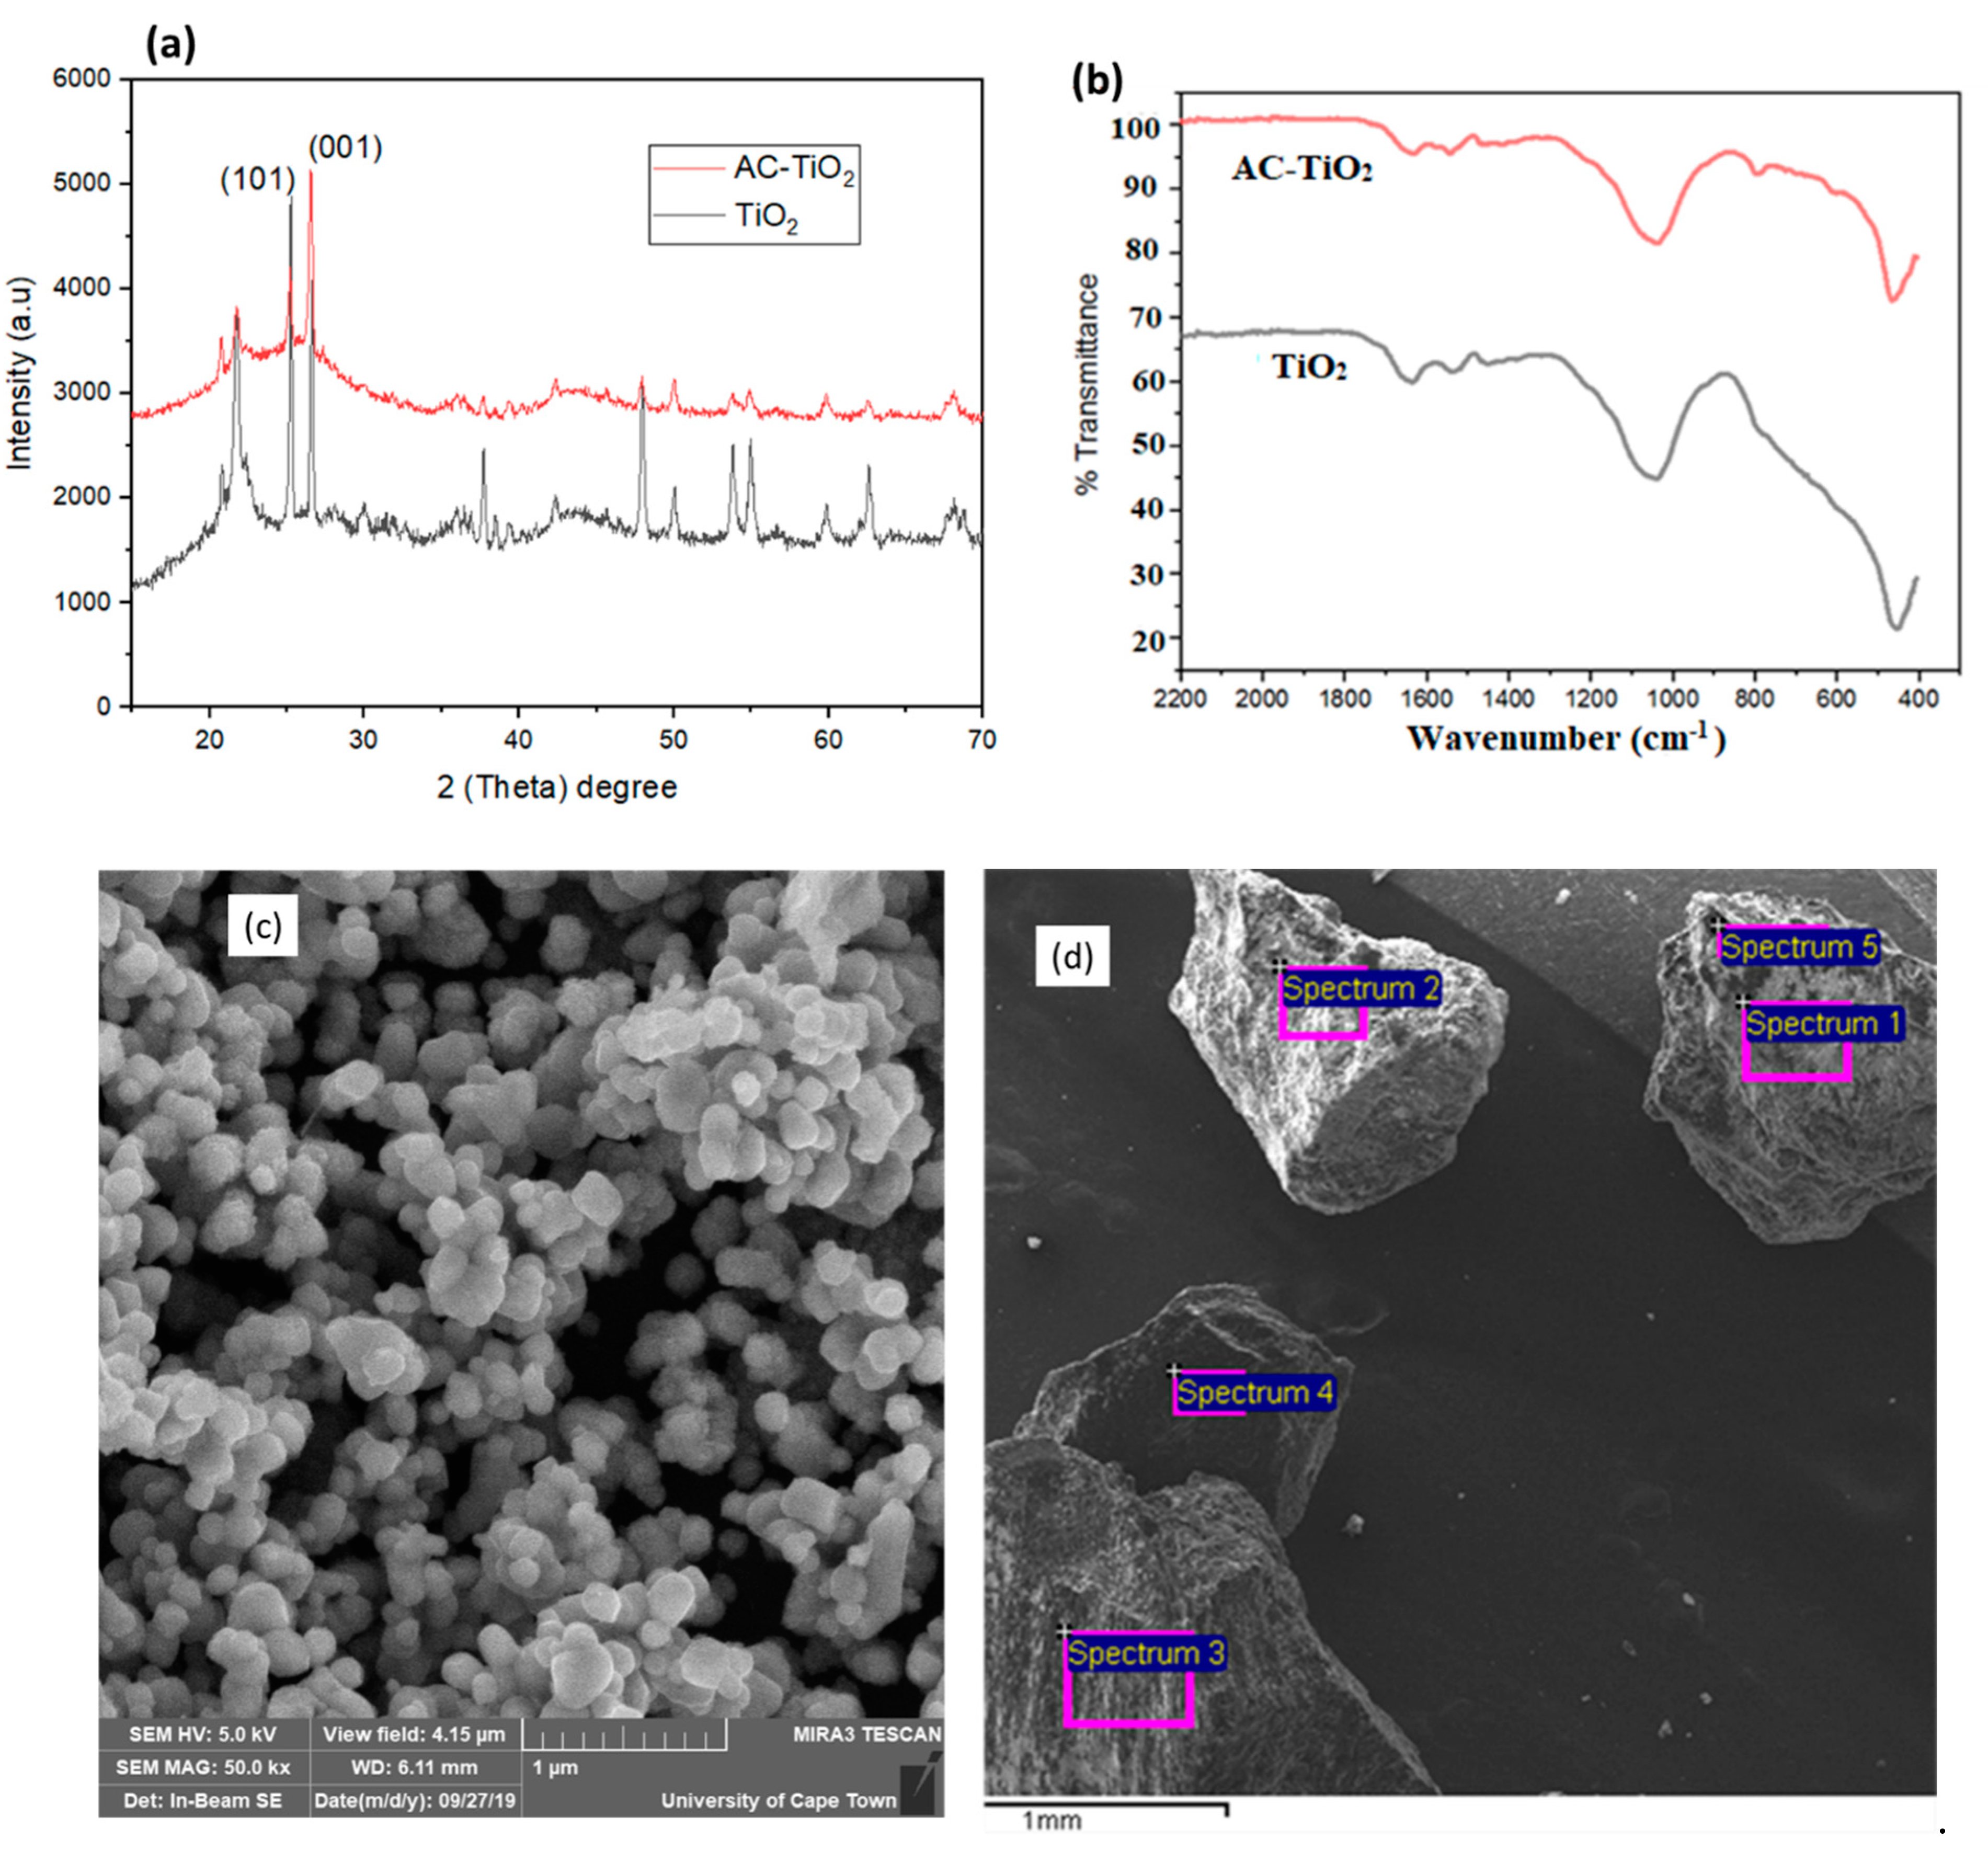
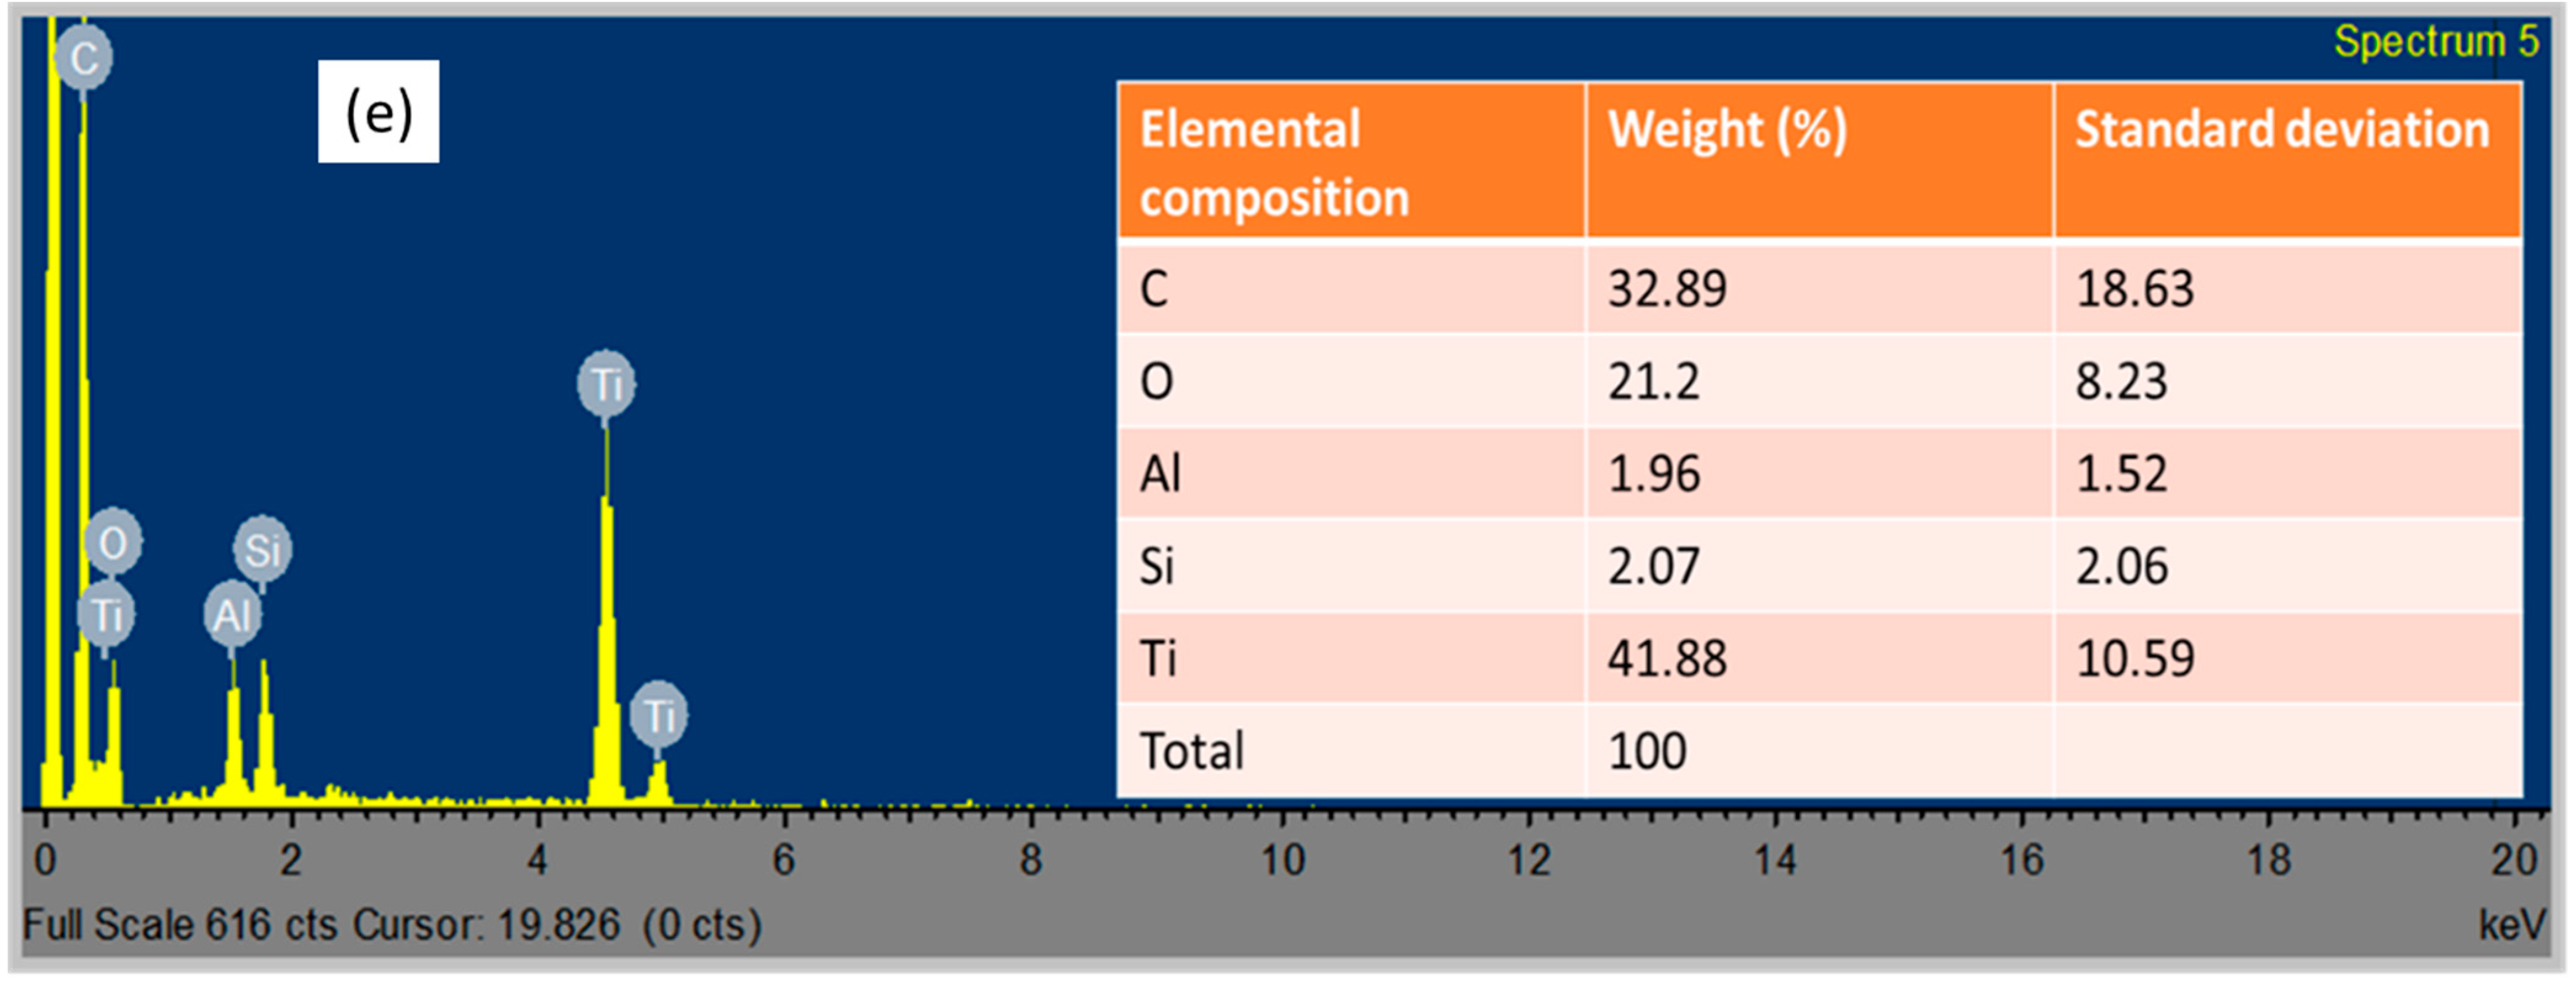
3.1. Physiochemical Properties of the Photocatalyst

Figure 2 presents the physiochemical results obtained. The XRD (Figure 2a) and FTIR (Figure 2b) spectra of the TiO2 and AC-TiO2 composite, confirm the successful impregnating of the TiO2 on the AC surface [15,30]. The crystalline phase of the catalysts (TiO2 and AC-TiO2) as observed by the XRD (Figure 2a) was seen to be very prominent, with anatase corresponding to the JCPDS Files No. 21-1272. At the scanning range of 20° > 2θ > 70°, the peaks observed at various diffractions of 27.47°, 36.07°, 37.80°, and 69.0° assigned to (001), (021), (210) and (220) reflects the rutile phase of TiO2. Whereas, the reflections of the peaks at 2θ of 25.4°, 48.02°, 50°, 54.19°, 55° and 62.72° were dispensed to (101), (110), (200), (211) (105) and (103) of the anatase plane. The rutile phase intensity is considerably less than that of the anatase phase [29,30]. The average crystalline size (28 nm to 22 nm) was then determined by Scherrer’s equation (Equation (7)) with the crystalline plane of (101) and (001) for anatase and rutile, respectively:
D = K δ β C o s   θ
where δ is the wavelength of X-ray radiation (CuKα = 0.15406 nm), k is a constant taken as 0.9. β is the line width at half maximum height (FWHM) of the peak (determined using Origin software), and θ is the diffraction angle of the most intense peaks of rutile (27.47°) and anatase (25.4°).
Figure 2b presents the FTIR spectra ranged with a wavenumber of 400–2200 cm−1. The spectrum also reveals the adsorption bands between the reactive hydroxyl groups and the hydrophobic and hydrophilic nature of TiO2 [12,15]. This is associated with the vibration and stretching modes of the TiO2 and different oxygenated functional groups. The peaks at 1400–1600 cm−1 represent the stretching of hydroxyl (OH) and carboxyl (C=O) groups which might have been caused by either water moisture or the titanium carboxylate [8,30]. There is evidence of a shift in the OH vibration band towards a lower wavenumber (<800 cm−1) of the AC-TiO2 spectra as compared to the TiO2 [15,29]. This might be due to the acid-base interaction of the OH group used in synthesizing the AC-TiO2 composite [29]. Lastly, the broad stretching peaks around 400–600 cm−1 is also the representation of the TiO2 bonding in the composite [8,12]. The surface morphology of the AC-TiO2 is represented by the SEM (Figure 2c) and EDX (Figure 2d) images. With scanning microscopy magnification (Figure 2c) of 50 kx and binding energy of 5 kV, grain size of 4.15 μm was viewed under the scale of 1 μm and working distance (WD) of 6.11 mm. EDX image (Figure 2d) under scale of 1mm revealed the TiO2 spectra (Figure 2e) at the binding energy of 0.5, 4.5 and 5 keV. This affirmed the success of incorporating the TiO2 with the AC. Also the elemental composition of the composite (AC-TiO2) was distinctively defined as Ti (41.88%) > C (32.89%) > O (21.2%) > Si (2.07%) > Al (1.96%).

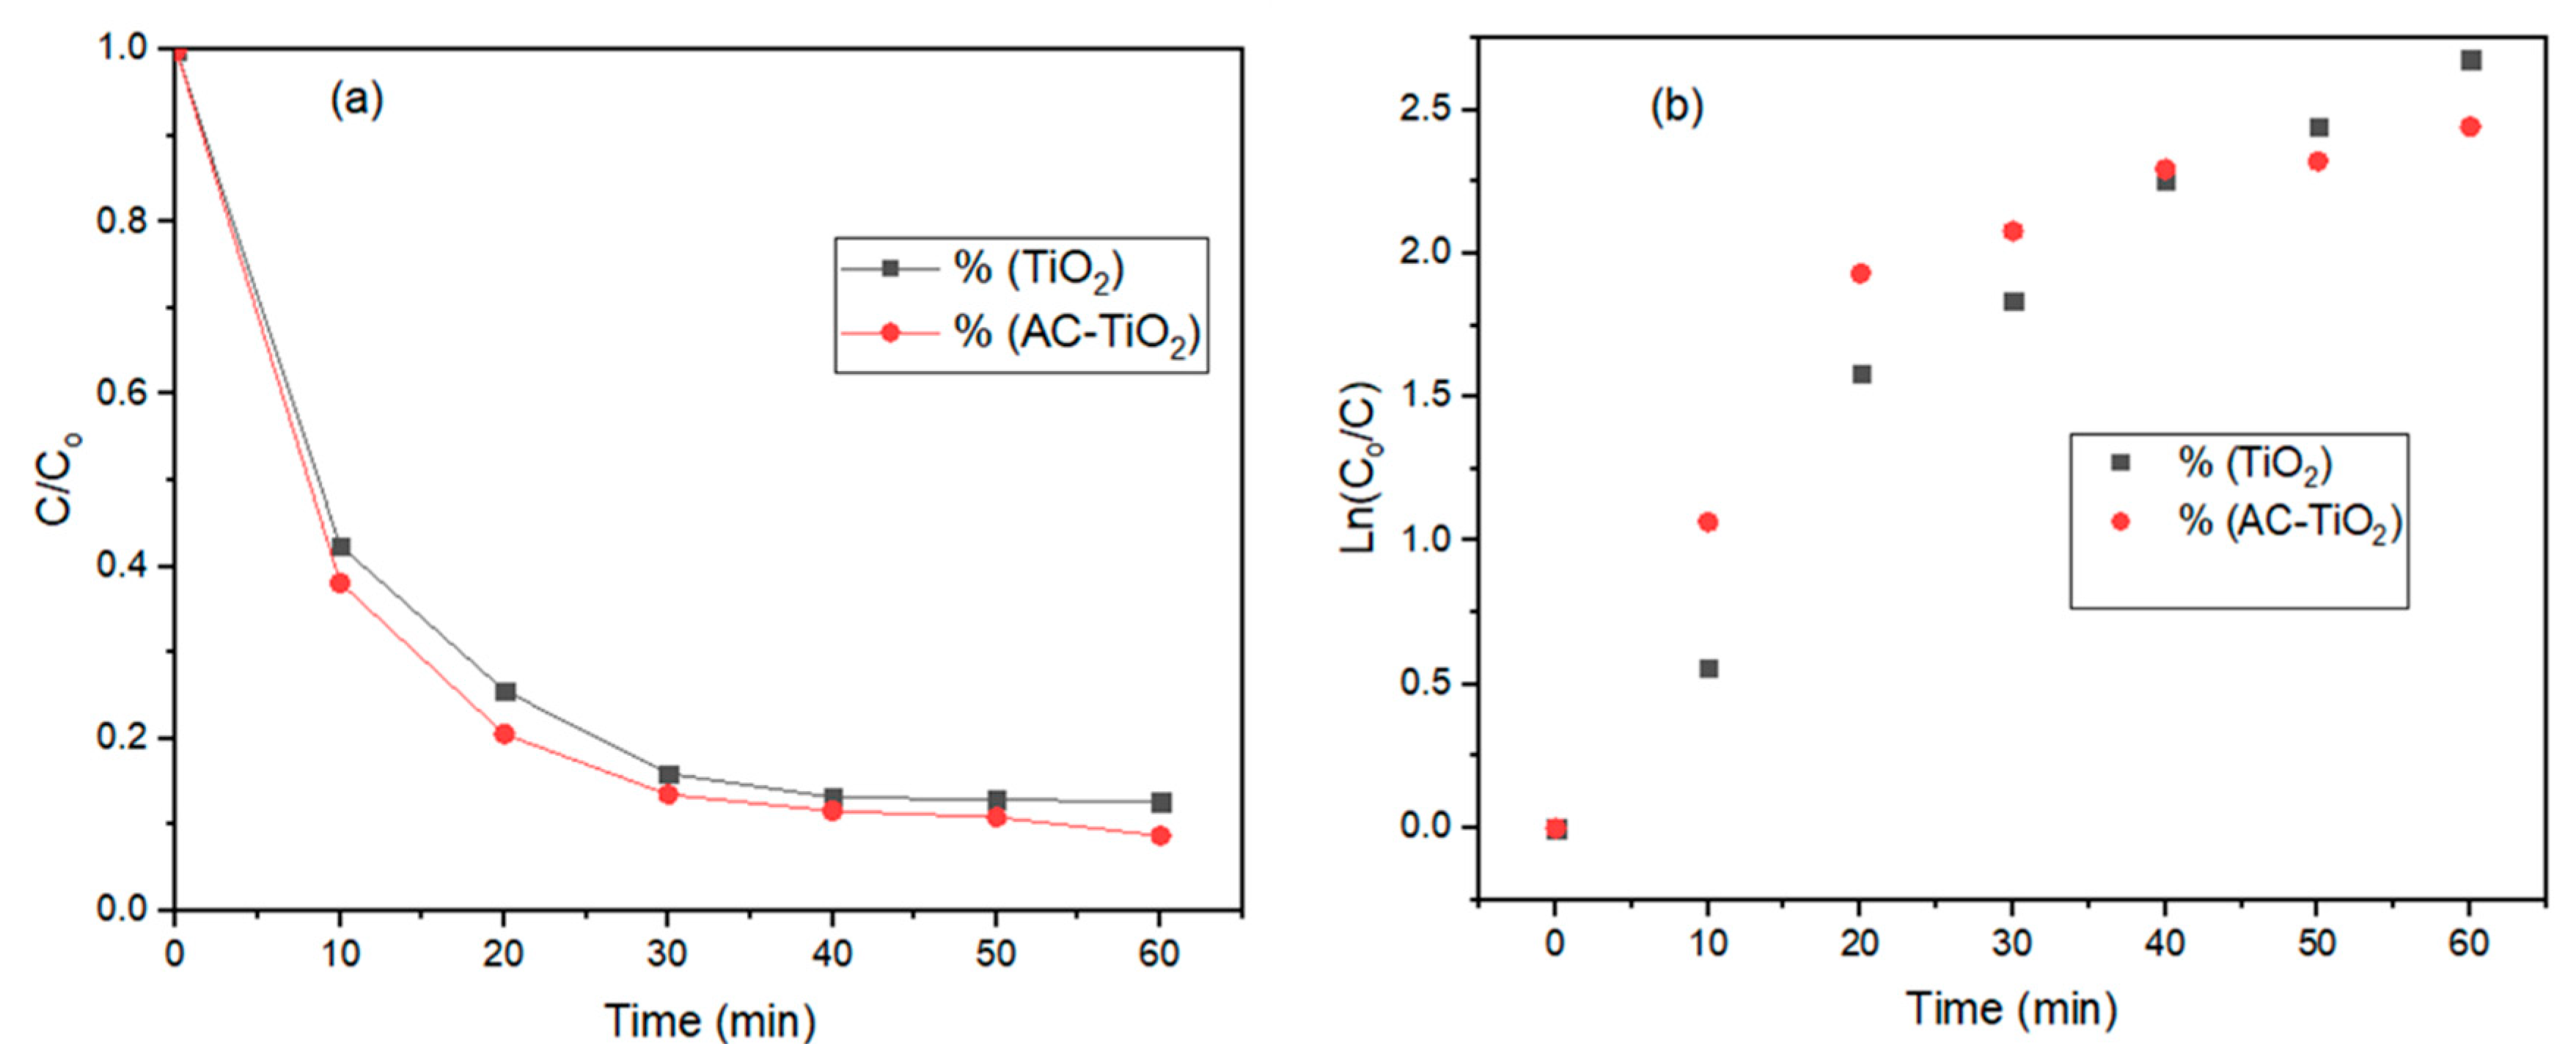
3.2. Photocatalytic Degradation Kinetics

Figure 3 presents the comparative effects of TiO2 and AC-TiO2 (Figure 3a), as well as their photocatalytic kinetics (Figure 3b) on the removal of COD from the effluent. Chemical oxygen demand (COD) as the organic strength of effluent, in this instant, was used to measure the efficacy of the catalyst. This is also attributed to the amount of oxygen required for the oxidation of the dye into CO2 and H2O, with the possible reactions presented in (8) and (9) [31,32]. To estimate the reduction values of the COD, the before and after treatment results obtained were used. Figure 3 denotes the mineralization of the dye organics (COD) along with an increase in the reaction time (10–60 min). However, rapid degradation was observed after the 30 min irradiation (Figure 3a), where it became stabilized within 40–50 min with a slight drift towards 60 min. The maximum degradation of 93% and 96% COD removal, respectively, by TiO2 and AC-TiO2 was obtained at the 50 min irradiation:
H 2 O + h + AC TiO 2 *   OH * + H + OH * + BB 41   molecule intermediates CO 2   + H 2 O + mineral   salts
Consequently, activation of TiO2 nanoparticles by the UV-light produced reactive species (OH), which facilitated the degradation of organics in the solution [12,33]. As shown in Figure 3b, the degradability followed the first-order kinetics for irradiation time less than 60 min. The kinetic rate constants were estimated as 0.0322 min−1 and 0.0366 min−1 for TiO2 and AC-TiO2, respectively, at regression coefficient (R2) values of 0.889 and 0.9188. The recorded residual sums of squares (SSR) were 0.7704 and 0.691 for TiO2 and AC-TiO2, respectively. It was found that the degradability of COD was a function of the irradiation time, thus confirming previous kinetic studies on the degradation of organic pollutants in wastewater that generally followed Langmuir-Hinshelwood (L–H) kinetics [12,31].

3.3. Response Surface Methodology (RSM)

The experimental runs, as mentioned earlier, were designed by the RSM via the BBD to investigate the key operating parameters such as catalyst load (A), reaction time (B), and pH (C). The BBD matrix obtained with 17 randomized sets of experimental runs, along with the response and predicted results obtained, is presented in Table 2. The maximum removal of the contaminants (colour and turbidity) obtained was within the range of 90–95% for the actual results with a deviation of less than 5% from the predicted values. The experimental data (Table 2) was fitted to a reduced quadratic model (Equations (10) and (11)) and their statistical significance and validity were tested via the analysis of variance (ANOVA) detailed under Section 3.3.1. The model Equations (10) and (11) are expressed with the actual values of the input parameters (A, B, C), their interaction (AB, AC), and quadratic (B2, C2) terms as a function of the responses ( Y 1   and   Y 2 ). The positive sign represents the synergistic effect of the term on the response, whereas, the negative sign points out an antagonistic effect. In this view, the increasing order of the effect of the terms for the removal of colour follows AC > B2 > AB > B > A > C, whereas that of the turbidity removal is AC > AB > B > C2 > A > C. Also, the optimal values of the parameters are obtained by estimating the regression equation and the analysis of the surface response:
Color   ( Y 1 ) = 148.575 8.438   5 A 1.04 B 8.668 C 0.163   1 AB + 2.288   AC + 0.0256   B 2
Turbidity   ( Y 2 ) = 143.429 9.3017   A 0.2023 B 9.472 C + 0.0876 AB + 2.667   AC 1.807 C 2

3.3.1. Analysis of Variance (ANOVA)

The model robustness in this study is evaluated by both the coefficient of determination R2 and adjusted-R2 with an estimated difference of less than 0.2 (Table 3). The fit statistics, as presented in Table 3, show that the predicted R2 of 0.886 and 0.893 for color and turbidity, respectively, were in reasonable agreement with the adjusted R2 of 0.966 and 0.975, where their difference is less than 0.2, suggesting good predictability of the models. Considering the acceptable threshold value of R2, which should be greater than or equal to 0.8, it becomes more relevant when it is closer to 1 [27,28]. The statistical significance (p < 0.05) of the model and its validity are tested by using the ANOVA (Table 4 and Table 5), with additional information such as the Fisher variation ratio (F-value), adequate precision, coefficient of variance (CV), probability value (Prob > F) and lack of fit. As shown in Table 4 and Table 5, the F-value and Prob > F values for the models and their independent parameters were found to be significant because of their p-values < 0.05. Also, there is only a 0.01% chance that an F-value this large could occur due to noise. Therefore, model terms with their p-values > 0.05 (insignificant), were not considered via model reduction to improve the models because they are not required to support the model hierarchy [34].

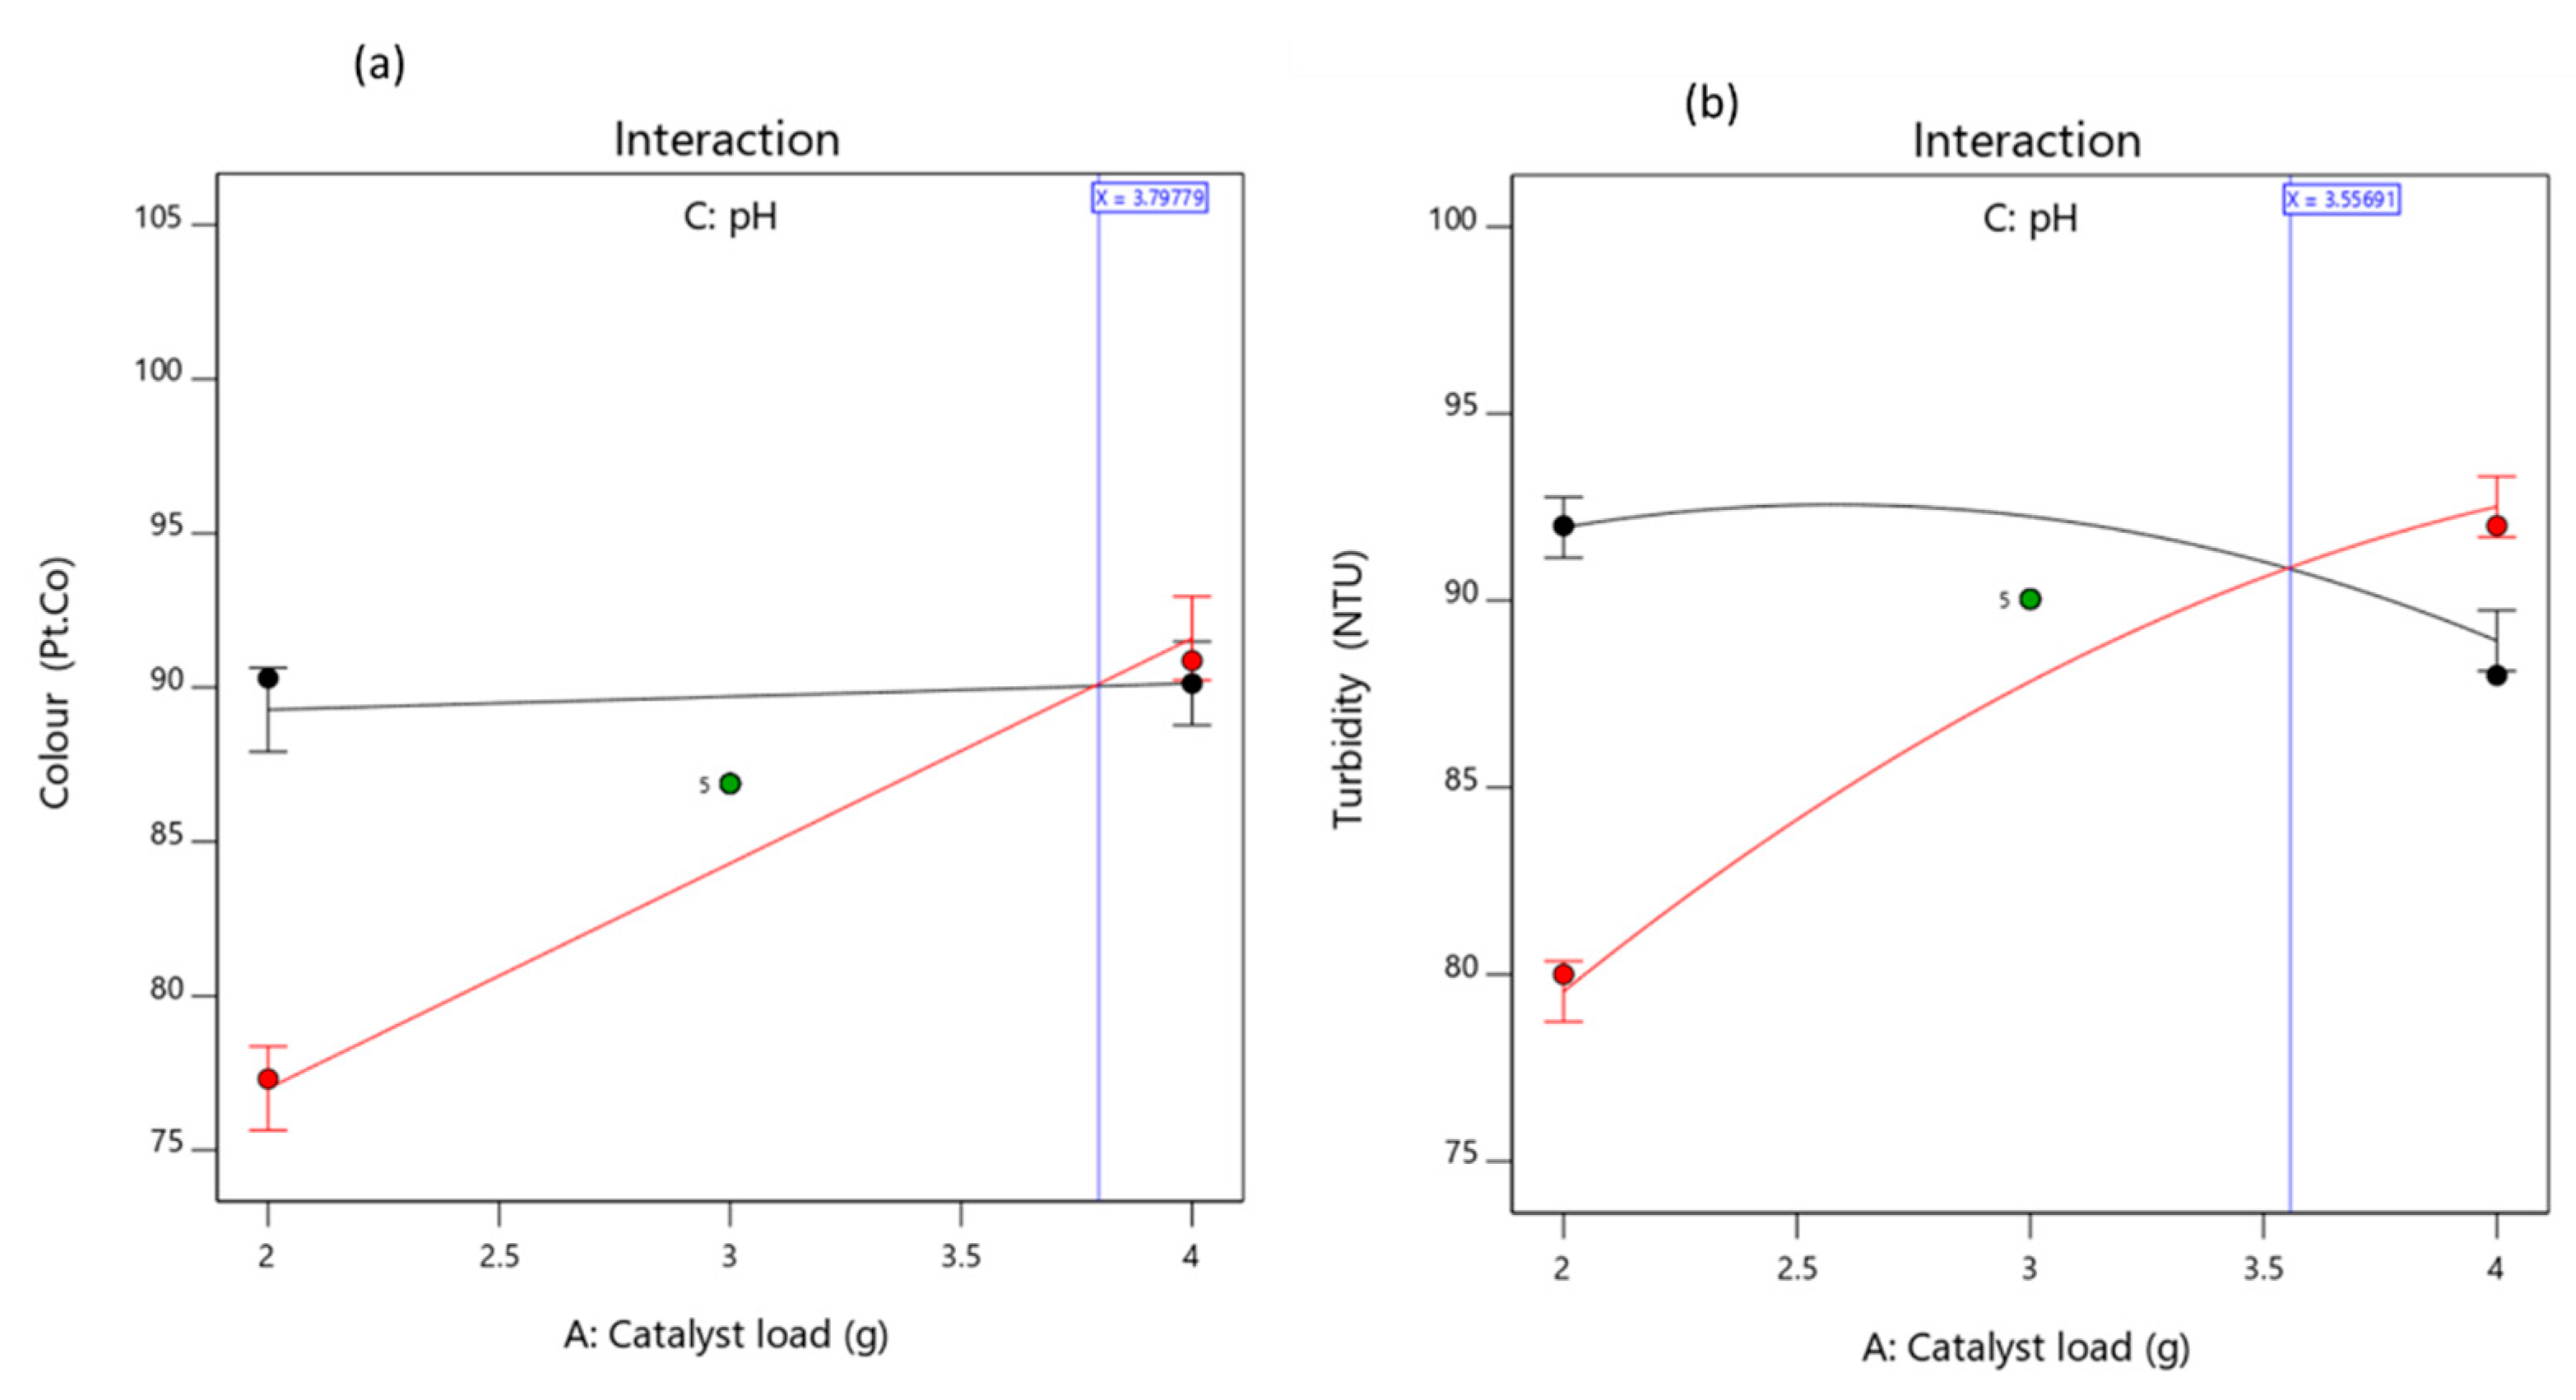
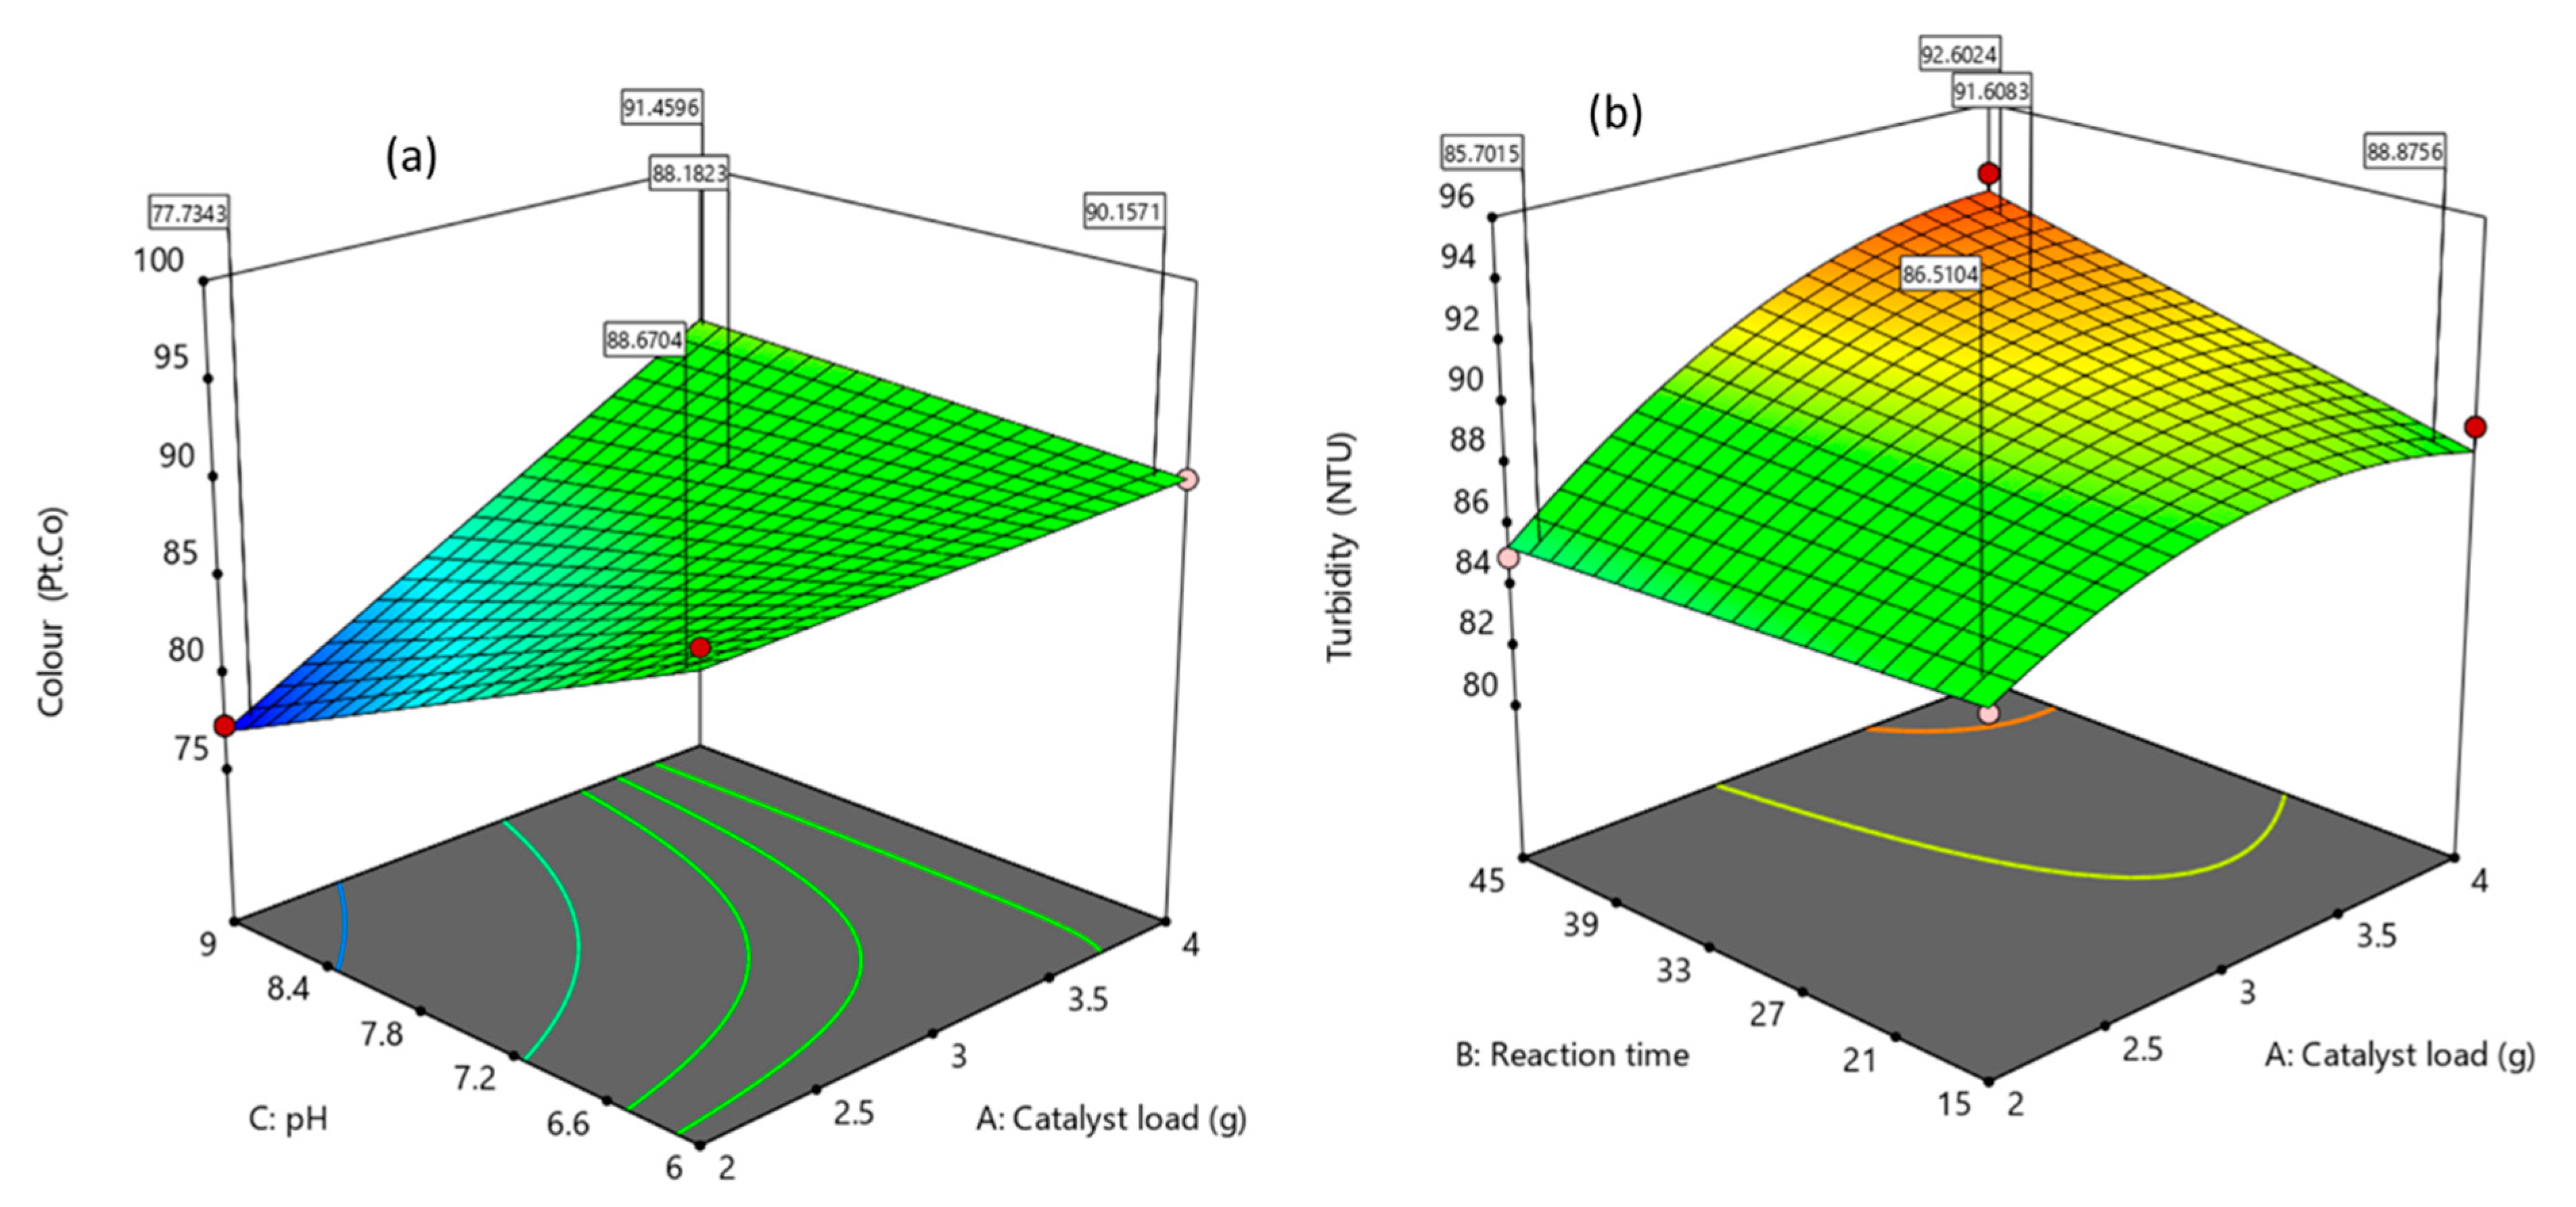
3.3.2. Effects of the Factors and Their Interaction on the Responses

To study the interactive effects of the factors on the response, first one factor was varied at a time while keeping the other two process variables constant. Figure 4a–f shows the visual representation effects of each factor on the response. Figure 4a,d elucidate the effects of the catalyst dosage (2–4 mg/L) on the decrease of colour and turbidity, respectively. Decomposition efficiency increases with an increase in catalyst load up to 3.5 mg/L, beyond which there is a gradual reduction in terms of the removal of turbidity (Figure 4b). Thus, the more active sites made available in turn increases the rate of radical formation which increased the efficiency [35,36]. However, the overdosed catalyst load contributed to the turbidity of the solution by retarding the light penetration to activate the catalyst for collision with the colloids [35,36]. This resulted in the reduction of the turbidity efficiency (Figure 4b). Figure 4b,e, present the development of irradiation time which caused high organics degradation in terms of colour and turbidity, respectively. Mineralization of colour became less efficient within 20–30 min before increasing at 45 min, which might be due to the probability of slow reaction and deactivation of the active sites caused by the complex intermediaries with OH radicals [35,37]. Conversely, increasing the pH (6–9) decreased the colour (Figure 4c) and turbidity (Figure 4f) efficiency. This affirms that pH affects the pollutant charge neutralization with higher efficiency in the acidic medium (pH < 6) than the neutral (pH = 7) and alkaline conditions (pH > 7) [8,27].
Figure 5 and Figure 6 also confirmed that the interaction relationship between the catalyst load and pH has a significant impact on the photocatalytic activity on both responses (colour and turbidity). The three-dimensional response (3D) surface (Figure 6) was plotted based on the models (10) and (11) predicted removal efficiency, whereas, the reaction time was kept constant. This confirms that the interactive effects (AC) are predominant in comparison with the individual (A and C) and quadratic effects (A2, C2). This is in agreement with other reported studies, whereby the catalyst dosage can be considered as the most influential factor.

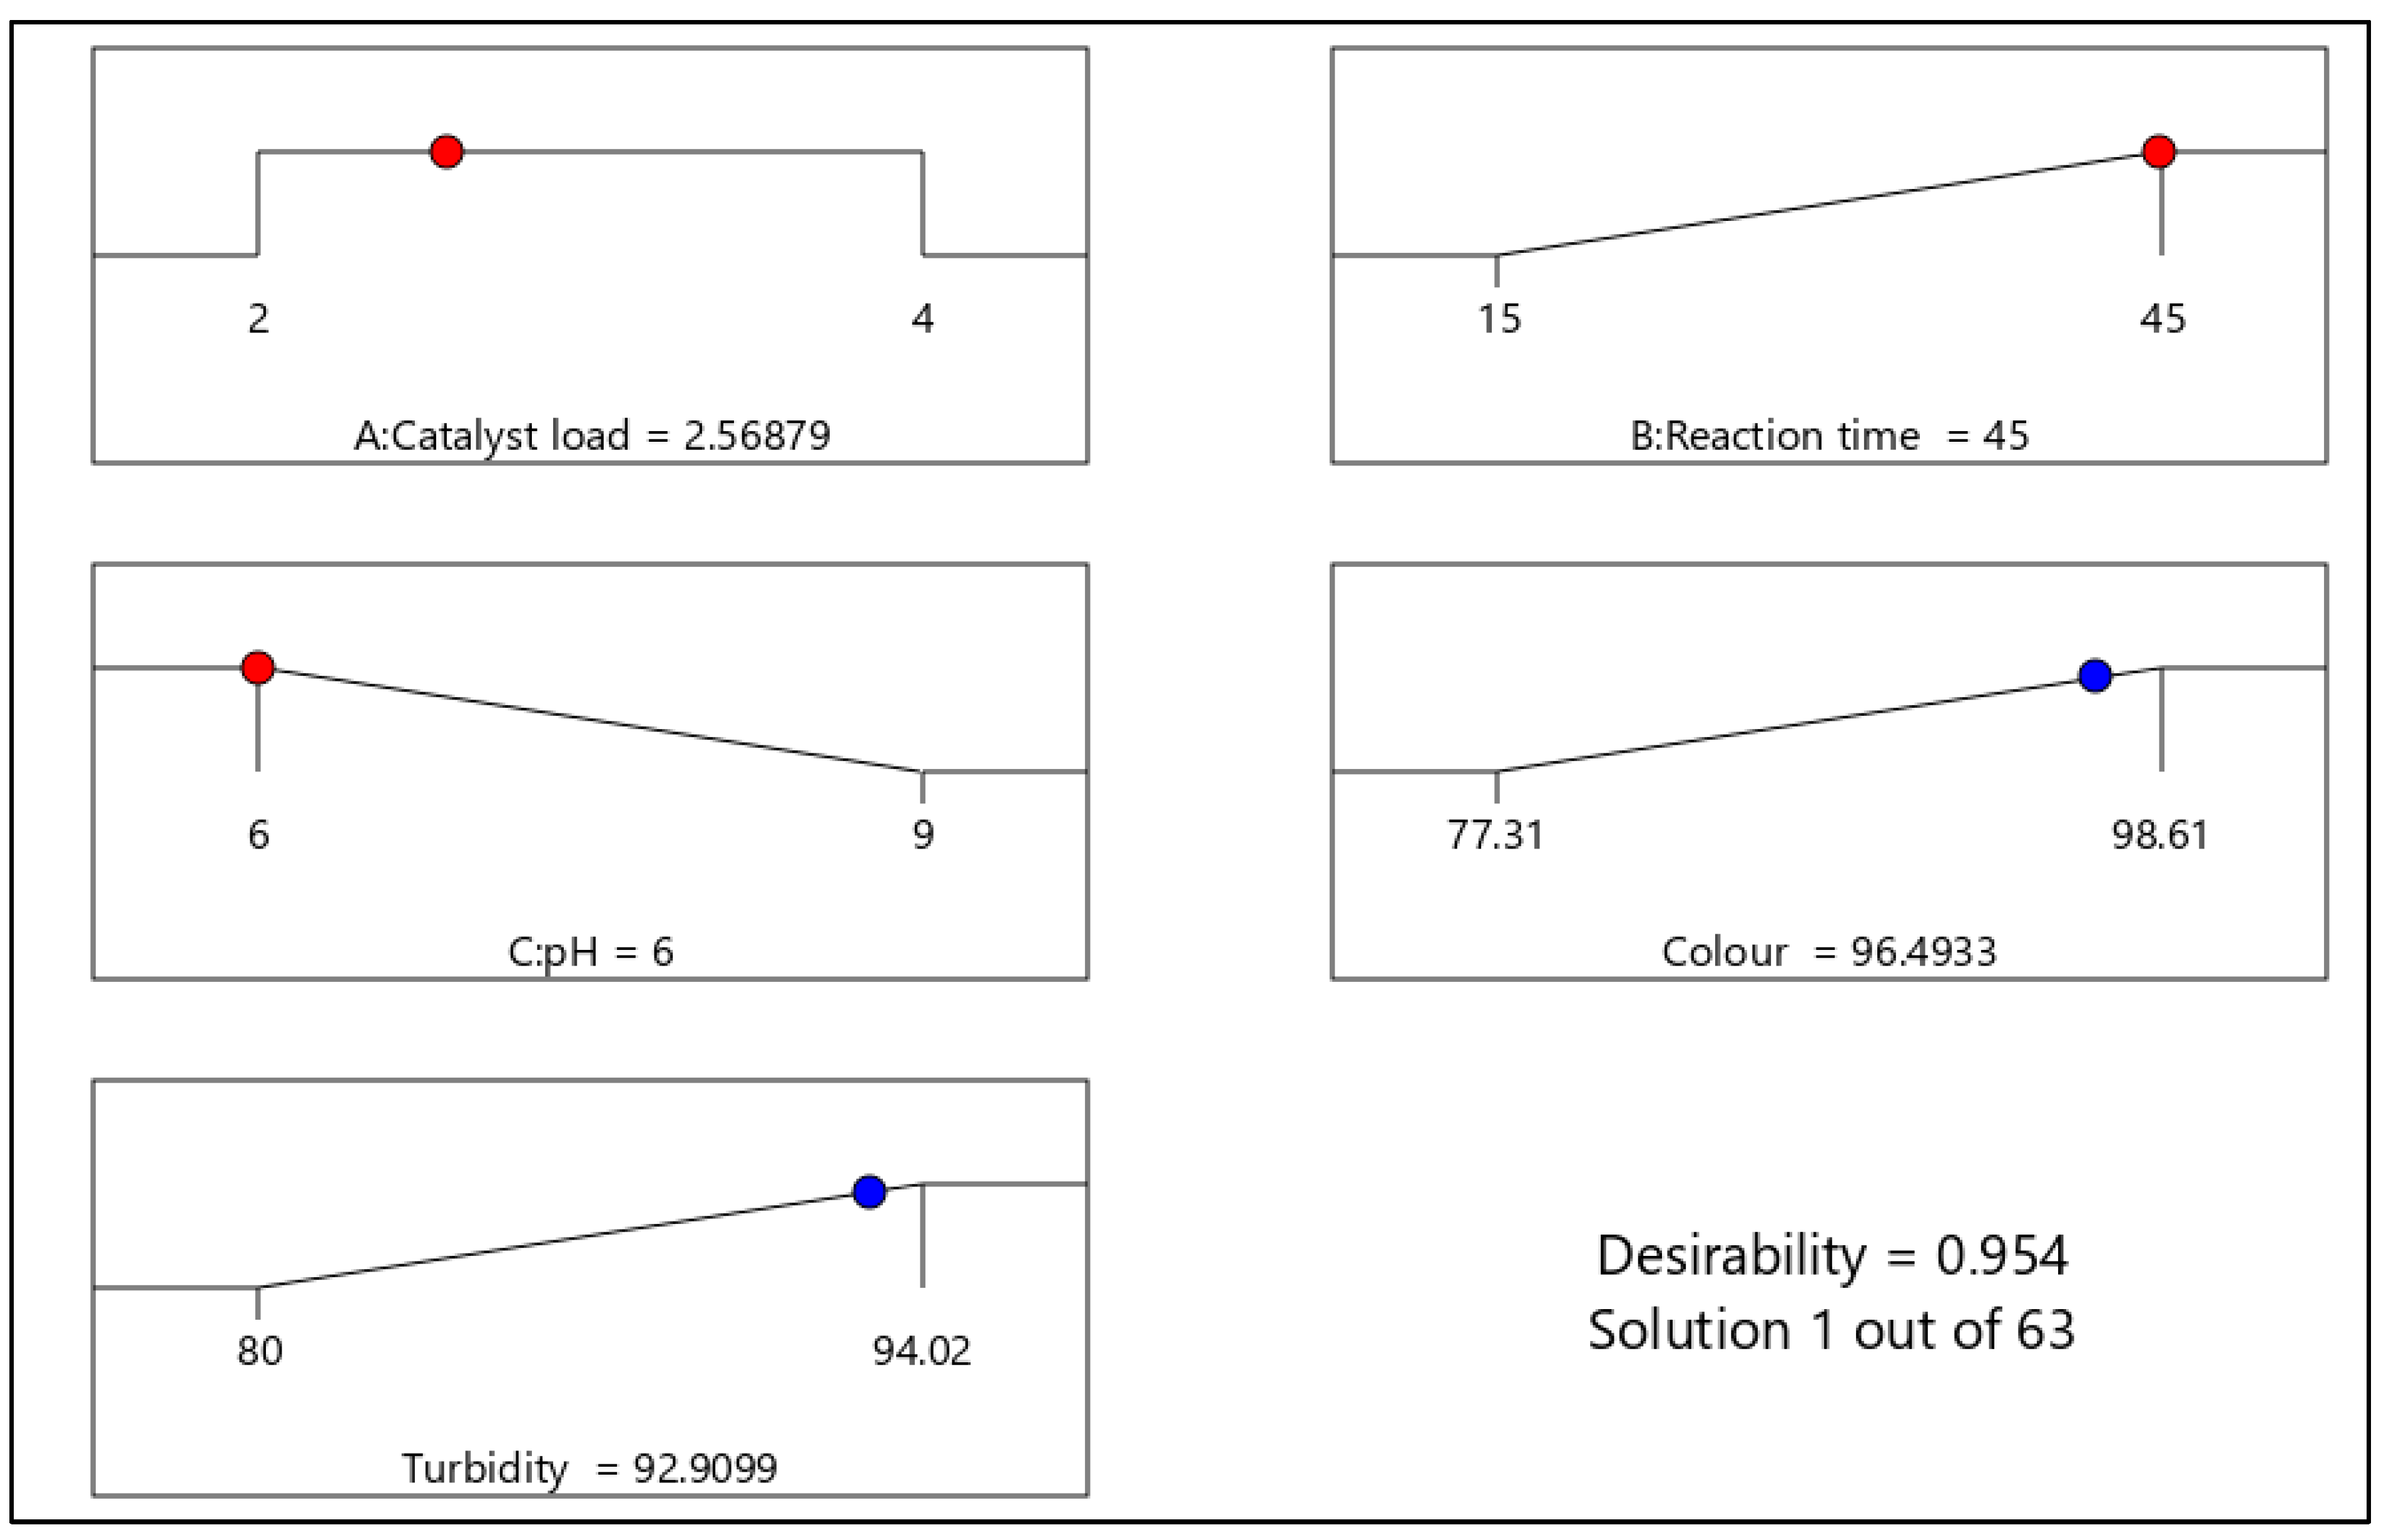
3.3.3. Numerical Optimization

To maximize the pollutant abatement, the Design-Expert software numerical optimization was carried out by setting individual factor values within their respective range such as catalyst load (2–4 g), reaction time (15–45 min) and pH (6–9), whereas the responses (colour and turbidity) were set at maximum with 95% confidence level. The desirability function approach was carried out, where the optimized conditions obtained are presented in Figure 7. In Table S1, out of 63 sets of solutions obtained, the most desirable (95.4%) and optimum condition selected is presented in Figure 7. Thus an optimum catalyst load of 2.6 g, a reaction time of 45 min and pH of 6 that resulted in 96.5% and 92.9% of colour and turbidity removal, respectively, was established. Additional optimum conditions with parametric constraints and desirability are presented in Table S1. Furthermore, the optimum conditions obtained were confirmed and verified experimentally which was closer to the predicted results with less than 2% deviation. This is agreeable to other studies suggesting RSM is economically viable for experimental optimizations based on its predictability with precision [27,28].

4. Conclusions

This study presented a co-precipitate of TiO2 impregnated on activated carbon (AC-TiO2) as a potential photocatalyst for wastewater treatment by optimizing the operating conditions (catalyst load, reaction, and pH) via response surface methodology (RSM). The crystal structure and functional groups were revealed by XRD and FTIR analysis. Furthermore, comparative performance and kinetic degradability between the AC-TiO2 and raw TiO2 were explored based on chemical oxygen demand (COD) reduction. First-order kinetic rate constants were estimated as 0.0322 min−1 and 0.0366 min−1 for TiO2 and AC-TiO2, respectively, with regression coefficient (R2) values of 0.9589 and 0.9828.
Results obtained by the Box-Behnken design (BBD) matrix were employed for modelling and optimization of the aforementioned operating conditions on photocatalytic degradation of colour and turbidity. A reduced quadratic model was developed as a function of the three input parameters and the responses were seen to be highly significant (p < 0.005). The models showed good predictability with a high correlation between the experimental values and the model-predicted values at a 95% confidence level. Catalyst load and pH was found to be the factors with the most influential impact on the response. The optimal conditions were found at a catalyst load of 2.6 g, reaction time of 45 min, and pH of 6, respectively, for 96.5% and 92.9% of colour reduction and turbidity removal via a numerical optimization. The optimal conditions were verified and confirmed experimentally to show less than 2% deviation. This confirms the use of BBD via RSM as viable for optimization and modelling photocatalytic systems in wastewater settings.

Supplementary Materials

The following are available online, Table S1. Numerical optimized conditions.

Author Contributions

Conceptualization S.R. and E.K.T.; methodology, E.K.T., E.O.E. and D.A.-S.; validation, E.K.T., and E.K.A.; formal analysis, E.K.T.; resources, E.K.T. and S.R.; writing—original draft preparation, E.K.T., and E.K.A.; writing—review and editing, D.A.-S., E.O.E., and S.R.; supervision, S.R.; project administration, E.K.T. All authors have read and agreed to the published version of the manuscript.

Funding

This research was funded by Water Research Commission: WRC Project: C2019/2020-00212.

Institutional Review Board Statement

Not applicable.

Informed Consent Statement

Not applicable.

Data Availability Statement

Not applicable.

Acknowledgments

Thanks to the Durban University of Technology, the Green Engineering and Sustainability Research Group, and the Water Research Commission (WRC), South Africa for their support on the project identification WRC Project: C2019/2020-00212.

Conflicts of Interest

The authors declare no conflict of interest. The funders had no role in the design of the study; in the collection, analyses, or interpretation of data; in the writing of the manuscript.

References

  1. Kumara, N.T.R.N.; Lim, A.; Lim, C.M.; Petra, M.I.; Ekanayake, P. Recent progress and utilization of natural pigments in dye sensitized solar cells: A review. Renew. Sustain. Energy Rev. 2017, 78, 301–317. [Google Scholar]
  2. Shindy, H.A. Fundamentals in the chemistry of cyanine dyes: A review. Dyes Pigments 2017, 145, 505–513. [Google Scholar]
  3. Singh, H.B.; Bharati, K.A. Handbook of Natural Dyes and Pigments; Woodhead Publishing India: New Delhi, India, 2014. [Google Scholar]
  4. Ahmad, W.A.; Ahmad, W.Y.W.; Zakaria, Z.A.; Yusof, N.Z. Application of Bacterial Pigments as Colorant; Springer: Cham, Switzerland, 2012. [Google Scholar]
  5. Gürses, A.; Açıkyıldız, M.; Güneş, K.; Gürses, M.S. Dyes and Pigments: Their Structure and Properties. In Dyes and Pigments; Springer: Cham, Switzerland, 2016. [Google Scholar]
  6. Gao, Y.; Yang, B.; Wang, Q. Biodegradation and Decolorization of Dye Wastewater: A Review. In IOP Conference Series: Earth and Environmental Science; IOP Publishing: Bristol, UK, 2018. [Google Scholar]
  7. Arora, S. Textile Dyes: It’s Impact on Environment and its Treatment. J. Bioremediation Biodegrad. 2014. [Google Scholar] [CrossRef]
  8. Haq, I.U.; Ahmad, W.; Ahmad, I.; Yaseen, M. Photocatalytic oxidative degradation of hydrocarbon pollutants in refinery wastewater using TiO2 as catalyst. Water Environ. Res. 2020. [Google Scholar] [CrossRef]
  9. Miklos, D.B.; Remy, C.; Jekel, M.; Linden, K.G.; Drewes, J.E.; Hübner, U. Evaluation of advanced oxidation processes for water and wastewater treatment—A critical review. Water Res. 2018, 139, 118–131. [Google Scholar]
  10. Cheremisinoff, P.N. Handbook of Water and Wastewater Treatment Technology; Butterworth–Heinemann: Oxford, UK, 2019. [Google Scholar]
  11. Tetteh, E.K.; Rathilal, S. Kinetics and nanoparticle catalytic enhancement of biogas production from wastewater using a magnetized biochemical methane potential (Mbmp) system. Catalysts 2020, 10, 1200. [Google Scholar]
  12. Durgalakshmi, D.; Rakkesh, R.A.; Rajendran, S.; Naushad, M. Principles and Mechanisms of Green Photocatalysis; Springer: Cham, Switzerland, 2020. [Google Scholar]
  13. Raja, S.; Mattoso, L.H.C. Functionalized Polymer-Based Composite Photocatalysts; Springer: Cham, Switzerland, 2020. [Google Scholar]
  14. Huang, C.W.; Wu, M.C. Photocatalytic degradation of methylene blue by UV-assistant TiO2 and natural sericite composites. J. Chem. Technol. Biotechnol. 2020, 95, 2715–2722. [Google Scholar]
  15. Zhong, J.; Chen, F.; Zhang, J. Carbon-deposited TiO2: Synthesis, characterization, and visible photocatalytic performance. J. Phys. Chem. C. 2010, 114, 933–939. [Google Scholar]
  16. Sacco, O.; Vaiano, V.; Sannino, D. Main parameters influencing the design of photocatalytic reactors for wastewater treatment: A mini review. J. Chem. Technol. Biotechnol. 2020, 95, 2608–2618. [Google Scholar]
  17. Fibers, T.N.; Alahiane, S.; Qourzal, S.; el Ouardi, M.; Abaamrane, A.; Assabbane, A. Factors Influencing the Photocatalytic Degradation of Reactive Yellow 145 by TiO2-Coated Non-Woven Fibers. Am. J. Anal. Chem. 2014, 5, 445–454. [Google Scholar]
  18. Chanderia, K.; Kumar, S.; Sharma, J.; Ameta, R.; Punjabi, P.B. Degradation of Sunset Yellow FCF using copper loaded bentonite and H2O2 as photo-Fenton like reagent. Arab. J. Chem. 2017, 10, S205–S211. [Google Scholar]
  19. Narayanasamy, L.; Murugesan, T. Degradation of Alizarin Yellow R using UV/H2O2 advanced oxidation process. Environ. Prog. Sustain. Energy 2014, 33, 482–489. [Google Scholar]
  20. Natarajan, S.; Bajaj, H.C.; Tayade, R.J. Recent advances based on the synergetic effect of adsorption for removal of dyes from waste water using photocatalytic process. J. Environ. Sci. 2018, 65, 201–222. [Google Scholar]
  21. Usman, M.; Ahmed, A.; Yu, B.; Peng, Q.; Shen, Y.; Cong, H. Photocatalytic potential of bio-engineered copper nanoparticles synthesized from Ficus carica extract for the degradation of toxic organic dye from waste water: Growth mechanism and study of parameter affecting the degradation performance. Mater. Res. Bull. 2019, 120, 110583. [Google Scholar]
  22. Rosu, M.C.; Coros, M.; Pogacean, F.; Magerusan, L.; Socaci, C.; Turza, A.; Pruneanu, S. Azo dyes degradation using TiO2-Pt/graphene oxide and TiO2-Pt/reduced graphene oxide photocatalysts under UV and natural sunlight irradiation. Solid State Sci. 2017, 70, 13–20. [Google Scholar]
  23. Liu, N.; Wang, H.; Weng, C.H.; Hwang, C.C. Adsorption characteristics of Direct Red 23 azo dye onto powdered tourmaline. Arab. J. Chem. 2018, 11, 1281–1291. [Google Scholar]
  24. Tetteh, E.K.; Rathilal, S.; Naidoo, D.B. Photocatalytic degradation of oily waste and phenol from a local South Africa oil refinery wastewater using response methodology. Sci. Rep. 2020, 10, 1–12. [Google Scholar]
  25. Gopinath, K.P.; Madhav, N.V.; Krishnan, A.; Malolan, R.; Rangarajan, G. Present applications of titanium dioxide for the photocatalytic removal of pollutants from water: A review. J. Environ. Manag. 2020, 270, 110906. [Google Scholar]
  26. Rodrigues, C.S.D.; Madeira, L.M.; Boaventura, R.A.R. Optimization of the azo dye Procion Red H-EXL degradation by Fenton’s reagent using experimental design. J. Hazard. Mater. 2009, 164, 987–994. [Google Scholar]
  27. Chaker, H.; Ameur, N.; Saidi-Bendahou, K.; Djennas, M.; Fourmentin, S. Modeling and Box-Behnken design optimization of photocatalytic parameters for efficient removal of dye by lanthanum-doped mesoporous TiO2. J. Environ. Chem. Eng. 2020. [Google Scholar] [CrossRef]
  28. Garg, A.; Kaur, G.; Sangal, V.K.; Bajpai, P.K.; Upadhyay, S. Optimization methodology based on neural networks and box-behnken design applied to photocatalysis of acid red 114 dye. Environ. Eng. Res. 2020, 25, 753–762. [Google Scholar]
  29. Lee, Y.F.; Chang, K.H.; Hu, C.C.; Lin, K.M. Synthesis of activated carbon-surrounded and carbon-doped anatase TiO2 nanocomposites. J. Mater. Chem. 2010, 20, 5682–5688. [Google Scholar]
  30. Shen, M.; Wu, Z.; Huang, H.; Du, Y.; Zou, Z.; Yang, P. Carbon-doped anatase TiO2 obtained from TiC for photocatalysis under visible light irradiation. Mater. Lett. 2006, 60, 693–697. [Google Scholar]
  31. Ross, J.R.H. The Kinetics and Mechanisms of Catalytic Reactions. In Heterogeneous Catalysis; Elsevier: Amsterdam, The Netherlands, 2012. [Google Scholar]
  32. Vannice, M.A. Kinetics of Catalytic Reactions; Springer: New York, NY, USA, 2005. [Google Scholar]
  33. Zakaria, W.F.W.; Jalil, A.A.; Hassan, N.S.; Ibrahim, M.; Azami, M.S. Visible-light driven photodegradation of phenol over niobium oxide-loaded fibrous silica titania composite catalyst. J. Chem. Technol. Biotechnol. 2020, 95, 2638–2647. [Google Scholar]
  34. Tetteh, E.K.; Ezugbe, E.O.; Rathilal, S.; Asante-Sackey, D. Removal of COD and SO42-from oil refinery wastewater using a photo-catalytic system-comparing TiO2 and zeolite efficiencies. Water 2020, 12, 214. [Google Scholar]
  35. Khaki, M.R.D.; Shafeeyan, M.S.; Raman, A.A.A.; Daud, W.M.A.W. Application of doped photocatalysts for organic pollutant degradation—A review. J. Environ. Manag. 2017, 198, 78–94. [Google Scholar]
  36. Dariani, R.S.; Esmaeili, A.; Mortezaali, A.; Dehghanpour, S. Photocatalytic reaction and degradation of methylene blue on TiO2 nano-sized particles. Optik 2016, 127, 7143–7154. [Google Scholar]
  37. Zhao, J.; Chen, C.; Ma, W. Photocatalytic Degradation of Organic Pollutants Under Visible Light Irradiation. Top. Catal. 2005, 35, 269–278. [Google Scholar]
Figure 1. Schematic representation of the photocatalytic process via response surface methodology.
Molecules 26 01068 g001
Figure 2. Spectra of (a) XRD and (b) FTIR analysis for TiO2 (black) and AC-TiO2 (red); (c) SEM and (d) EDX image of AC-TiO2 and (e) EDX spectra and elemental composition of AC-TiO2.
Molecules 26 01068 g002aMolecules 26 01068 g002b
Figure 3. Comparative effect of TiO2 (black) and AC-TiO2 (red) on (a) decomposition of COD and (b) First-order kinetic model.
Molecules 26 01068 g003
Figure 4. Response representation of individual factors effects on color (ac) and turbidity (df) removal.
Molecules 26 01068 g004
Figure 5. Interactive effect of catalyst load and pH on (a) color and (b) turbidity removal.
Molecules 26 01068 g005
Figure 6. Response surface 3D plot of catalyst load and pH effects on (a) color and (b) turbidity removal.
Molecules 26 01068 g006
Figure 7. Ramp plot of numerical optimized conditions with the desirability of 95%.
Molecules 26 01068 g007
Table 1. Box-Behnken design matrix for input variables.
FactorLow Level (−1)Medium (0)High (+1)Ref
A: Catalyst load (g)234[24]
B: Reaction time (min)153045[26]
C: pH67.59[28]
Table 2. Results of Box-Behnken design with experimental and predicted values.
Factor 1Factor 2Factor 3Y1: Colour (%)Y2: Turbidity (%)
RunA: Catalyst Load (g)B: Reaction Time (min)C:pHExpPredExpPred
12157.58586.328686.16
23307.586.8887.0090.0490.04
3430990.8791.599292.51
4230977.3177.008079.54
5345988.9890.2288.0888.74
63307.586.8887.0090.0490.04
7230690.389.289291.96
83307.586.8887.0090.0490.04
9430690.1390.138888.93
104157.598.6198.9089.3188.50
112457.591.9291.508585.35
123307.586.8887.0090.0490.04
1334569595.6394.0293.16
144457.595.894.3593.5792.95
153307.586.8887.0090.0490.04
16315695.0995.3190.991.34
17315991.7389.9087.1886.92
Table 3. Analysis of variance (ANOVA) results for the response quadratic models.
ParameterColourTurbidity
Standard deviation1.060.63
Mean89.7189.19
Coefficient of variance (CV, %)1.180.71
Coefficient of determination (R2)0.9720.988
Adjusted R20.9660.975
Predicted R20.8860.893
Adequate precision32.3333.67
Table 4. Analysis of variance (ANOVA) results for color quadratic models.
SourceSum of SquaresDegree of FreedomMean SquareF-Valuep-Value
Model389.44664.9158.28<0.0001significant
A-Catalyst load119.201119.20107.02<0.0001
B-Reaction time0.201610.20160.18100.0495
C-pH58.48158.4852.51<0.0001
AB23.67123.6721.250.0010
AC47.13147.1342.31<0.0001
B2140.771140.77126.39<0.0001
Residual11.14101.11
Lack of Fit11.1461.8612.320.132Non-significant
Pure Error0.000040.0000
Cor Total400.5816
Table 5. Analysis of variance (ANOVA) results for the turbidity quadratic models.
SourceSum of SquaresDegree of FreedomMean SquareF-Valuep-Value
Model179.76629.9675.42<0.0001significant
A-Catalyst load49.40149.40124.36<0.0001
B-Reaction time6.6216.6216.680.0022
C-pH38.98138.9898.14<0.0001
AB6.9216.9217.410.0019
AC64.00164.00161.11<0.0001
A213.83113.8334.820.0002
Residual3.97100.3972
Lack of Fit3.9760.662110. 520.154Non-significant
Pure Error0.000040.0000
Cor Total183.7316
Publisher’s Note: MDPI stays neutral with regard to jurisdictional claims in published maps and institutional affiliations.

