
Batch Studies of Phosphonate and Phosphate Adsorption on Granular Ferric Hydroxide (GFH) with Membrane Concentrate and Its Synthetic Replicas

 ,
,  ,
,
Abstract
1. Introduction
2. Materials and Methods
2.1. Reagents and Chemicals
2.2. Adsorbent
2.3. Membrane Concentrate and Its Synthetic Replicas
2.4. Experimental Procedure
2.5. Analytical Methods
3. Results and Discussion
3.1. Experiment 1—Adsorption Behavior of Six Phosphonates in the Presence of and Absence of CaII
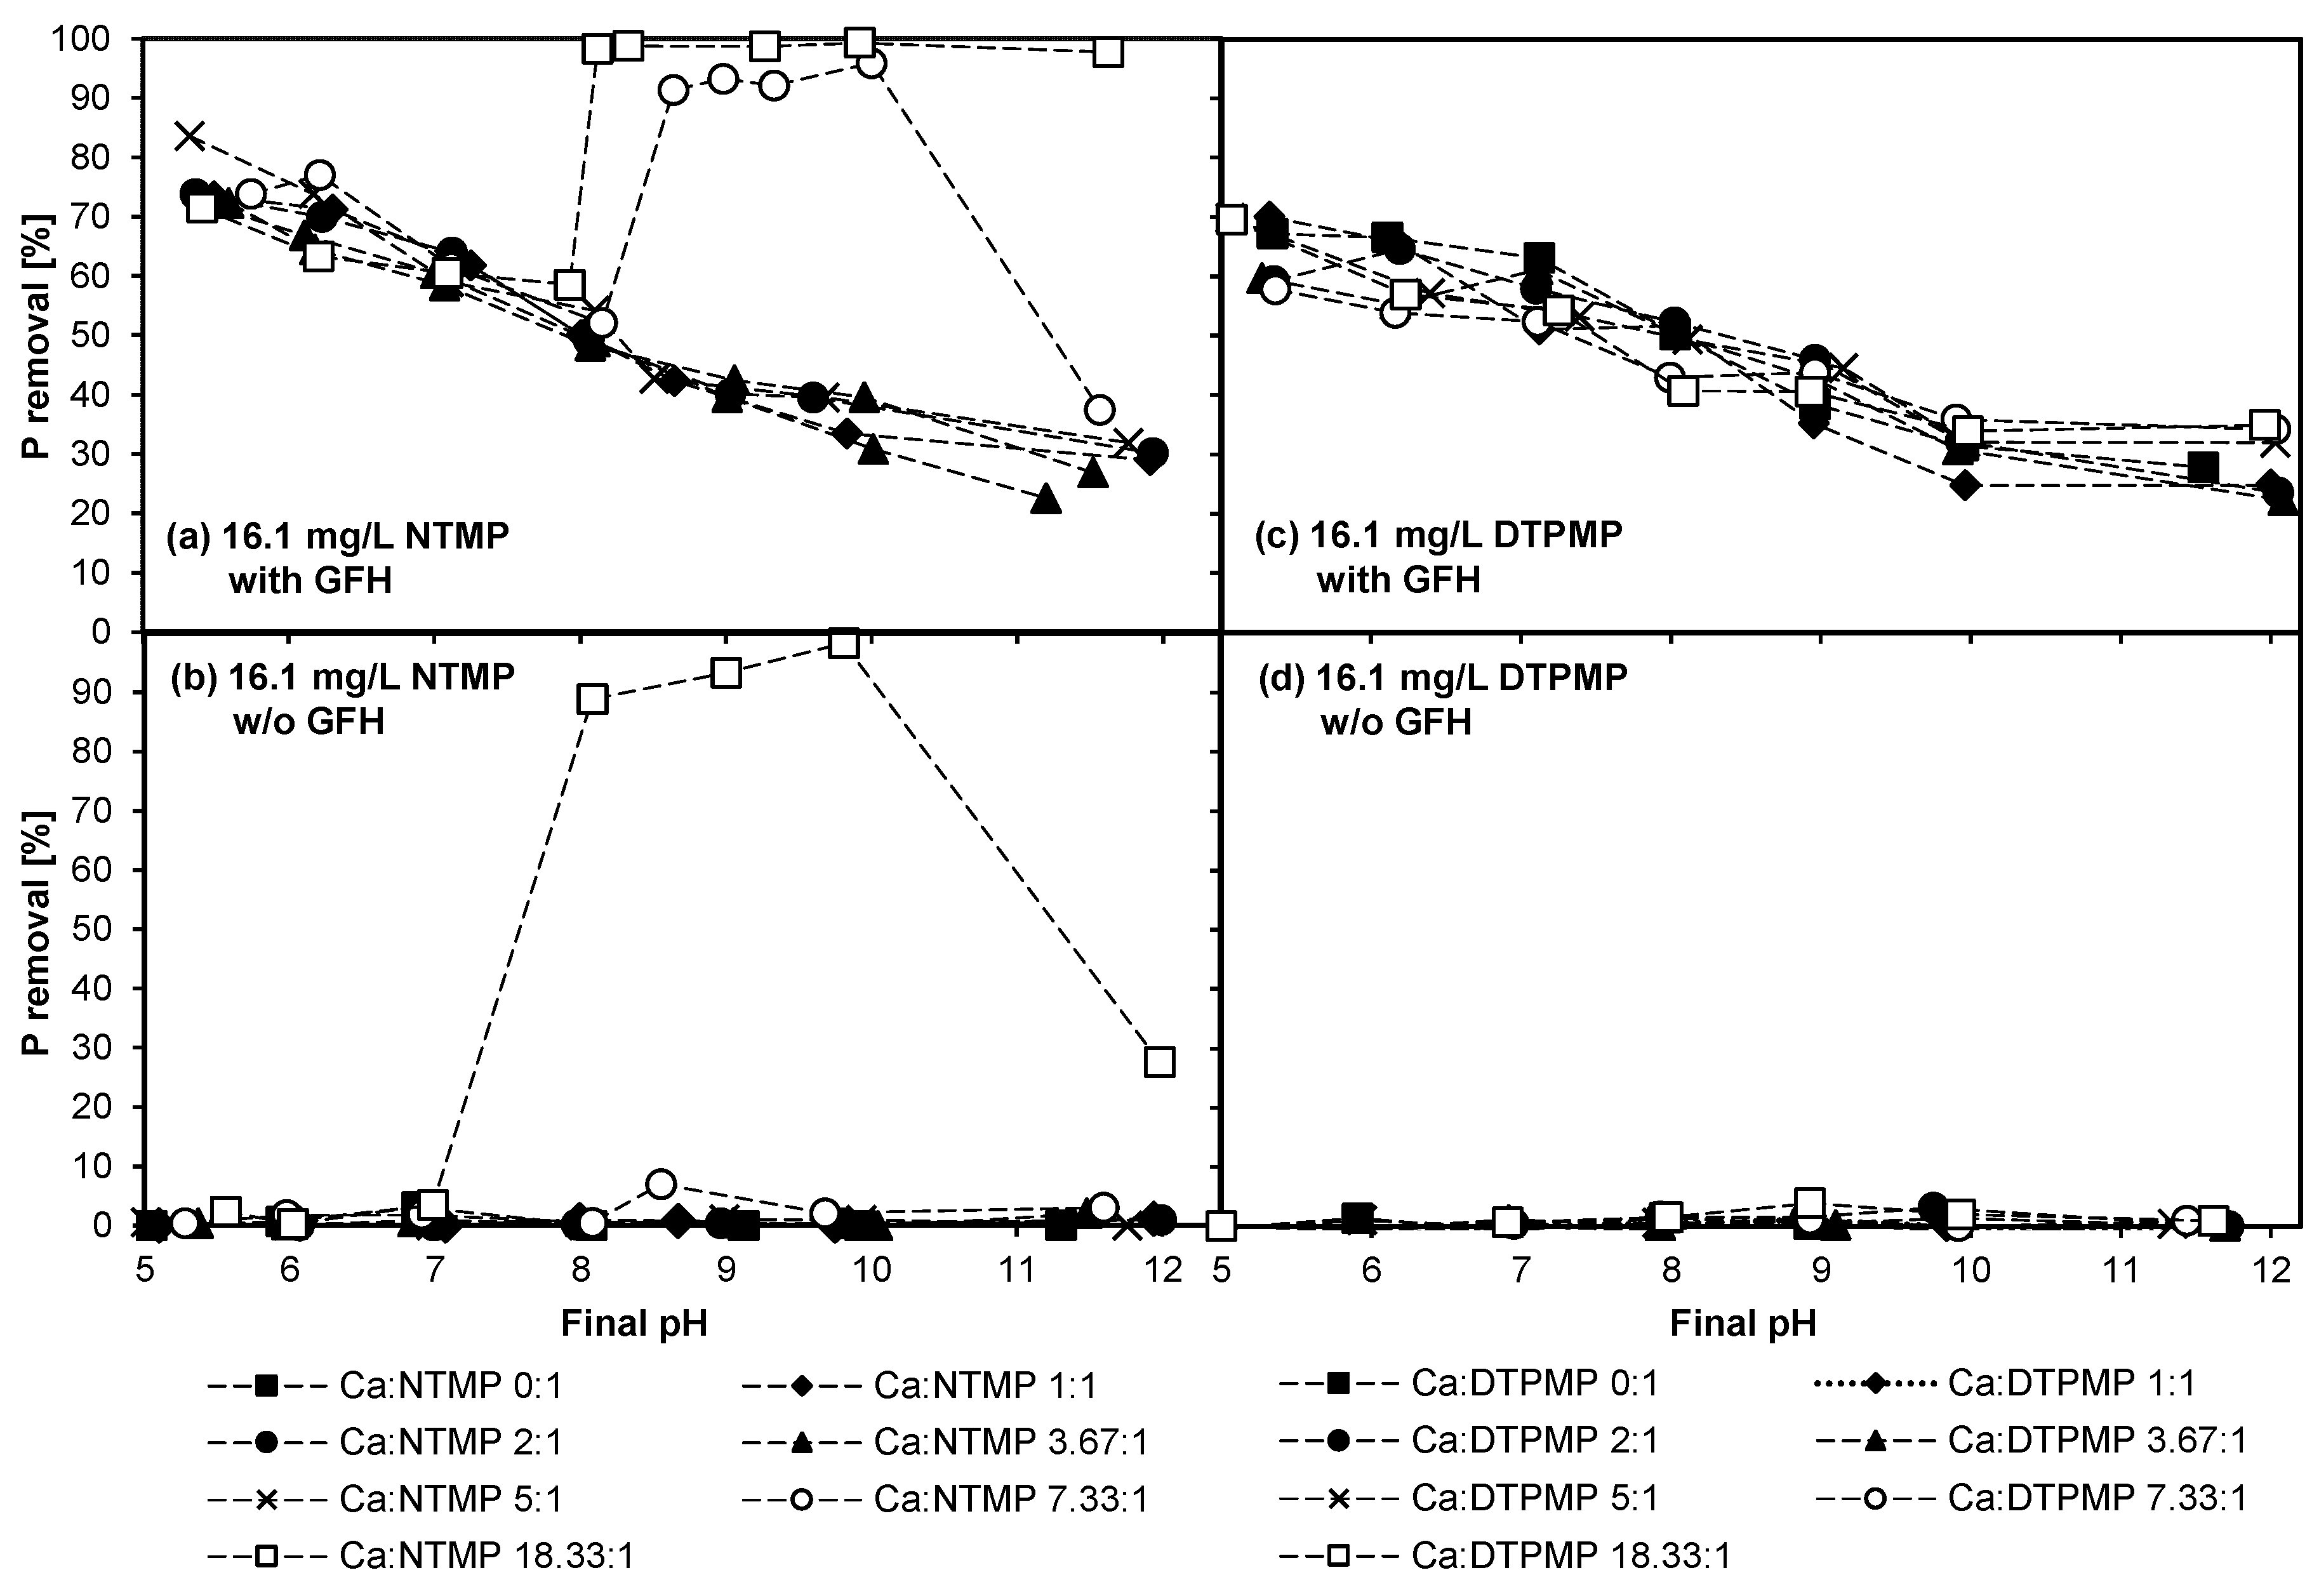
3.2. Experiment 2—Adsorption Behavior of NTMP and DTPMP in the Presence of CaII in Higher Concentrations
3.3. Experiment 3—Investigations on NTMP and DTPMP Precipitation
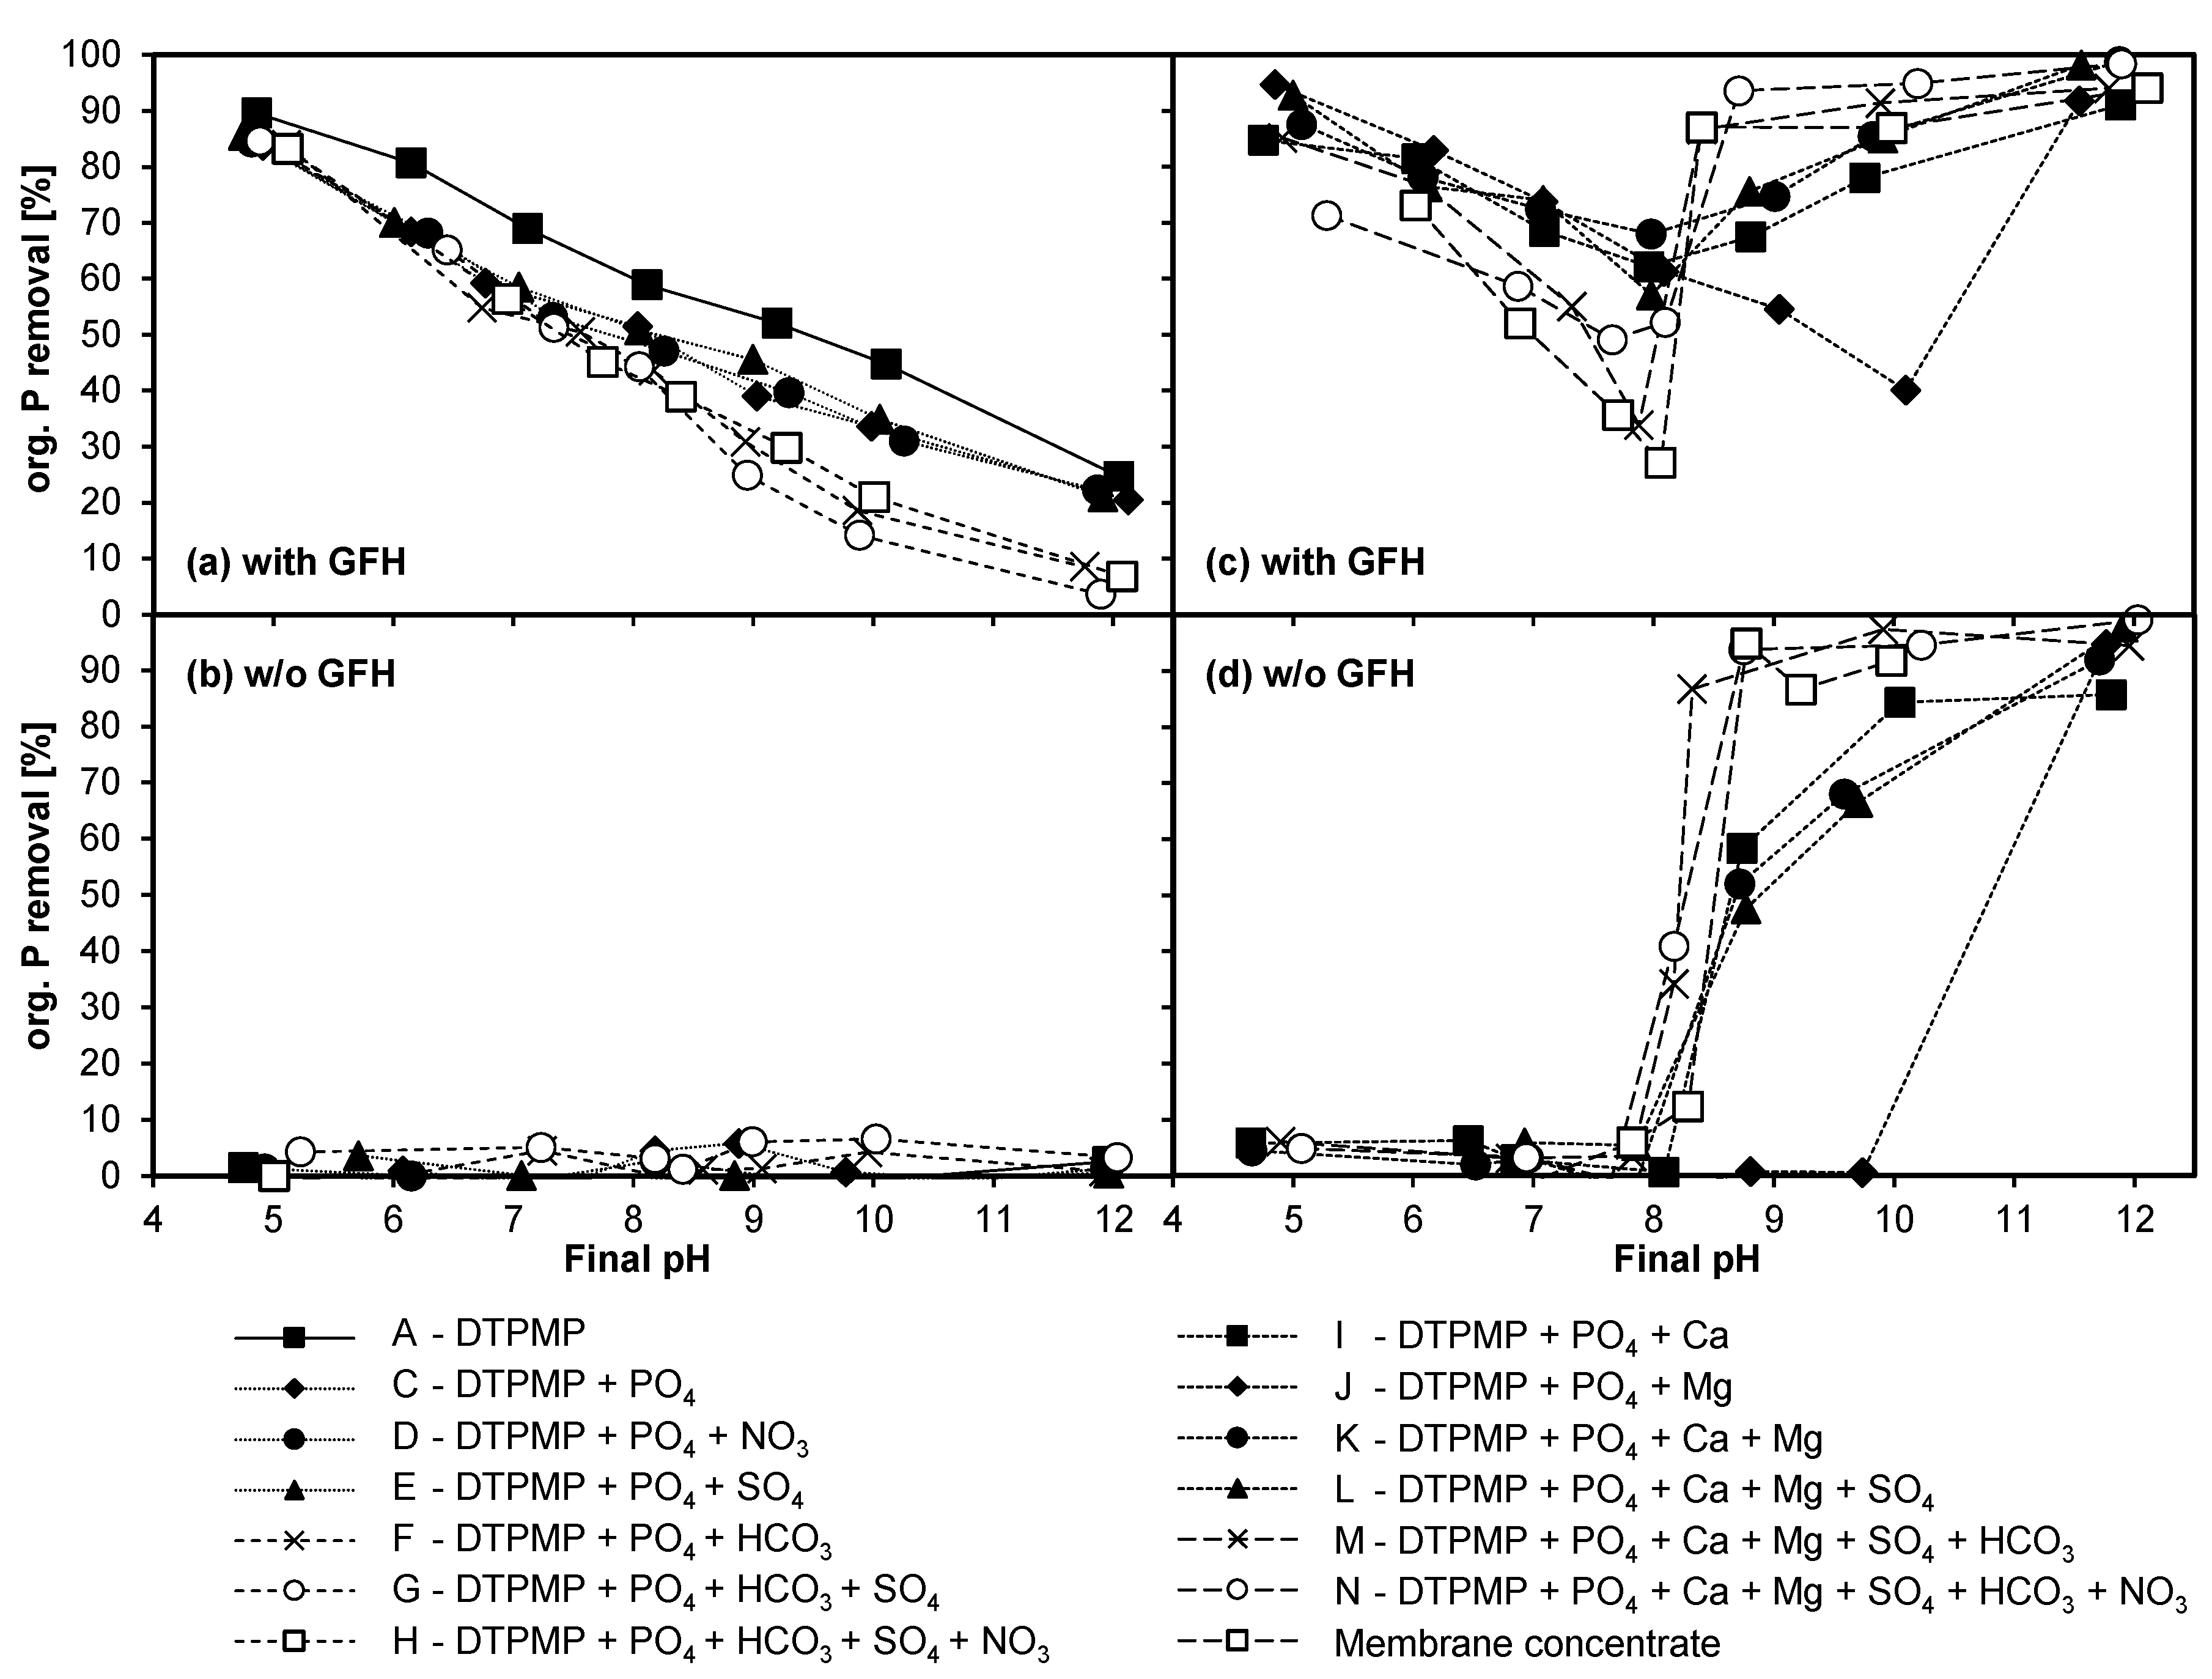
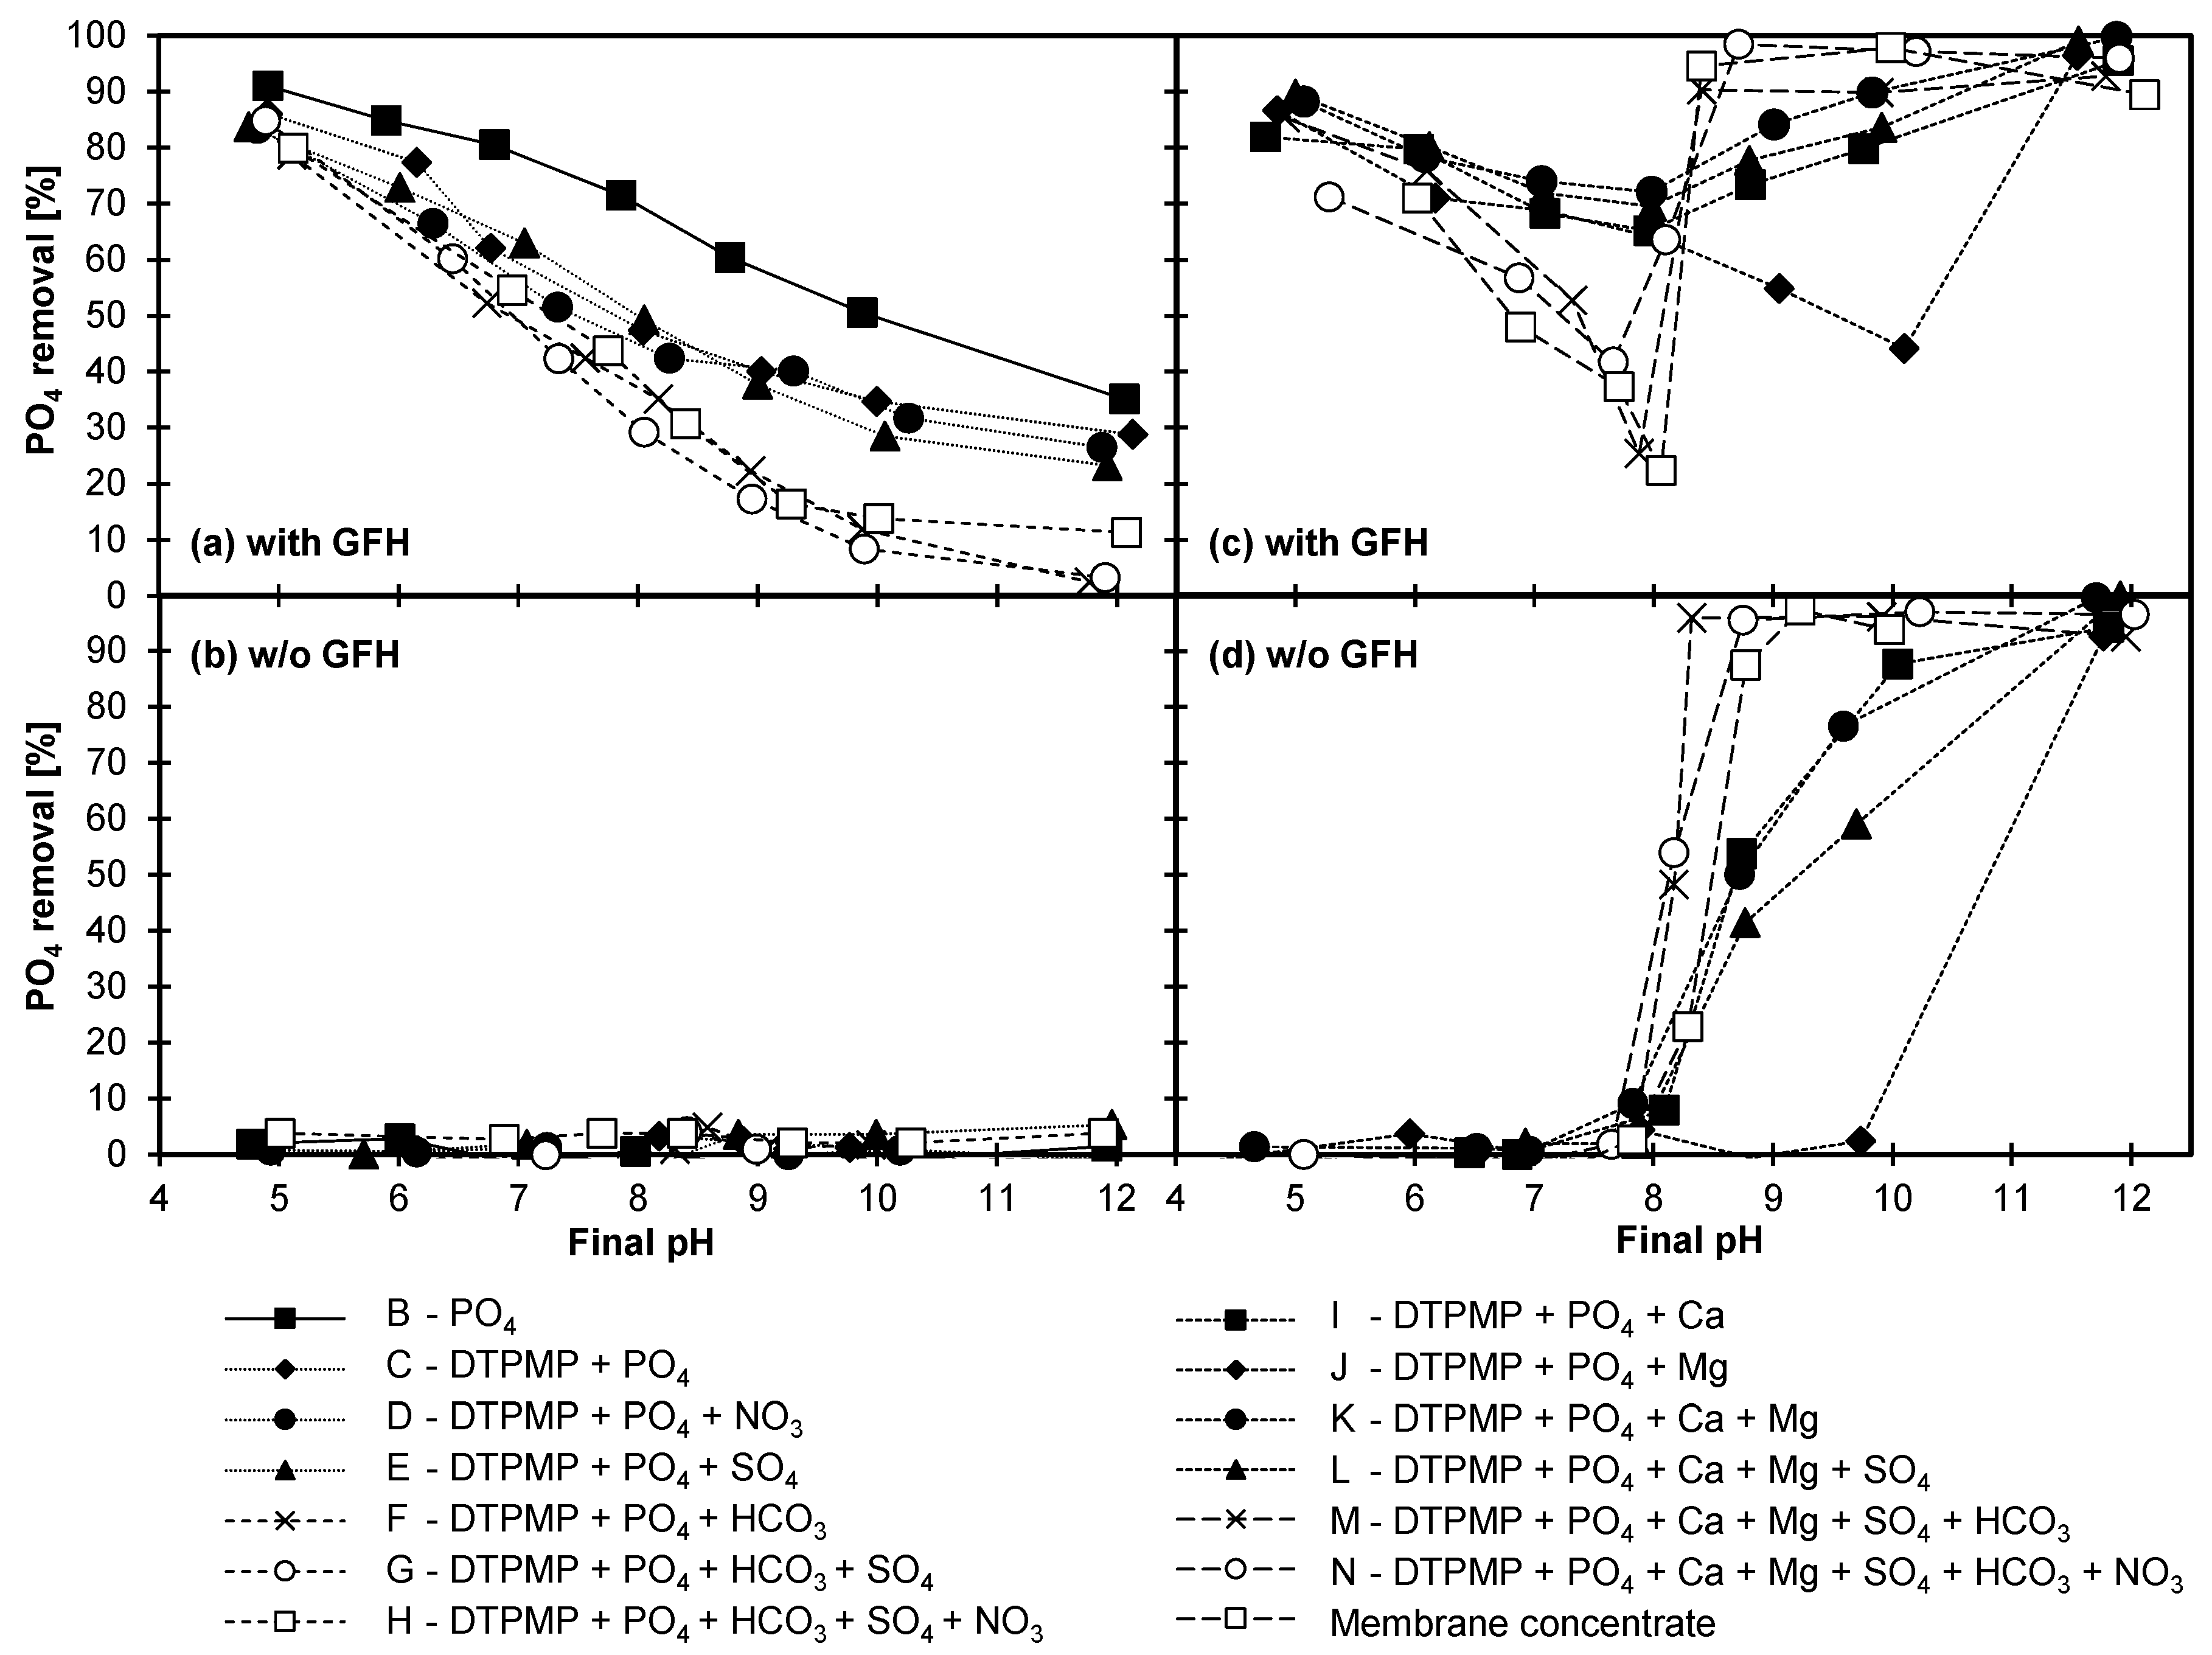
3.4. Experiment 4—Adsorption Behavior of Membrane Concentrate and Its Synthetic Replicas
3.4.1. Adsorption of DTPMP and Orthophosphate
3.4.2. Influence of Anions
3.4.3. Influence of Cations
3.4.4. Combined Influence of Anions and Cations
4. Conclusions
Supplementary Materials
Author Contributions
Funding
Acknowledgments
Conflicts of Interest
References
- European Phosphonate Association (EPA). Phosphonates in Detergents: EPA Detergent Phosphonates Dossier; EPA: Brussels, Belgium, 2013. [Google Scholar]
- Davenport, B.; DeBoo, A.; Dubois, F.; Kishi, A. CEH Report: Chelating Agents; SRI Consulting: Menlo Park, CA, USA, 2000. [Google Scholar]
- Nowack, B.; Stone, A.T. Adsorption of Phosphonates onto the Goethite-Water Interface. J. Colloid Interface Sci. 1999, 214, 20–30. [Google Scholar] [CrossRef] [PubMed]
- Boels, L.; Keesman, K.J.; Witkamp, G.-J. Adsorption of phosphonate antiscalant from reverse osmosis membrane concentrate onto granular ferric hydroxide. Environ. Sci. Technol. 2012, 46, 9638–9645. [Google Scholar] [CrossRef] [PubMed]
- Armbruster, D.; Müller, U.; Happel, O. Characterization of phosphonate-based antiscalants used in drinking water treatment plants by anion-exchange chromatography coupled to electrospray ionization time-of-flight mass spectrometry and inductively coupled plasma mass spectrometry. J. Chromatogr. A 2019, 1601, 189–204. [Google Scholar] [CrossRef] [PubMed]
- Squire, D. Reverse osmosis concentrate disposal in the UK. Desalination 2000, 132, 47–54. [Google Scholar] [CrossRef]
- Nederlof, M.M.; Hoogendoorn, J.H. Desalination of brackish groundwater: The concentrate dilemma. Desalination 2005, 182, 441–447. [Google Scholar] [CrossRef]
- Greenlee, L.F.; Lawler, D.F.; Freeman, B.D.; Marrot, B.; Moulin, P. Reverse osmosis desalination: Water sources, technology, and today’s challenges. Water Res. 2009, 43, 2317–2348. [Google Scholar] [CrossRef]
- Rott, E.; Happel, O.; Armbruster, D.; Minke, R. Influence of Wastewater Discharge on the Occurrence of PBTC, HEDP, and Aminophosphonates in Sediment, Suspended Matter, and the Aqueous Phase of Rivers. Water 2020, 12, 803. [Google Scholar] [CrossRef]
- Kuhn, R.; Jensch, R.; Bryant, I.M.; Fischer, T.; Liebsch, S.; Martienssen, M. The influence of selected bivalent metal ions on the photolysis of diethylenetriamine penta (methylenephosphonic acid). Chemosphere 2018, 210, 726–733. [Google Scholar] [CrossRef]
- Lesueur, C.; Pfeffer, M.; Fuerhacker, M. Photodegradation of phosphonates in water. Chemosphere 2005, 59, 685–691. [Google Scholar] [CrossRef]
- Nowack, B. Environmental chemistry of phosphonates. Water Res. 2003, 37, 2533–2546. [Google Scholar] [CrossRef]
- Tang, Y.; Yang, W.; Yin, X.; Liu, Y.; Yin, P.; Wang, J. Investigation of CaCO3 scale inhibition by PAA, ATMP and PAPEMP. Desalination 2008, 228, 55–60. [Google Scholar] [CrossRef]
- Jonasson, R.G.; Rispler, K.; Wiwchar, B.; Gunter, W.D. Effect of phosphonate inhibitors on calcite nucleation kinetics as a function of temperature using light scattering in an autoclave. Chem. Geol. 1996, 132, 215–225. [Google Scholar] [CrossRef]
- Yang, Q.; Liu, Y.; Gu, A.; Ding, J.; Shen, Z. Investigation of Calcium Carbonate Scaling Inhibition and Scale Morphology by AFM. J. Colloid Interface Sci. 2001, 240, 608–621. [Google Scholar] [CrossRef]
- Kan, A.T.; Fu, G.; Tomson, M.B. Adsorption and precipitation of an aminoalkylphosphonate onto calcite. J. Colloid Interface Sci. 2005, 281, 275–284. [Google Scholar] [CrossRef]
- Chen, Y.; Baygents, J.C.; Farrell, J. Removing phosphonate antiscalants from membrane concentrate solutions using granular ferric hydroxide. J. Water Process Eng. 2017, 19, 18–25. [Google Scholar] [CrossRef]
- Reinhardt, T.; Elordi, M.G.; Minke, R.; Schönberger, H.; Rott, E. Batch studies of phosphonate adsorption on granular ferric hydroxides. Water Sci. Technol. 2020, 81, 10–20. [Google Scholar] [CrossRef] [PubMed]
- Martínez, R.J.; Farrell, J. Understanding Nitrilotris (methylenephosphonic acid) reactions with ferric hydroxide. Chemosphere 2017, 175, 490–496. [Google Scholar] [CrossRef]
- Stone, A.T.; Knight, M.A.; Nowack, B. Speciation and Chemical Reactions of Phosphonate Chelating Agents in Aqueous Media. In Chemicals in the Environment: Fate, Impacts, and Remediation, American Chemical Society; Lipnick, R.L., Ed.; Oxford University Press: Washington, DC, USA, 2002; pp. 59–94. [Google Scholar] [CrossRef]
- Nowack, B.; Stone, A.T. The Influence of Metal Ions on the Adsorption of Phosphonates onto Goethite. Environ. Sci. Technol. 1999, 33, 3627–3633. [Google Scholar] [CrossRef]
- Rott, E.; Reinhardt, T.; Wasielewski, S.; Raith-Bausch, E.; Minke, R. Optimized Procedure for Determining the Adsorption of Phosphonates onto Granular Ferric Hydroxide using a Miniaturized Phosphorus Determination Method. J. Vis. Exp. 2018, 135. [Google Scholar] [CrossRef]
- Worch, E. Adsorption Technology in Water Treatment: Fundamentals, Processes, and Modeling; De Gruyter: Berlin, Germany, 2012. [Google Scholar]
- Rott, E.; Happel, O.; Armbruster, D.; Minke, R. Behavior of PBTC, HEDP, and Aminophosphonates in the Process of Wastewater Treatment. Water 2020, 12, 53. [Google Scholar] [CrossRef]
- ISO 6878. DIN EN ISO 6878:2004-09: Water Quality-Determination of Phosphorus-Ammonium Molybdate Spectrometric Method; Beuth Verlag GmbH: Berlin, Germany, 2004. [Google Scholar] [CrossRef]
- DIN 38406-3. German Standard Methods for the Examination of Water, Waste Water and Sludge‑Cations (Group E)—Part 3: Determination of Calcium and Magnesium, Complexometric Method (E 3); Beuth Verlag GmbH: Berlin, Germany, 2003. [Google Scholar] [CrossRef]
- Rott, E.; Nouri, M.; Meyer, C.; Minke, R.; Schneider, M.; Mandel, K.; Drenkova-Tuhtan, A. Removal of phosphonates from synthetic and industrial wastewater with reusable magnetic adsorbent particles. Water Res. 2018, 145, 608–617. [Google Scholar] [CrossRef]
- Garcia, C.; Courbin, G.; Ropital, F.; Fiaud, C. Study of the scale inhibition by HEDP in a channel flow cell using a quartz crystal microbalance. Electrochim. Acta 2001, 46, 973–985. [Google Scholar] [CrossRef]
- Browning, F.H.; Fogler, H.S. Effect of Precipitating Conditions on the Formation of Calcium‑HEDP Precipitates. Langmuir 1996, 12, 5231–5238. [Google Scholar] [CrossRef]
- Pairat, R.; Sumeath, C.; Browning, F.H.; Fogler, H.S. Precipitation and Dissolution of Calcium‑ATMP Precipitates for the Inhibition of Scale Formation in Porous Media. Langmuir 1997, 13, 1791–1798. [Google Scholar] [CrossRef]
- Kan, A.T.; Oddo, J.E.; Tomson, M.B. Formation of Two Calcium Diethylenetriaminepentakis (methylene phosphonic acid) Precipitates and Their Physical Chemical Properties. Langmuir 1994, 10, 1450–1455. [Google Scholar] [CrossRef]
- Zhang, B.; Zhang, L.; Li, F.; Hu, W.; Hannam, P.M. Testing the formation of Ca‑phosphonate precipitates and evaluating the anionic polymers as Ca–phosphonate precipitates and CaCO3 scale inhibitor in simulated cooling water. Corros. Sci. 2010, 52, 3883–3890. [Google Scholar] [CrossRef]
- Amjad, Z.; Zuhl, R.W.; Zibrida, J.F. Factors Influencing the Precipitation of Calcium-Inhibitor Salts in Industrial Water Systems. In Proceedings of the Annual Convention, Association of Water Technologies, Phoenix, AZ, USA, 17 September 2003. [Google Scholar]
- Popov, K.; Rönkkömäki, H.; Lajunen, L.H.J. Critical evaluation of stability constants of phosphonic acids (IUPAC Technical Report). Pure Appl. Chem. 2002, 74. [Google Scholar] [CrossRef]
- Nowack, B.; Stone, A.T. Competitive adsorption of phosphate and phosphonates onto goethite. Water Res. 2006, 40, 2201–2209. [Google Scholar] [CrossRef] [PubMed]
- Gledhill, W.E.; Feijtel, T.C.J. Environmental Properties and Safety Assessment of Organic Phosphonates Used for Detergent and Water Treatment Applications. In Detergents; de Oude, N.T., Ed.; Springer: Berlin/Heidelberg, Germany, 1992; pp. 261–285. [Google Scholar] [CrossRef]
- Yan, F.; Zhang, F.; Bhandari, N.; Wang, L.; Dai, Z.; Zhang, Z.; Liu, Y.; Ruan, G.; Kan, A.; Tomson, M. Adsorption and precipitation of scale inhibitors on shale formations. J. Pet. Sci. Eng. 2015, 136, 32–40. [Google Scholar] [CrossRef]
- Rahimi, T.; Vaezi, N.; Khazaei, M.; Vakili, B.; Izanloo, H. Application of Granular Ferric Hydroxide in Removal of Nitrate from Aqueous Solutions. J. Saf. Environ. Health Res. 2016, 1, 31–35. [Google Scholar] [CrossRef]
- Zelmanov, G.; Semiat, R. The influence of competitive inorganic ions on phosphate removal from water by adsorption on iron (Fe+3) oxide/hydroxide nanoparticles-based agglomerates. J. Water Process Eng. 2015, 5, 143–152. [Google Scholar] [CrossRef]
- Boels, L.; Tervahauta, T.; Witkamp, G.J. Adsorptive removal of nitrilotris(methylenephosphonic acid) antiscalant from membrane concentrates by iron-coated waste filtration sand. J. Hazard. Mater. 2010, 182, 855–862. [Google Scholar] [CrossRef]
- Geelhoed, J.S.; Hiemstra, T.; van Riemsdijk, W.H. Phosphate and sulfate adsorption on goethite: Single anion and competitive adsorption. Geochim. Cosmochim. Acta 1997, 61, 2389–2396. [Google Scholar] [CrossRef]
- Violante, A.; Pigna, M.; Ricciardella, M.; Gianfreda, L. Adsorption of phosphate on variable charge minerals and soils as affected by organic and inorganic ligands. In Soil Mineral-Organic Matter-Microorganism Interactions and Ecosystem Health, Dynamics, Mobility and Transformation of Pollutants and Nutrients; Elsevier: Amsterdam, The Netherlands, 2002; pp. 279–295. [Google Scholar] [CrossRef]
- Genz, A.; Kornmuller, A.; Jekel, M. Advanced phosphorus removal from membrane filtrates by adsorption on activated aluminium oxide and granulated ferric hydroxide. Water Res. 2004, 38, 3523–3530. [Google Scholar] [CrossRef]
- Su, C.; Suarez, D.L. In Situ Infrared Speciation of Adsorbed Carbonate on Aluminum and Iron Oxides. Clays Clay Miner. 1997, 45, 814–825. [Google Scholar] [CrossRef]
- Chitrakar, R.; Tezuka, S.; Sonoda, A.; Sakane, K.; Ooi, K.; Hirotsu, T. Phosphate adsorption on synthetic goethite and akaganeite. J. Colloid Interface Sci. 2006, 298, 602–608. [Google Scholar] [CrossRef]
- Mendez, J.C.; Hiemstra, T. Carbonate Adsorption to Ferrihydrite: Competitive Interaction with Phosphate for Use in Soil Systems. ACS Earth Space Chem. 2019, 3, 129–141. [Google Scholar] [CrossRef]
- Lin, J.; Zhao, Y.; Zhan, Y.; Wang, Y. Influence of coexisting calcium and magnesium ions on phosphate adsorption onto hydrous iron oxide. Environ. Sci. Pollut. Res. Int. 2020, 27, 11303–11319. [Google Scholar] [CrossRef]
- Bartels, T.; Schuthof, J.; Arends, J. The adsorption of two polyphosphonates on hydroxyapatite and their influence on the acid solubility of whole bovine enamel. J. Dent. 1979, 7, 221–229. [Google Scholar] [CrossRef]
- Lin, J.; He, S.; Wang, X.; Zhang, H.; Zhan, Y. Removal of phosphate from aqueous solution by a novel Mg(OH)2/ZrO2 composite: Adsorption behavior and mechanism. Colloids Surf. A Physicochem. Eng. Asp. 2019, 561, 301–314. [Google Scholar] [CrossRef]
- Chirby, D.; Franck, S.; Troutner, D.E. Adsorption of 153Sm-EDTMP on calcium hydroxyapatite. Int. J. Radiat. Appl. Instrum. Part A Appl. Radiat. Isot. 1988, 39, 495–499. [Google Scholar] [CrossRef]
- Xu, N.; Chen, M.; Zhou, K.; Wang, Y.; Yin, H.; Chen, Z. Retention of phosphorus on calcite and dolomite: Speciation and modeling. RSC Adv. 2014, 4, 35205. [Google Scholar] [CrossRef]
- Karaca, S.; Gürses, A.; Ejder, M.; Açikyildiz, M. Adsorptive removal of phosphate from aqueous solutions using raw and calcinated dolomite. J. Hazard. Mater. 2006, 128, 273–279. [Google Scholar] [CrossRef]
Sample Availability: Samples of the compounds are not available. |


| Solutions | ||||||||||||||||
|---|---|---|---|---|---|---|---|---|---|---|---|---|---|---|---|---|
| Compound | Unit | A | B | C | D | E | F | G | H | I | J | K | L | M | N | MC |
| DTPMP-P | mg/L | 0.74 | - | 0.74 | 0.74 | 0.74 | 0.74 | 0.74 | 0.74 | 0.74 | 0.74 | 0.74 | 0.74 | 0.74 | 0.74 | 0.74 |
| PO4-P | mg/L | - | 0.53 | 0.53 | 0.53 | 0.53 | 0.53 | 0.53 | 0.53 | 0.53 | 0.53 | 0.53 | 0.53 | 0.53 | 0.53 | 0.53 |
| NO3- | mg/L | - | - | - | 67.7 | - | - | - | 67.7 | - | - | - | - | - | 67.7 | 67.7 |
| SO42– | mg/L | - | - | - | - | 474 | - | 474 | 474 | - | - | - | 474 | 474 | 474 | 474 |
| HCO3– | mg/L | - | - | - | - | - | 1620 | 1620 | 1620 | - | - | - | - | 1620 | 1620 | 1620 |
| Ca2+ | mg/L | - | - | - | - | - | - | - | - | 613 | - | 613 | 613 | 613 | 613 | 613 |
| Mg2+ | mg/L | - | - | - | - | - | - | - | - | - | 75.0 | 75.0 | 75.0 | 75.0 | 75.0 | 75.0 |
| Phosphonate | Phosphonate-P | ||
|---|---|---|---|
| mg/L | µmol/L | mg/L | |
| HPAA | 16.1 | 103 | 3.19 |
| PBTC | 16.1 | 59.6 | 1.85 |
| HEDP | 16.1 | 78.1 | 4.84 |
| NTMP | 16.1 | 53.8 | 5.00 |
| EDTMP | 16.1 | 36.9 | 4.57 |
| DTPMP | 16.1 | 28.1 | 4.35 |
| Phosphonate | Phosphonate-P | ||
|---|---|---|---|
| mg/L | µmol/L | mg/L | |
| NTMP | 3.22 | 10.8 | 1.0 |
| 16.1 | 53.8 | 5.0 | |
| 32.2 | 108 | 10 | |
| 80.5 | 269 | 25 | |
| DTPMP | 3.22 | 5.61 | 0.9 |
| 16.1 | 28.1 | 4.4 | |
| 32.2 | 56.1 | 8.7 | |
| 80.5 | 140 | 22 | |
| NTMP [mg/L] | ||||||||||||
|---|---|---|---|---|---|---|---|---|---|---|---|---|
| 3.22 | 16.1 | 32.2 | 80.5 | 3.22 | 16.1 | 32.2 | 80.5 | 3.22 | 16.1 | 32.2 | 80.5 | |
| Calcium [mmol/L] | Removal at pH 8 [%] | Removal at pH 9 [%] | ||||||||||
| Ca:NTMP 0:1 | 0.00 | 0.00 | 0.00 | 0.00 | 1 | 0 | 1 | 0 | 3 | 0 | 1 | 2 |
| Ca:NTMP 1:1 | 0.01 | 0.05 | 0.11 | 0.27 | 3 | 0 | 2 | 1 | −1 | 0 | 1 | 2 |
| Ca:NTMP 2:1 | 0.02 | 0.11 | 0.22 | 0.54 | 1 | 0 | 1 | 1 | 0 | 1 | 2 | 91 |
| Ca:NTMP 5:1 | 0.05 | 0.27 | 0.54 | 1.35 | 2 | 1 | 2 | 99 | 4 | 2 | 78 | 99 |
| Ca:NTMP 10:1 | 0.11 | 0.54 | 1.08 | 2.69 | 1 | 3 | 95 | 99 | 4 | 64 | 100 | 100 |
| Ca:NTMP 25:1 | 0.27 | 1.35 | 2.69 | 6.73 | 1 | 94 | 99 | 100 | 3 | 97 | 100 | 100 |
| Ca:NTMP 60:1 | 0.65 | 3.23 | 6.46 | 16.1 | 0 | 97 | 99 | 100 | 2 | 99 | 100 | 100 |
| DTPMP [mg/L] | ||||||||||||
|---|---|---|---|---|---|---|---|---|---|---|---|---|
| 3.22 | 16.1 | 32.2 | 80.5 | 3.22 | 16.1 | 32.2 | 80.5 | 3.22 | 16.1 | 32.2 | 80.5 | |
| Calcium [mmol/L] | Removal at pH 8 [%] | Removal at pH 9 [%] | ||||||||||
| Ca:DTPMP 0:1 | 0.00 | 0.00 | 0.00 | 0.00 | −2 | −1 | −1 | −1 | −2 | 0 | 2 | −1 |
| Ca:DTPMP 1:1 | 0.01 | 0.03 | 0.06 | 0.14 | −1 | 1 | −4 | −1 | 2 | 0 | 4 | 0 |
| Ca:DTPMP 2:1 | 0.01 | 0.06 | 0.11 | 0.28 | 0 | −1 | −4 | −1 | −1 | 0 | −2 | 0 |
| Ca:DTPMP 5:1 | 0.03 | 0.14 | 0.28 | 0.70 | 0 | 1 | 0 | 0 | −1 | 0 | −1 | 62 |
| Ca:DTPMP 10:1 | 0.06 | 0.28 | 0.56 | 1.40 | 0 | 0 | 0 | 74 | −4 | 0 | 47 | 91 |
| Ca:DTPMP 25:1 | 0.14 | 0.70 | 1.40 | 3.51 | −1 | −1 | 56 | 90 | −1 | 0 | 88 | 94 |
| Ca:DTPMP 60:1 | 0.34 | 1.68 | 3.37 | 8.42 | 0 | 54 | 84 | 93 | −6 | 85 | 92 | 96 |
| pHstart | pHend | Catarget [mmol/L] | Castart [mmol/L] | Caend [mmol/L] | Deviation [%] |
|---|---|---|---|---|---|
| 8.01 | 8.04 | 3.51 | 3.44 | 3.42 | 0.6 |
| 7.99 | 8.00 | 6.46 | 6.35 | 6.40 | −0.8 |
| 8.01 | 8.04 | 6.73 | 6.80 | 7.00 | −2.9 |
| 8.00 | 8.03 | 8.42 | 8.40 | 8.20 | 2.4 |
| 8.00 | 8.03 | 16.10 | 15.90 | 16.00 | −0.6 |
| 9.01 | 9.01 | 3.51 | 3.60 | 3.64 | −1.0 |
| 8.98 | 8.99 | 6.46 | 6.30 | 6.10 | 3.2 |
| 9.01 | 9.02 | 6.73 | 6.50 | 6.40 | 1.5 |
| 8.97 | 8.96 | 8.42 | 8.45 | 8.50 | −0.6 |
| 8.99 | 8.97 | 16.10 | 15.60 | 15.35 | 1.6 |
Publisher’s Note: MDPI stays neutral with regard to jurisdictional claims in published maps and institutional affiliations. |
© 2020 by the authors. Licensee MDPI, Basel, Switzerland. This article is an open access article distributed under the terms and conditions of the Creative Commons Attribution (CC BY) license (http://creativecommons.org/licenses/by/4.0/).
Share and Cite
Reinhardt, T.; Veizaga Campero, A.N.; Minke, R.; Schönberger, H.; Rott, E. Batch Studies of Phosphonate and Phosphate Adsorption on Granular Ferric Hydroxide (GFH) with Membrane Concentrate and Its Synthetic Replicas. Molecules 2020, 25, 5202. https://doi.org/10.3390/molecules25215202
Reinhardt T, Veizaga Campero AN, Minke R, Schönberger H, Rott E. Batch Studies of Phosphonate and Phosphate Adsorption on Granular Ferric Hydroxide (GFH) with Membrane Concentrate and Its Synthetic Replicas. Molecules. 2020; 25(21):5202. https://doi.org/10.3390/molecules25215202
Chicago/Turabian StyleReinhardt, Tobias, Adriana Noelia Veizaga Campero, Ralf Minke, Harald Schönberger, and Eduard Rott. 2020. "Batch Studies of Phosphonate and Phosphate Adsorption on Granular Ferric Hydroxide (GFH) with Membrane Concentrate and Its Synthetic Replicas" Molecules 25, no. 21: 5202. https://doi.org/10.3390/molecules25215202
APA StyleReinhardt, T., Veizaga Campero, A. N., Minke, R., Schönberger, H., & Rott, E. (2020). Batch Studies of Phosphonate and Phosphate Adsorption on Granular Ferric Hydroxide (GFH) with Membrane Concentrate and Its Synthetic Replicas. Molecules, 25(21), 5202. https://doi.org/10.3390/molecules25215202