
Synthesis of New Naphthyl Aceto Hydrazone-Based Metal Complexes: Micellar Interactions, DNA Binding, Antimicrobial, and Cancer Inhibition Studies

 ,
,  , , , , ,
  ,
, 
Abstract
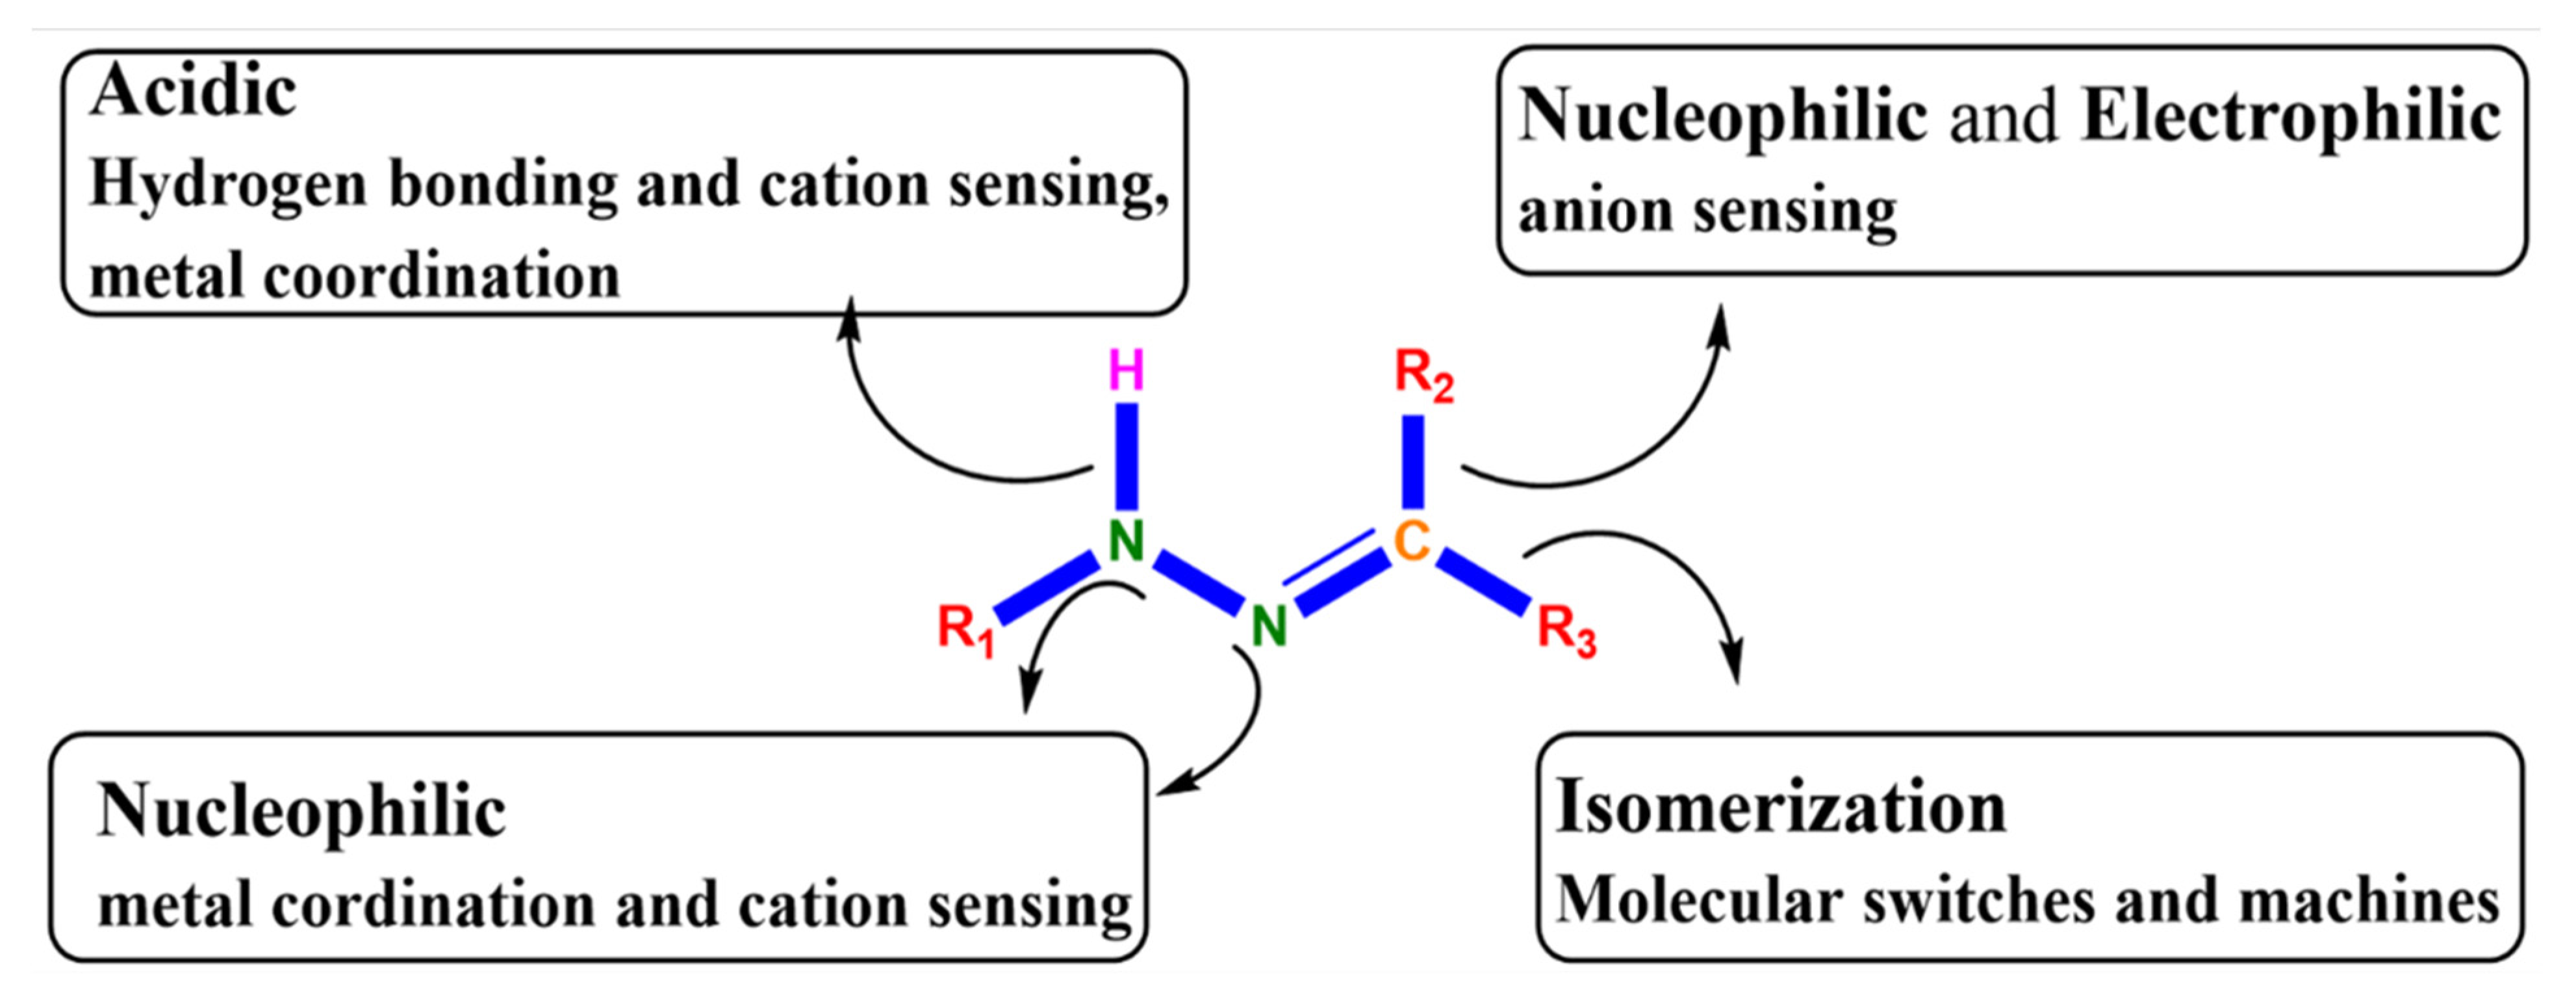
1. Introduction
2. Results and Discussion
2.1. FT-IR Spectroscopy
2.2. Multi-Nuclear (1H, 13C) NMR and MALDI Analysis
2.3. UV-Vis Studies of Ligand and Metal Complexes
2.4. Micellar Interaction of Metal Complexes
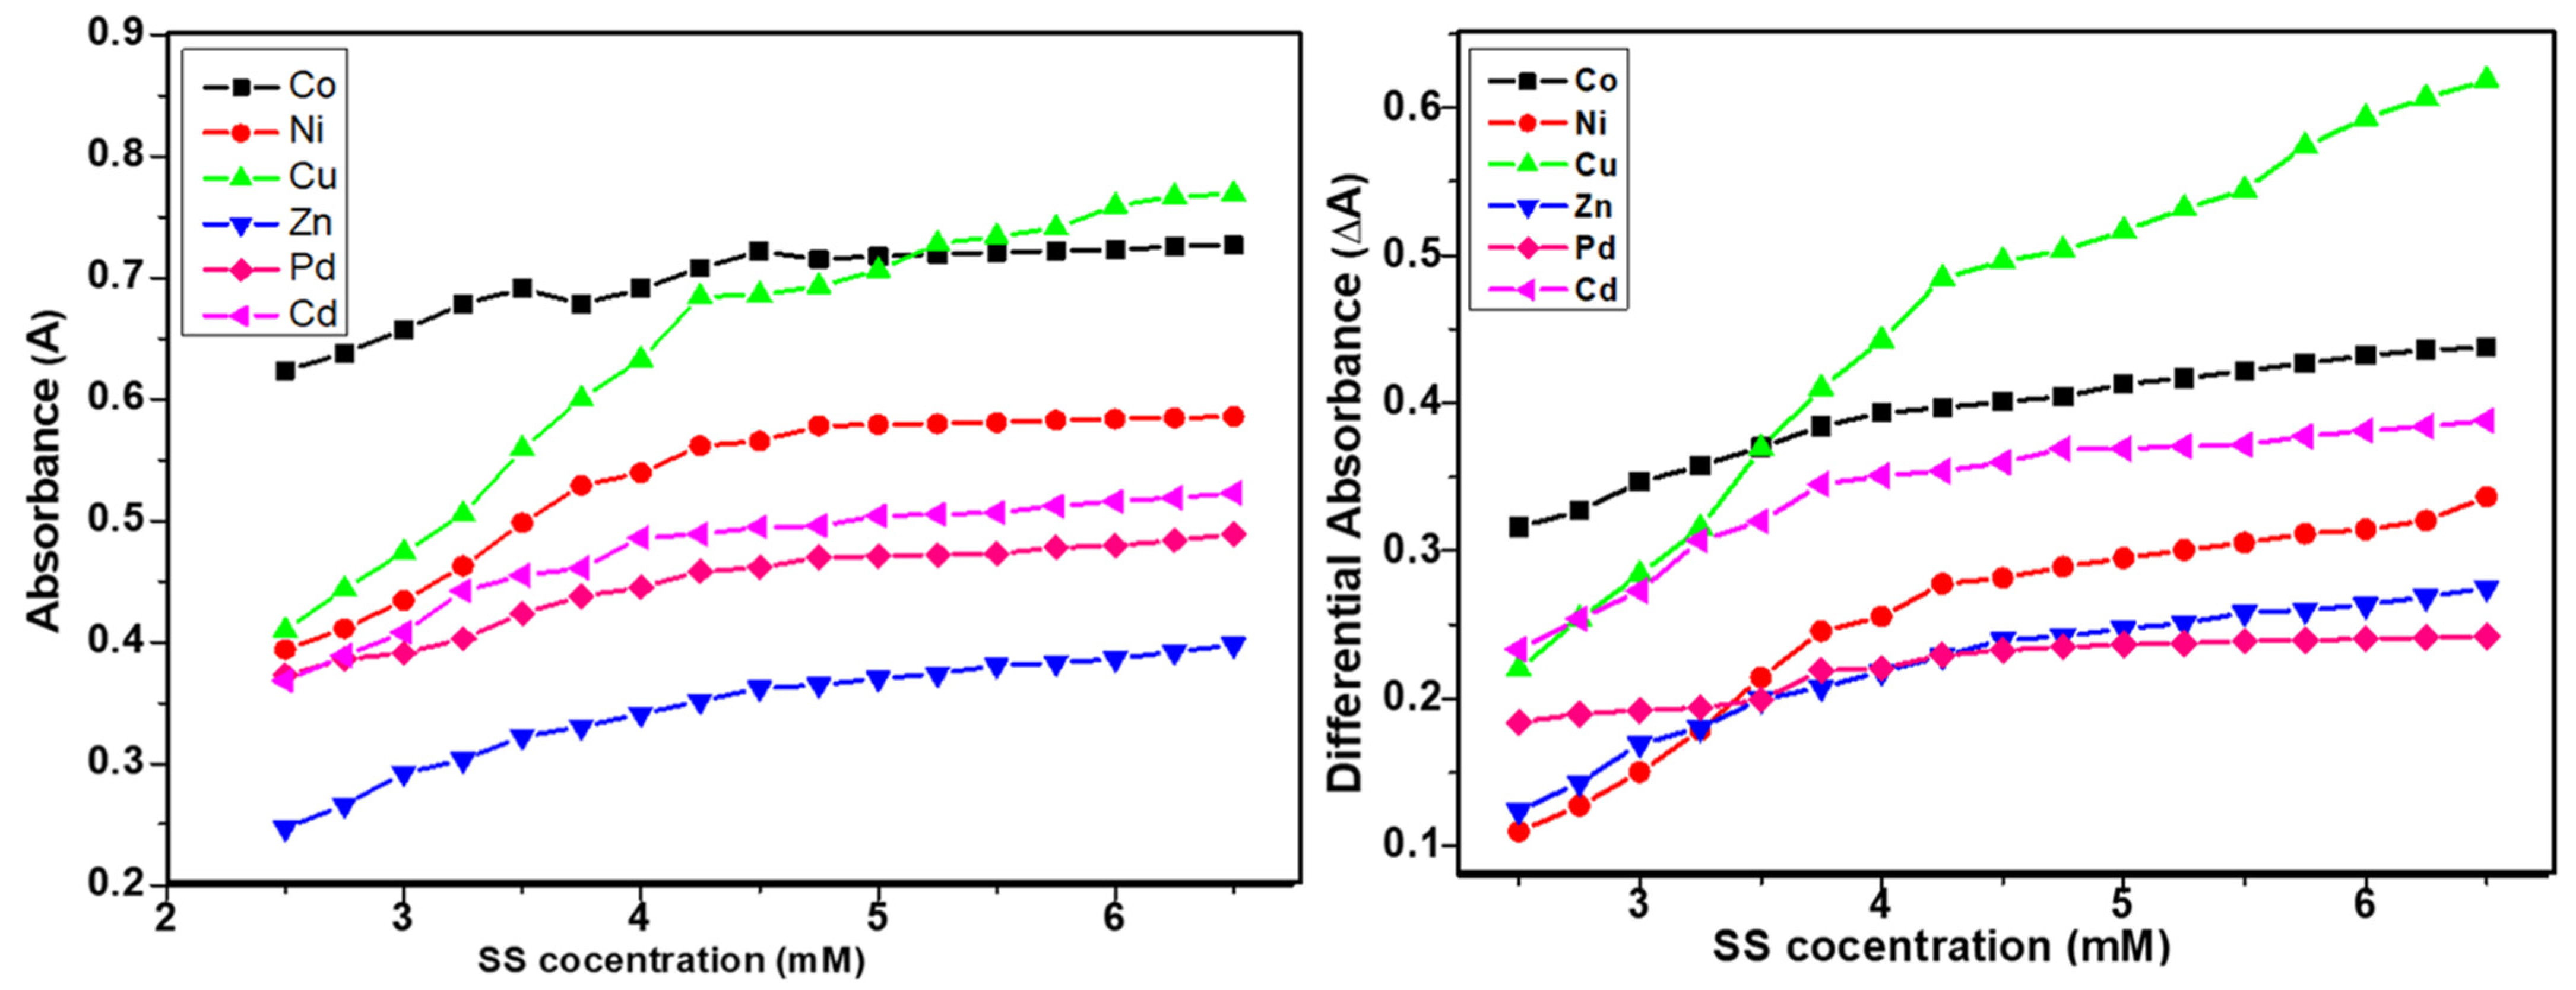
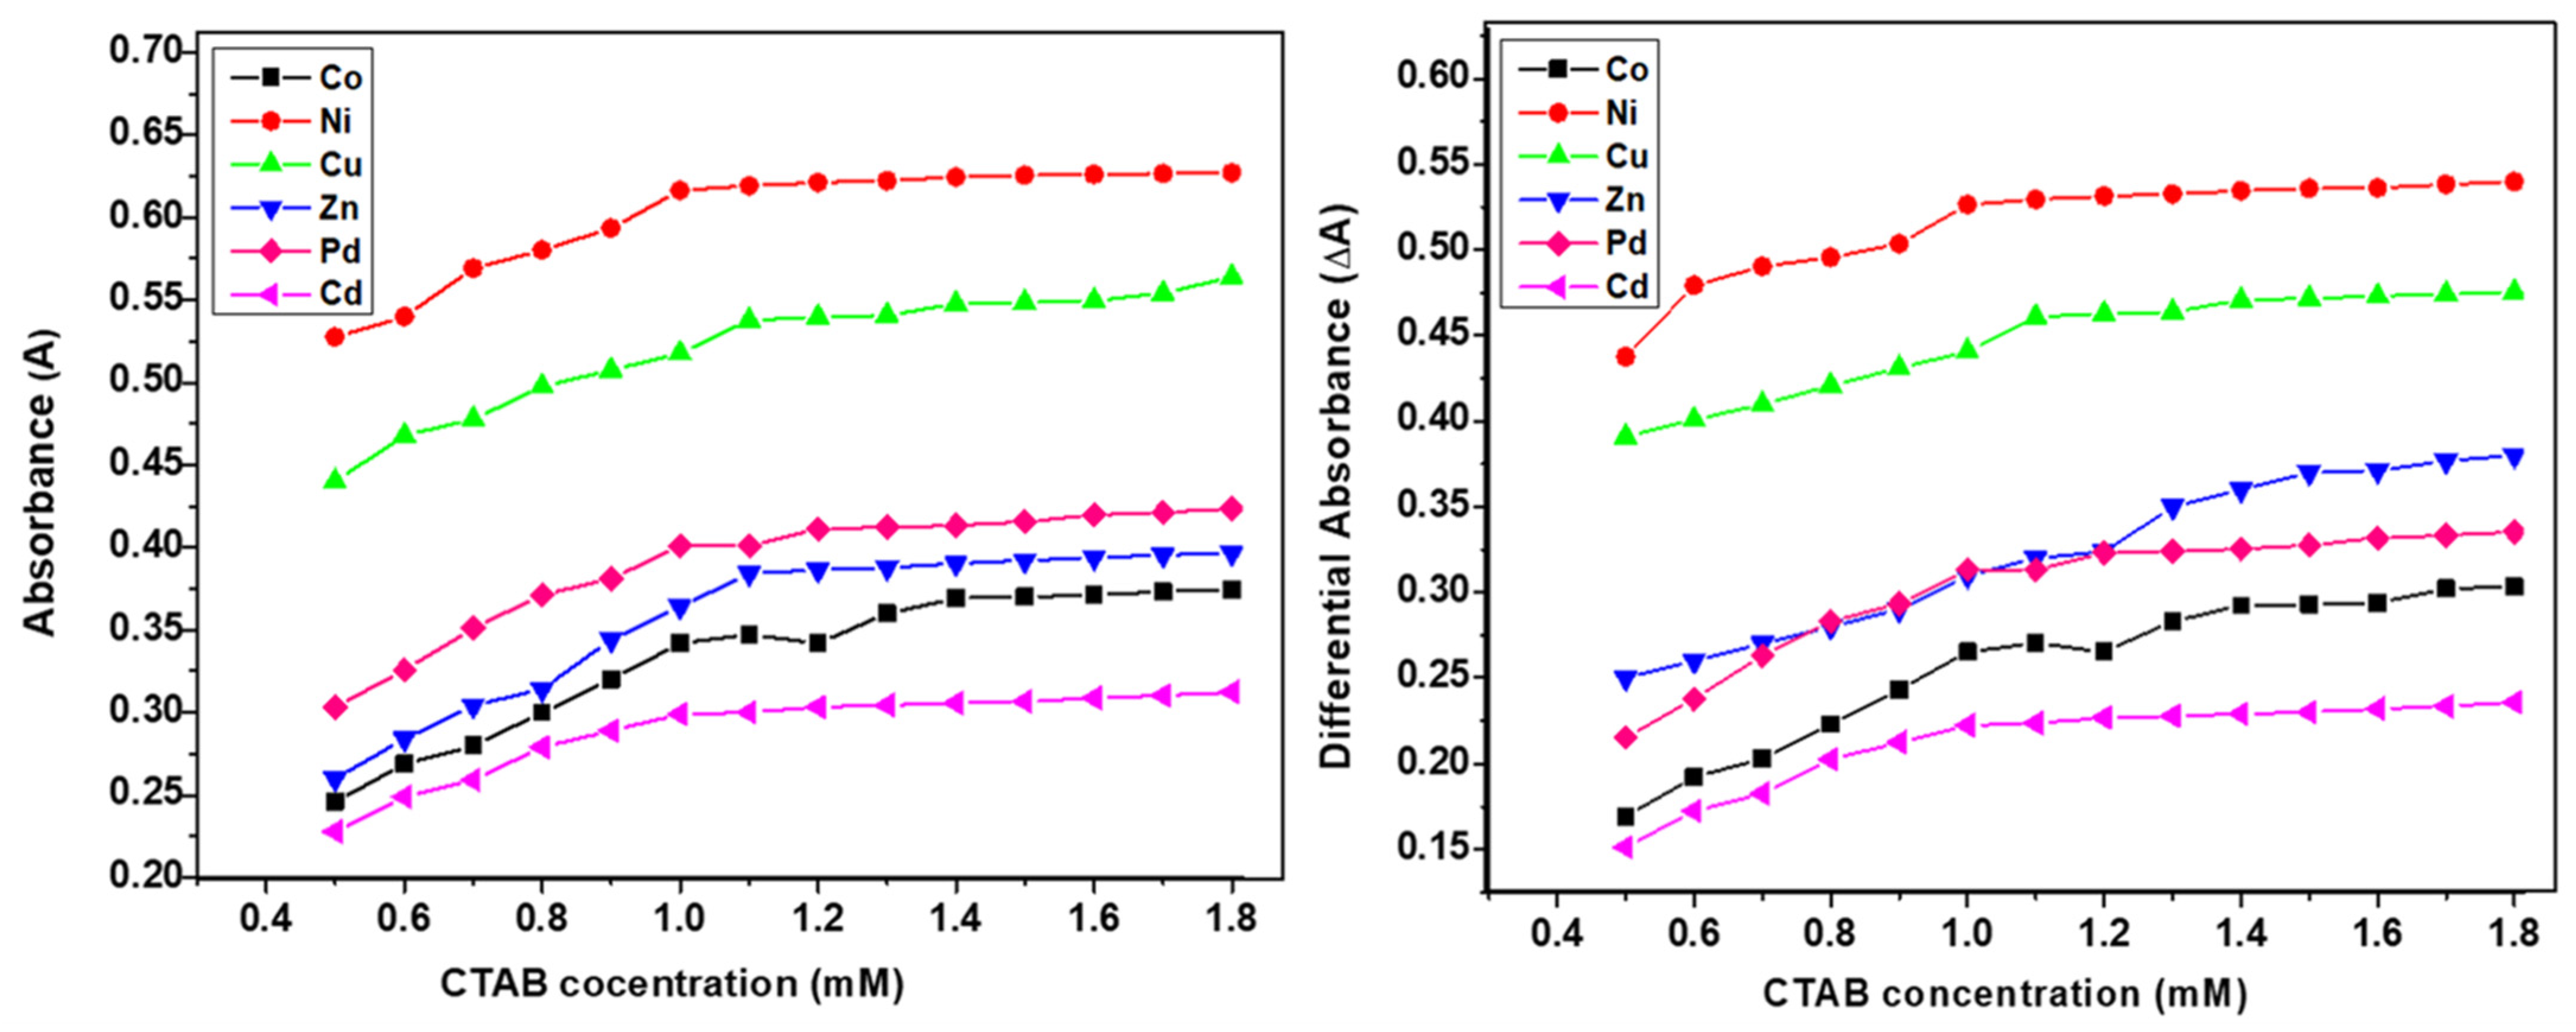
2.4.1. UV-Vis Spectroscopic Measurements
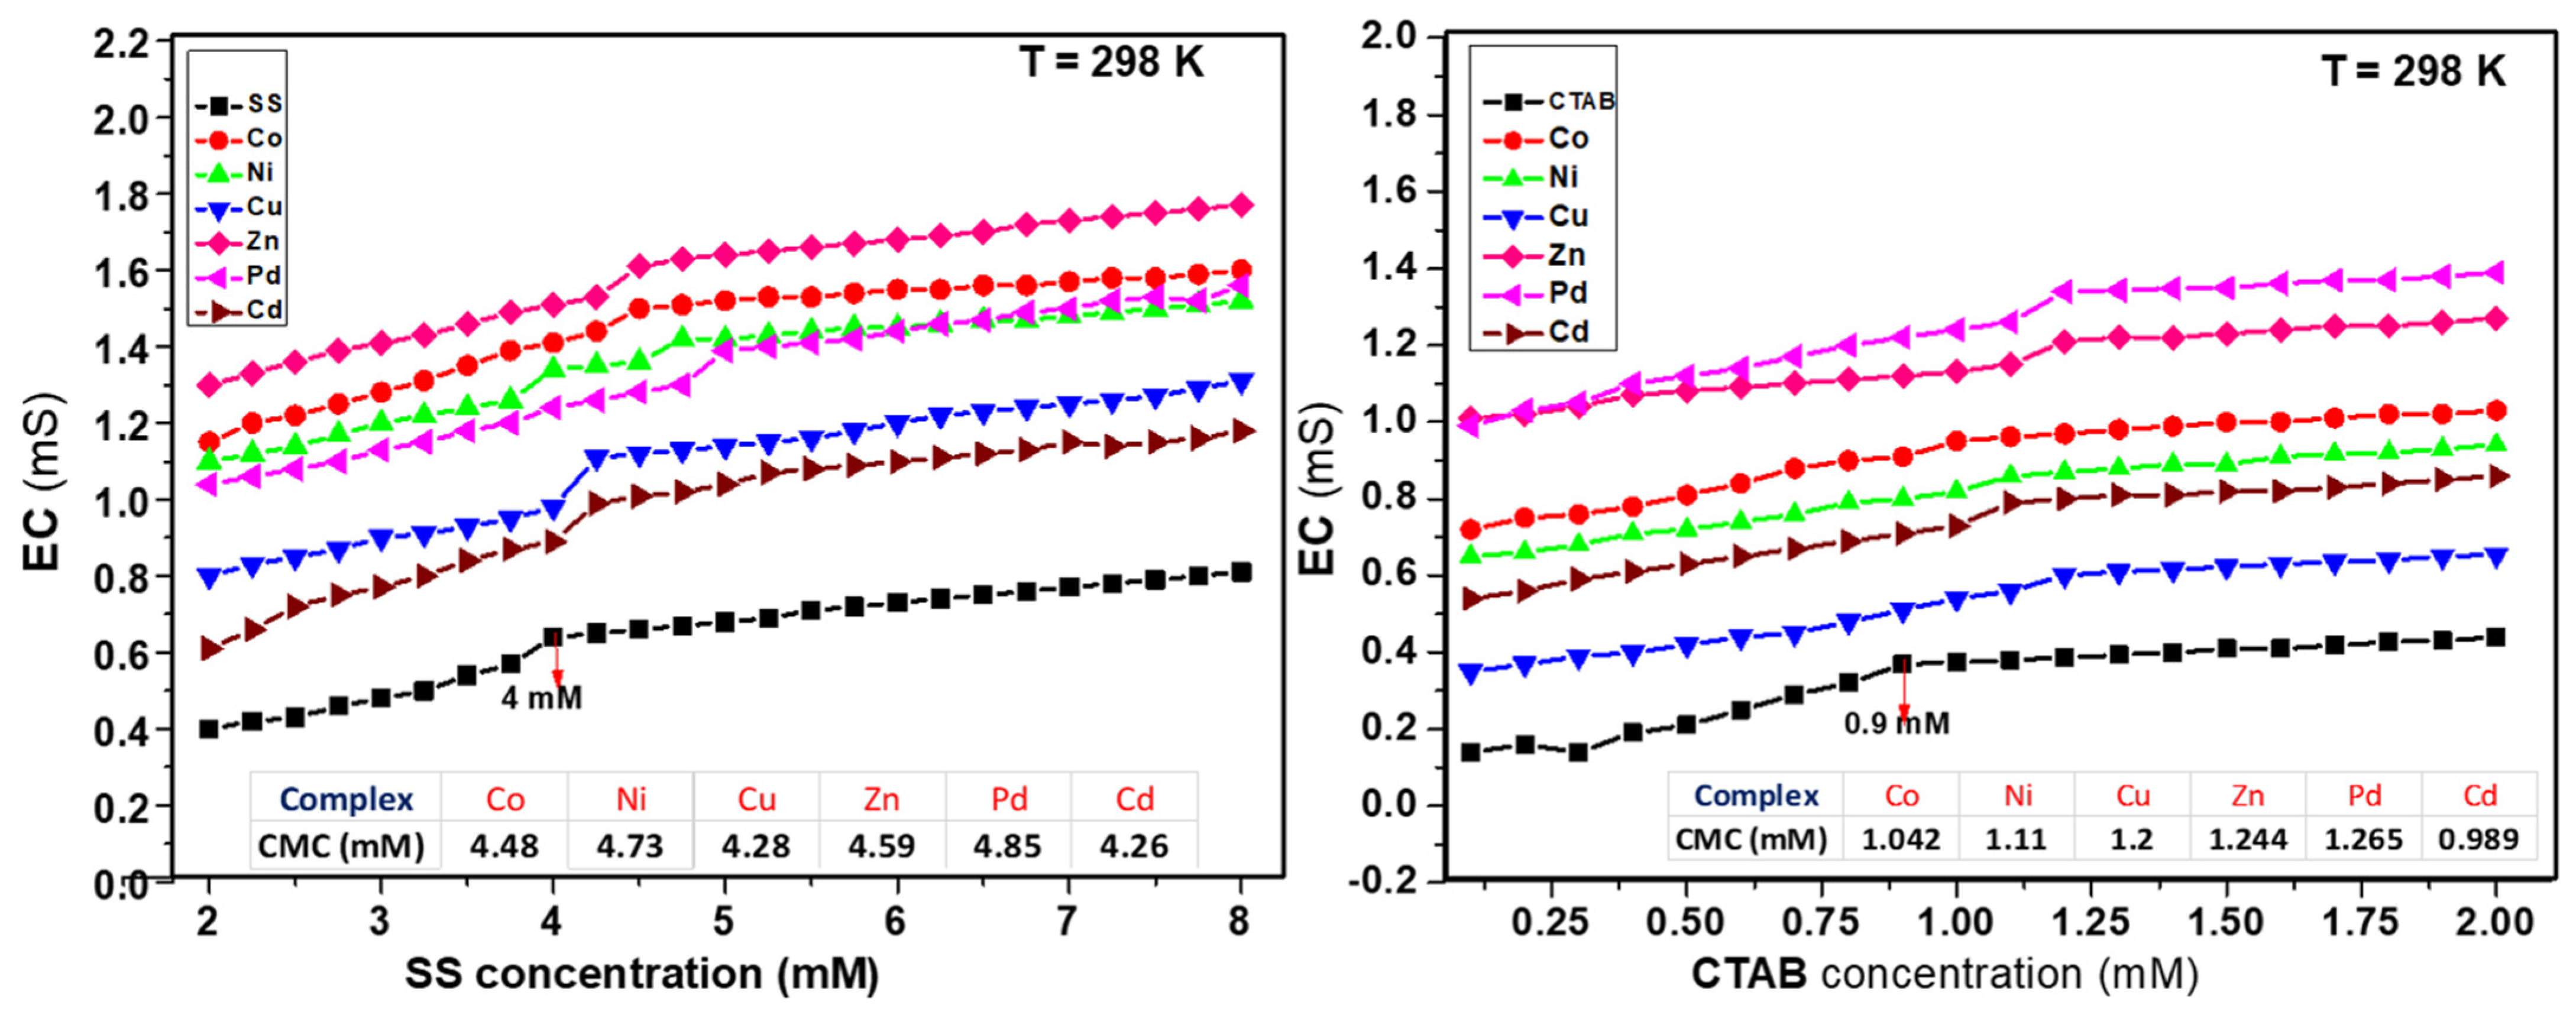
2.4.2. Electrical Conductivity Measurements
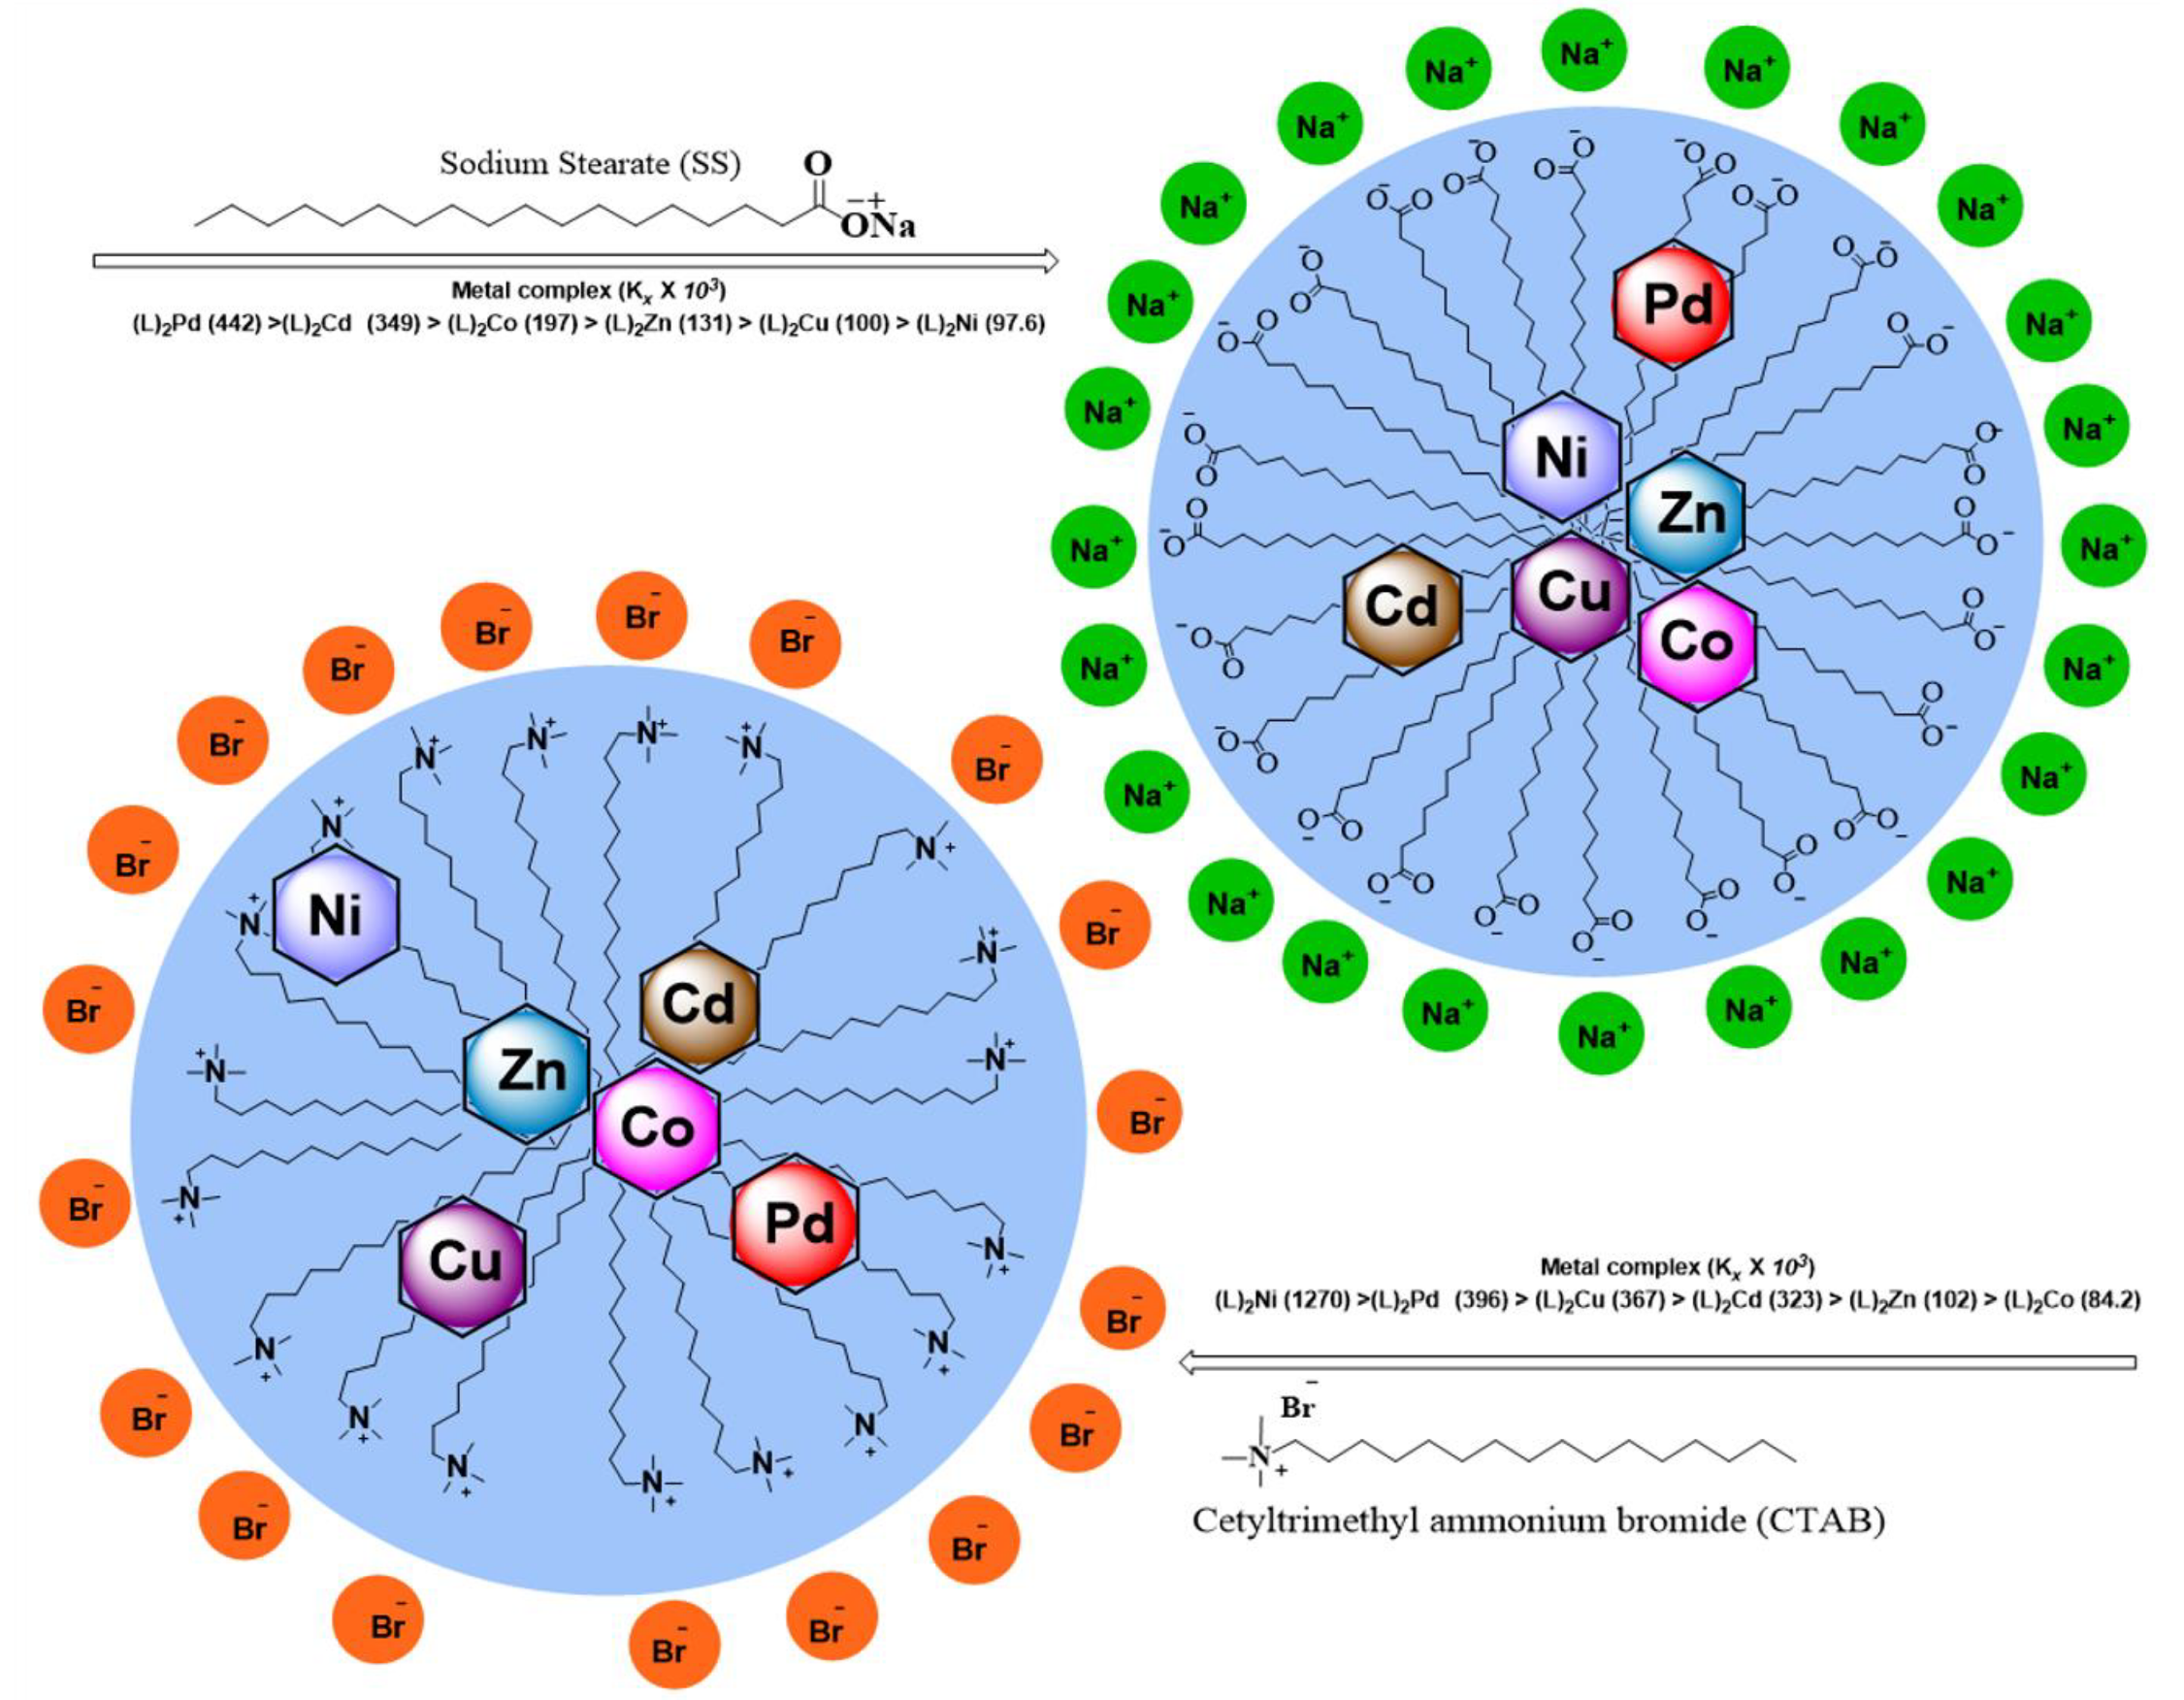
2.4.3. Comparative Interaction of Metal Complexes in Both Surfactants
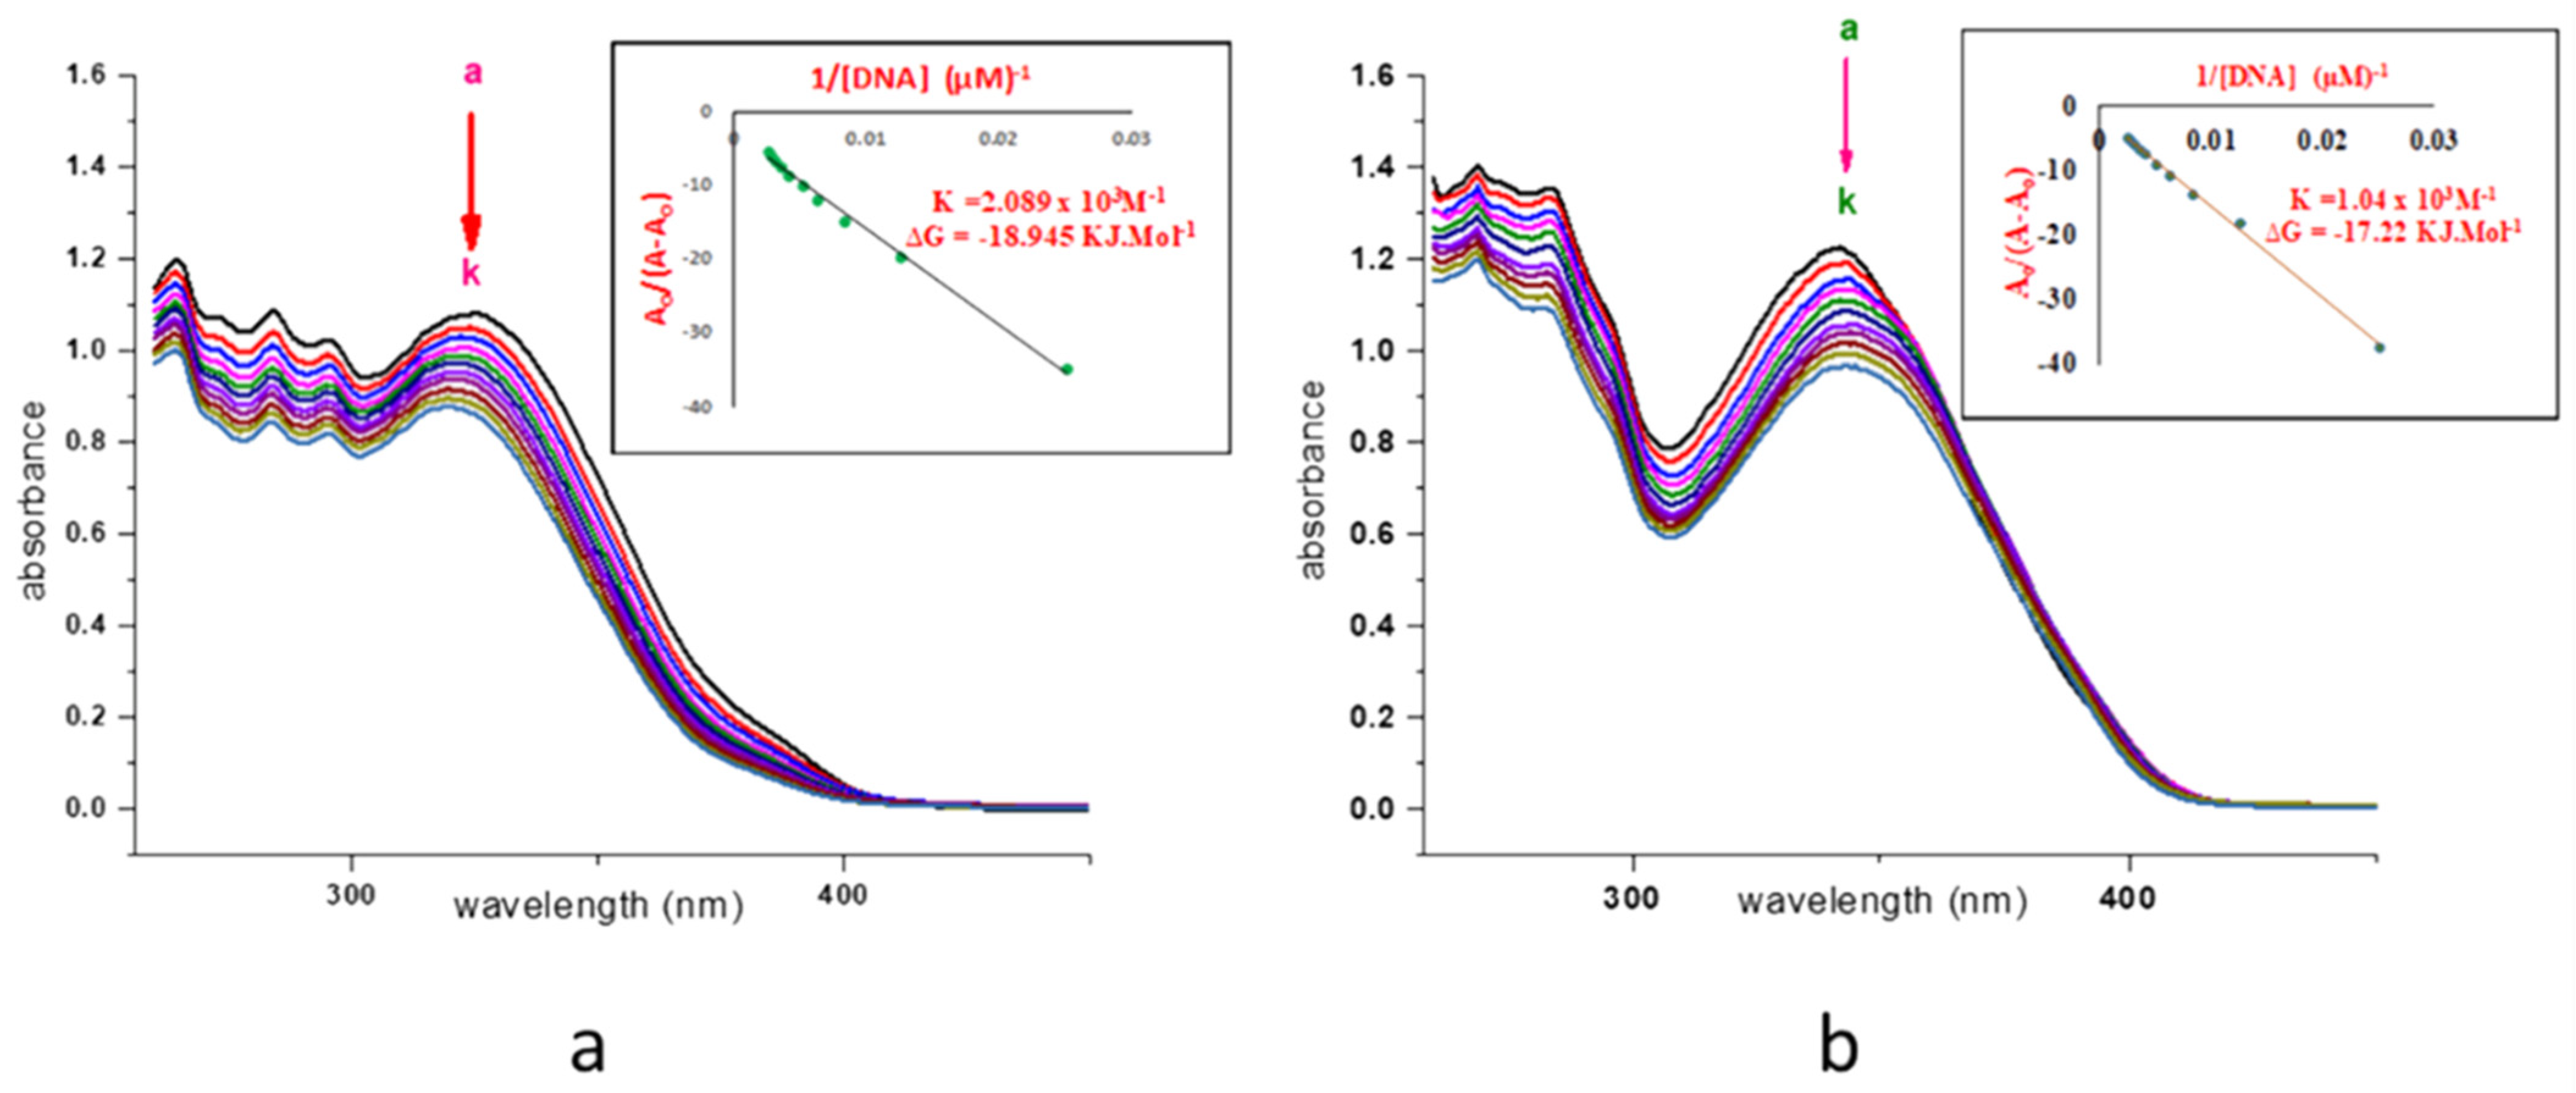
2.5. DNA Interaction Study
2.6. Anti-Bacterial and Anti-Fungal Studies
2.7. MTT Based Cell Viability
3. Materials and Methods
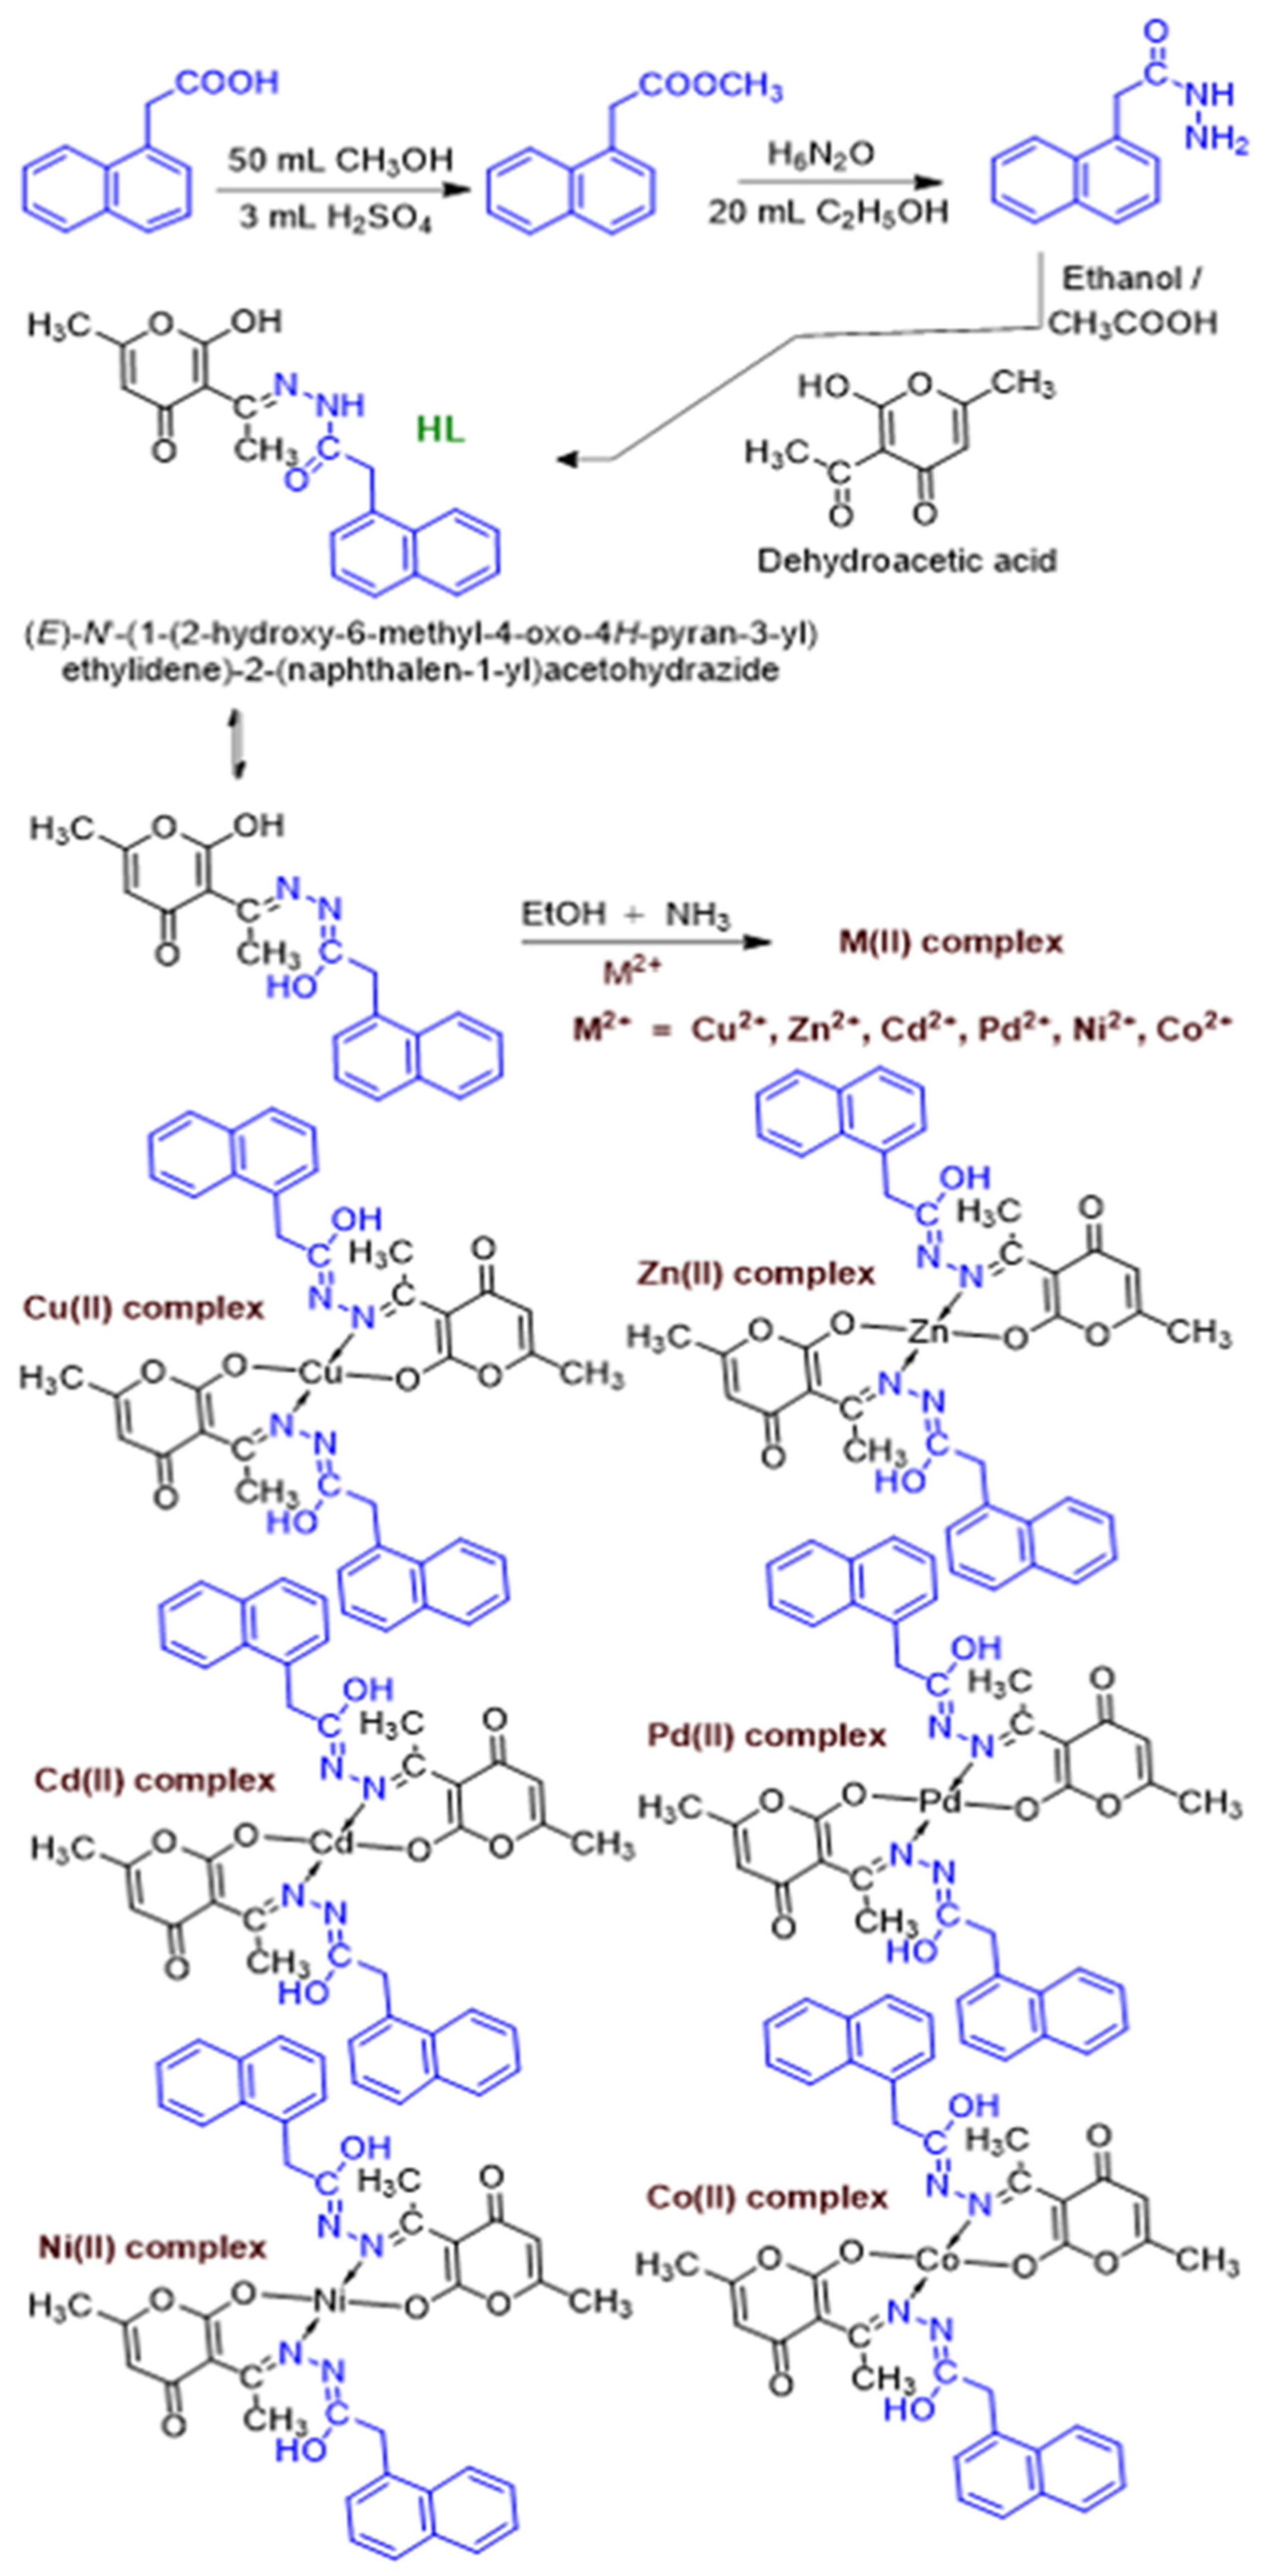
3.1. General Procedure for the Synthesis of (E)-N′-(1-(2-Hydroxy-6-Methyl-4-oxo-4H-Pyran-3-yl Ethylidene)-2-(Naphthalen-1-yl)Acetohydrazide Ligand (HL)
- (i)
- Synthesis of methyl 2-(naphthalen-1-yl)acetate
- (ii)
- Synthesis of 2-(naphthalen-1-yl)acetohydrazide
- (iii)
- Synthesis of (E)-N′-(1-(2-hydroxy-6-methyl-4-oxo-4H-pyran-3-yl ethylidene)-2-(naphthalen-1-yl)acetohydrazide ligand (HL)
3.2. Synthesis of Metal Complexes
- (iv)
- ((E)-N’-(1-(4-hydroxy-6-methyl-2-oxo-2H-pyran-3-yl)ethylidene)-2-(naphthalen-2-yl)acetohydrazide)2Co.
- (v)
- ((E)-N’-(1-(4-hydroxy-6-methyl-2-oxo-2H-pyran-3-yl)ethylidene)-2-(naphthalen-2-yl)acetohydrazide)2Ni.
- (vi)
- ((E)-N’-(1-(4-hydroxy-6-methyl-2-oxo-2H-pyran-3-yl)ethylidene)-2-(naphthalen-2-yl)acetohydrazide)2Cu.
- (vii)
- ((E)-N’-(1-(4-hydroxy-6-methyl-2-oxo-2H-pyran-3-yl)ethylidene)-2-(naphthalen-2-yl)acetohydrazide)2Zn.
- (viii)
- ((E)-N’-(1-(4-hydroxy-6-methyl-2-oxo-2H-pyran-3-yl)ethylidene)-2-(naphthalen-2-yl)acetohydrazide)2Pd.
- (ix)
- ((E)-N’-(1-(4-hydroxy-6-methyl-2-oxo-2H-pyran-3-yl)ethylidene)-2-(naphthalen-2-yl)acetohydrazide)2Cd.
3.3. Matrix-Assisted Laser Desorption Ionization (MALDI) Protocol
3.4. Micellar Interaction of Metal Complexes
3.4.1. Preparation of Stock Solutions and Dilution Method
3.4.2. UV-Vis Spectroscopic Measurements
3.4.3. Calculation of Partitioning and Binding Parameters
- (i)
- Partitioning coefficient (Kx)
- (ii)
- Binding constant (Kb)
- (iii)
- Standard change in free energy of partition (ΔGp)
- (iv)
- Standard change in free energy of partition (ΔGb)
3.4.4. Electrical Conductivity Measurements
3.4.5. Parameters Calculated by Conductivity Data
- (i)
- Critical Micellar Concentration (CMC)
- (ii)
- The Degree of Dissociation (β)
- (iii)
- Free Energy of Micellization (ΔG°m)
3.5. DNA Binding Activity Studies
3.6. Anti-Bacterial and Anti-Fungal Protocol
3.7. MTT Based Cell Viability Assay
4. Conclusions
Supplementary Materials
Author Contributions
Funding
Institutional Review Board Statement
Informed Consent Statement
Data Availability Statement
Acknowledgments
Conflicts of Interest
Sample Availability
References
- Renfrew, A.K. Transition metal complexes with bioactive ligands: Mechanisms for selective ligand release and applications for drug delivery. Metallomics 2014, 6, 1324–1335. [Google Scholar] [CrossRef]
- Baron, R.; Binder, A.; Wasner, G. Neuropathic pain: Diagnosis, pathophysiological mechanisms, and treatment. Lancet Neurol. 2010, 9, 807–819. [Google Scholar] [CrossRef]
- Selvaganapathy, M.; Raman, N. Pharmacological activity of a few transition metal complexes: A short review. J. Chem. Biol. Ther. 2016, 2, 108. [Google Scholar] [CrossRef]
- Mohamed, G.G.; Omar, M.; Hindy, A.M. Synthesis, characterization and biological activity of some transition metals with Schiff base derived from 2-thiophene carboxaldehyde and aminobenzoic acid. Spectrochim. Acta Part A Mol. Biomol. Spectrosc. 2005, 62, 1140–1150. [Google Scholar] [CrossRef] [PubMed]
- Reddy, A.K.; Kathale, N.E. Synthesis and Anti-Inflammatory Activity of Hydrazones Bearing Biphenyl Moiety and Vanillin Based Hybrids. Orient. J. Chem. 2017, 33, 971–978. [Google Scholar] [CrossRef]
- El-Tabl, A.S.; Mohamed Abd El-Waheed, M.; Wahba, M.A.; El-Fadl, A.E.-H.A. Synthesis, characterization, and anticancer activity of new metal complexes derived from 2-hydroxy-3-(hydroxyimino)-4-oxopentan-2-ylidene) benzohydrazide. Bioinorg. Chem. Appl. 2015, 2015, 126023. [Google Scholar] [CrossRef] [PubMed]
- Wen, A.M.; Steinmetz, N.F. Design of virus-based nanomaterials for medicine, biotechnology, and energy. Chem. Soc. Rev. 2016, 45, 4074–4126. [Google Scholar] [CrossRef]
- Ahmad, F.; Taj, M.; Tirmizi, S.; Alelwani, W.; Hajjar, D.; Makki, A.; Shah, S.; Ali, U.; Hassan, U.; Tahir, M. Selective Complexation of Hydrazone Based Ketimine with 3d, 4d, and 5d Metals: Synthesis, Characterization, and Biological Activity. Russ. J. Gen. Chem. 2019, 89, 142–147. [Google Scholar] [CrossRef]
- Juje, F.A.; Jayaprakash, H. Synthesis, Characterization and Biological Importance of Acid Hydrazone Complexes. Int. J. Adv. Res. Dev. 2017, 2, 61–65. [Google Scholar]
- Kendur, U.; Chimmalagi, G.H.; Patil, S.M.; Gudasi, K.B.; Frampton, C.S. Synthesis, structural characterization and biological evaluation of mononuclear transition metal complexes of zwitterionic dehydroacetic acid N-aroylhydrazone ligand. Appl. Organomet. Chem. 2018, 32, e4278. [Google Scholar] [CrossRef]
- Noor, S.; Rashid, M.A. Solubilization and Thermodynamic Attributes of Nickel Phenanthroline Complex in Micellar Media of Sodium 2-Ethyl Hexyl Sulfate and Sodium Bis (2-ethyl hexyl) Sulfosuccinate. Tenside Surfactants Deterg. 2019, 56, 490–498. [Google Scholar] [CrossRef]
- Noor, S.; Younas, N.; Rashid, M.A.; Nazir, S.; Usman, M.; Naz, T. Spectroscopic, conductometric and biological investigation of [Ni (phen) 3] F2. EtOH. MeOH. 8H2O complex in anionic micellar media. Colloid Interface Sci. Commun. 2018, 27, 26–34. [Google Scholar] [CrossRef]
- Taj, M.B.; Alkahtani, M.D.; Ali, U.; Raheel, A.; Alelwani, W.; Alnajeebi, A.M.; Babteen, N.A.; Noor, S.; Alshater, H. New Heteroleptic 3D Metal Complexes: Synthesis, Antimicrobial and Solubilization Parameters. Molecules 2020, 25, 4252. [Google Scholar] [CrossRef] [PubMed]
- Taj, M.; Raheel, A.; Alelwani, W.; Hajjar, D.; Makki, A.; Alnajeebi, A.; Babteen, N.; Tırmizi, S.; Noor, S. A Swift One-Pot Solvent-Free Synthesis of Benzimidazole Derivatives and Their Metal Complexes: Hydrothermal Treatment, Enzymatic Inhibition, and Solubilization Studies. Russ. J. Gen. Chem. 2020, 90, 1533–1543. [Google Scholar] [CrossRef]
- Younas, N.; Rashid, M.A.; Usman, M.; Nazir, S.; Noor, S.; Basit, A.; Jamil, M. Solubilization of Ni imidazole complex in micellar media of anionic surfactants, sodium dodecyl sulfate and sodium stearate. J. Surfactants Deterg. 2017, 20, 1311–1320. [Google Scholar] [CrossRef]
- Hanif, S.; Usman, M.; Hussain, A.; Rasool, N.; Zubair, M.; Rana, U.A. Solubilization of Benzothiazole (BNZ) by micellar media of Sodium dodecyl sulphate and Cetyl trimethylammonium bromide. J. Mol. Liq. 2015, 211, 7–14. [Google Scholar] [CrossRef]
- Al Alousi, A.S.; Shehata, M.; Shoukry, M.; Hassan, S.; Mahmoud, N. Coordination properties of dehydroacetic acid–binary and ternary complexes. J. Coord. Chem. 2008, 61, 1906–1916. [Google Scholar] [CrossRef]
- Prabhakara, C.T.; Patil, S.A.; Toragalmath, S.S.; Kinnal, S.M.; Badami, P.S. Synthesis, characterization and biological approach of metal chelates of some first row transition metal ions with halogenated bidentate coumarin Schiff bases containing N and O donor atoms. J. Photochem. Photobiol. B Biol. 2016, 157, 1–14. [Google Scholar] [CrossRef]
- Kabeer, H.; Hanif, S.; Arsalan, A.; Asmat, S.; Younus, H.; Shakir, M. Structural-dependent N, O-donor imine-appended Cu (II)/Zn (II) complexes: Synthesis, spectral, and in vitro pharmacological assessment. ACS Omega 2020, 5, 1229–1245. [Google Scholar] [CrossRef]
- Abd El-Hamid, S.; Sadeek, S.; Zordok, W.; Rashid, N. Spectroscopic properties, molecular structure, anticancer and antimicrobial evaluation of some new moxifloxacin metal complexes in the presence of 1, 10-phenanthroline. Bull. Chem. Soc. Ethiop. 2020, 34, 295–312. [Google Scholar] [CrossRef]
- Roy, S.; Chattopadhyay, S. Mono, di and trinuclear photo-luminescent cadmium (II) complexes with N2O and N2O2 donor salicylidimine Schiff bases: Synthesis, structure and self assembly. Inorg. Chim. Acta 2015, 433, 72–77. [Google Scholar] [CrossRef]
- Golcu, A.; Tumer, M.; Demirelli, H.; Wheatley, R.A. Cd (II) and Cu (II) complexes of polydentate Schiff base ligands: Synthesis, characterization, properties and biological activity. Inorg. Chim. Acta 2005, 358, 1785–1797. [Google Scholar] [CrossRef]
- Niu, M.-J.; Li, Z.; Chang, G.-L.; Kong, X.-J.; Hong, M.; Zhang, Q.-f. Crystal structure, cytotoxicity and interaction with DNA of zinc (II) complexes with o-vanillin Schiff base ligands. PLoS ONE 2015, 10, e0130922. [Google Scholar] [CrossRef] [PubMed]
- Krasnovskaya, O.; Naumov, A.; Guk, D.; Gorelkin, P.; Erofeev, A.; Beloglazkina, E.; Majouga, A. Copper Coordination Compounds as Biologically Active Agents. Int. J. Mol. Sci. 2020, 21, 3965. [Google Scholar] [CrossRef] [PubMed]
- Ahmad, S.; Ullah, F.; Zeb, A.; Ayaz, M.; Ullah, F.; Sadiq, A. Evaluation of Rumex hastatus D. Don for cytotoxic potential against HeLa and NIH/3T3 cell lines: Chemical characterization of chloroform fraction and identification of bioactive compounds. BMC Complementary Altern. Med. 2016, 16, 308. [Google Scholar] [CrossRef] [PubMed]


| Compounds | Infra-Red Bands (Stretching’s in cm−1) | ||||||
|---|---|---|---|---|---|---|---|
| υ(N-H) | υ(O-H) | υ(C=O) | υ(C=N) | υ(arom.) | υ(M-O) | υ(M-N) | |
| Ligand | 3275(w) | 2997(w) | 1702(s) | 1654(s) | 1511,1466 | - | - |
| Co(L)2 | - | 3142(w) | 1693(s) | 1619(s) | 1449–1428 | 568(m) | 489(m) |
| Ni(L)2 | 3437(w) | - | 1676(s) | 1619(s) | 1455–1428 | 570(m) | 440(m) |
| Cu(L)2 | - | 3208(w) | 1680(s) | 1654(s) | 1459–1428 | 538(m) | 480(m) |
| Zn(L)2 | 3147(w) | - | 1692(s) | 1625(s) | 1456–1442 | 527(m) | 488(m) |
| Pd(L)2 | 3310(w) | - | 1689(s) | 1563(s) | 1437–1425 | 492(m) | 437(m) |
| Cd(L)2 | 3142(w) | - | 1676(s) | 1624(s) | 1452–1427 | 434(m) | 482(m) |
| Surfactant | Complex | Kc × 103 (dm3/mol) | Kx × 103 (dm3/mol) | Kb (dm3/mol) | ΔGp (kJ/mol) | ΔGb (kJ/mol) |
|---|---|---|---|---|---|---|
| Co(II) | 3.54 | 197 | 567 | −30.2 | −15.71 | |
| Ni(II) | 1.76 | 97.6 | 225 | −28.46 | −13.41 | |
| SS | Cu(II) | 1.81 | 100 | 117 | −28.53 | −11.79 |
| Zn(II) | 2.36 | 131 | 300 | −29.19 | −14.13 | |
| Pd(II) | 7.96 | 442 | 125 | −32.2 | −15.31 | |
| Cd(II) | 6.28 | 349 | 700 | −31.61 | −16.23 | |
| Co(II) | 1.52 | 84.2 | 2300 | −28.09 | −19.17 | |
| Ni(II) | 22.8 | 1270 | 16000 | −34.81 | −23.98 | |
| CTAB | Cu(II) | 6.6 | 367 | 56700 | −31.74 | −21.41 |
| Zn(II) | 1.83 | 102 | 1600 | −28.56 | −18.27 | |
| Pd(II) | 7.13 | 396 | 617 | −31.93 | −15.91 | |
| Cd(II) | 5.81 | 323 | 5000 | −31.42 | −21.1 |
| Complex | SS | CTAB | ||||
|---|---|---|---|---|---|---|
| CMC (mM) | ΔG°m (kJ mol−1) | β | CMC (mM) | ΔG°m (kJ mol−1) | β | |
| Co(II) | 4.48 | −40.31 | 0.195 | 1.04 | −42.56 | 0.276 |
| Ni(II) | 4.73 | −41.89 | 0.274 | 1.11 | −46.21 | 0.422 |
| Cu(II) | 4.28 | −34.75 | 0.519 | 1.2 | −45.41 | 0.294 |
| Zn(II) | 4.59 | −37.30 | 0.399 | 1.24 | −40.18 | 0.485 |
| Pd(II) | 4.85 | −39.19 | 0.533 | 1.26 | −44.58 | 0.229 |
| Cd(II) | 4.26 | −34.44 | 0.307 | 0.99 | −47.99 | 0.317 |
| Tested Compound | E. coli | Pseudomonas | S. aureus | Listeria | C. albicans |
|---|---|---|---|---|---|
| Ligand | - | 5 | - | - | - |
| Co(II) complex | - | 5 | - | - | - |
| Ni(II) complex | - | - | - | - | - |
| Cu(II) complex | 10 | 5 | 10 | 10 | - |
| Zn(II) complex | - | - | - | - | - |
| Pd(II) complex | - | - | - | - | 5 |
| Cd(II) complex | 9 | - | 12 | 15 | 9 |
| Tested Compound | Conc. (mg/mL) | % Inhibition |
|---|---|---|
| Ligand | 30 µM | 26 |
| Co(II) complex | 30 µM | 28 |
| Ni(II) complex | 30 µM | 41 |
| Cu(II) complex | 30 µM | 87 |
| Zn(II) complex | 30 µM | 28 |
| Pd(II) complex | 30 µM | 97 |
| Cd(II) complex | 30 µM | 31 |
| Doxorubicin | 30 µM | 95 |
| Complex | λmax (nm) | ||
|---|---|---|---|
| DMSO:H2O (1:1) | SS System | CTAB System | |
| Co(II) | 327 | 332 | 341 |
| Ni(II) | 351 | 357 | 368 |
| Cu(II) | 347 | 352 | 365 |
| Zn(II) | 333 | 339 | 348 |
| Pd(II) | 339 | 343 | 355 |
| Cd(II) | 373 | 378 | 387 |
Publisher’s Note: MDPI stays neutral with regard to jurisdictional claims in published maps and institutional affiliations. |
© 2021 by the authors. Licensee MDPI, Basel, Switzerland. This article is an open access article distributed under the terms and conditions of the Creative Commons Attribution (CC BY) license (http://creativecommons.org/licenses/by/4.0/).
Share and Cite
Ahmad, F.; Alkahtani, M.D.F.; Taj, M.B.; Alnajeebi, A.M.; Alzahrani, S.O.; Babteen, N.A.; Alelwani, W.; Bannunah, A.M.; Noor, S.; Ayub, R.; et al. Synthesis of New Naphthyl Aceto Hydrazone-Based Metal Complexes: Micellar Interactions, DNA Binding, Antimicrobial, and Cancer Inhibition Studies. Molecules 2021, 26, 1044. https://doi.org/10.3390/molecules26041044
Ahmad F, Alkahtani MDF, Taj MB, Alnajeebi AM, Alzahrani SO, Babteen NA, Alelwani W, Bannunah AM, Noor S, Ayub R, et al. Synthesis of New Naphthyl Aceto Hydrazone-Based Metal Complexes: Micellar Interactions, DNA Binding, Antimicrobial, and Cancer Inhibition Studies. Molecules. 2021; 26(4):1044. https://doi.org/10.3390/molecules26041044
Chicago/Turabian StyleAhmad, Fawad, Muneera D. F. Alkahtani, Muhammad Babar Taj, Afnan M. Alnajeebi, Seraj Omar Alzahrani, Nouf Abubakr Babteen, Walla Alelwani, Azzah M. Bannunah, Sadia Noor, Rabia Ayub, and et al. 2021. "Synthesis of New Naphthyl Aceto Hydrazone-Based Metal Complexes: Micellar Interactions, DNA Binding, Antimicrobial, and Cancer Inhibition Studies" Molecules 26, no. 4: 1044. https://doi.org/10.3390/molecules26041044
APA StyleAhmad, F., Alkahtani, M. D. F., Taj, M. B., Alnajeebi, A. M., Alzahrani, S. O., Babteen, N. A., Alelwani, W., Bannunah, A. M., Noor, S., Ayub, R., Tirmizi, S. A., & Alshater, H. (2021). Synthesis of New Naphthyl Aceto Hydrazone-Based Metal Complexes: Micellar Interactions, DNA Binding, Antimicrobial, and Cancer Inhibition Studies. Molecules, 26(4), 1044. https://doi.org/10.3390/molecules26041044