
Sustainable Drying and Torrefaction Processes of Miscanthus for Use as a Pelletized Solid Biofuel and Biocarbon-Carrier for Fertilizers

 ,
,  , , ,
, , ,  , and
, and 
Abstract
1. Introduction
2. Results
2.1. Analysis of Miscanthus Drying Process and Pellets Properties of Miscanthus
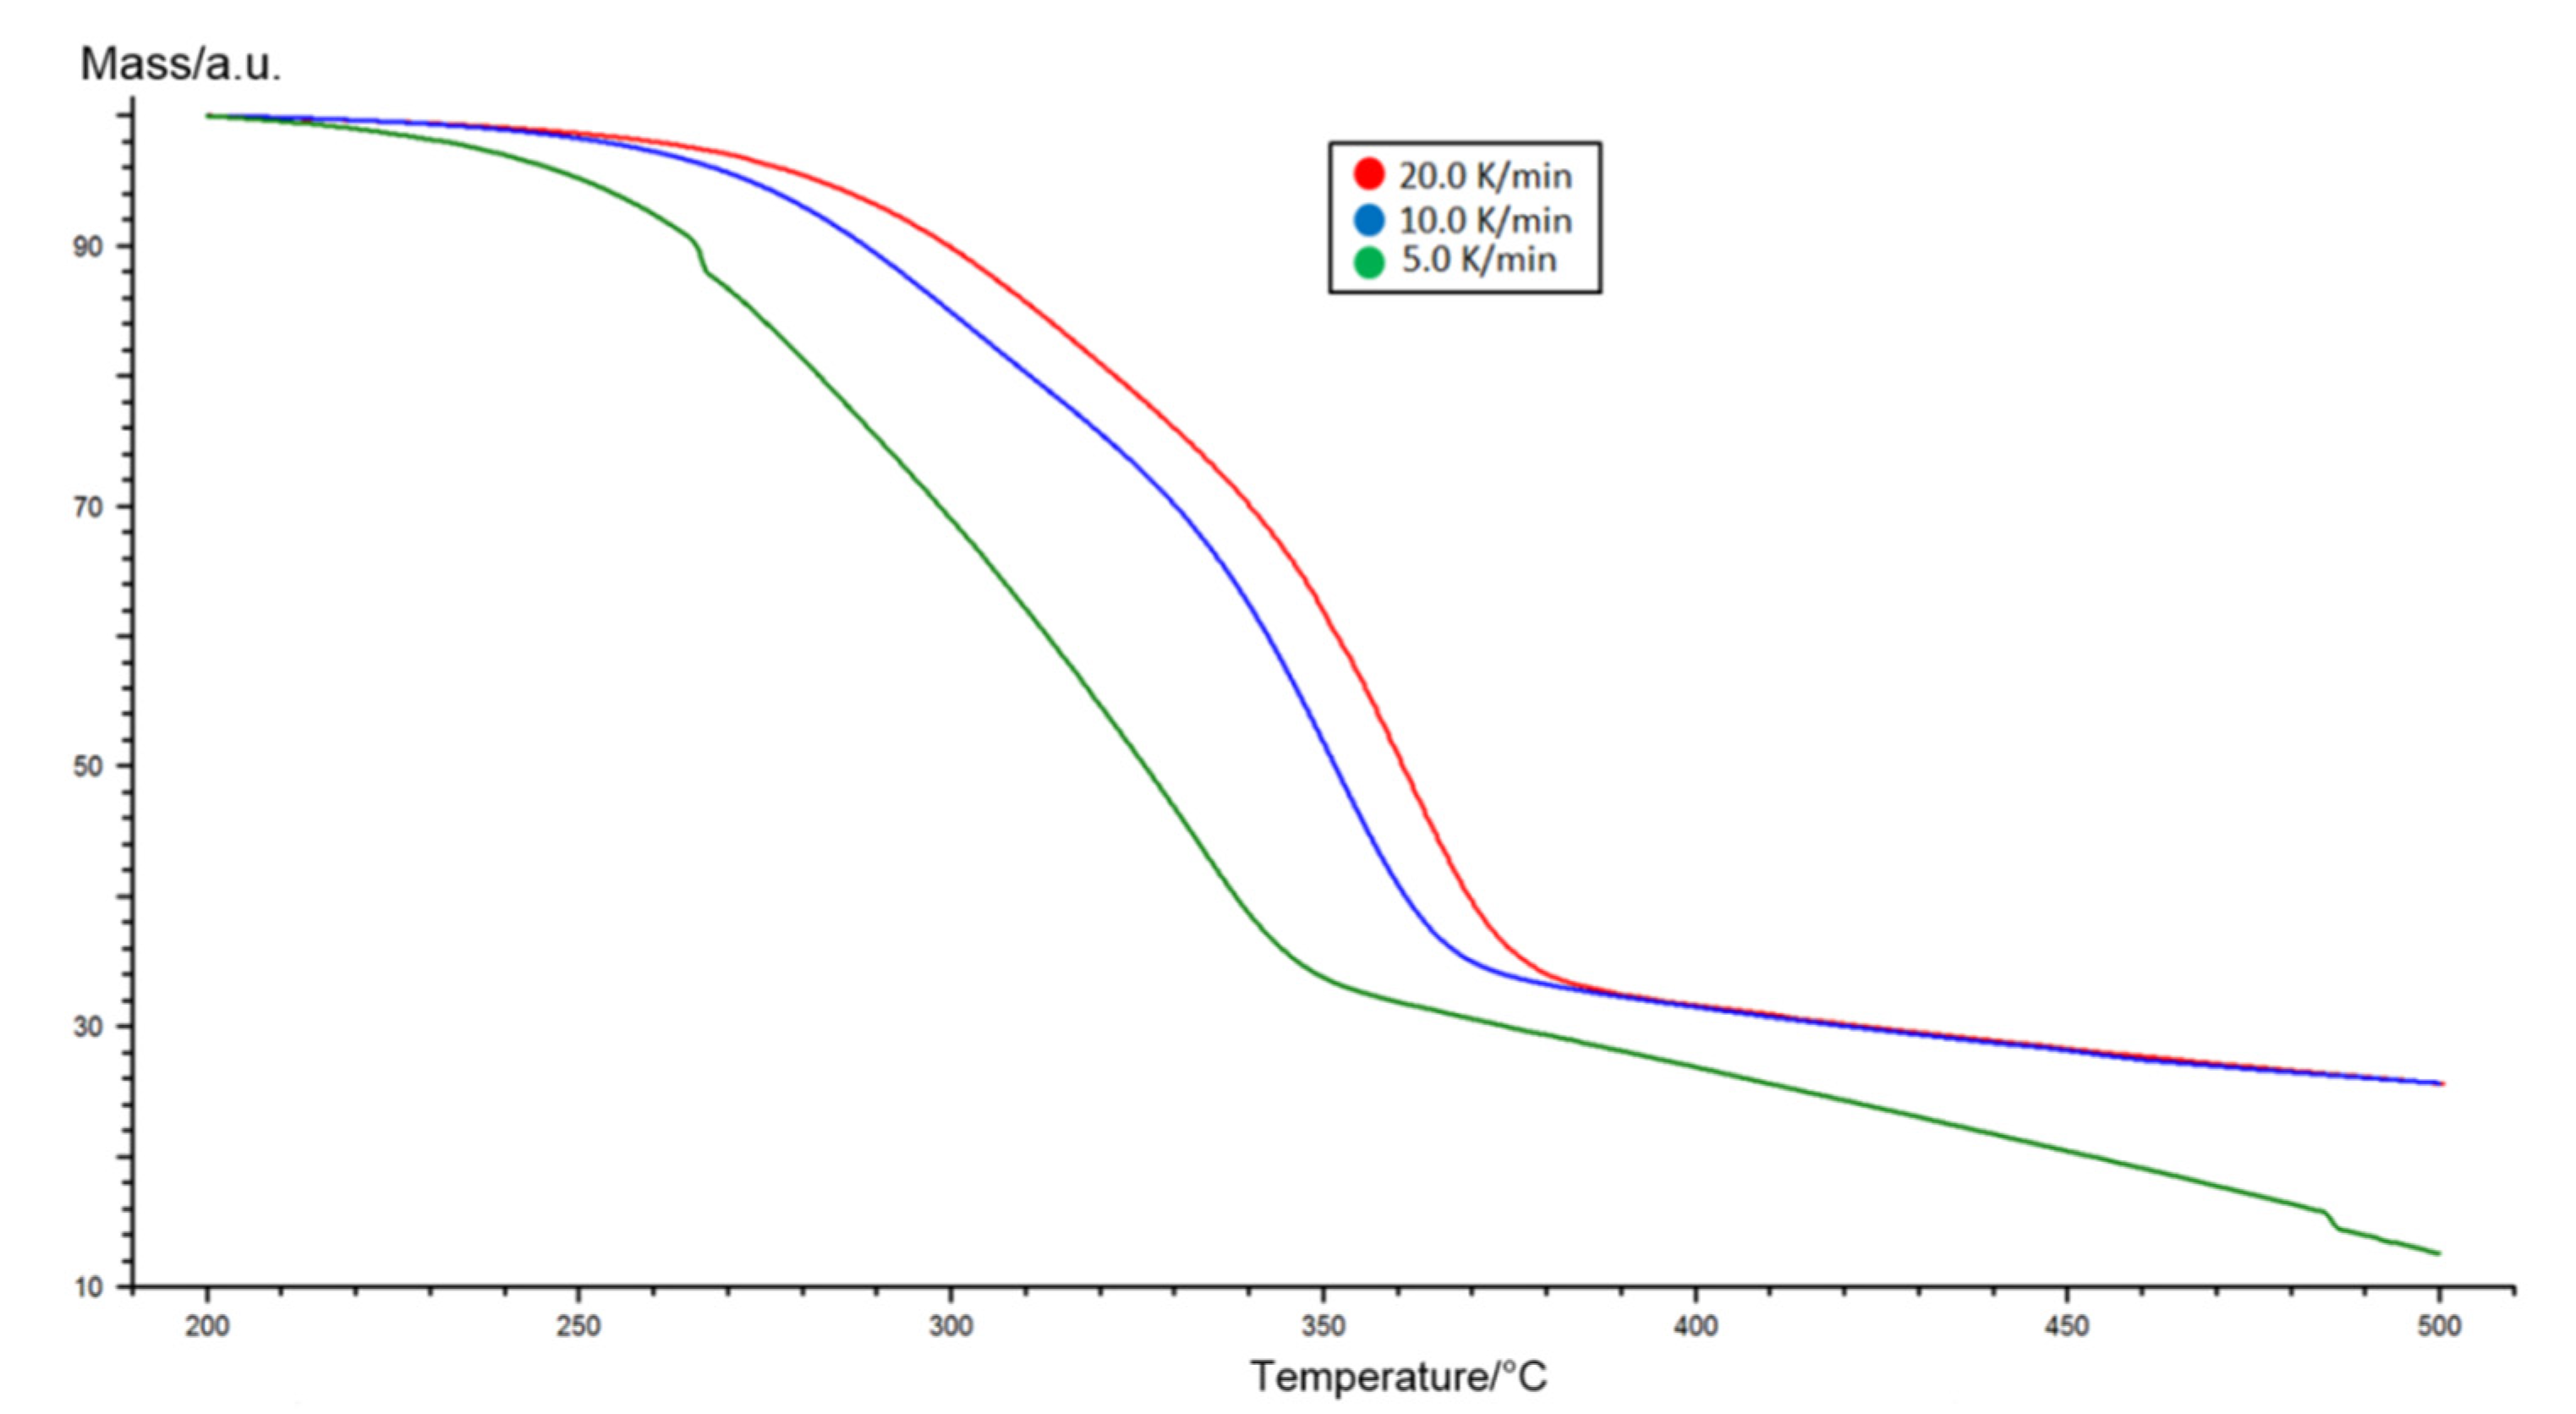
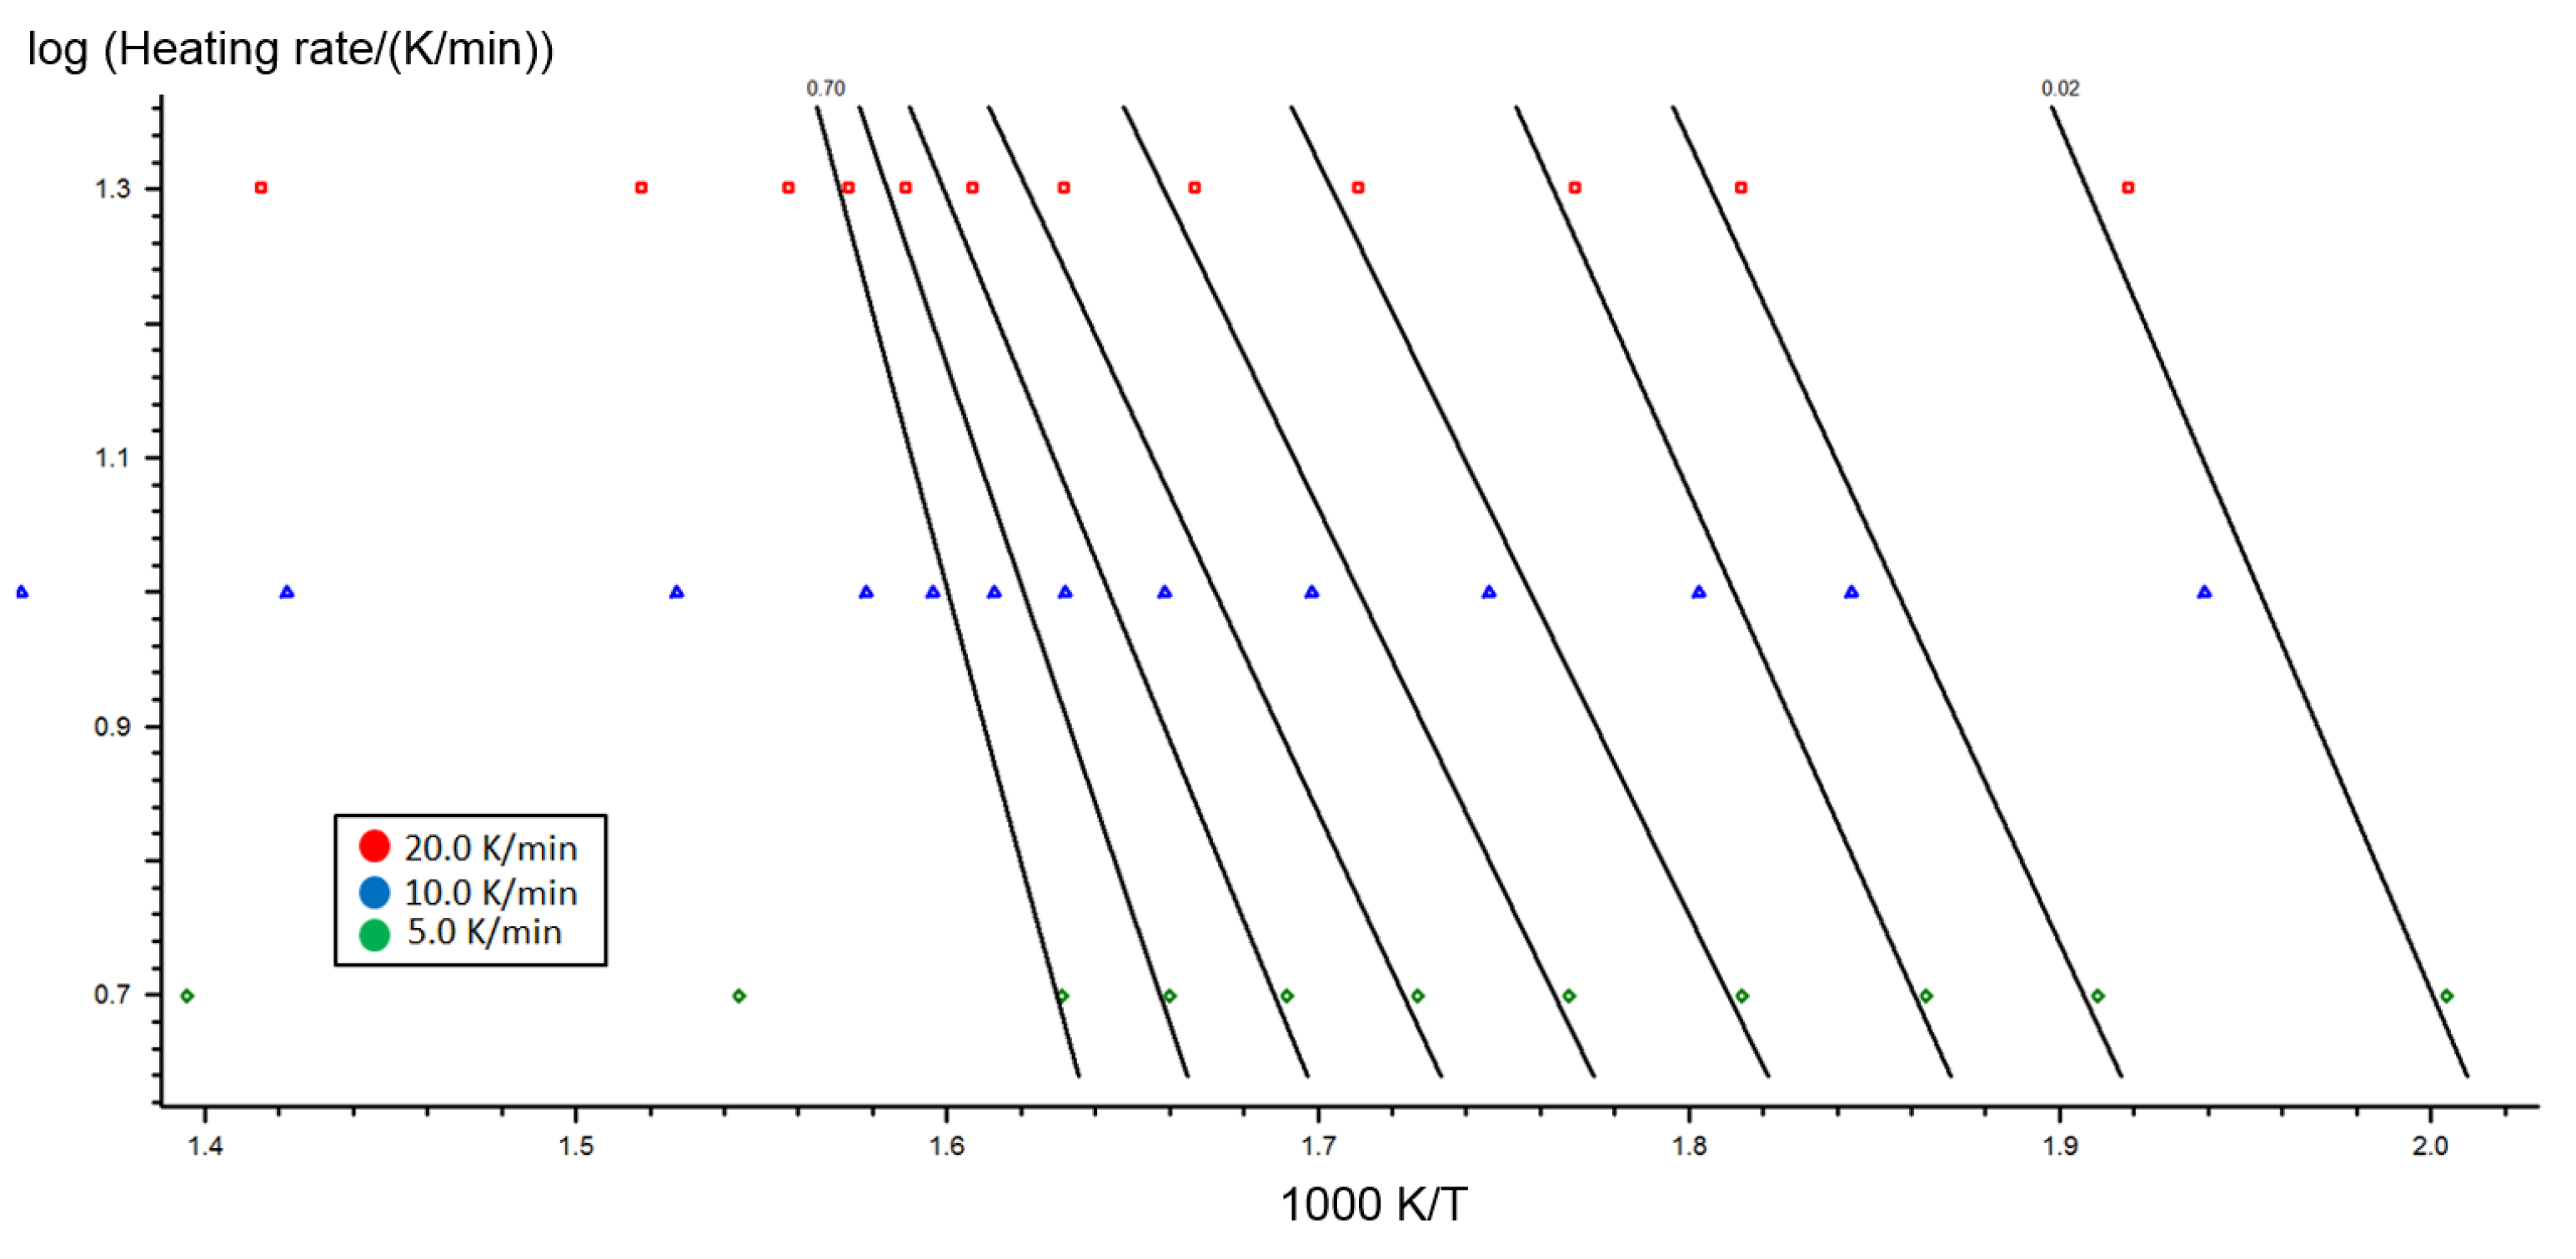
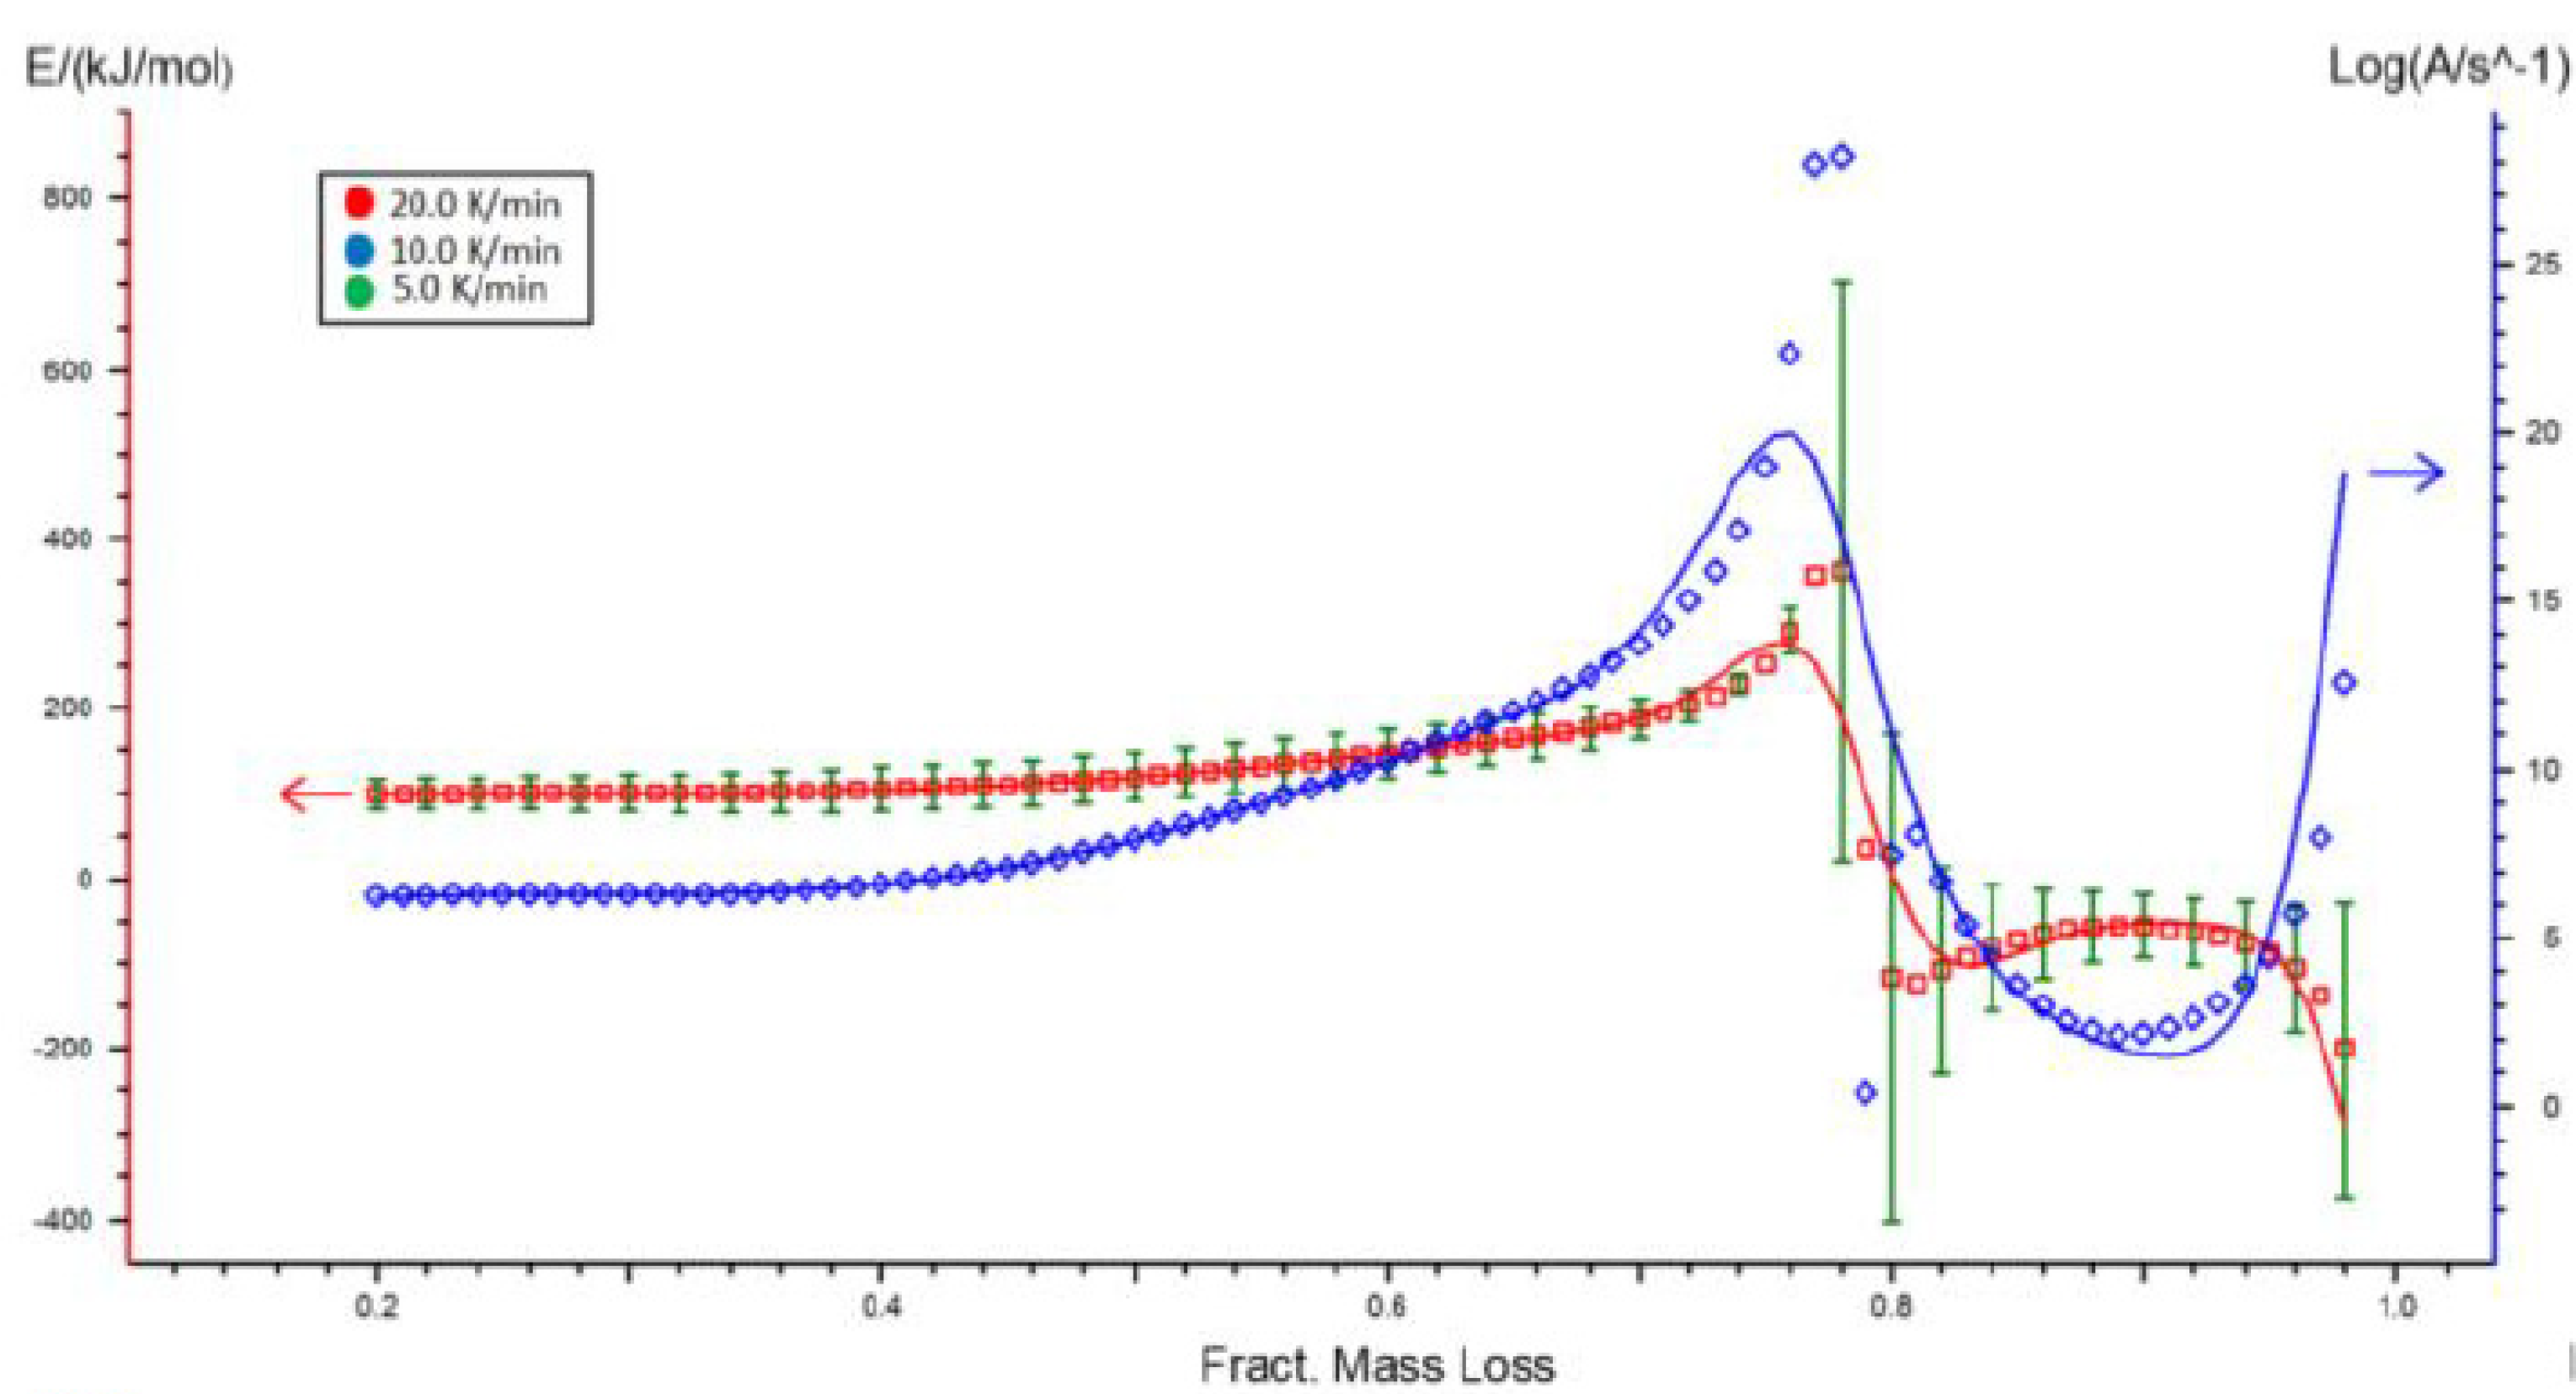
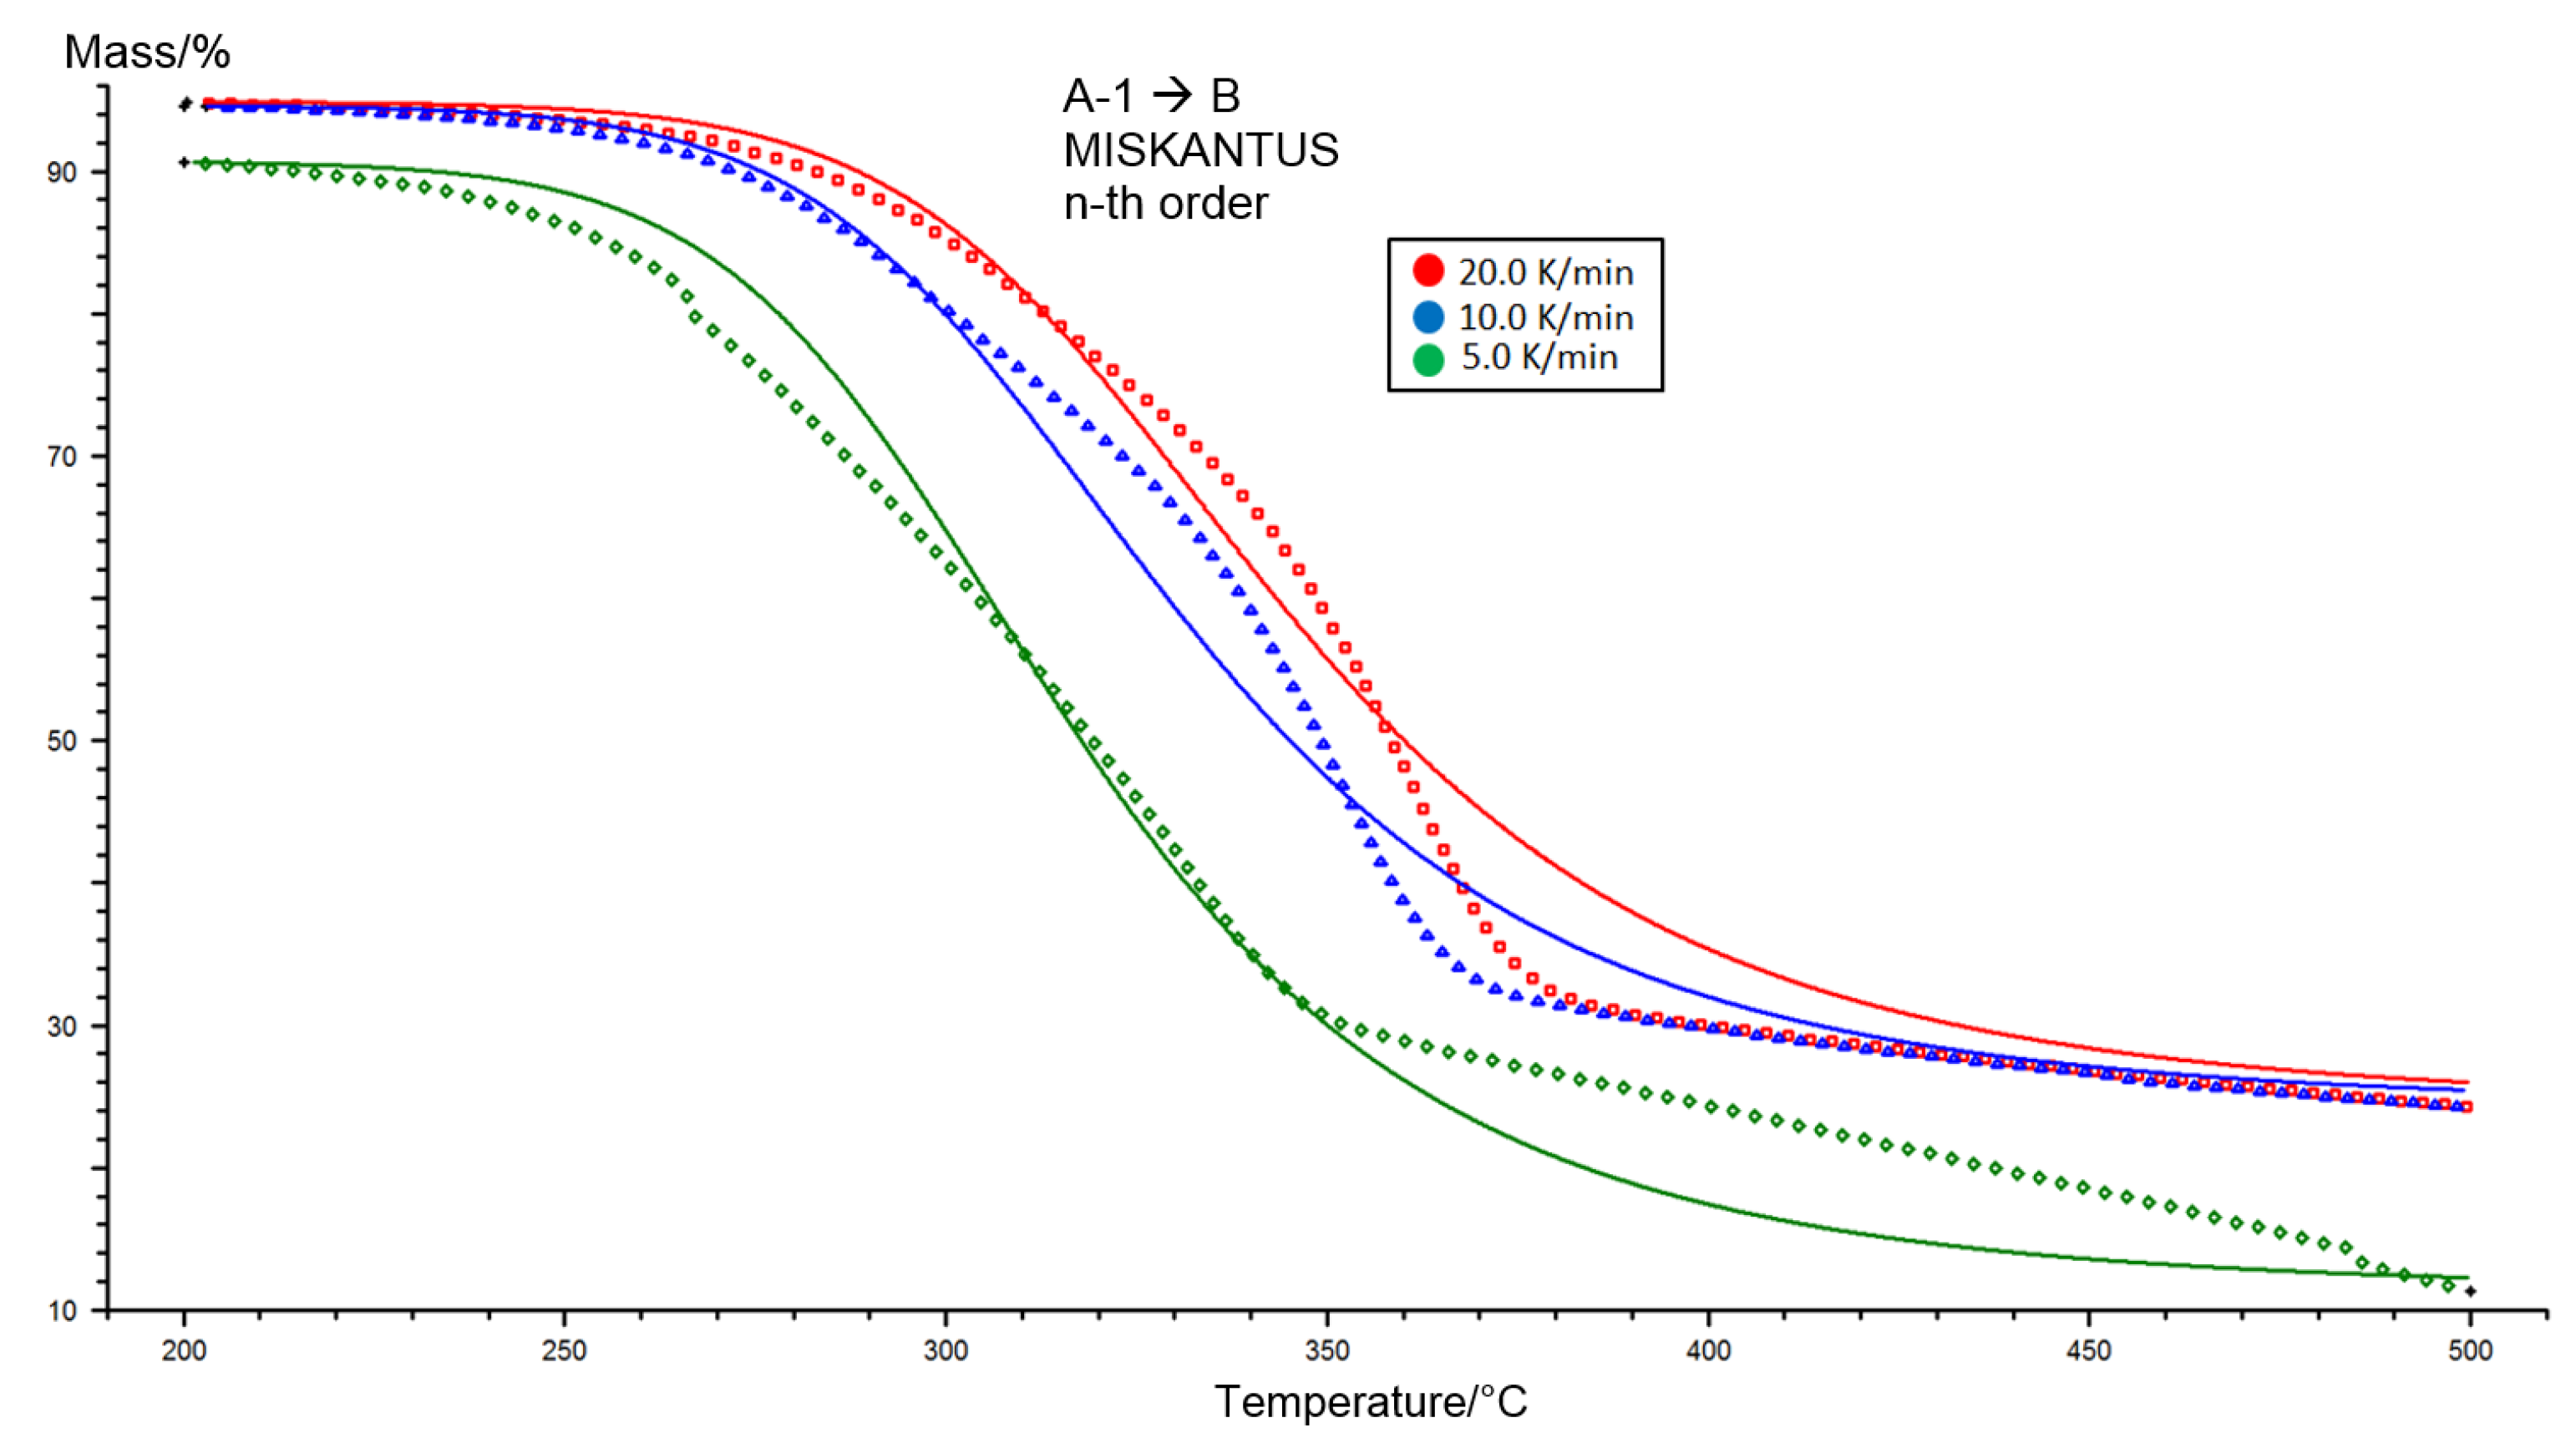
2.2. Kinetic Analysis of Miscanthus Torrefaction Process
3. Discussion
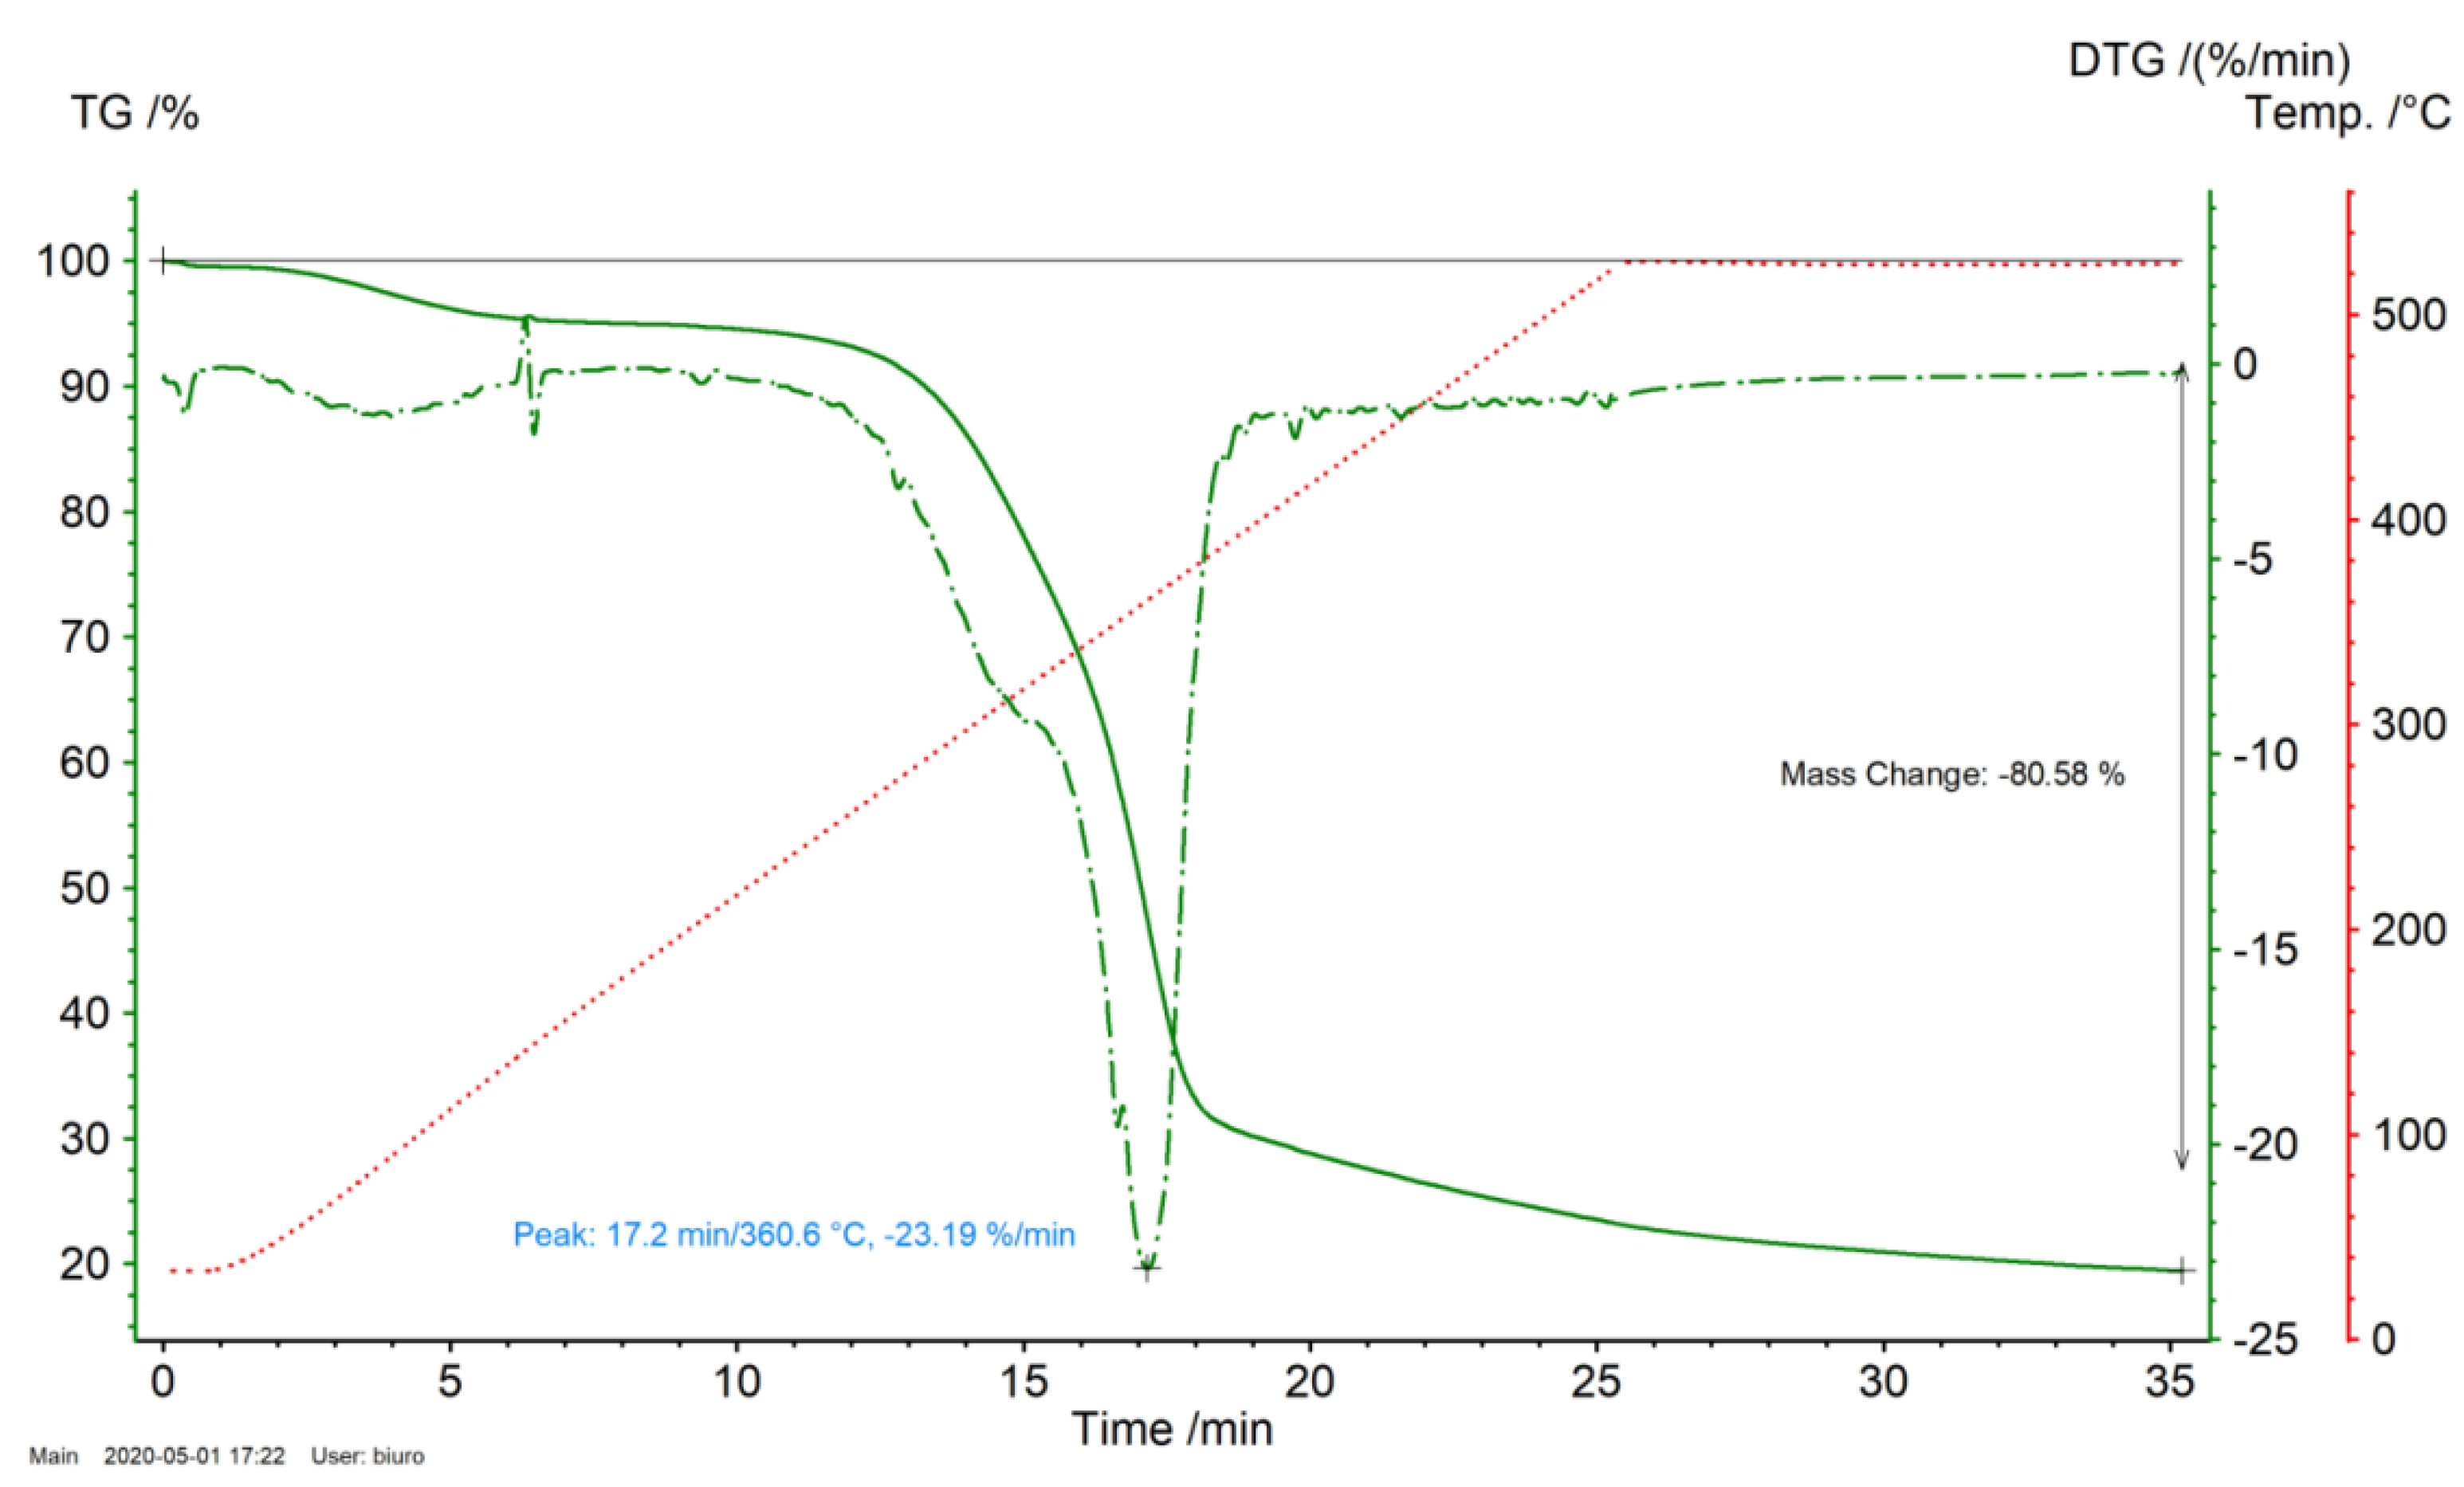
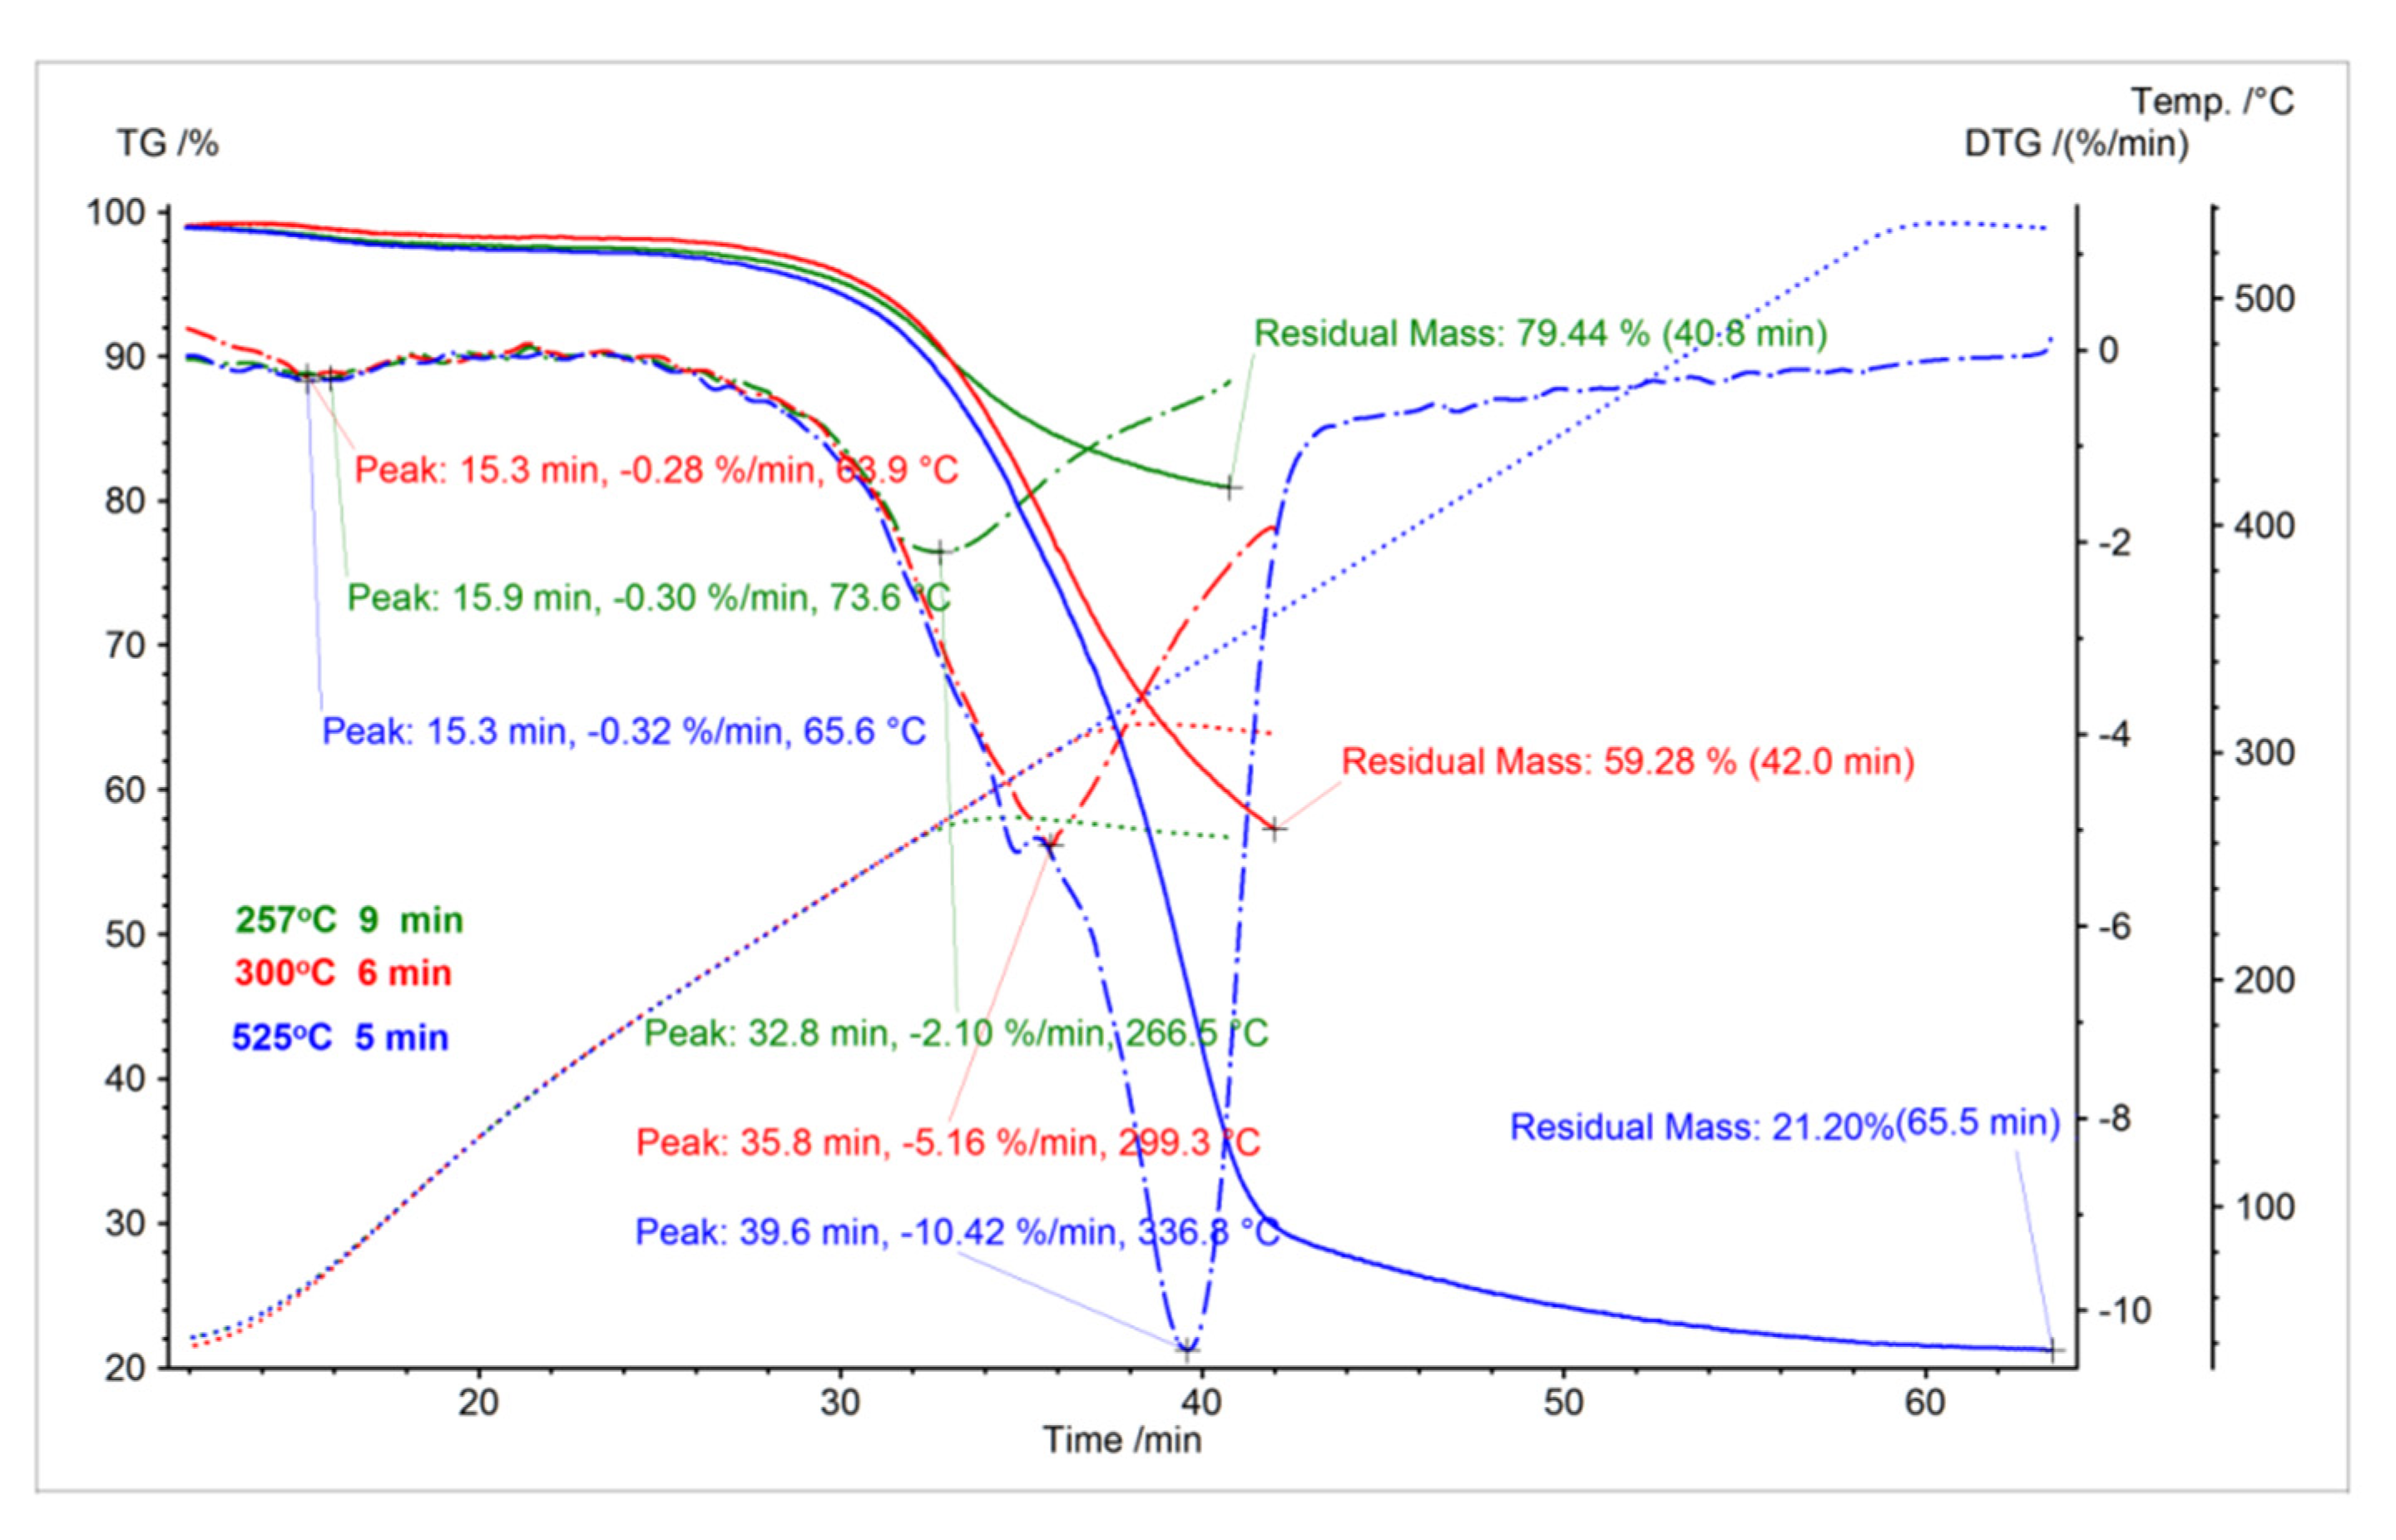
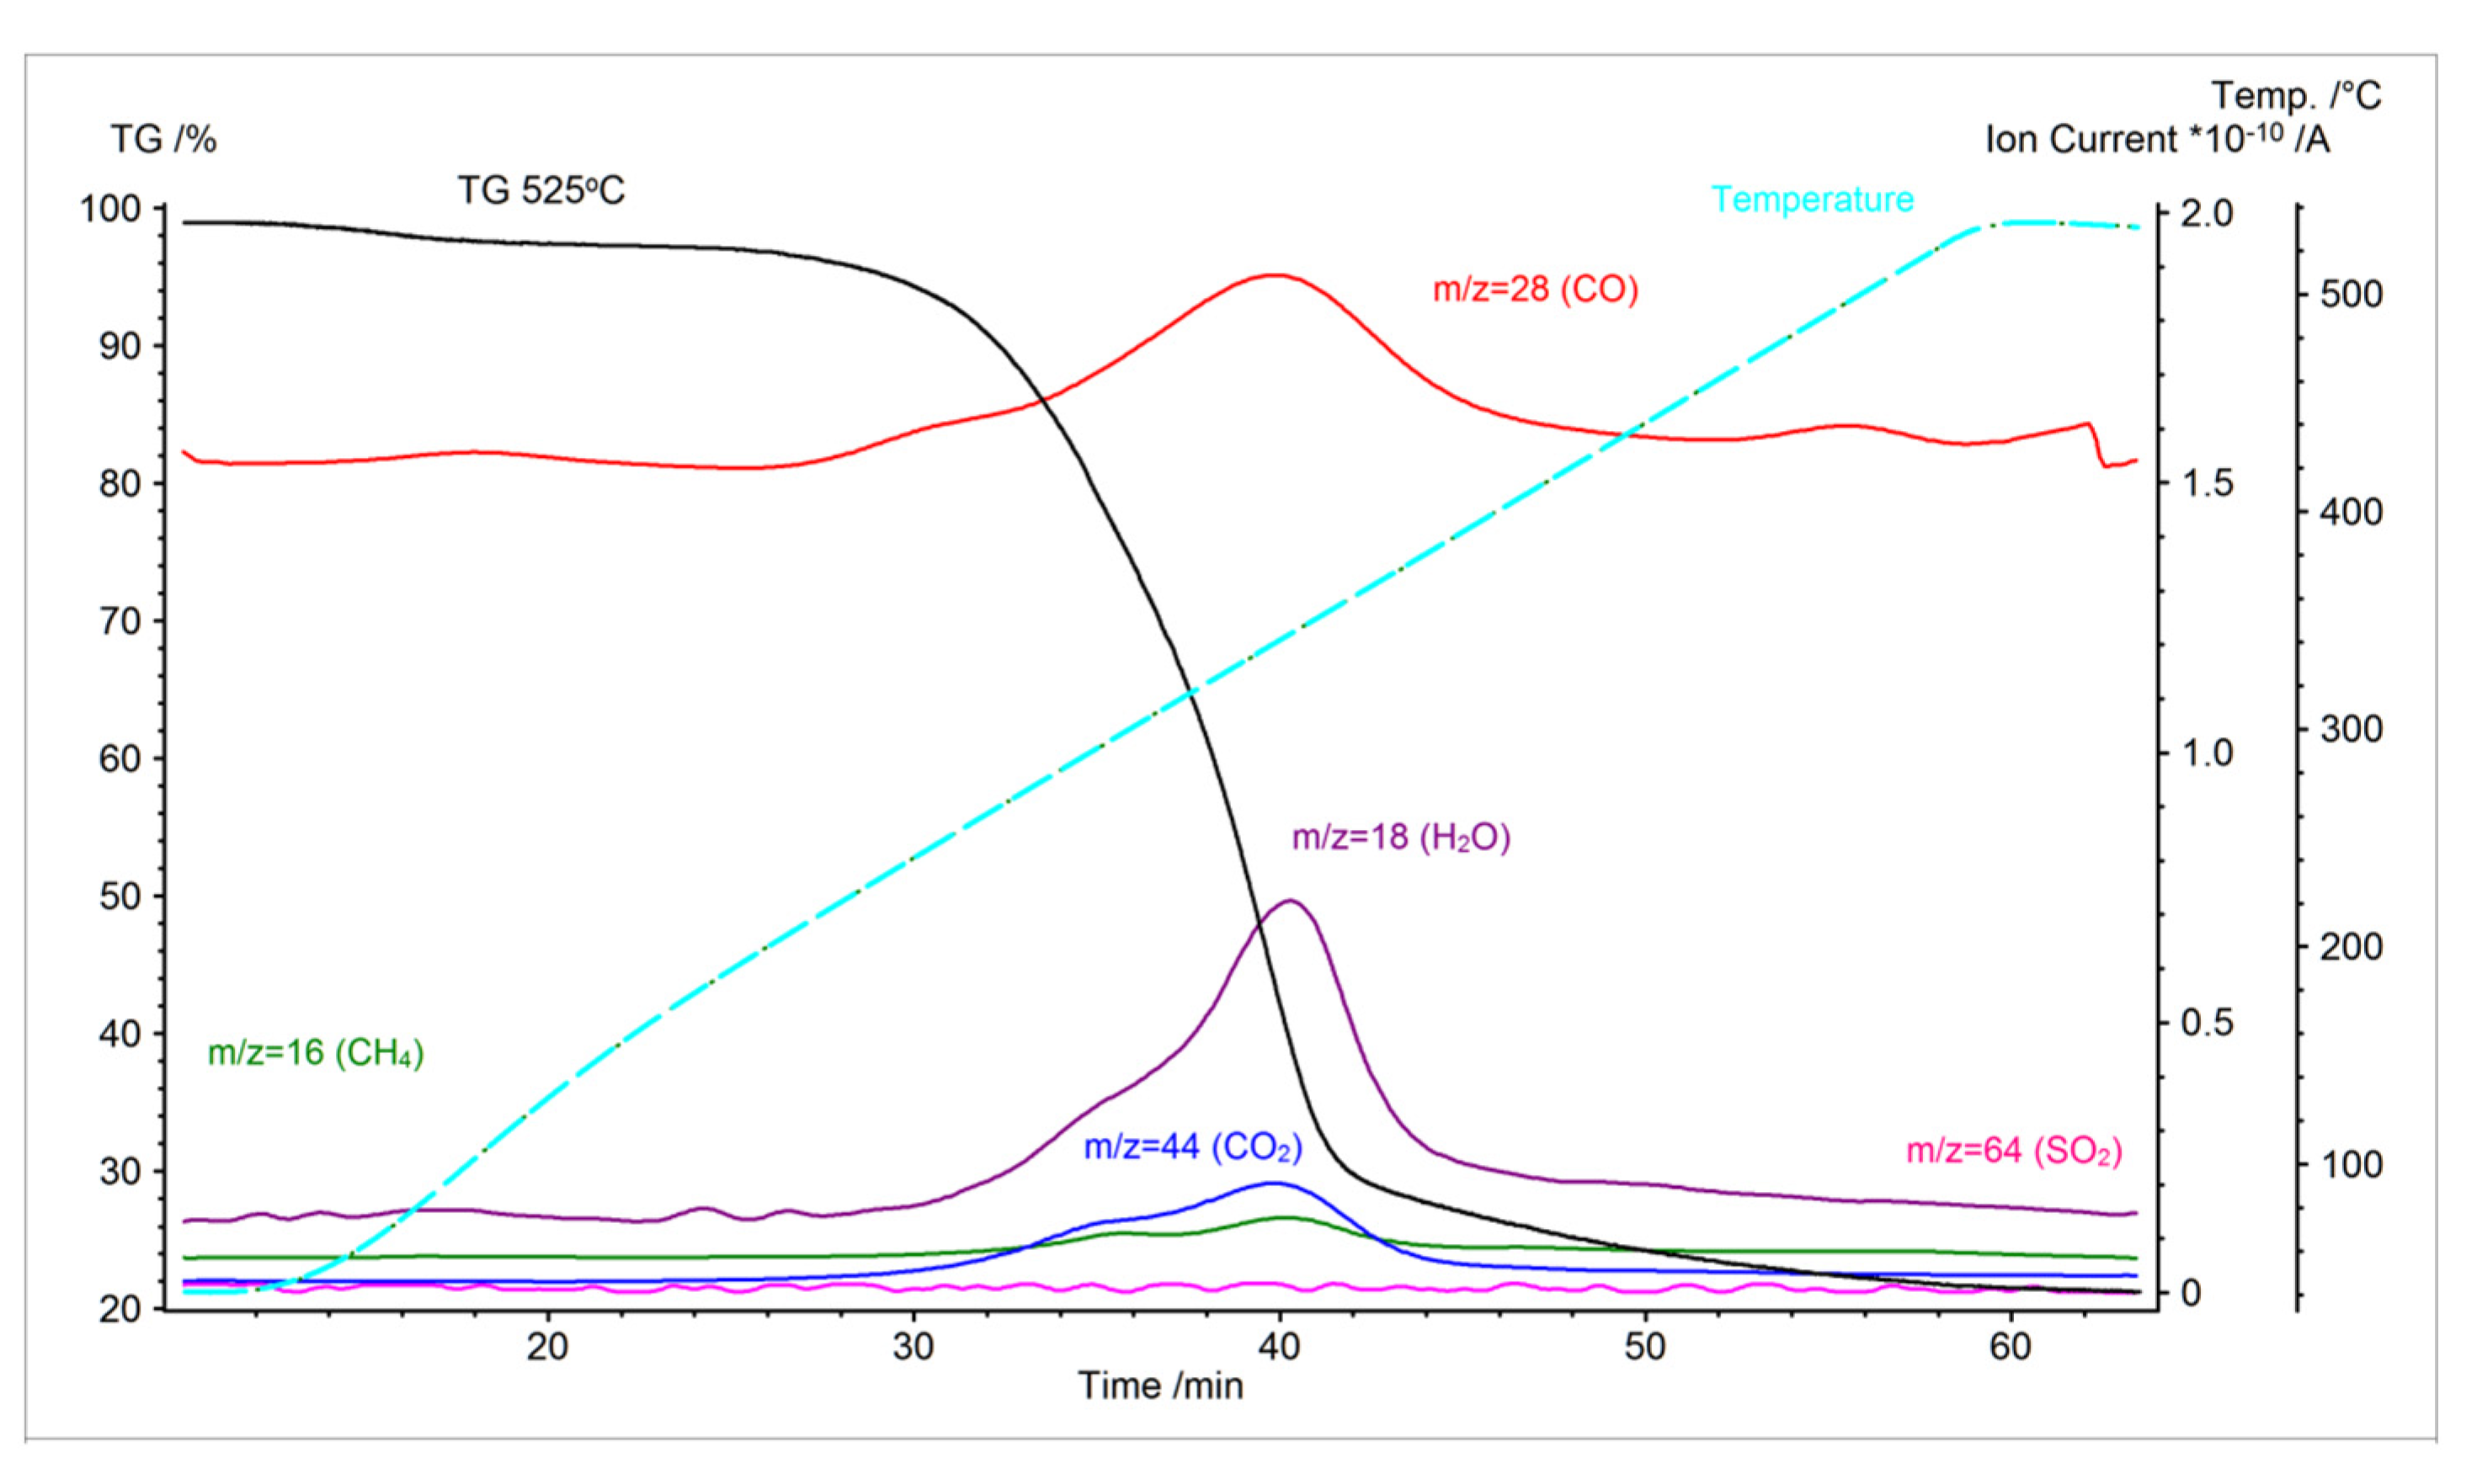
3.1. TGA Analysis
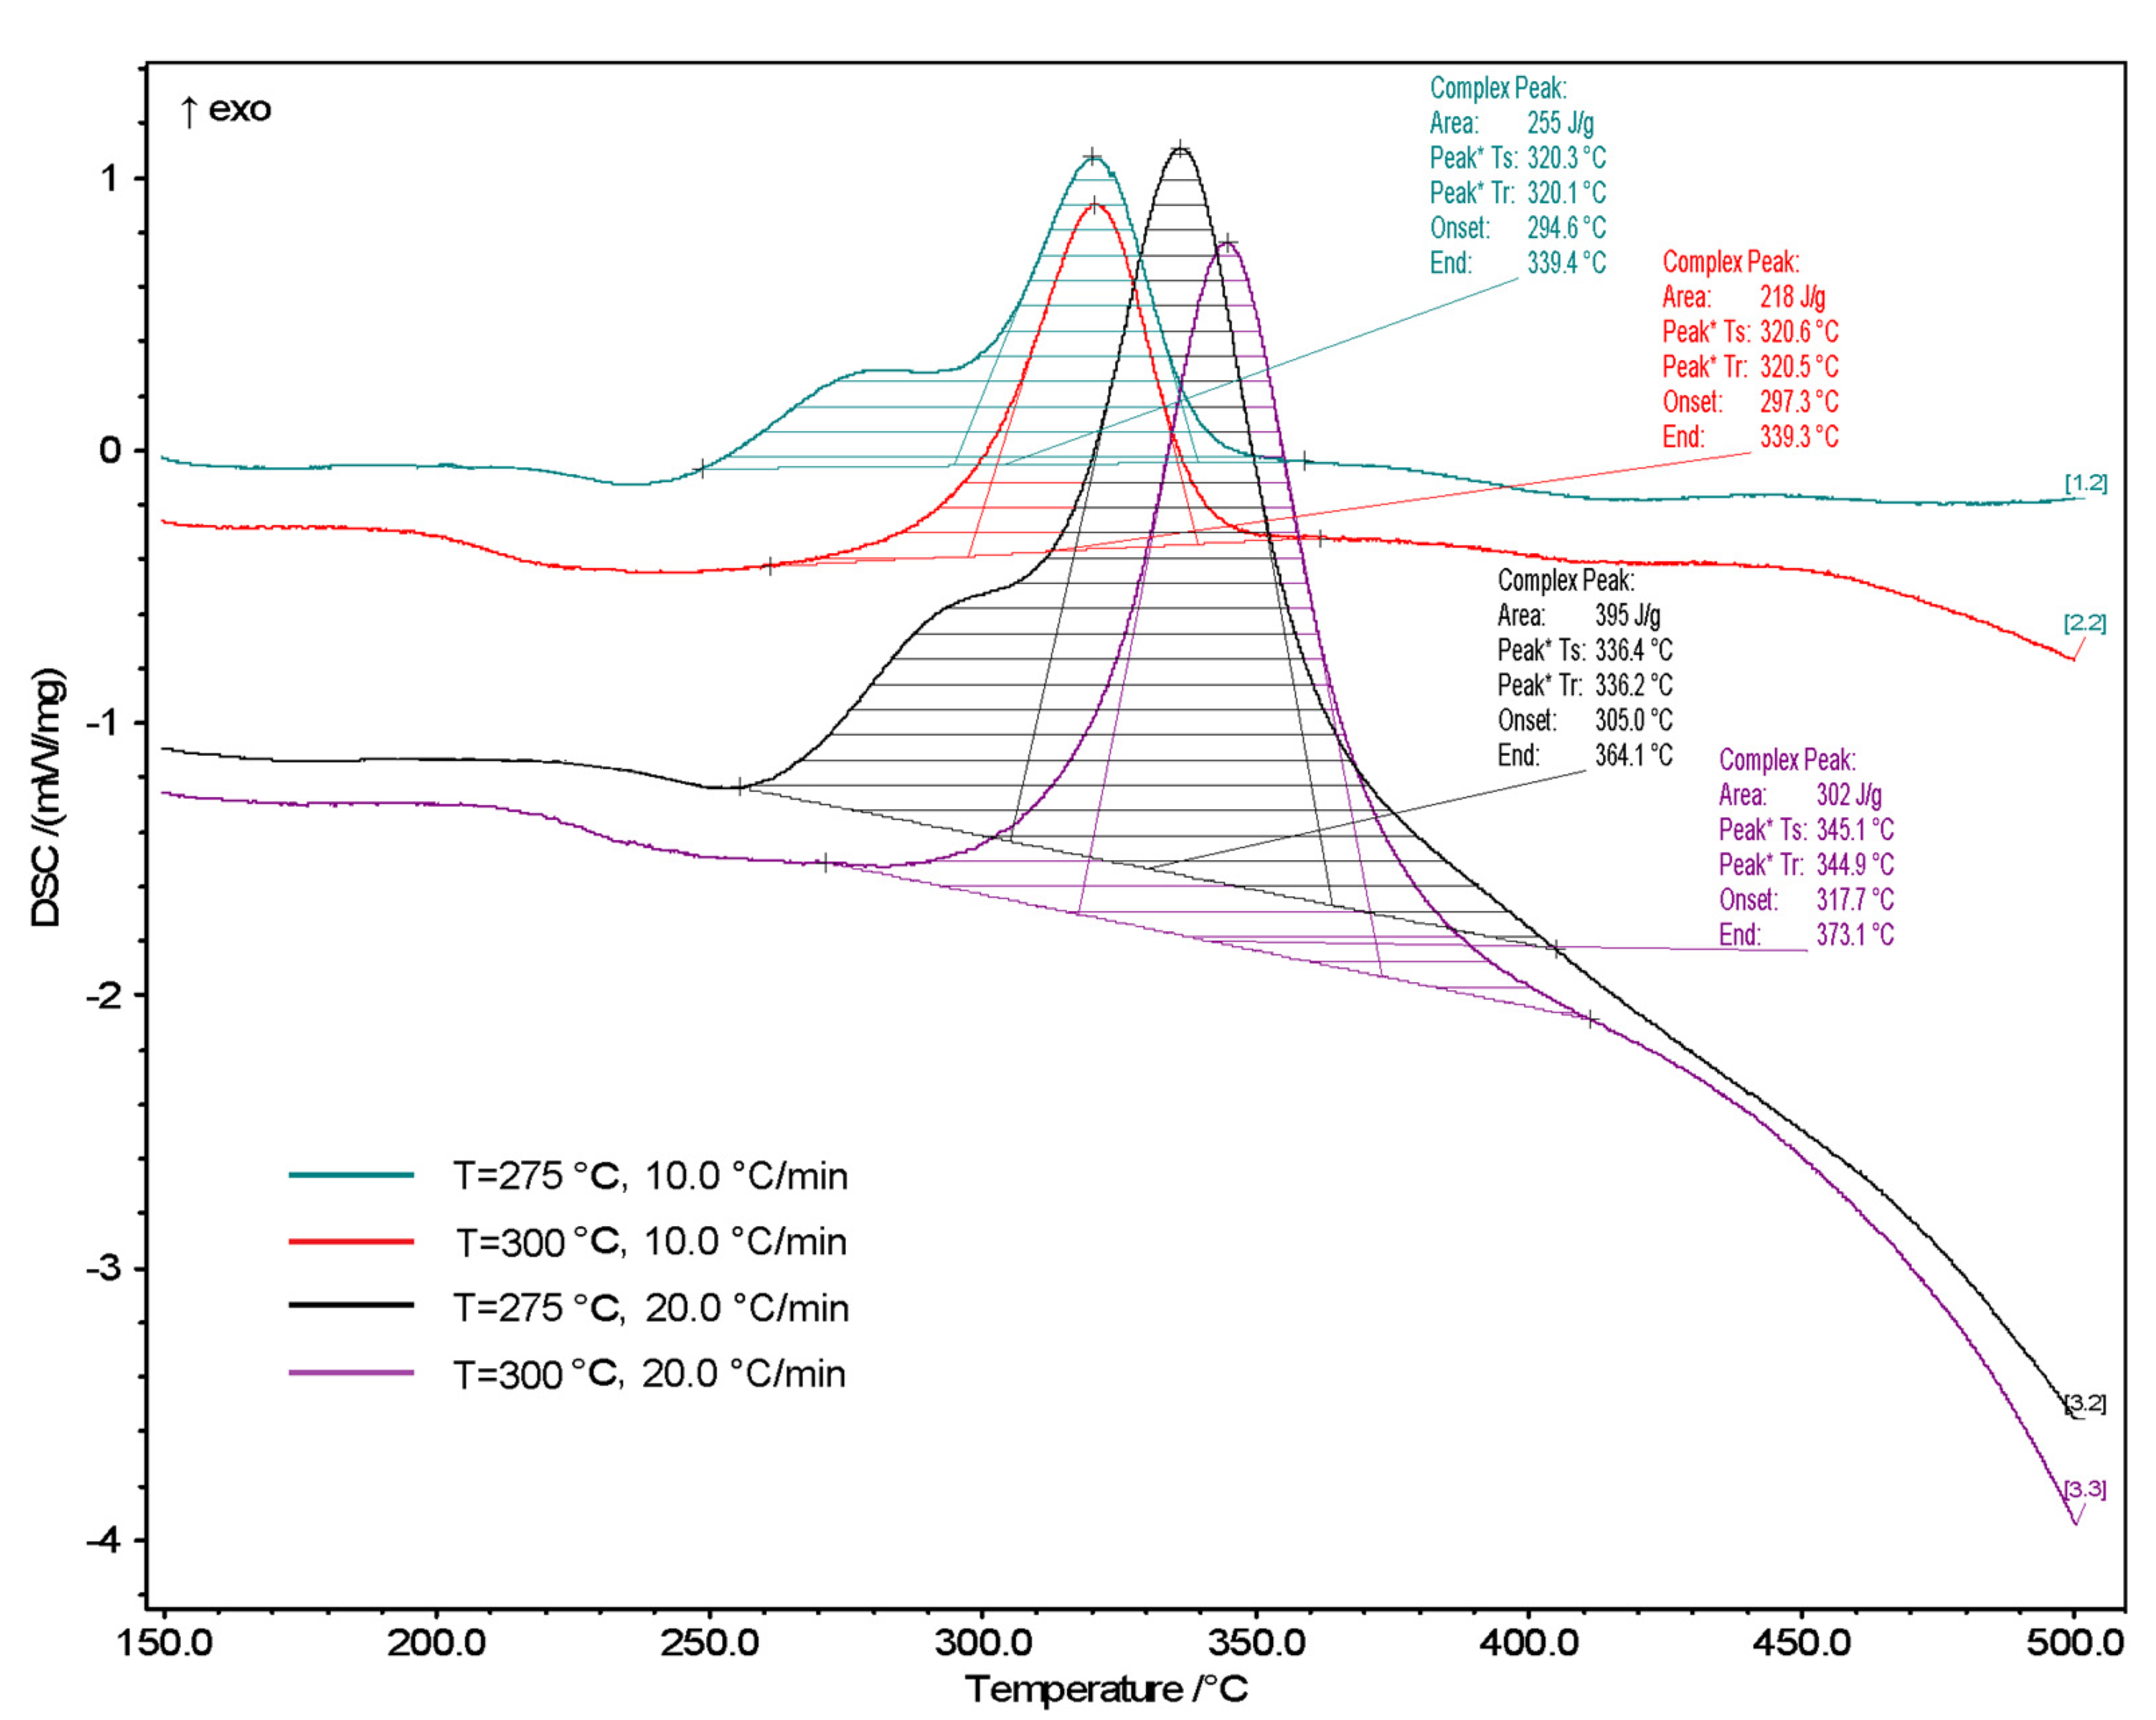
3.2. DSC Analysis
3.3. C, H, N, O, S Analysis
3.4. Energy Yield, Mass Yield, Volatile Matter, Ash Content, High Heating Value
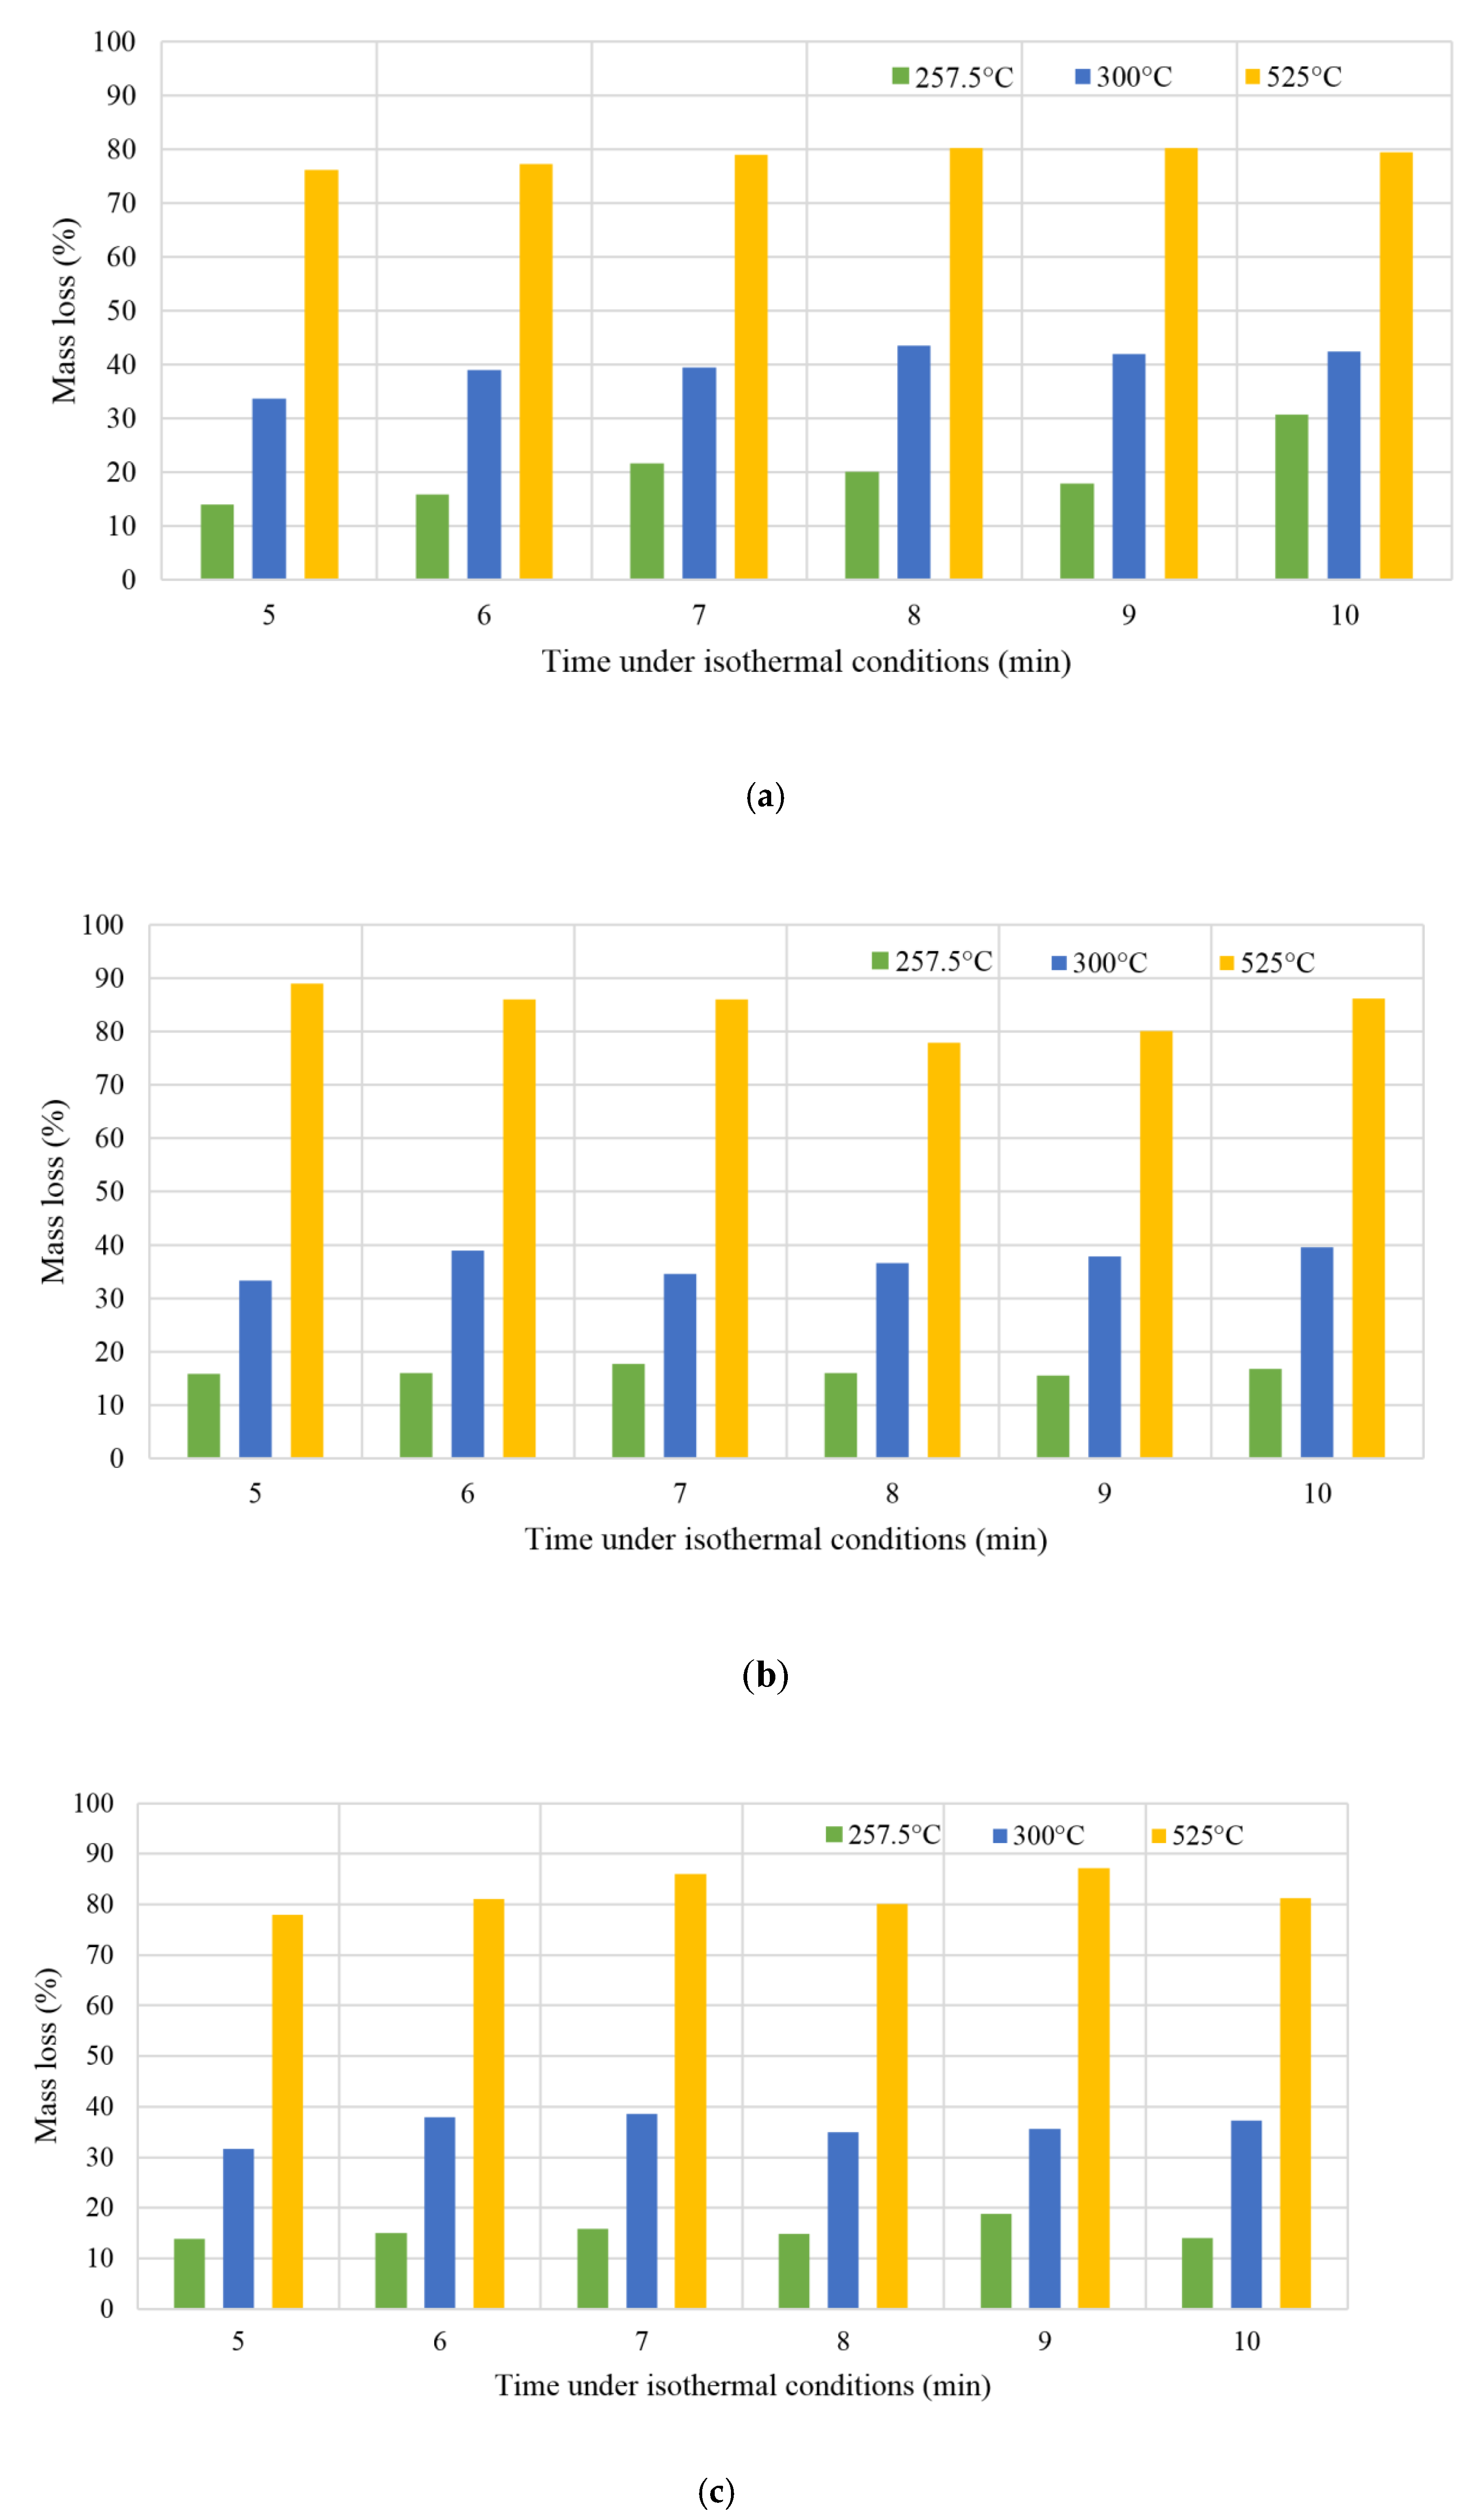
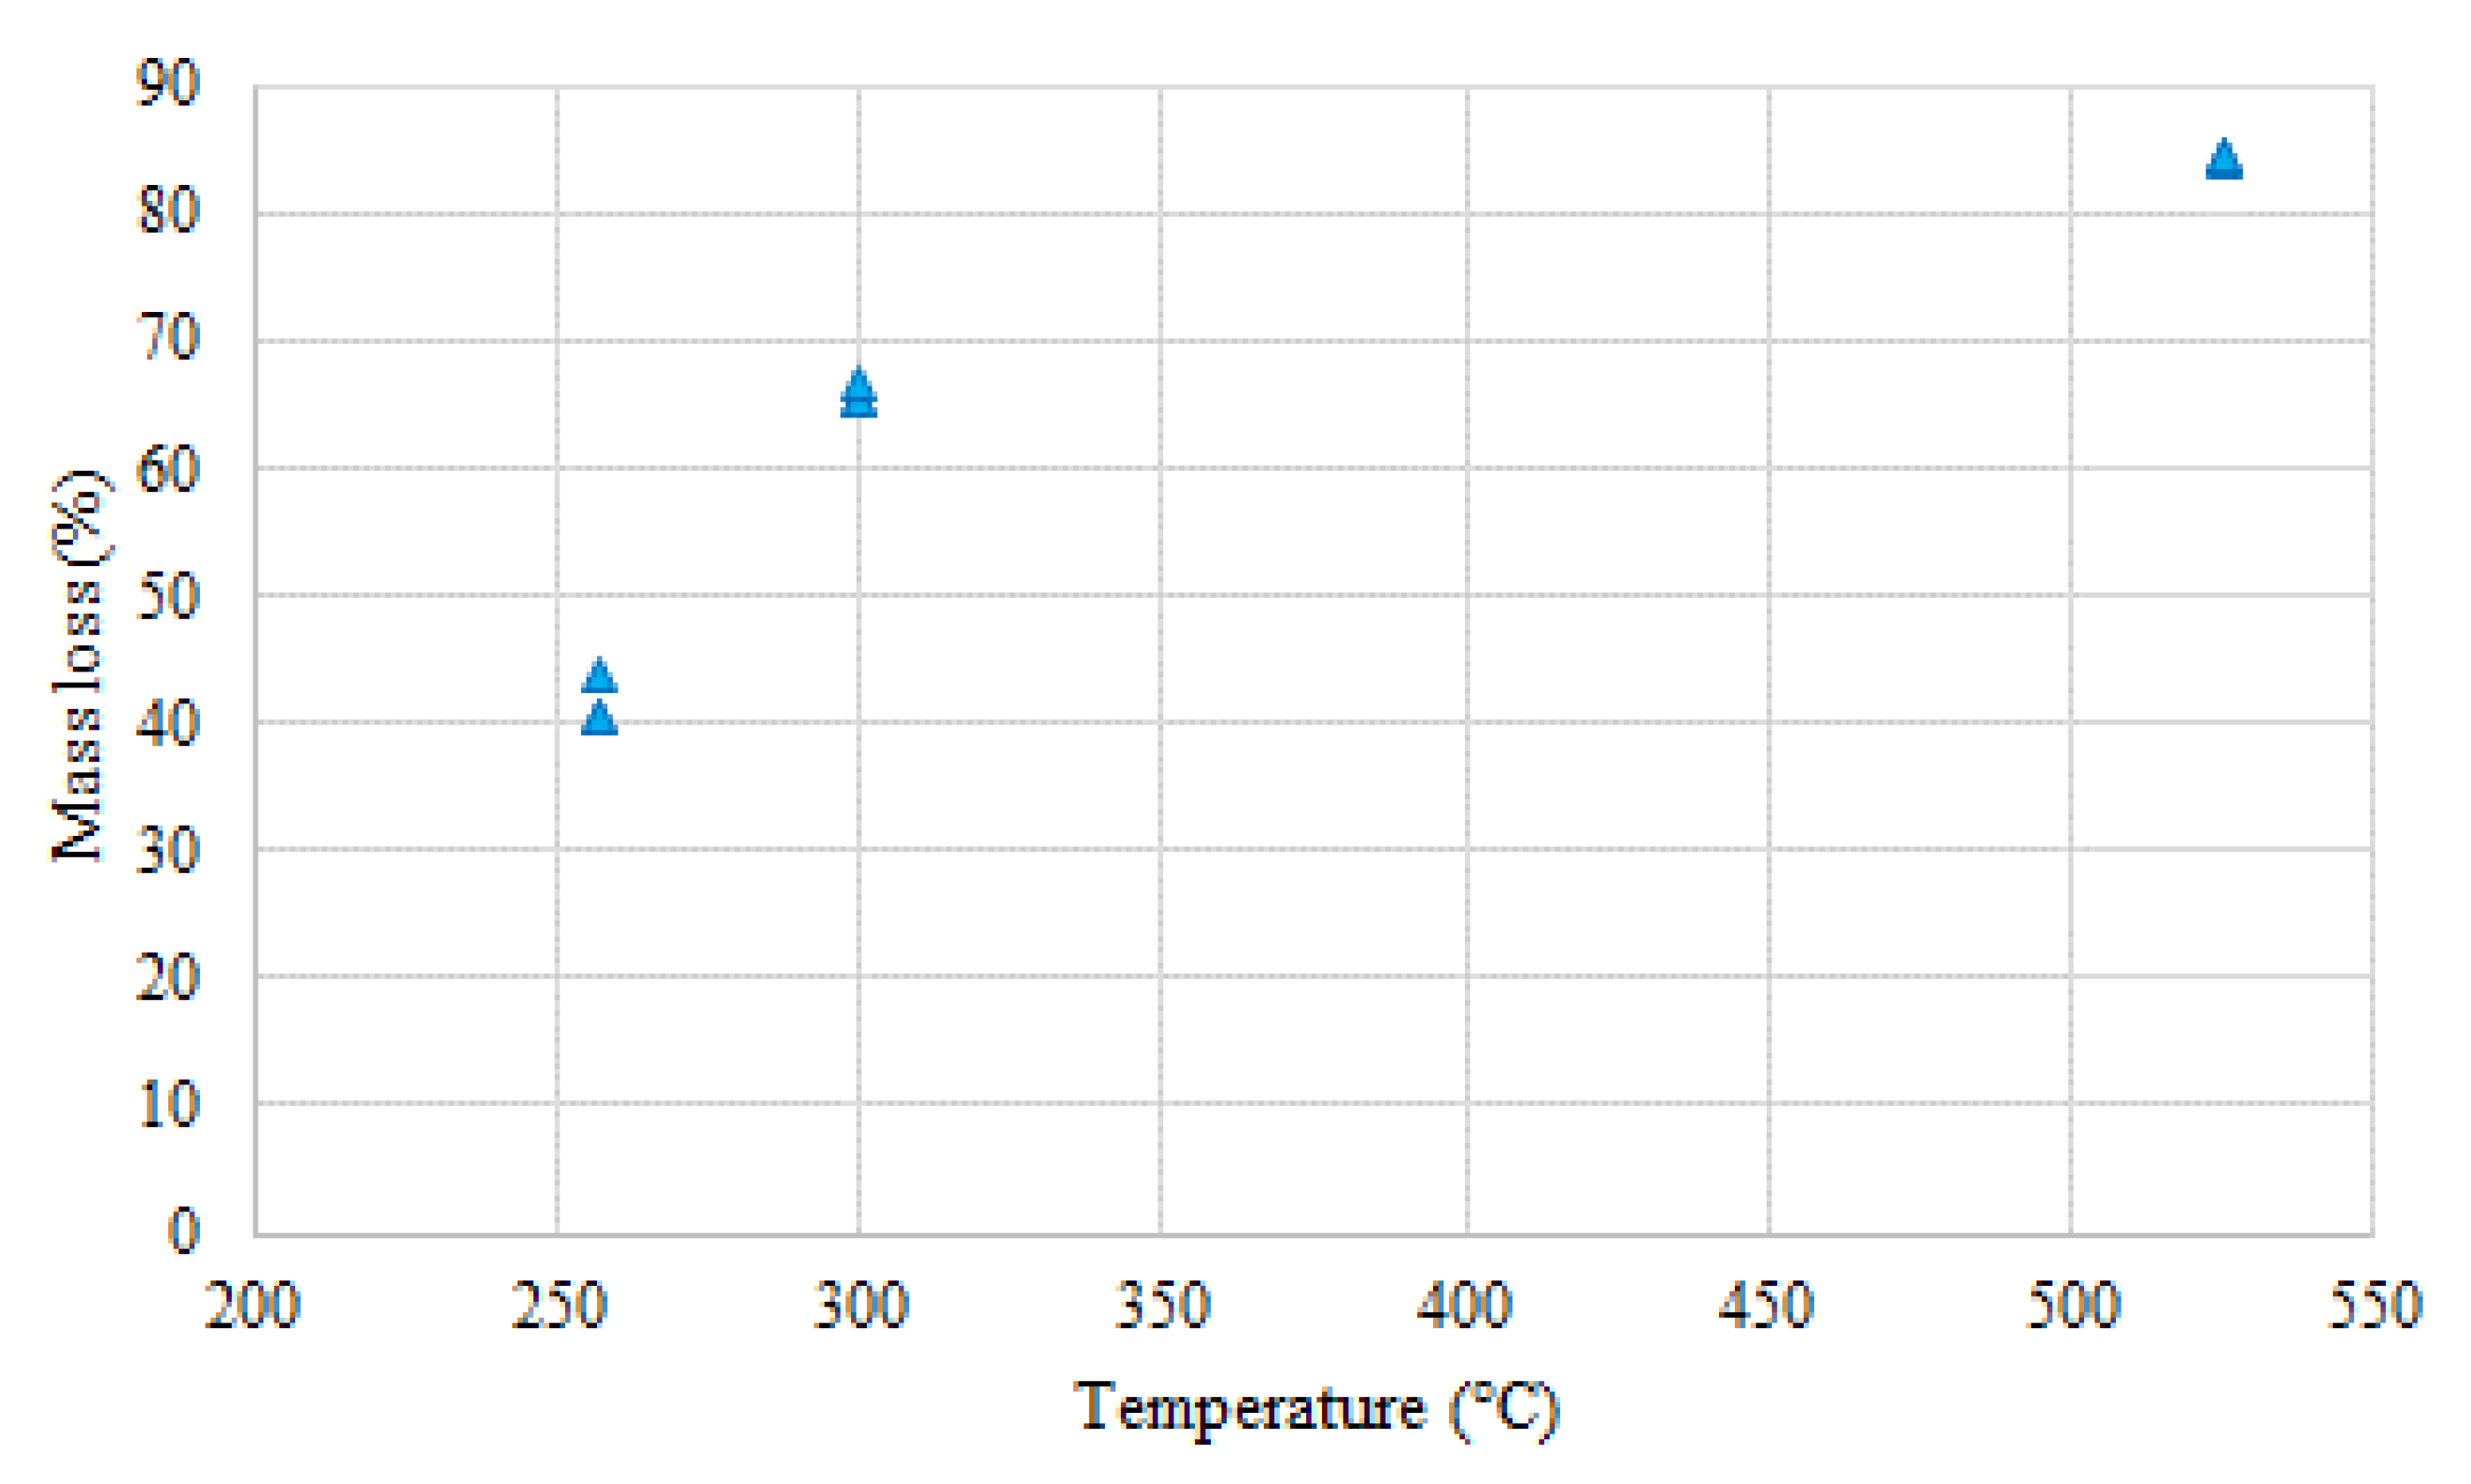
3.5. Biomass Torrefaction Residence Time and its Effect on the Process
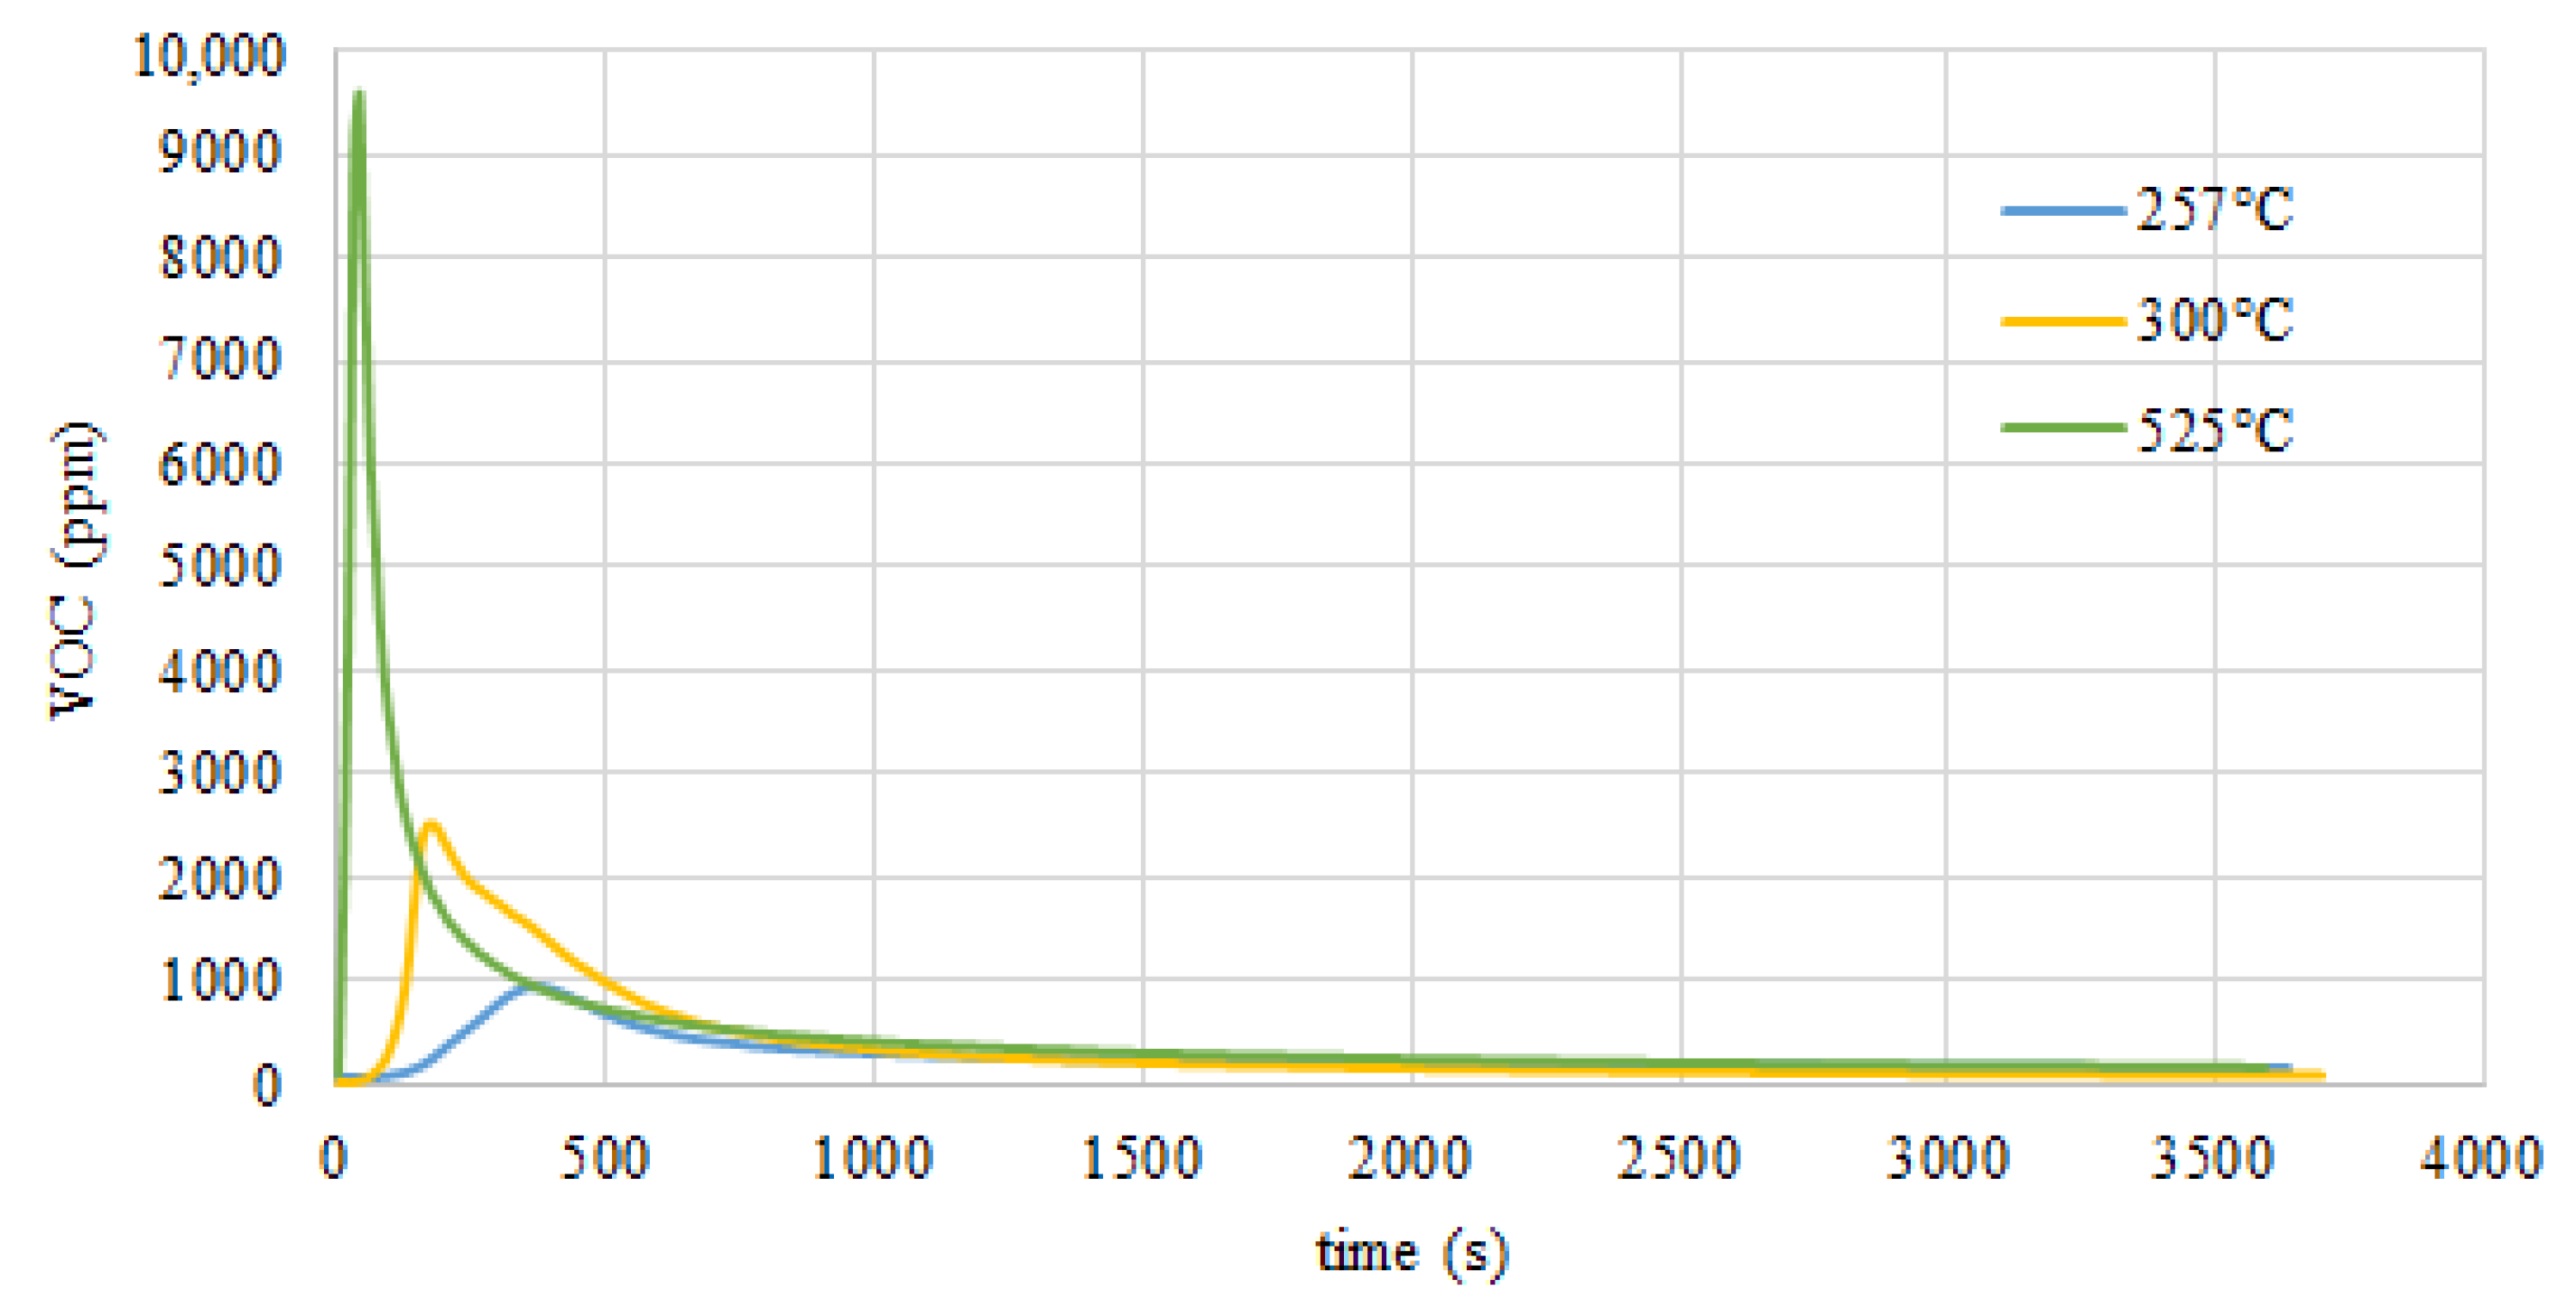
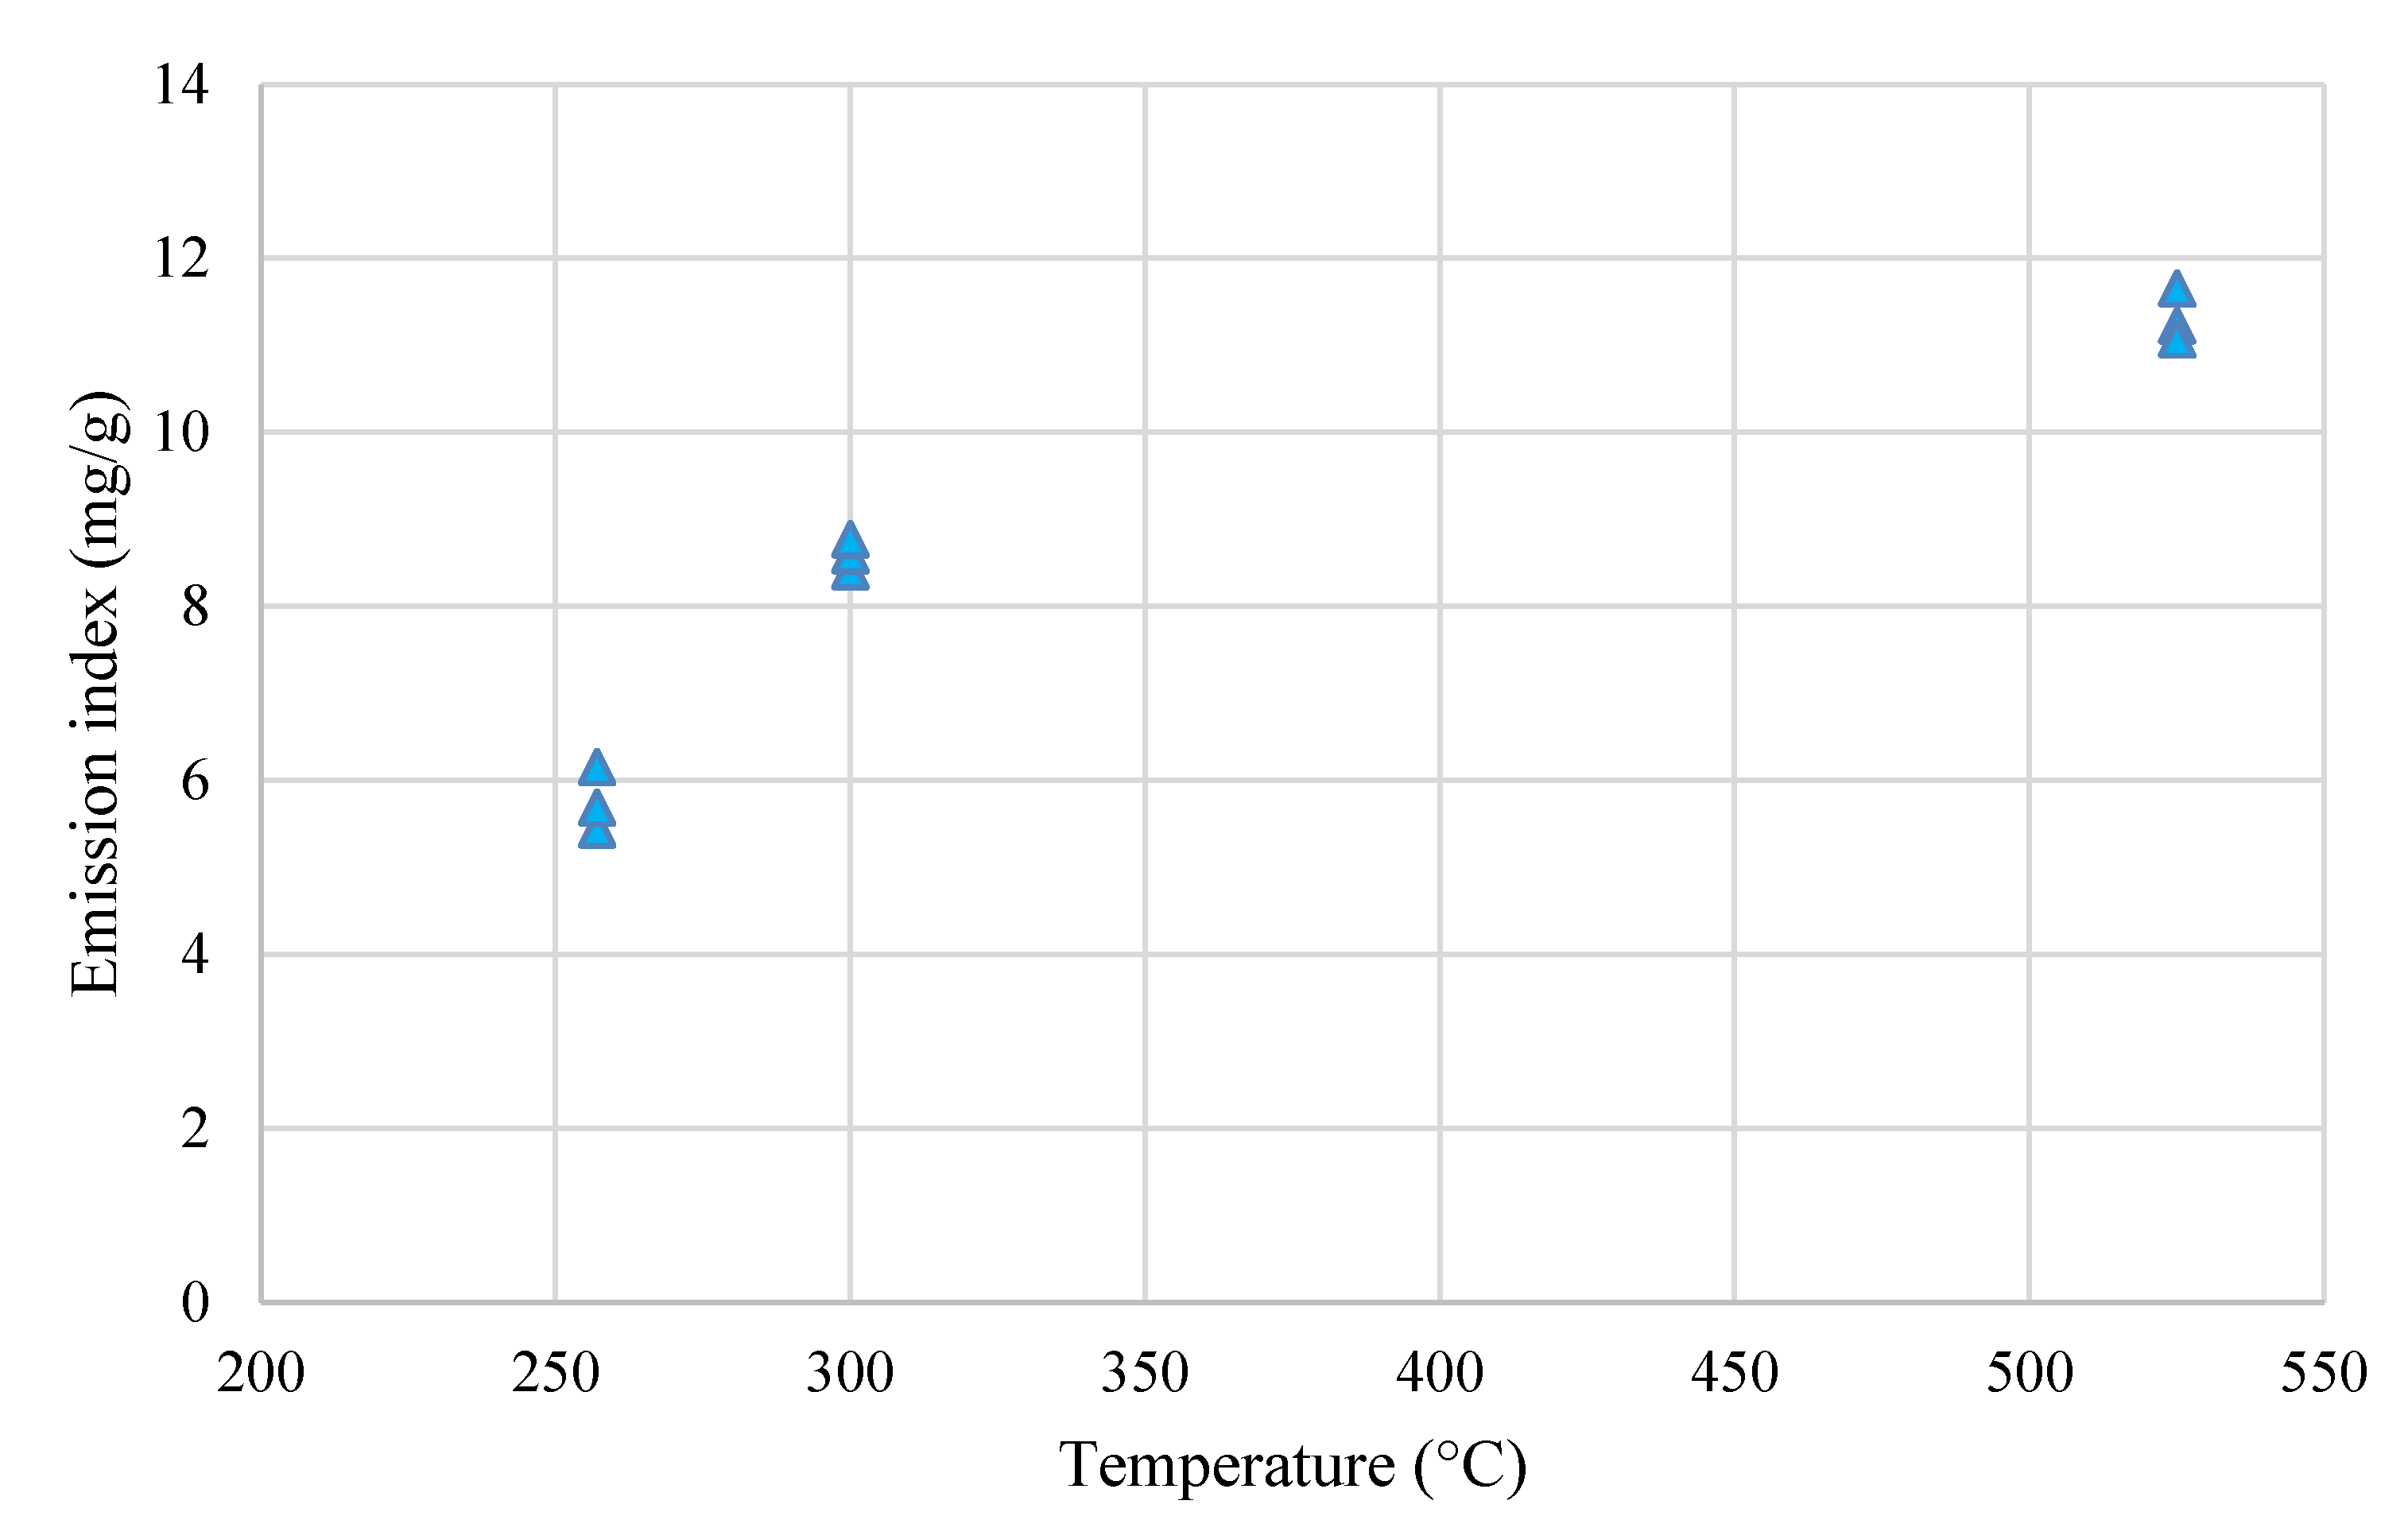
3.6. Volatile Organic Content (VOC) Analysis
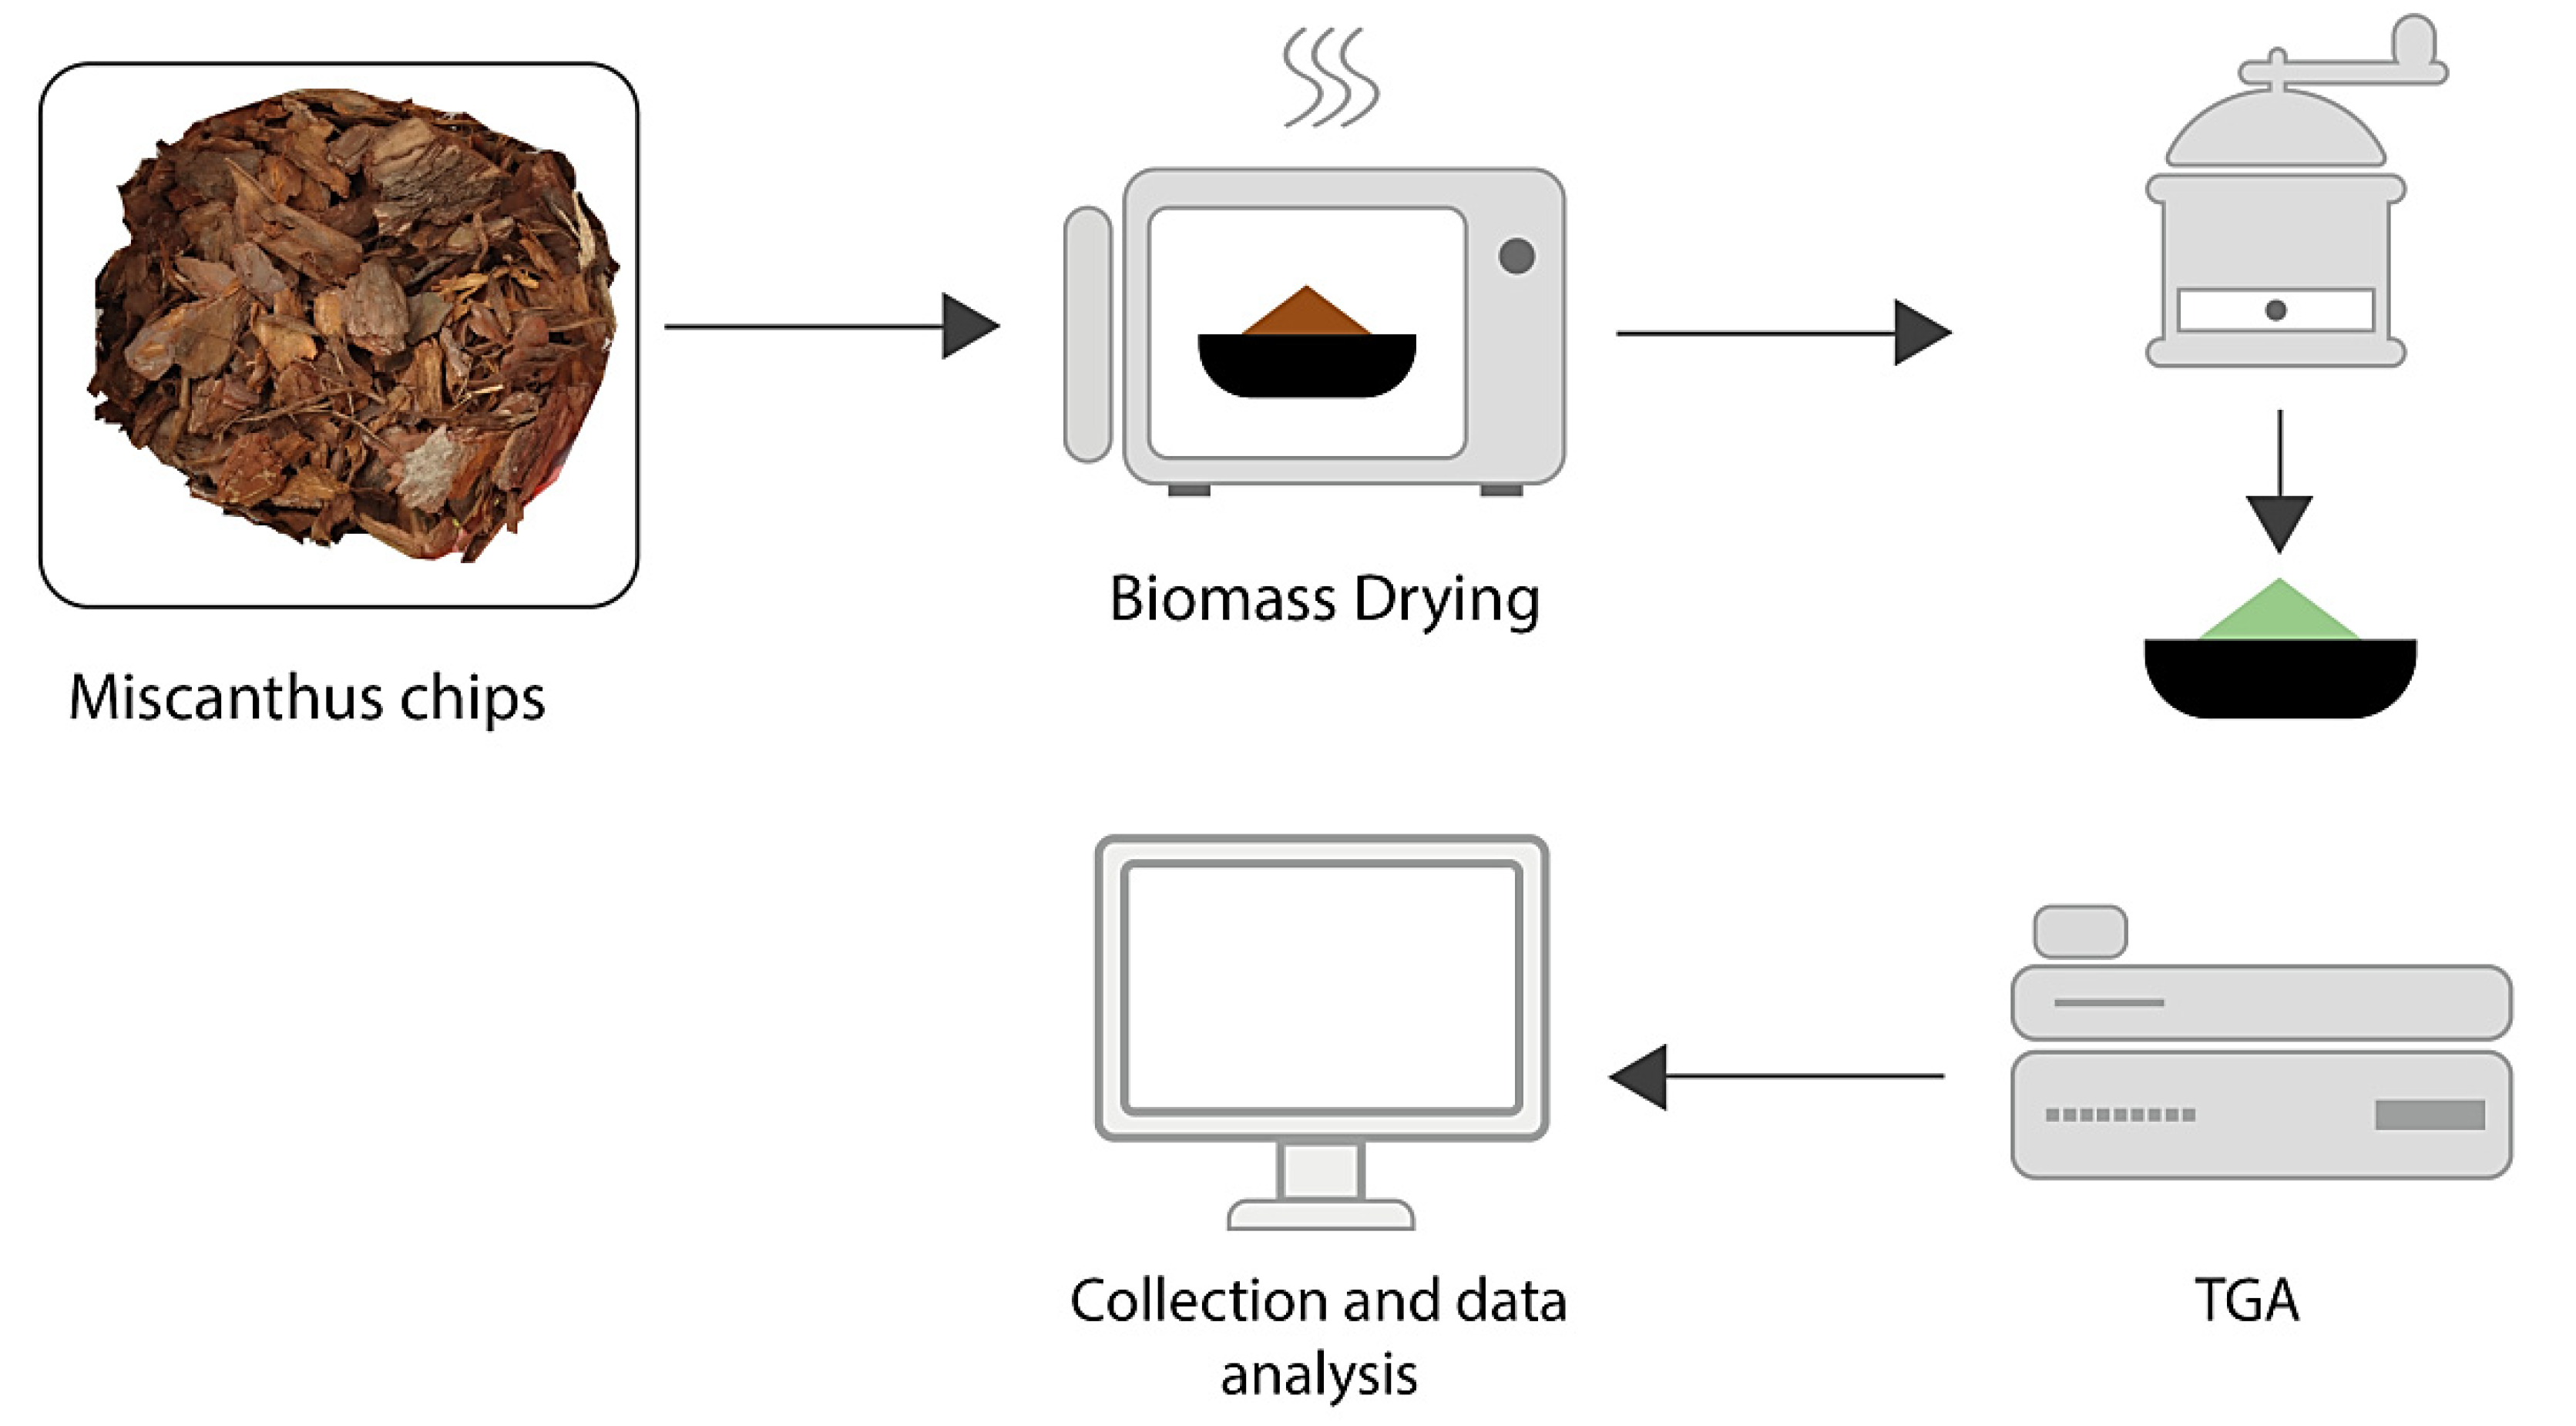
4. Materials and Methods
4.1. Drying and Pelletizing Methods
4.2. TGA Method
4.3. TGA, DSC, Kinetic Analysis, VOC, and SEM Analysis
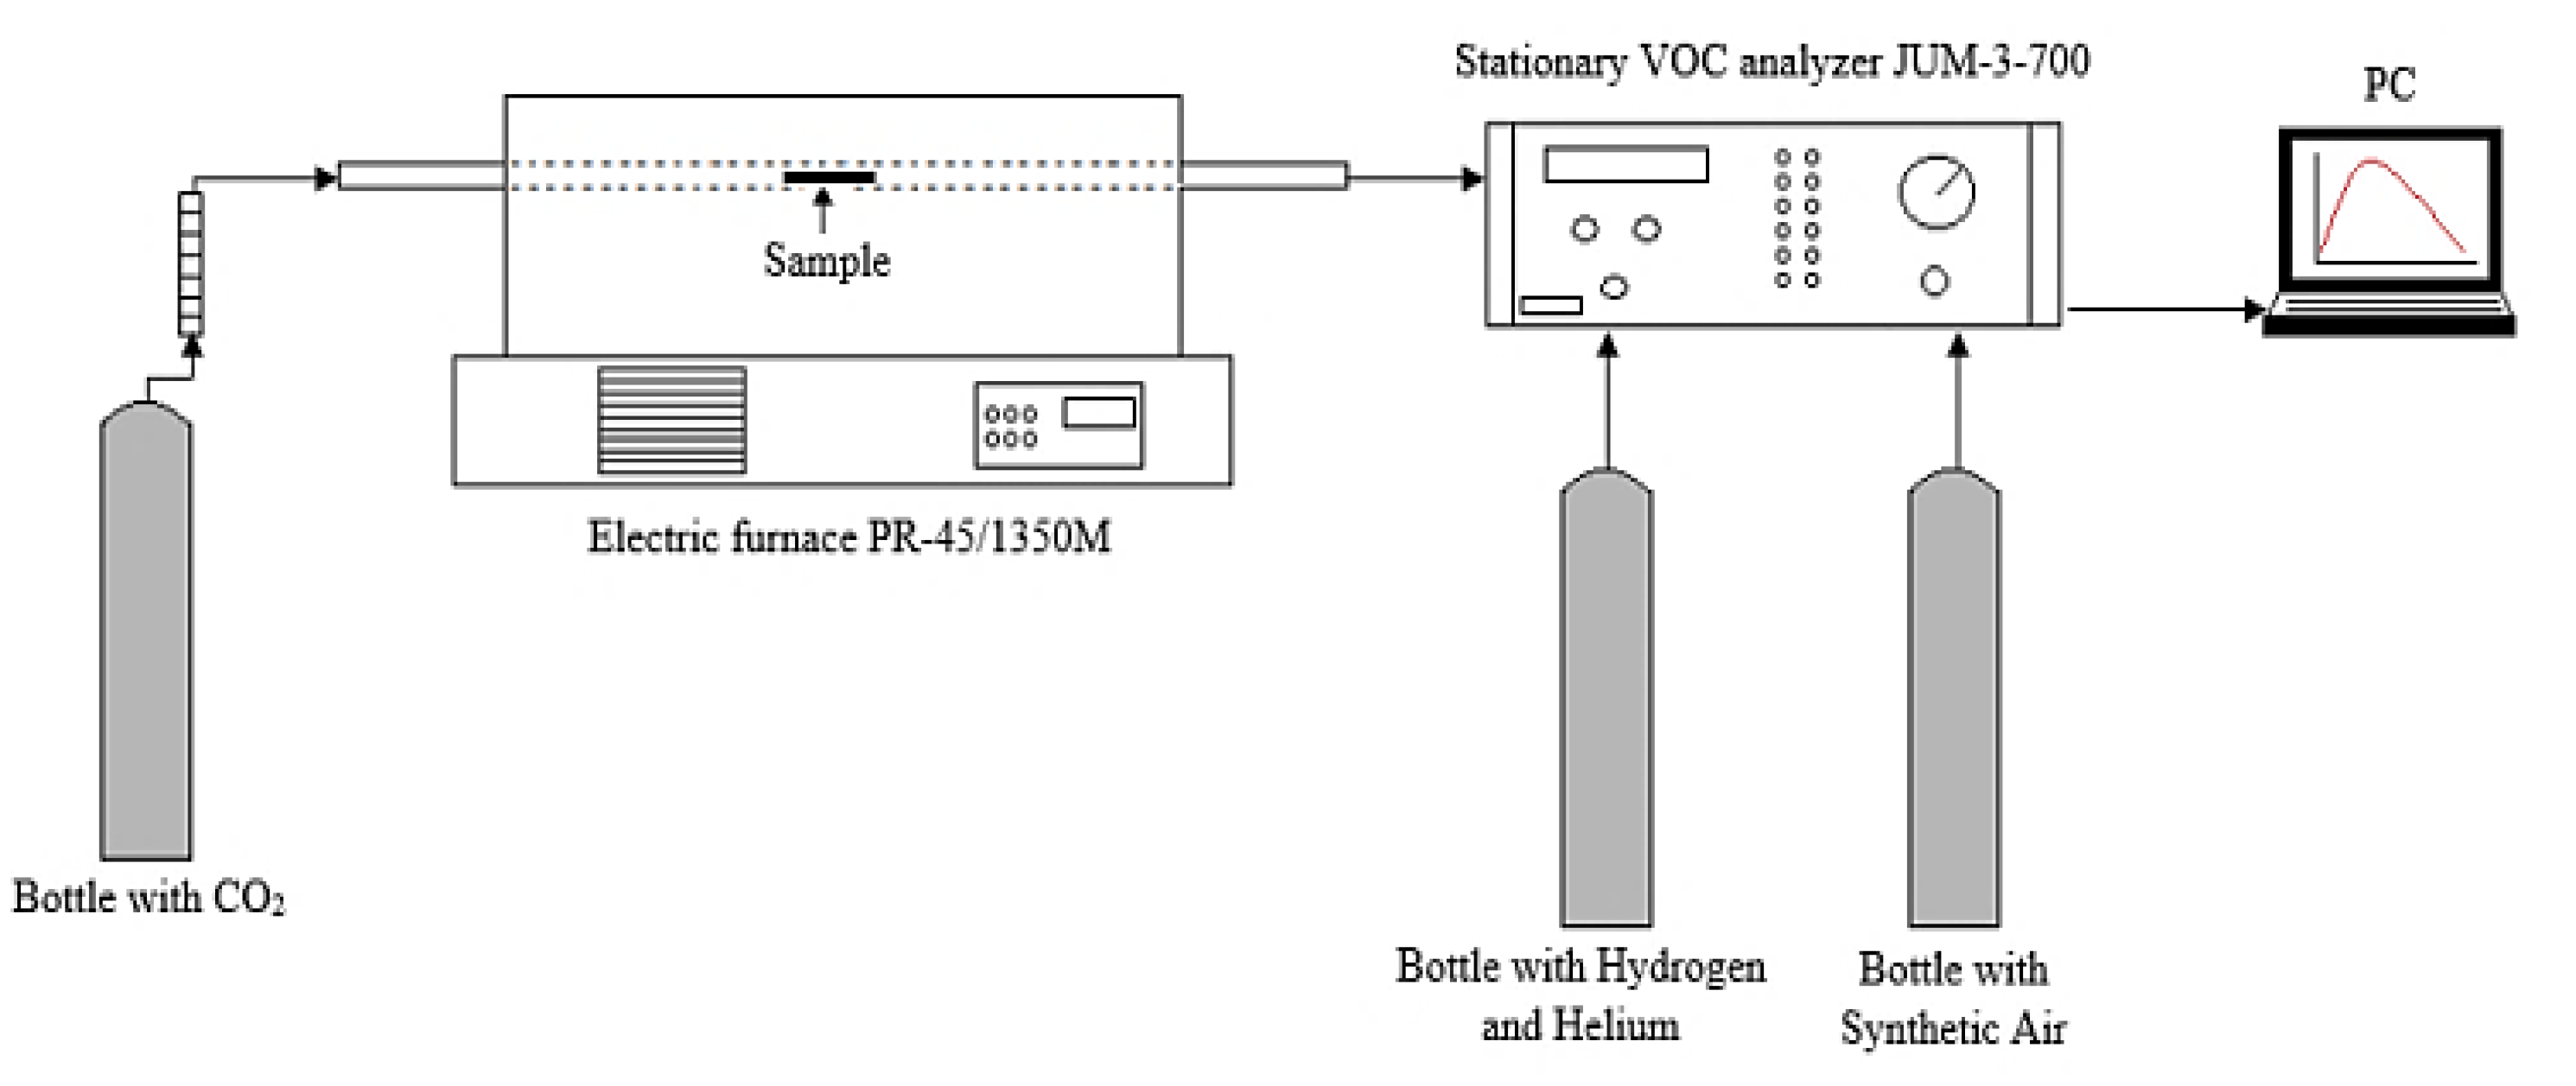
4.4. Volatile Organic Compounds
4.5. Experimental Procedure and Device
4.6. Kinetics Models
5. Conclusions
Author Contributions
Funding
Institutional Review Board Statement
Informed Consent Statement
Data Availability Statement
Conflicts of Interest
Sample Availability
Appendix A


| Fract. Mass Loss | Activation Energy (kJ/mol) | Log (A/s−1) |
|---|---|---|
| 0.02 | 108.12 ± 26.14 | 7.17 |
| 0.05 | 103.12 ± 18.65 | 6.65 |
| 0.10 | 91.07 ± 20.76 | 5.55 |
| 0.20 | 101.12 ± 20.73 | 6.40 |
| 0.30 | 102.77 ± 32.18 | 6.39 |
| 0.40 | 126.43 ± 31.52 | 8.42 |
| 0.50 | 170.58 ± 23.37 | 12.21 |
| 0.60 | 216.56 ± 12.43 | 16.07 |
| 0.70 | 301.28 ± 16.43 | 23.02 |


References
- Karbowniczak, A.; Hamerska, J.; Wróbel, M.; Jewiarz, M.; Nęcka, K. Evaluation of Selected Species of Woody Plants in Terms of Suitability for Energy Production. In Renewable Energy Sources: Engineering, Technology, Innovation. Springer Proceedings in Energy; Mudryk, K., Werle, S., Eds.; Springer Proceedings in Energy: Berlin/Heidelberg, Germany, 2018; pp. 735–742. [Google Scholar]
- Robbins, M.P.; Evans, G.; Valentine, J.; Donnison, I.S.; Allison, G.G. New opportunities for the exploitation of energy crops by thermochemical conversion in northern Europe and the UK. Prog. Energy Combust. Sci. 2012, 38, 138–155. [Google Scholar] [CrossRef]
- Telmo, C.; Lousada, J. Heating values of wood pellets from different species. Biomass Bioenergy 2011, 35, 2634–2639. [Google Scholar] [CrossRef]
- Filbakk, T.; Jirjis, R.; Nurmi, J.; Høibø, O. The effect of bark content on quality parameters of Scots pine (Pinus sylvestris L.) pellets. Biomass Bioenergy 2011, 35, 3342–3349. [Google Scholar] [CrossRef]
- Križan, P.; Matúš, M.; Šooš, L.; Beniak, J. Behavior of beech sawdust during densification into a solid biofuel. Energies 2015, 8, 6382–6398. [Google Scholar] [CrossRef]
- Lewandowski, I.; Clifton-Brown, J.C.; Scurlock, J.M.O.; Huisman, W. Miscanthus: European experience with a novel energy crop. Biomass Bioenergy 2000, 19, 209–227. [Google Scholar] [CrossRef]
- Lewandowski, I.; Scurlock, J.M.O.; Lindvall, E.; Christou, M. The development and current status of perennial rhizomatous grasses as energy crops in the US and Europe. Biomass Bioenergy 2003, 25, 335–361. [Google Scholar] [CrossRef]
- Khomina, V.; Trach, I.; Semenyshyna, I.; Koberniuk, O.; Mudryk, K.; Jewiarz, M.; Wróbel, M.; Styks, J. Potential of Soybean Straw in Ukraine and Solid Biofuel Production. In Renewable Energy Sources: Engineering, Technology, Innovation. Springer Proceedings in Energy ICORES 2018; Wróbel, M., Jewiarz, M., Szlęk, A., Eds.; Springer Proceedings in Energy: Berlin/Heidelberg, Germany, 2020; pp. 163–170. [Google Scholar] [CrossRef]
- Hebda, T.; Brzychczyk, B.; Francik, S.; Pedryc, N. Evaluation of suitability of hazelnut shell energy for production of biofuels. Proc. Eng. Rural Dev. 2018, 17, 1860–1865. [Google Scholar]
- García, R.; Gil, M.V.; Rubiera, F.; Pevida, C. Pelletization of wood and alternative residual biomass blends for producing industrial quality pellets. Fuel 2019, 251, 739–753. [Google Scholar] [CrossRef]
- Zamorano, M.; Popov, V.; Rodríguez, M.L.; García-Maraver, A. A comparative study of quality properties of pelletized agricultural and forestry lopping residues. Renew. Energy 2011, 36, 3133–3140. [Google Scholar] [CrossRef]
- Bryś, A.; Zielińska, J.; Głowacki, S.; Tulej, W.; Bryś, J. Analysis of possibilities of using biomass from cherry and morello cherry stones for energy purposes. E3s Web Conf. 2020, 154, 01005. [Google Scholar] [CrossRef]
- Zawiślak, K.; Sobczak, P.; Kraszkiewicz, A.; Niedziółka, I.; Parafiniuk, S.; Kuna-Broniowska, I.; Tanaś, W.; Żukiewicz-Sobczak, W.; Obidziński, S. The use of lignocellulosic waste in the production of pellets for energy purposes. Renew. Energy 2020, 145, 997–1003. [Google Scholar] [CrossRef]
- Rezania, S.; Ponraj, M.; Din, M.F.M.; Songip, A.R.; Sairan, F.M.; Chelliapan, S. The diverse applications of water hyacinth with main focus on sustainable energy and production for new era: An overview. Renew. Sustain. Energy Rev. 2015, 41, 943–954. [Google Scholar] [CrossRef]
- Davies, R. Ignition and Burning Rate of Water Hyacinth Briquettes. J. Sci. Res. Rep. 2013, 2, 111–120. [Google Scholar] [CrossRef]
- Benemann, J. Microalgae for Biofuels and Animal Feeds. Energies 2013, 6, 5869–5886. [Google Scholar] [CrossRef]
- ISO 17225-1:2014. Solid Biofuels—Fuel Specifications and Classes—Part. 1: General Requirements; International Organization for Standardization: Geneva, Switzerland, 2014. [Google Scholar]
- Knapczyk, A.; Francik, S.; Wójcik, A.; Bednarz, G. Influence of Storing Miscanthus x gigantheus on Its Mechanical and Energetic Properties. In Renewable Energy Sources: Engineering, Technology, Innovation. Springer Proceedings in Energy ICORES 2017; Mudryk, K., Werle, S., Eds.; Springer Proceedings in Energy: Berlin/Heidelberg, Germany, 2018; pp. 651–660. [Google Scholar] [CrossRef]
- Manouchehrinejad, M.; Yue, Y.; de Morais, R.A.L.; Souza, L.M.O.; Singh, H.; Mani, S. Densification of Thermally Treated Energy Cane and Napier Grass. Bioenergy Res. 2018, 11, 538–550. [Google Scholar] [CrossRef]
- Theerarattananoon, K.; Xu, F.; Wilson, J.; Ballard, R.; Mckinney, L.; Staggenborg, S.; Vadlani, P.; Pei, Z.J.; Wang, D. Physical properties of pellets made from sorghum stalk, corn stover, wheat straw, and big bluestem. Ind. Crop. Prod. 2011, 33, 325–332. [Google Scholar] [CrossRef]
- White, R.H. Effect of lignin content and extractives on the higher heating value of wood. Wood Fiber Sci. 1987, 19, 446–452. [Google Scholar]
- Demirbaş, A. Relationships between heating value and lignin, fixed carbon, and volatile material contents of shells from biomass products. Energy Sources 2003, 25, 629–635. [Google Scholar] [CrossRef]
- Demirbas, A. Higher heating values of lignin types from wood and non-wood lignocellulosic biomasses. Energy Sources Part A Recover. Util. Env. Eff. 2017, 39, 592–598. [Google Scholar] [CrossRef]
- Wróbel, M.; Mudryk, K.; Jewiarz, M.; Głowacki, S.; Tulej, W. Characterization of Selected Plant Species in Terms of Energetic Use. In Renewable Energy Sources: Engineering, Technology, Innovation. Springer Proceedings in Energy ICORES 2017; Mudryk, K., Werle, S., Eds.; Springer Proceedings in Energy: Berlin/Heidelberg, Germany, 2018; pp. 671–681. [Google Scholar]
- Prosiński, S. Chemia Drewna; PWRiL: Warszawa, Poland, 1984; ISBN 83-09-00674-8. [Google Scholar]
- Bryś, A.; Bryś, J.; Głowacki, S.; Tulej, W.; Zajkowski, P.; Sojak, M. Analysis of Potential Related to Grass-Derived Biomass for Energetic Purposes. In Renewable Energy Sources: Engineering, Technology, Innovation. Springer Proceedings in Energy ICORES 2017; Mudryk, K., Werle, S., Eds.; Springer Proceedings in Energy: Berlin/Heidelberg, Germany, 2018; pp. 443–450. [Google Scholar] [CrossRef]
- Nielsen, H.K.; Lærke, P.E.; Liu, N.; Jørgensen, U. Sampling procedure in a willow plantation for estimation of moisture content. Biomass Bioenergy 2015, 78, 62–70. [Google Scholar] [CrossRef]
- Stelte, W.; Sanadi, A.R.; Shang, L.; Holm, J.K.; Ahrenfeldt, J.; Henriksen, U.B. Recent developments in biomass pelletization—A review. BioResources 2012, 7, 4451–4490. [Google Scholar] [CrossRef]
- Larsson, S.H.; Thyrel, M.; Geladi, P.; Lestander, T.A. High quality biofuel pellet production from pre-compacted low density raw materials. Bioresour. Technol. 2008, 99, 7176–7182. [Google Scholar] [CrossRef]
- Kubica, K.; Jewiarz, M.; Kubica, R.; Szlęk, A. Straw Combustion: Pilot and Laboratory Studies on a Straw-Fired Grate Boiler. Energy Fuels 2016, 30, 4405–4410. [Google Scholar] [CrossRef]
- Dong, L.; Gao, S.; Xu, G. NO Reduction over Biomass Char in the Combustion Process. Energy Fuels 2010, 24, 446–450. [Google Scholar] [CrossRef]
- González, J.F.; González-García, C.M.; Ramiro, A.; González, J.; Sabio, E.; Gañán, J.; Rodríguez, M.A. Combustion optimisation of biomass residue pellets for domestic heating with a mural boiler. Biomass Bioenergy 2004, 27, 145–154. [Google Scholar] [CrossRef]
- Ryu, C.; Yang, Y.; Bin, K.A.; Yates, N.E.; Sharifi, V.N.; Swithenbank, J. Effect of fuel properties on biomass combustion: Part I. Experiments—Fuel type, equivalence ratio and particle size. Fuel 2006, 85, 1039–1046. [Google Scholar] [CrossRef]
- Shaw, M.D.; Karunakaran, C.; Tabil, L.G. Physicochemical characteristics of densified untreated and steam exploded poplar wood and wheat straw grinds. Biosyst. Eng. 2009, 103, 198–207. [Google Scholar] [CrossRef]
- Tumuluru, J. Effect of Moisture Content and Hammer Mill Screen Size on the Briquetting Characteristics of Woody and Herbaceous Biomass. Kona Powder Part. 2019, 241–251. [Google Scholar] [CrossRef]
- Francik, S.; Knapczyk, A.; Knapczyk, A.; Francik, R. Decision Support System for the Production of Miscanthus and Willow Briquettes. Energies 2020, 13, 1364. [Google Scholar] [CrossRef]
- Kaliyan, N.; Vance Morey, R. Factors affecting strength and durability of densified biomass products. Biomass Bioenergy 2009, 33, 337–359. [Google Scholar] [CrossRef]
- Dyjakon, A.; Noszczyk, T. The Influence of Freezing Temperature Storage on the Mechanical Durability of Commercial Pellets from Biomass. Energies 2019, 12, 2627. [Google Scholar] [CrossRef]
- Serrano, C.; Monedero, E.; Lapuerta, M.; Portero, H. Effect of moisture content, particle size and pine addition on quality parameters of barley straw pellets. Fuel Process. Technol. 2011, 92, 699–706. [Google Scholar] [CrossRef]
- Pietsch, W. Agglomeration Processes. Phenomena, Technologies, Equipment; Wiley-VCH Verlag GmBH.: Weinheim, Germany, 2002; ISBN 3-527-30369-3. [Google Scholar]
- Styks, J.; Wróbel, M.; Frączek, J.; Knapczyk, A. Effect of Compaction Pressure and Moisture Content on Quality Parameters of Perennial Biomass Pellets. Energies 2020, 13, 1859. [Google Scholar] [CrossRef]
- Puig-Arnavat, M.; Shang, L.; Sárossy, Z.; Ahrenfeldt, J.; Henriksen, U.B. From a single pellet press to a bench scale pellet mill—Pelletizing six different biomass feedstocks. Fuel Process. Technol. 2016, 142, 27–33. [Google Scholar] [CrossRef]
- Wróbel, M.; Jewiarz, M.; Mudryk, K.; Knapczyk, A. Influence of Raw Material Drying Temperature on the Scots Pine (Pinus sylvestris L.) Biomass Agglomeration Process—A Preliminary Study. Energies 2020, 13, 1809. [Google Scholar]
- Zafari, A.; Kianmehr, M.H. Factors affecting mechanical properties of biomass pellet from compost. Env. Technol. 2014, 35, 478–486. [Google Scholar] [CrossRef]
- Peng, J.H.; Bi, H.T.; Sokhansanj, S.; Lim, J.C. A study of particle size effect on biomass torrefaction and densification. Proc. Energy Fuels 2012, 26, 3826–3839. [Google Scholar] [CrossRef]
- Matúš, M.; Križan, P.; Kováčová, M.; Beniak, J. The influence of size fraction on the compressibility of pine sawdust and the effectiveness criterion for densification. Acta Polytech. 2014, 54, 52–58. [Google Scholar] [CrossRef]
- Franke, M.; Rey, A. Improving Pellet Quality and Efficiency. Feed Technol. 2006, 10, 12–15. [Google Scholar]
- Mani, S.; Tabil, L.G.; Sokhansanj, S. Effects of compressive force, particle size and moisture content on mechanical properties of biomass pellets from grasses. Biomass Bioenergy 2006, 30, 648–654. [Google Scholar] [CrossRef]
- Muramatsu, K.; Massuquetto, A.; Dahlke, F.; Maiorka, A. Factors that Affect Pellet Quality: A Review. J. Agric. Sci. Technol. A 2015, 5. [Google Scholar] [CrossRef]
- Tumuluru, J.S.; Wright, C.T.; Hess, J.R.; Kenney, K.L. A review of biomass densification systems to develop uniform feedstock commodities for bioenergy application. Biofuels Bioprod. Biorefin. 2011, 5, 683–707. [Google Scholar] [CrossRef]
- Mostafa, M.E.; Hu, S.; Wang, Y.; Su, S.; Hu, X.; Elsayed, S.A.; Xiang, J. The significance of pelletization operating conditions: An analysis of physical and mechanical characteristics as well as energy consumption of biomass pellets. Renew. Sustain. Energy Rev. 2019, 105, 332–348. [Google Scholar] [CrossRef]
- Wróbel, M.; Hamerska, J.; Jewiarz, M.; Mudryk, K.; Niemczyk, M. Influence of Parameters of the Torrefaction Process on the Selected Parameters of Torrefied Woody Biomass. In Renewable Energy Sources: Engineering, Technology, Innovation. Springer Proceedings in Energy; Mudryk, K., Werle, S., Eds.; Springer Proceedings in Energy: Berlin/Heidelberg, Germany, 2018; pp. 691–700. [Google Scholar]
- Mierzwa-Hersztek, M.; Gondek, K.; Jewiarz, M.; Dziedzic, K. Assessment of energy parameters of biomass and biochars, leachability of heavy metals and phytotoxicity of their ashes. J. Mater. Cycles Waste Manag. 2019, 21, 786–800. [Google Scholar] [CrossRef]
- Phanphanich, M.; Mani, S. Impact of torrefaction on the grindability and fuel characteristics of forest biomass. Bioresour. Technol. 2011, 102, 1246–1253. [Google Scholar] [CrossRef]
- Bridgeman, T.G.; Jones, J.M.; Williams, A.; Waldron, D.J. An investigation of the grindability of two torrefied energy crops. Fuel 2010, 89, 3911–3918. [Google Scholar] [CrossRef]
- Saleh, S.B.; Hansen, B.B.; Jensen, P.A.; Dam-Johansen, K. Influence of Biomass Chemical Properties on Torrefaction Characteristics. Energy Fuels 2013, 27, 7541–7548. [Google Scholar] [CrossRef]
- Kanwal, S.; Munir, S.; Chaudhry, N.; Sana, H. Physicochemical characterization of Thar coal and torrefied corn cob. Energy Explor. Exploit. 2019, 37, 1286–1305. [Google Scholar] [CrossRef]
- Fagernäs, L.; Brammer, J.; Wilén, C.; Lauer, M.; Verhoeff, F. Drying of biomass for second generation synfuel production. Biomass Bioenergy 2010, 34, 1267–1277. [Google Scholar] [CrossRef]
- Frühwirth, P.; Graf, A.; Humer, M.; Hunger, F.; Köppl, H.; Liebhard, P.; Tumfart, K. Miscanthus sinensis “Giganteus”. Chinaschilf als nachwachsender Rohstoff. Anbau, Inhaltsstoffe, Kosten, Heiztechnik; Landwirtschaftskammer Österreich: Wien, Austria, 2006; ISBN 3-902325-02-X. [Google Scholar]
- Nunes, L.J.R. A Case Study about Biomass Torrefaction on an Industrial Scale: Solutions to Problems Related to Self-Heating, Difficulties in Pelletizing, and Excessive Wear of Production Equipment. Appl. Sci. 2020, 10, 2546. [Google Scholar] [CrossRef]
- Wilk, M.; Magdziarz, A.; Gajek, M.; Zajemska, M.; Jayaraman, K.; Gokalp, I. Combustion and kinetic parameters estimation of torrefied pine, acacia and Miscanthus giganteus using experimental and modelling techniques. Bioresource Technol. 2017, 243, 304–314. [Google Scholar] [CrossRef]
- Doumer, M.E.; Arízaga, G.G.C.; da Silva, D.A.; Yamamoto, C.I.; Novotny, E.H.; Santos, J.M.; dos Santos, L.O.; Wisniewski, A.; de Andrade, J.B.; Mangrich, A.S. Slow pyrolysis of different Brazilian waste biomasses as sources of soil conditioners and energy, and for environmental protection. J. Anal. Appl. Pyrolysis 2015, 113, 434–443. [Google Scholar] [CrossRef]
- Eibisch, N.; Schroll, R.; Fuß, R. Effect of pyrochar and hydrochar amendments on the mineralization of the herbicide isoproturon in an agricultural soil. Chemosphere 2015, 134, 528–535. [Google Scholar] [CrossRef] [PubMed]
- Schimmelpfenniga, S.; Müller, C.; Grünhage, L.; Koch, C.; Kammannaa, C. Biochar, hydrochar and uncarbonized feedstock application to permanent grassland—effects on greenhouse gas emission sand plant growth. Agric. Ecosyst. Environ. 2015, 191, 39–52. [Google Scholar] [CrossRef]
- Trazzi, P.A.; Leahy, J.J.; Hayes, M.H.B.; Kwapinski, W. Adsorption and desorption of phosphate on biochars. J. Environ. Chem. Eng. 2016, 4, 37–46. [Google Scholar] [CrossRef]
- Cruz, D.C. Production of Bio-Coal and Activated Carbon from Biomass. Master’s Thesis, The University of Western Ontario, London, ON, Canada, 2012. [Google Scholar]
- Gładki, J. Biowęgiel Szansą dla Zrównoważonego Rozwoju [BIOCHAR as a Chance for Sustainable Development], 2nd ed.; Oficyna Poligrafi czna Apla Sp.J.: Sędziszów, Poland, 2017; pp. 60–85. ISBN 978-83-65487-05-06. [Google Scholar]
- Xue, G.; Kwapinska, M.; Kwapinski, W.; Czajka, K.M.; Kennedy, J.; Leahy, J.J. Impact of torrefaction on properties of Miscanthus×giganteus relevant to gasification. Fuel 2014, 121, 189–197. [Google Scholar] [CrossRef]
- Gucho, E.M.; Shahzad, K.; Bramer, E.A.; Akhtar, N.A.; Brem, G. Experimental Study on Dry Torrefaction of Beech Wood and Miscanthus. Energies 2015, 8, 3903–3923. [Google Scholar] [CrossRef]
- ISO 17827-2:2016. Solid Biofuels—Determination of Particle Size Distribution for Uncompressed Fuels—Part. 2: Vibrating Screen Method Using Sieves with Aperture of 3.15 mm and Below; International Organization for Standardization: Geneva, Switzerland, 2016. [Google Scholar]
- ISO 17831-1:2015. Solid Biofuels—Determination of Mechanical Durability of Pellets and Briquettes—Part. 1: Pellets; International Organization for Standardization: Geneva, Switzerland, 2015. [Google Scholar]
- ISO 16994:2016. Solid Biofuels—Determination of Total Content of Sulfur and Chlorine; International Organization for Standardization: Geneva, Switzerland, 2016. [Google Scholar]
- ISO 16948:2015. Solid Biofuels—Determination of Total Content of Carbon, Hydrogen and Nitrogen; International Organization for Standardization: Geneva, Switzerland, 2015. [Google Scholar]
- ISO 18122:2015. Solid Biofuels—Determination of Ash Content; International Organization for Standardization: Geneva, Switzerland, 2015. [Google Scholar]
- ISO 18123:2015. Solid Biofuels—Determination of the Content of Volatile Matter; International Organization for Standardization: Geneva, Switzerland, 2015. [Google Scholar]
- ISO 18125:2015. Solid Biofuels—Determination of Calorific Value; International Organization for Standardization: Geneva, Switzerland, 2017. [Google Scholar]
- Gramsa, J.; Kwapińska, M.; Jędrzejczyk, M.; Rzeźnicka, I.; Leahy, J.J.; Ruppert, A.M. Surface characterization of Miscanthus × giganteus and Willow subjected to torrefaction. J. Anal. Appl. Pyrolysis 2019, 138, 231–241. [Google Scholar] [CrossRef]
- Stelmach, J.; Kuncewicz, C.; Adrian, Ł.; Jirout, T.; Rieger, F. Change in Mixing Power of a Two-PBT Impeller When Emptying a Tank. Processes 2021, 9, 341. [Google Scholar] [CrossRef]
- Magdziarz, A.; Wilk, M.; Wądrzyk, M. Pyrolysis of hydrochar derived from biomass—Experimental investigation. Fuel 2020, 267, 117246. [Google Scholar] [CrossRef]
- Standard Test Method for Kinetic Parameters for Thermally Unstable Materials Using Differential Scanning Calorimetry and the Flynn/Wall/Ozawa Method Active Standard ASTM E698|Developed by Subcommittee: E37.01, Book of Standards Volume: 14.05. Available online: https://td.chem.msu.ru/uploads/files/courses/special/specpracta/lit/ASTM%20E%20698%20-%2016.pdf (accessed on 15 April 2020).
- ISO 17225-6:2014. Solid Biofuels—Fuel Specifications and Classes—Part. 6: Graded Non-Woody Pellets; International Organization for Standardization: Geneva, Switzerland, 2014. [Google Scholar]
- Siuda, R.; Kwiatek, J.; Szufa, S.; Obraniak, A.; Piersa, P.; Adrian, Ł.; Modrzewski, R.; Ławińska, K.; Siczek, K.; Olejnik, T.P. Industrial Verification and Research Development of Lime–Gypsum Fertilizer Granulation Method. Minerals 2021, 11, 119. [Google Scholar] [CrossRef]
- Szufa, S.; Adrian, Ł.; Piersa, P.; Romanowska-Duda, Z.; Ratajczyk-Szufa, J. Torrefaction process of millet and cane using batch reactor. In Renewable Energy Sources: Engineering, Technology, Innovation. Springer Proceedings in Energy; Wróbel, M., Jewiarz, M., Szlęk, A., Eds.; Springer Proceedings in Energy: Berlin/Heidelberg, Germany, 2020; pp. 371–379. [Google Scholar] [CrossRef]
- Szufa, S.; Wielgosiński, G.; Piersa, P.; Czerwińska, J.; Adrian, Ł.; Dzikuć, M.; Lewandowska, W.; Marczak, M. Torrefaction of straw from Oats and Maize for use as a fuel and additive to organic fertilizers—TGA analysis, kinetics as products for agricultural purposes. Energies 2020, 13, 2064. [Google Scholar] [CrossRef]
- Dzikuć, M.; Kuryło, P.; Dudziak, R.; Szufa, S.; Dzikuć, M.; Godzisz, K. Selected aspects of combustion optimization of coal in power plants. Energies 2020, 13, 2208. [Google Scholar] [CrossRef]
- Wilk, M.; Magdziarz, A. Hydrothermal carbonization, torrefaction and slow pyrolysis of Miscanthus giganteus. Energy 2017, 140, 1292–1304. [Google Scholar] [CrossRef]
- Szufa, S.; Dzikuć, M.; Adrian, Ł.; Piersa, P.; Romanowska-Duda, Z.; Marczak, M.; Błaszczuk, A.; Piwowar, A.; Lewandowska, W. Torrefaction of oat straw to use as solid biofuel, an additive to organic fertilizers for agriculture purposes and activated carbon—TGA analysis, kinetics. E3s Web Conf. 2020, 154, 02004. [Google Scholar] [CrossRef]
- Romanowska-Duda, Z.; Piotrowski, K.; Wolska, B.; Dębowski, M.; Zieliński, M.; Dziugan, P.; Szufa, S. Stimulating effect of ash from Sorghum on the growth of Lemnaceae—A new source of energy biomass. In Renewable Energy Sources: Engineering, Technology, Innovation. Springer Proceedings in Energy; Wróbel, M., Jewiarz, M., Szlęk, A., Eds.; Springer Proceedings in Energy: Berlin/Heidelberg, Germany, 2020; pp. 341–349. [Google Scholar] [CrossRef]
- Wnukowski, M.; Owczarek, P.; Niedźwiecki, Ł. Wet torrefaction of miscanthus–Characterization of hydrochars in view of handling, storage and combustion properties. J. Ecol. Eng. 2015, 16, 161–167. [Google Scholar] [CrossRef]
- Szufa, S.; Adrian, Ł.; Piersa, P.; Romanowska-Duda, Z.; Grzesik, M.; Cebula, A.; Kowalczyk, S. Experimental studies on energy crops torrefaction process using batch reactor to estimate torrefaction temperature and residence time. In Renewable Energy Sources: Engineering, Technology, Innovation. Springer Proceedings in Energy; Mudryk, K., Werle, S., Eds.; Springer Proceedings in Energy: Berlin/Heidelberg, Germany, 2018; pp. 365–373. [Google Scholar] [CrossRef]
- Adrian, Ł.; Szufa, S.; Piersa, P.; Romanowska-Duda, Z.; Grzesik, M.; Cebula, A.; Kowalczyk, S. Experimental research and thermographic analysis of heat transfer processes in a heat pipe heat exchanger utilizing as a working fluid R134A. In Renewable Energy Sources: Engineering, Technology, Innovation. Springer Proceedings in Energy ICORES 2017; Mudryk, K., Werle, S., Eds.; Springer Proceedings in Energy: Berlin/Heidelberg, Germany, 2018; pp. 413–421. [Google Scholar] [CrossRef]
- Szufa, S.; Romanowska-Duda, B.Z.; Grzesik, M. Torrefaction process of the Phragmites Communis growing in soil contaminated with cadmium. In Proceedings of the 20th European Biomass Conference and Exhibition, Milan, Italy, 18–22 June 2014; pp. 628–634, ISBN 978-88-89407-54-7. [Google Scholar] [CrossRef]
- Szufa, S. Use of superheated steam in the process of biomass torrefaction. Przemysł Chem. 2020, 99, 1797–1801. (In Polish) [Google Scholar] [CrossRef]
- Marczak, M.; Karczewski, M.; Makowska, D.; Burmistrz, P. Impact of the temperature of waste biomass pyrolysis on the quality of the obtained biochar. Agric. Eng. 2016, 20, 115–124. [Google Scholar]
- Junga, R.; Pospolita, J.; Niemiec, P. Combustion and grindability characteristics of palm kernel shells torrefied in a pilot-scale installation. Renew. Energy 2020, 147, 1239–1250. [Google Scholar] [CrossRef]
- Ławińska, K.; Szufa, S.; Obraniak, A.; Olejnik, T.; Siuda, R.; Kwiatek, J.; Ogrodowczyk, D. Disc Granulation Process of Carbonation Lime Mud as a Method of Post-Production Waste Management. Energies 2020, 13, 3419. [Google Scholar] [CrossRef]
- Jewiarz, M.; Wróbel, M.; Mudryk, K.; Szufa, S. Impact of the Drying Temperature and Grinding Technique on Biomass Grindability. Energies 2020, 13, 3392. [Google Scholar] [CrossRef]
- Ławińska, K.; Szufa, S.; Modrzewski, R.; Obraniak, A.; Wężyk, T.; Rostocki, A.; Olejnik, T.P. Obtaining Granules from Waste Tannery Shavings and Mineral Additives by Wet Pulp Granulation. Molecules 2020, 25, 5419. [Google Scholar] [CrossRef] [PubMed]
- Szufa, S.; Piersa, P.; Adrian, Ł.; Sielski, J.; Grzesik, M.; Romanowska-Duda, Z.; Piotrowski, K.; Lewandowska, W. Acquisition of Torrefied Biomass from Jerusalem Artichoke Grown in a Closed Circular System Using Biogas Plant Waste. Molecules 2020, 25, 3862. [Google Scholar] [CrossRef] [PubMed]
- Lapczynska-Kordon, B.; Lis, S.; Tomasik, M. Control of the microwave drying process of selected fruits and vegetables. Przegląd Elektrotechniczny 2019, 9, 74–77. [Google Scholar] [CrossRef]


| SS | df | MS | F Value | p-Value | |
|---|---|---|---|---|---|
| Intercept | 216,951,606 | 1 | 216,951,606 | 2,465,092 | 0.00 |
| Temperature | 65 | 2 | 33 | 0 | 0.69 |
| Moisture | 589,762 | 2 | 294,881 | 3351 | 0.00 |
| Pressure | 666,172 | 5 | 133,234 | 1514 | 0.00 |
| Temperature x Moisture | 4045 | 4 | 1011 | 11 | 0.00 |
| Temperature x Pressure | 1682 | 10 | 168 | 2 | 0.046 |
| Moisture x Pressure | 91,084 | 10 | 9108 | 103 | 0.00 |
| Temperature x Moisture x Pressure | 4169 | 20 | 208 | 2 | 0.0016 |
| Error | 14,258 | 162 | 88 |
| SS | df | MS | F Value | p-Value | |
|---|---|---|---|---|---|
| Intercept | 1,523,952 | 1 | 1,523,952 | 7,800,727 | 0.00 |
| Temperature | 687 | 2 | 343 | 1758 | 0.00 |
| Moisture | 29,810 | 2 | 14,905 | 76,294 | 0.00 |
| Pressure | 47,372 | 5 | 9474 | 48,497 | 0.00 |
| Temperature x Moisture | 136 | 4 | 34 | 174 | 0.00 |
| Temperature x Pressure | 211 | 10 | 21 | 108 | 0.00 |
| Moisture x Pressure | 29,103 | 10 | 2910 | 14,897 | 0.00 |
| Temperature x Moisture x Pressure | 233 | 20 | 12 | 60 | 0.00 |
| Error | 32 | 162 | 0 |
| Fract. Mass Loss | Activation Energy (kJ/mol) | Log (A/s−1) |
|---|---|---|
| 0.02 | 115.33 ± 34.46 | 8.05 |
| 0.05 | 105.80 ± 23.54 | 6.87 |
| 0.10 | 109.45 ± 18.57 | 7.27 |
| 0.20 | 99.07 ± 18.21 | 6.27 |
| 0.30 | 100.06 ± 21.66 | 6.30 |
| 0.40 | 104.41 ± 25.94 | 6.63 |
| 0.50 | 119.38 ± 28.20 | 7.93 |
| 0.60 | 145.97 ± 27.97 | 10.23 |
| 0.70 | 186.50 ± 22.91 | 13.67 |
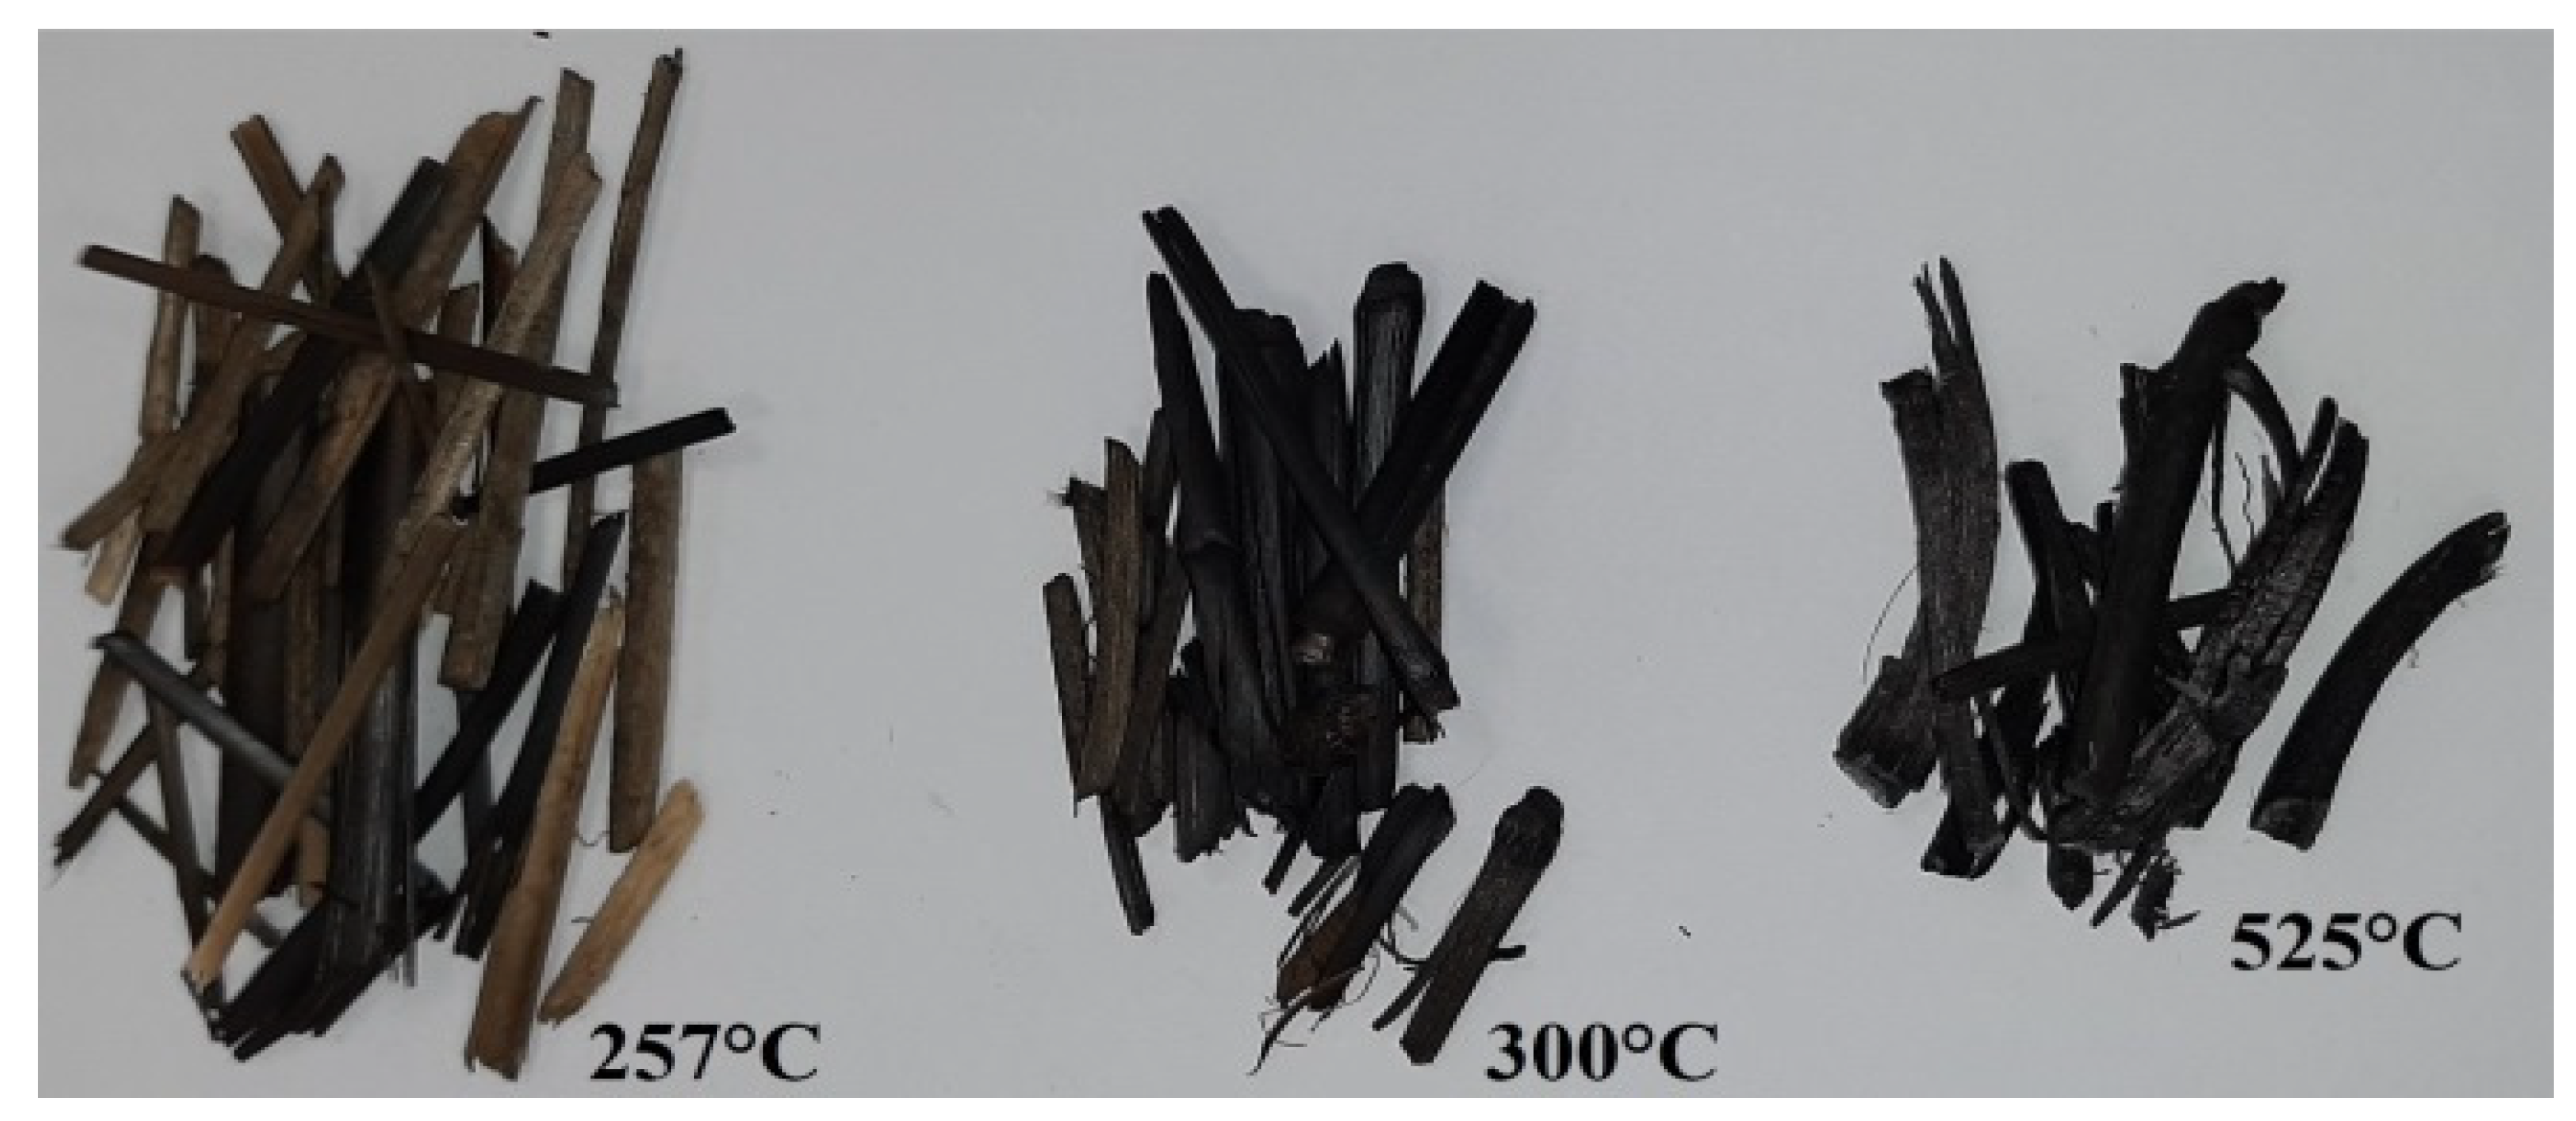
| Energy Crop | Mad (%) | Cd (%) | Nd (%) | Hd (%) | Sd (%) | Od (%) | Cld (%) | Vd (%) | Ad (%) | HHVd (MJ/kg) | Mass Loss (%) |
|---|---|---|---|---|---|---|---|---|---|---|---|
| Miscanthus | 5.3 | 48.5 | 0.27 | 6.20 | 0.05 | 42.56 | 0.115 | 91.29 | 2.3 | 15.82 | - |
| Torrefied Miscanthus: | |||||||||||
| (257 °C, 9 min) | 2.8 | 54.37 | 0.19 | 5.37 | 0.05 | 36.06 | 0.014 | 73.37 | 3.94 | 21.70 | 30.69 |
| (300 °C, 6 min) | 1.5 | 57.04 | 0.16 | 4.93 | 0.05 | 32.36 | 0.013 | 61.11 | 5.44 | 26.72 | 43.56 |
| (525 °C, 5 min) | 1.1 | 59.29 | 0.14 | 3.69 | 0.04 | 27.61 | 0.012 | 44.27 | 9.21 | 27.69 | 76.24 |
| Mineral Composition of Torrefied Miscanthus (257.5 °C) | Mineral Composition of Torrefied Miscanthus (300 °C) | Mineral Composition of Torrefied Miscanthus (525 °C) | ||||
|---|---|---|---|---|---|---|
| Element | Arithmetic Average | Standard Deviation | Aritmetic Average | Standard Deviation | Arithmetic Average | Standard Deviation |
| C | 68.33 | 1.175 | 73.98 | 1.742 | 83.75 | 2.195 |
| O | 29.78 | 1.535 | 24.11 | 2.552 | 14.23 | 2.556 |
| Al | 0.09 | 0.017 | 0.87 | 0.749 | 0.07 | 0.016 |
| Si | 1.49 | 0.443 | 1.05 | 0.260 | 0.54 | 2.508 |
| K | 0.08 | 0.064 | 0.08 | 0.015 | 0.82 | 0.356 |
| Ca | 0.07 | 0.017 | 0.19 | 0.038 | 0.13 | 0.040 |
| Mg | 0.06 | 0.10 | 0.07 | 0.000 | 0.11 | 0.028 |
| S | 0.06 | 0.000 | 0.23 | 0.052 | 0.15 | 0.008 |
| P | 0.11 | 0.033 | 0.12 | 0.040 | 0.17 | 0.049 |
| Device | Model | Producer | Device Parametr |
|---|---|---|---|
| Thermogravimeter | TG 209 F3 Tarsus | Netzsch (Germany) | Heating ratio: 0.001 K/min to 200 K/min TGA resolution: 0.1 µg |
| Differential Scanning Calorimeter DSC Analyzer | DSC 3500 Sirius | Netzsch (Germany) | Heat Flux sensor, Temperature range: −170 °C to 600 °C Heating ratios: 0.01 K/min to 100 K/min Temperature accuracy: 0.1 K Enthalpy accuracy: Generally < 2% |
| Laboratory electrical tube furnace | PR-45/1350M | Przemysłowy Instytut Elektroniki PIE (Poland) | Maximum temperature of measurement: 1350 °C Accuracy of temperature control: +/− 5 °C Furnace heating speed: 100 °C/8 min |
| Stationary analyzer VOC | FID 3-500 | J.U.M. Engineering (Germany) | Measurement method: Continuous flame ionization detection (FID) Measurement range: 0–100 000 ppm Tenderness: Maximum 1 ppm CH4 for full scale Response time: 1.2 s Linearity: 1% |
| Calorimeter | PARR 6400 | Parr Instrument Company (USA) | Precision class instrument: 0.1% Temperature Resolution: 0.0001 °C Calorie sample range: 5000–8000 Linearity across operating range: 0.05% |
| Energy Dispersive X-ray Spectroscopy | EDX Oxford X-Max spectrometer-SEM FEI Quanta 200FEG microscope | Oxford Instruments (USA) | EDX elemental map of a gallium arsenide single crystal sample with <011> orientation, obtained using HD-2700-spherical aberration corrector, dual SDDs. The acceleration voltage is 200 kV, the pixel number is 128 by 96, the acquisition time is 12 min. |
Publisher’s Note: MDPI stays neutral with regard to jurisdictional claims in published maps and institutional affiliations. |
© 2021 by the authors. Licensee MDPI, Basel, Switzerland. This article is an open access article distributed under the terms and conditions of the Creative Commons Attribution (CC BY) license (http://creativecommons.org/licenses/by/4.0/).
Share and Cite
Szufa, S.; Piersa, P.; Adrian, Ł.; Czerwińska, J.; Lewandowski, A.; Lewandowska, W.; Sielski, J.; Dzikuć, M.; Wróbel, M.; Jewiarz, M.; et al. Sustainable Drying and Torrefaction Processes of Miscanthus for Use as a Pelletized Solid Biofuel and Biocarbon-Carrier for Fertilizers. Molecules 2021, 26, 1014. https://doi.org/10.3390/molecules26041014
Szufa S, Piersa P, Adrian Ł, Czerwińska J, Lewandowski A, Lewandowska W, Sielski J, Dzikuć M, Wróbel M, Jewiarz M, et al. Sustainable Drying and Torrefaction Processes of Miscanthus for Use as a Pelletized Solid Biofuel and Biocarbon-Carrier for Fertilizers. Molecules. 2021; 26(4):1014. https://doi.org/10.3390/molecules26041014
Chicago/Turabian StyleSzufa, Szymon, Piotr Piersa, Łukasz Adrian, Justyna Czerwińska, Artur Lewandowski, Wiktoria Lewandowska, Jan Sielski, Maria Dzikuć, Marek Wróbel, Marcin Jewiarz, and et al. 2021. "Sustainable Drying and Torrefaction Processes of Miscanthus for Use as a Pelletized Solid Biofuel and Biocarbon-Carrier for Fertilizers" Molecules 26, no. 4: 1014. https://doi.org/10.3390/molecules26041014
APA StyleSzufa, S., Piersa, P., Adrian, Ł., Czerwińska, J., Lewandowski, A., Lewandowska, W., Sielski, J., Dzikuć, M., Wróbel, M., Jewiarz, M., & Knapczyk, A. (2021). Sustainable Drying and Torrefaction Processes of Miscanthus for Use as a Pelletized Solid Biofuel and Biocarbon-Carrier for Fertilizers. Molecules, 26(4), 1014. https://doi.org/10.3390/molecules26041014