
NH Stretching Frequencies of Intramolecularly Hydrogen-Bonded Systems: An Experimental and Theoretical Study


Abstract
1. Introduction


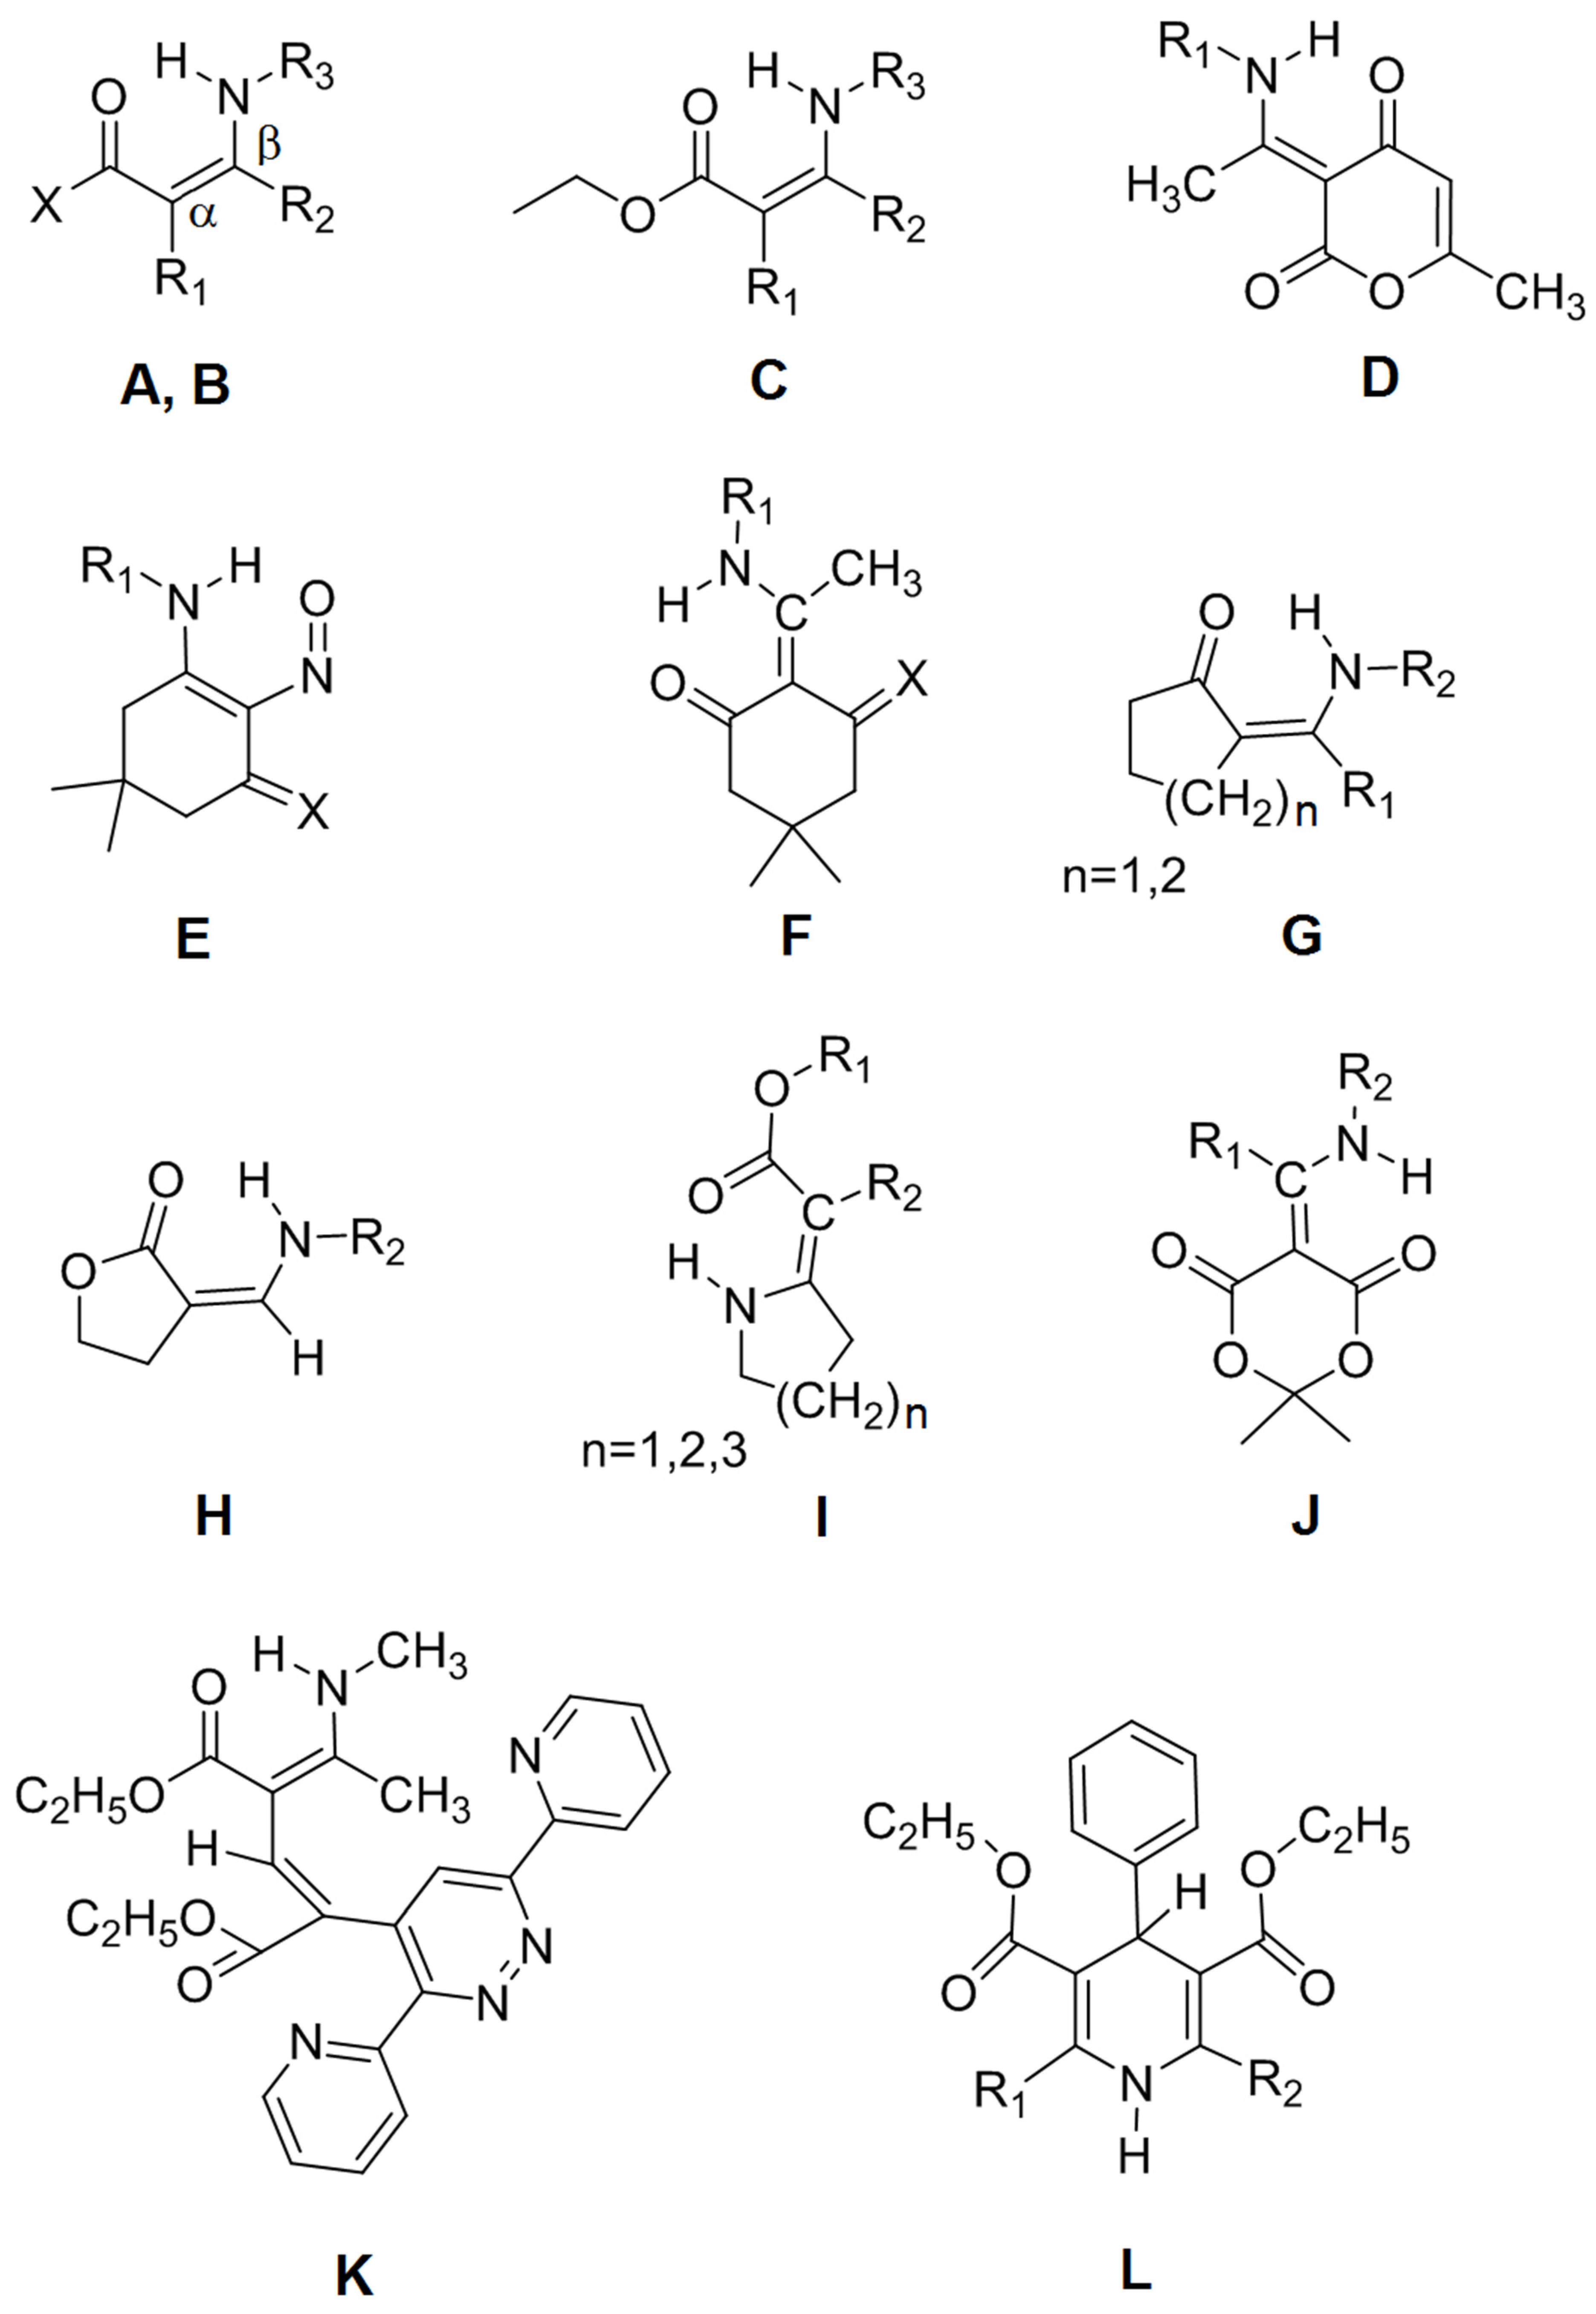
| No. | Type | R1 | R2 | R3 | X | Name |
|---|---|---|---|---|---|---|
| 1 | A | H | H | t-Butyl | H | (Z)-3-(tert-butylamino)acrylaldehyde |
| 2 | A | H | H | Ethyl | CH3 | (Z)-4-(ethylamino)but-3-en-2-one |
| 3 | A | H | H | Ethyl | CF3 | (Z)-4-(ethylamino)-1,1,1-trifluorobut-3-en-2-one |
| 4 | A | CH3 | H | CH3 | CF3 | (Z)-1,1,1-trifluoro-3-methyl-4-(methylamino)but-3-en-2-one |
| 5 | A | H | NO2 | CH3 | CH3 | (E)-4-methylamino-4-nitrobut-3-en-2-one |
| 6 | B | H | CH3 | Ph (phenyl) | CH3 | (Z)-4-(phenylamino)pent-3-en-2-one |
| 7 | B | H | CH3 | p-ClPh | Ph | (Z)-3-(4-chlorophenylamino)-1-phenylbut-2-en-1-one |
| 8 | B | H | CH3 | o-CH3Ph | CH3 | (Z)-4-(o-tolylamino)pent-3-en-2-one |
| 9 | B | H | CH3 | o-FPh | CH3 | (Z)-4-(2-fluorophenylamino)pent-3-en-2-one |
| 10 | B | H | CH3 | o-ClPh | CH3 | (Z)-4-(2-chlorophenylamino)pent-3-en-2-one |
| 11 | B | H | CH3 | 2,6-diCH3Ph | CH3 | (Z)-4-(2,6-dimethylphenylamino)pent-3-en-2-one |
| 12 | B | H | CH3 | CH3 | CH3 | (Z)-4-(methylamino)pent-3-en-2-one |
| 13 | B | H | Ph | Isopropyl | CF3 | (Z)-1,1,1-trifluoro-4-(isopropylamino)-4-phenylbut-3-en-2-one |
| 14 | B | CH3 | CH3 | CH3 | CH3 | (Z)-3-methyl-4-(methylamino)pent-3-en-2-one |
| 15 | B | CH3 | CH3 | p-OCH3Ph | CH3 | (Z)-4-(4-methoxyphenylamino)-3-methylpent-3-en-2-one |
| 16 | C | H | CH3 | Ph | - | (Z)-ethyl 3-(phenylamino)but-2-enoate |
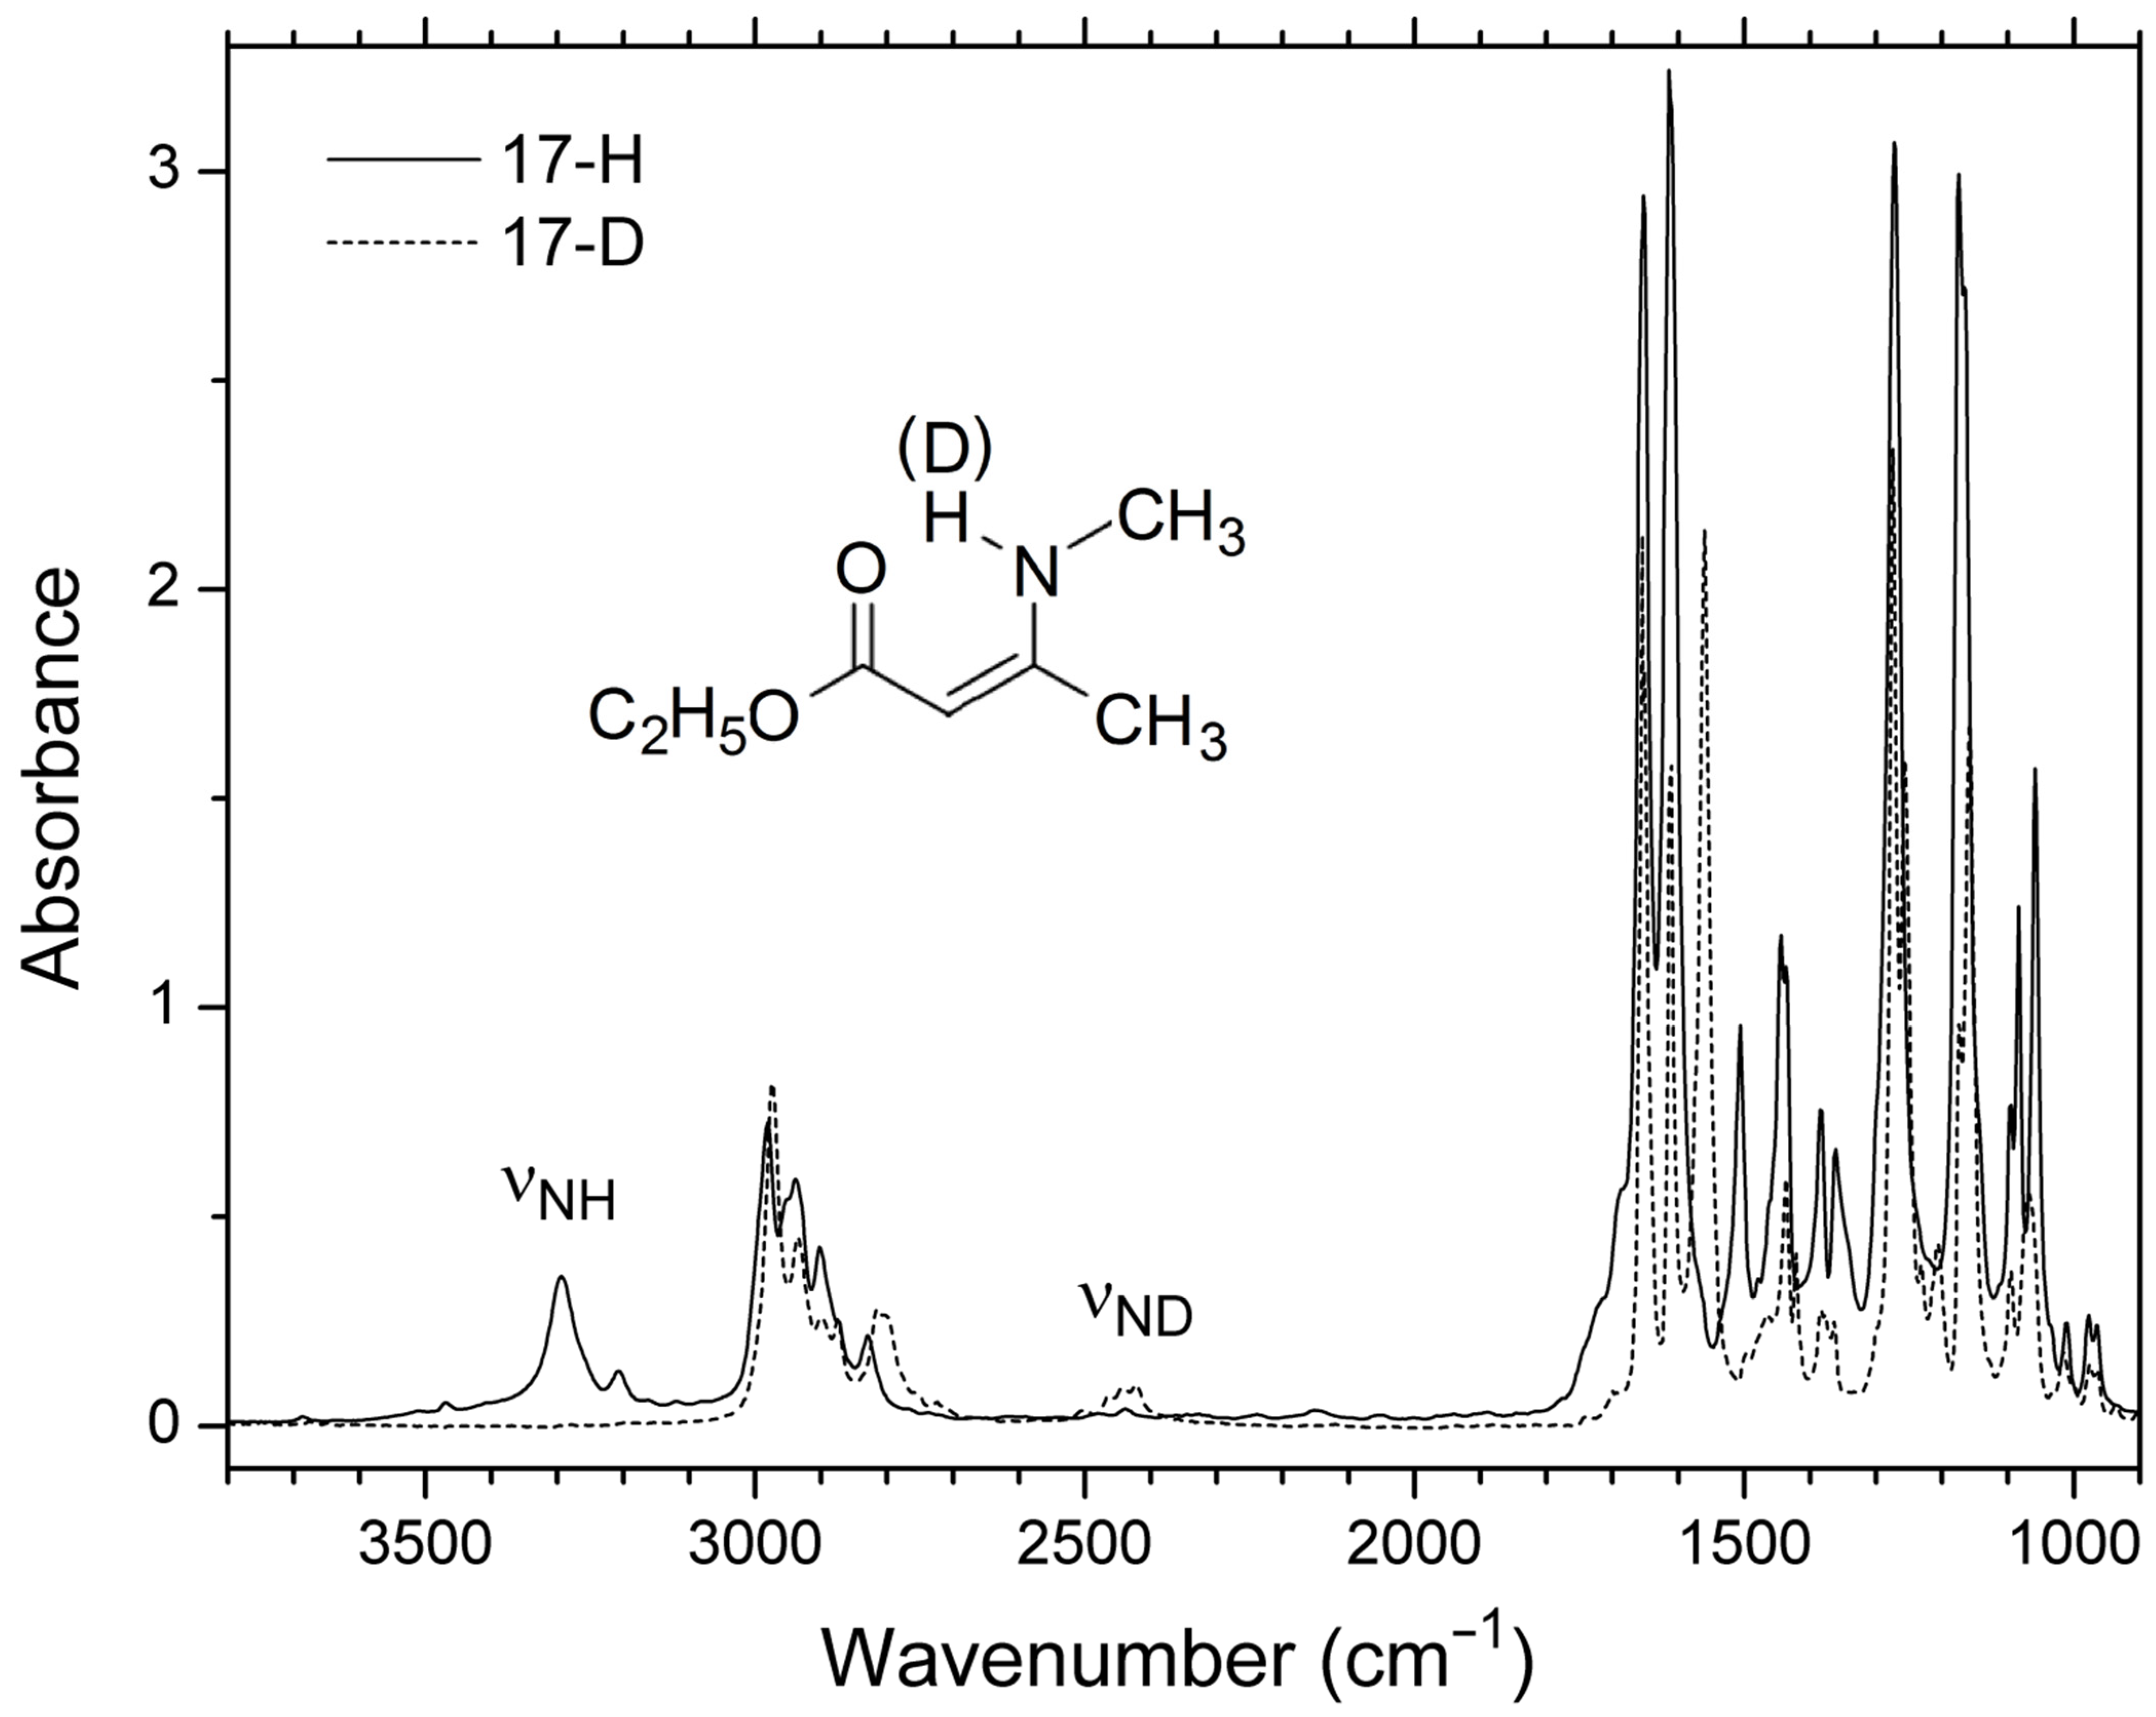
| 17 | C | H | CH3 | CH3 | - | (Z)-ethyl 3-(methylamino)but-2-enoate |
| 18 | C | CH3 | CH3 | Ph | - | (Z)-ethyl 2-methyl-3-(phenylamino)but-2-enoate |
| 19 | C | CH3 | CH3 | CH3 | - | (Z)-ethyl 2-methyl-3-(methylamino)but-2-enoate |
| 20 | C | CH3 | CH3 | CH2Ph | - | (Z)-ethyl 3-(benzylamino)-2-methylbut-2-enoate |
| 21 | C | H | CH3 | CH2Ph | - | (Z)-ethyl 3-(benzylamino)but-2-enoate |
| 22 | D | CH2CH2NH2 | - | - | - | (E)-3-(1-(2-aminoethylamino)ethylidene)-6-methyl-2H-pyran-2,4(3H)-dione |
| 23 | D | p-CH3OPh | - | - | - | (E)-3-(1-(4-methoxyphenylamino)ethylidene)-6-methyl-2H-pyran-2,4(3H)-dione |
| 24 | D | p-ClPh | - | - | - | (E)-3-(1-(4-chlorophenylamino)ethylidene)-6-methyl-2H-pyran-2,4(3H)-dione |
| 25 | E | m-CH3OPh | - | - | - | 5,5-dimethyl-3-(m-anisidino)-2-nitroso-2-cyclohexen-1-one |
| 26 | E | Ph | - | - | - | 5,5-dimethyl-3-anilino-2-nitroso-2-cyclohexen-1-one |
| 27 | F | CH3 | - | - | - | 5,5-dimethyl-2-(1-(methylamino)ethylidene)cyclohexane-1,3-dione |
| 28 | F | Iso-propyl | - | - | - | 2-(1-(isopropylamino)ethylidene)-5,5-dimethylcyclohexane-1,3-dione |
| 29 | F | Ph | - | - | - | 5,5-dimethyl-2-(1-(phenylamino)ethylidene)cyclohexane-1,3-dione |
| 30 | G | H | CH3 | - | n = 1 | (Z)-2-((methylamino)methylene)cyclopentanone |
| 31 | G | CH3 | CH3 | - | n = 1 | (Z)-2-(1-(methylamino)ethylidene)cyclopentanone |
| 32 | G | H | Bu | - | n = 2 | (Z)-2-((butylamino)methylene)cyclohexanone |
| 33 | H | CH3 | - | - | - | (E)-3-((methylamino)methylene)dihydrofuran-2(3H)-one |
| 34 | H | Ph | - | - | - | (Z)-3-((phenylamino)methylene)dihydrofuran-2(3H)-one |
| 35 | I | Et | COOEt | - | n = 1 | diethyl 2-(pyrrolidin-2-ylidene)malonate |
| 36 | I | Et | COOEt | - | n = 2 | diethyl 2-(piperidin-2-ylidene)malonate |
| 37 | I | Et | COOEt | - | n = 3 | diethyl 2-(azepan-2-ylidene)malonate |
| 38 | J | CH3 | CH3 | - | - | 2,2-dimethyl-5-(1-(methylamino)ethylidene)-1,3-dioxane-4,6-dione |
| 39 | J | Et | CH2COOEt | - | - | ethyl 2-(1-(2,2-dimethyl-4,6-dioxo-1,3-dioxan-5-ylidene)propylamino)acetate |
| 40 | K | - | - | - | - | (2E,4Z)-diethyl 2-(3,6-di(pyridin-2-yl)pyridazin-4-yl)-4-(1-(methylamino)-ethylidene)pent-2-enedioate |
| 41 | L | CH2OCOCH3 | CH2OCOCH3 | - | - | diethyl 2,6-bis(acetoxymethyl)-4-phenyl-1,4-dihydropyridine-3,5-dicarboxylate |
| 42 | L | CH3 | CH2OCOCH3 | - | - | diethyl 2-(acetoxymethyl)-6-methyl-4-phenyl-1,4-dihydropyridine-3,5-dicarboxylate |
| 43 | L | CH3 | CH3 | - | - | diethyl 2,6-dimethyl-4-phenyl-1,4-dihydropyridine-3,5-dicarboxylate |
| 44 | B | H | CH3 | p-PhCOOEt | CH3 | (Z)-ethyl 4-(4-oxopent-2-en-2-ylamino)benzoate |
| 45 | B | CH3 | CH3 | Ph | CH3 | (Z)-3-methyl-4-(phenylamino)pent-3-en-2-one |
| Compound 1 | 6-31G(d) | 6-311++G(d,p) | Observed | ||||||
|---|---|---|---|---|---|---|---|---|---|
| RNH | Harm | Anh | P(Harm)2 | Harm | P(Harm)3 | νNH | δNH | Ref. | |
| 1 | 1.0236 | 3410 | 3208 | 3247 | 3424 | 3251 | 3195 | - | [26] |
| 2 | 1.0224 | 3404 | 3176 | 3242 | 3400 | 3232 | 3190 | - | [27] |
| 3 | 1.0238 | 3411 | 3208 | 3248 | 3422 | 3250 | 3222 | - | [28] |
| 4 | 1.0221 | 3432 | 3214 | 3265 | 3441 | 3264 | 3206 | 10.21 | [29] |
| 5 | 1.0270 | 3341 | 3079 | 3182 | 3362 | 3200 | 3180 | - | [30] |
| 6 | 1.0303 | 3274 | 2932 | 3101 | 3244 | 3071 | 3031 4,5 | 12.48 | [31] |
| 7 | 1.0315 | 3209 | 2909 | 3001 | 3242 | 3068 | 3056 | 13.07 | [32] |
| 8 | 1.0305 | 3266 | 2973 | 3090 | 3253 | 3082 | 3058 5 | 12.34 | [33] |
| 9 | 1.0307 | 3268 | 2943 | 3093 | 3258 | 3089 | 3063 5 | 12.25 | [33] |
| 10 | 1.0306 | 3276 | - | 3104 | 3260 | 3091 | 3047 5 | 12.42 | [33] |
| 11 | 1.0311 | 3266 | - | 3090 | 3274 | 3108 | 3058 5 | 11.95 | [33] |
| 12 | 1.0263 | 3342 | 3052 | 3183 | 3349 | 3188 | 3171 | 10.70 | [9] |
| 13 | 1.0272 | 3340 | - | 3181 | 3344 | 3183 | 3205 | 11.11 | [34] |
| 14 | 1.0265 | 3322 | - | 3161 | 3311 | 3149 | 3041 5 | 11.86 | - |
| 15 | 1.0322 | 3226 | - | 3030 | 3205 | 3017 | 3004 4 | - | [35] |
| 16 | 1.0244 | 3382 | 3147 | 3223 | 3388 | 3223 | 3254 4 | 10.39 | [7] |
| 17 | 1.0194 | 3432 | 3247 | 3265 | 3469 | 3283 | 3295 | 8.46 | [7] |
| 18 | 1.0248 | 3363 | - | 3205 | 3360 | 3198 | - | - | - |
| 19 | 1.0199 | 3442 | - | 3272 | 3439 | 3263 | 3262 | 9.14 | - |
| 20 | 1.0215 | 3425 | - | 3259 | 3422 | 3250 | 3282 | 9.66 6 | [36] |
| 21 | 1.0217 | 3427 | - | 3261 | 3442 | 3265 | 3289 7 | 8.95 | [37] |
| 22 | 1.0377 | 3138 | 2782 | 2860 | 3102 | 2843 | 2870 | 14.18 | [38] |
| 23 | 1.0422 | 3059 | 2574 | 2653 | 3022 | 2665 | 2610 | 15.60 | [38] |
| 24 | 1.0440 | 3027 | 2591 | 2551 | 2978 | 2548 | 2602 | 15.90 | [38] |
| 25 | 1.0424 | 3050 | 2574 | 2626 | 3048 | 2728 | 2560 8 | 18.41 | [38] |
| 26 | 1.0418 | 3048 | 2584 | 2619 | 3031 | 2687 | 2340 8 | 18.35 | [38] |
| 27 | 1.0330 | 3208 | 2817 | 2999 | 3181 | 2981 | - | 13.3 | [7] |
| 28 | 1.0345 | 3172 | 2814 | 2932 | 3140 | 2913 | 2900 9 | 13.6 | [7] |
| 29 | 1.0386 | 3124 | 2743 | 2828 | 3077 | 2792 | 2760 | 15.2 | [7] |
| 30 | 1.0231 | 3420 | - | 3255 | 3440 | 3263 | - | 8.84 | [39] |
| 31 | 1.0245 | 3367 | - | 3209 | 3374 | 3210 | - | 10.26 | [40,41] |
| 32 | 1.0253 | 3381 | 3121 | 3222 | 3390 | 3224 | 3160 | - | [27] |
| 33 | 1.0118 | 3599 | - | 3359 | 3613 | 3362 | 3302 | 6.60 | [42] |
| 34 | 1.0216 | 3449 | - | 3277 | 3466 | 3281 | 3314 | 9.05 | [42] |
| 35 | 1.0194 | 3481 | - | 3299 | 3488 | 3296 | 3317 | 9.52 | [42] |
| 36 | 1.0236 | 3385 | - | 3226 | 3372 | 3209 | 3242 | 10.08 | [42] |
| 37 | 1.0222 | 3405 | - | 3243 | 3411 | 3241 | 3280 | 8.83 | [43] |
| 38 | 1.0262 | 3341 | - | 3182 | 3331 | 3170 | 3224 | 11.32 | [44] |
| 39 | 1.0292 | 3318 | - | 3157 | 3304 | 3142 | 3172 | 11.60 | [44] |
| 40 | 1.0217 | 3415 | - | 3251 | 3414 | 3244 | 3270 | - | [45] |
| 41 | 1.0148 | 3558 | - | 3341 | 3559 | 3336 | 3403 | 7.7 | [46] |
| 42 | 1.0153 | 3541 | - | 3333 | 3551 | 3332 | 3347 | 6.6 | [46] |
| 43 | 1.0092 | 3631 | - | 3372 | 3636 | 3371 | 3336 | 5.6 | [46] |
| 44 | 1.0308 | 3266 | - | 3090 | 3237 | 3062 | 3047 5 | 12.64 | [47] |
| 45 | 1.0322 | 3226 | - | 3030 | 3205 | 3017 | 2975 5 | 13.46 | [48] |
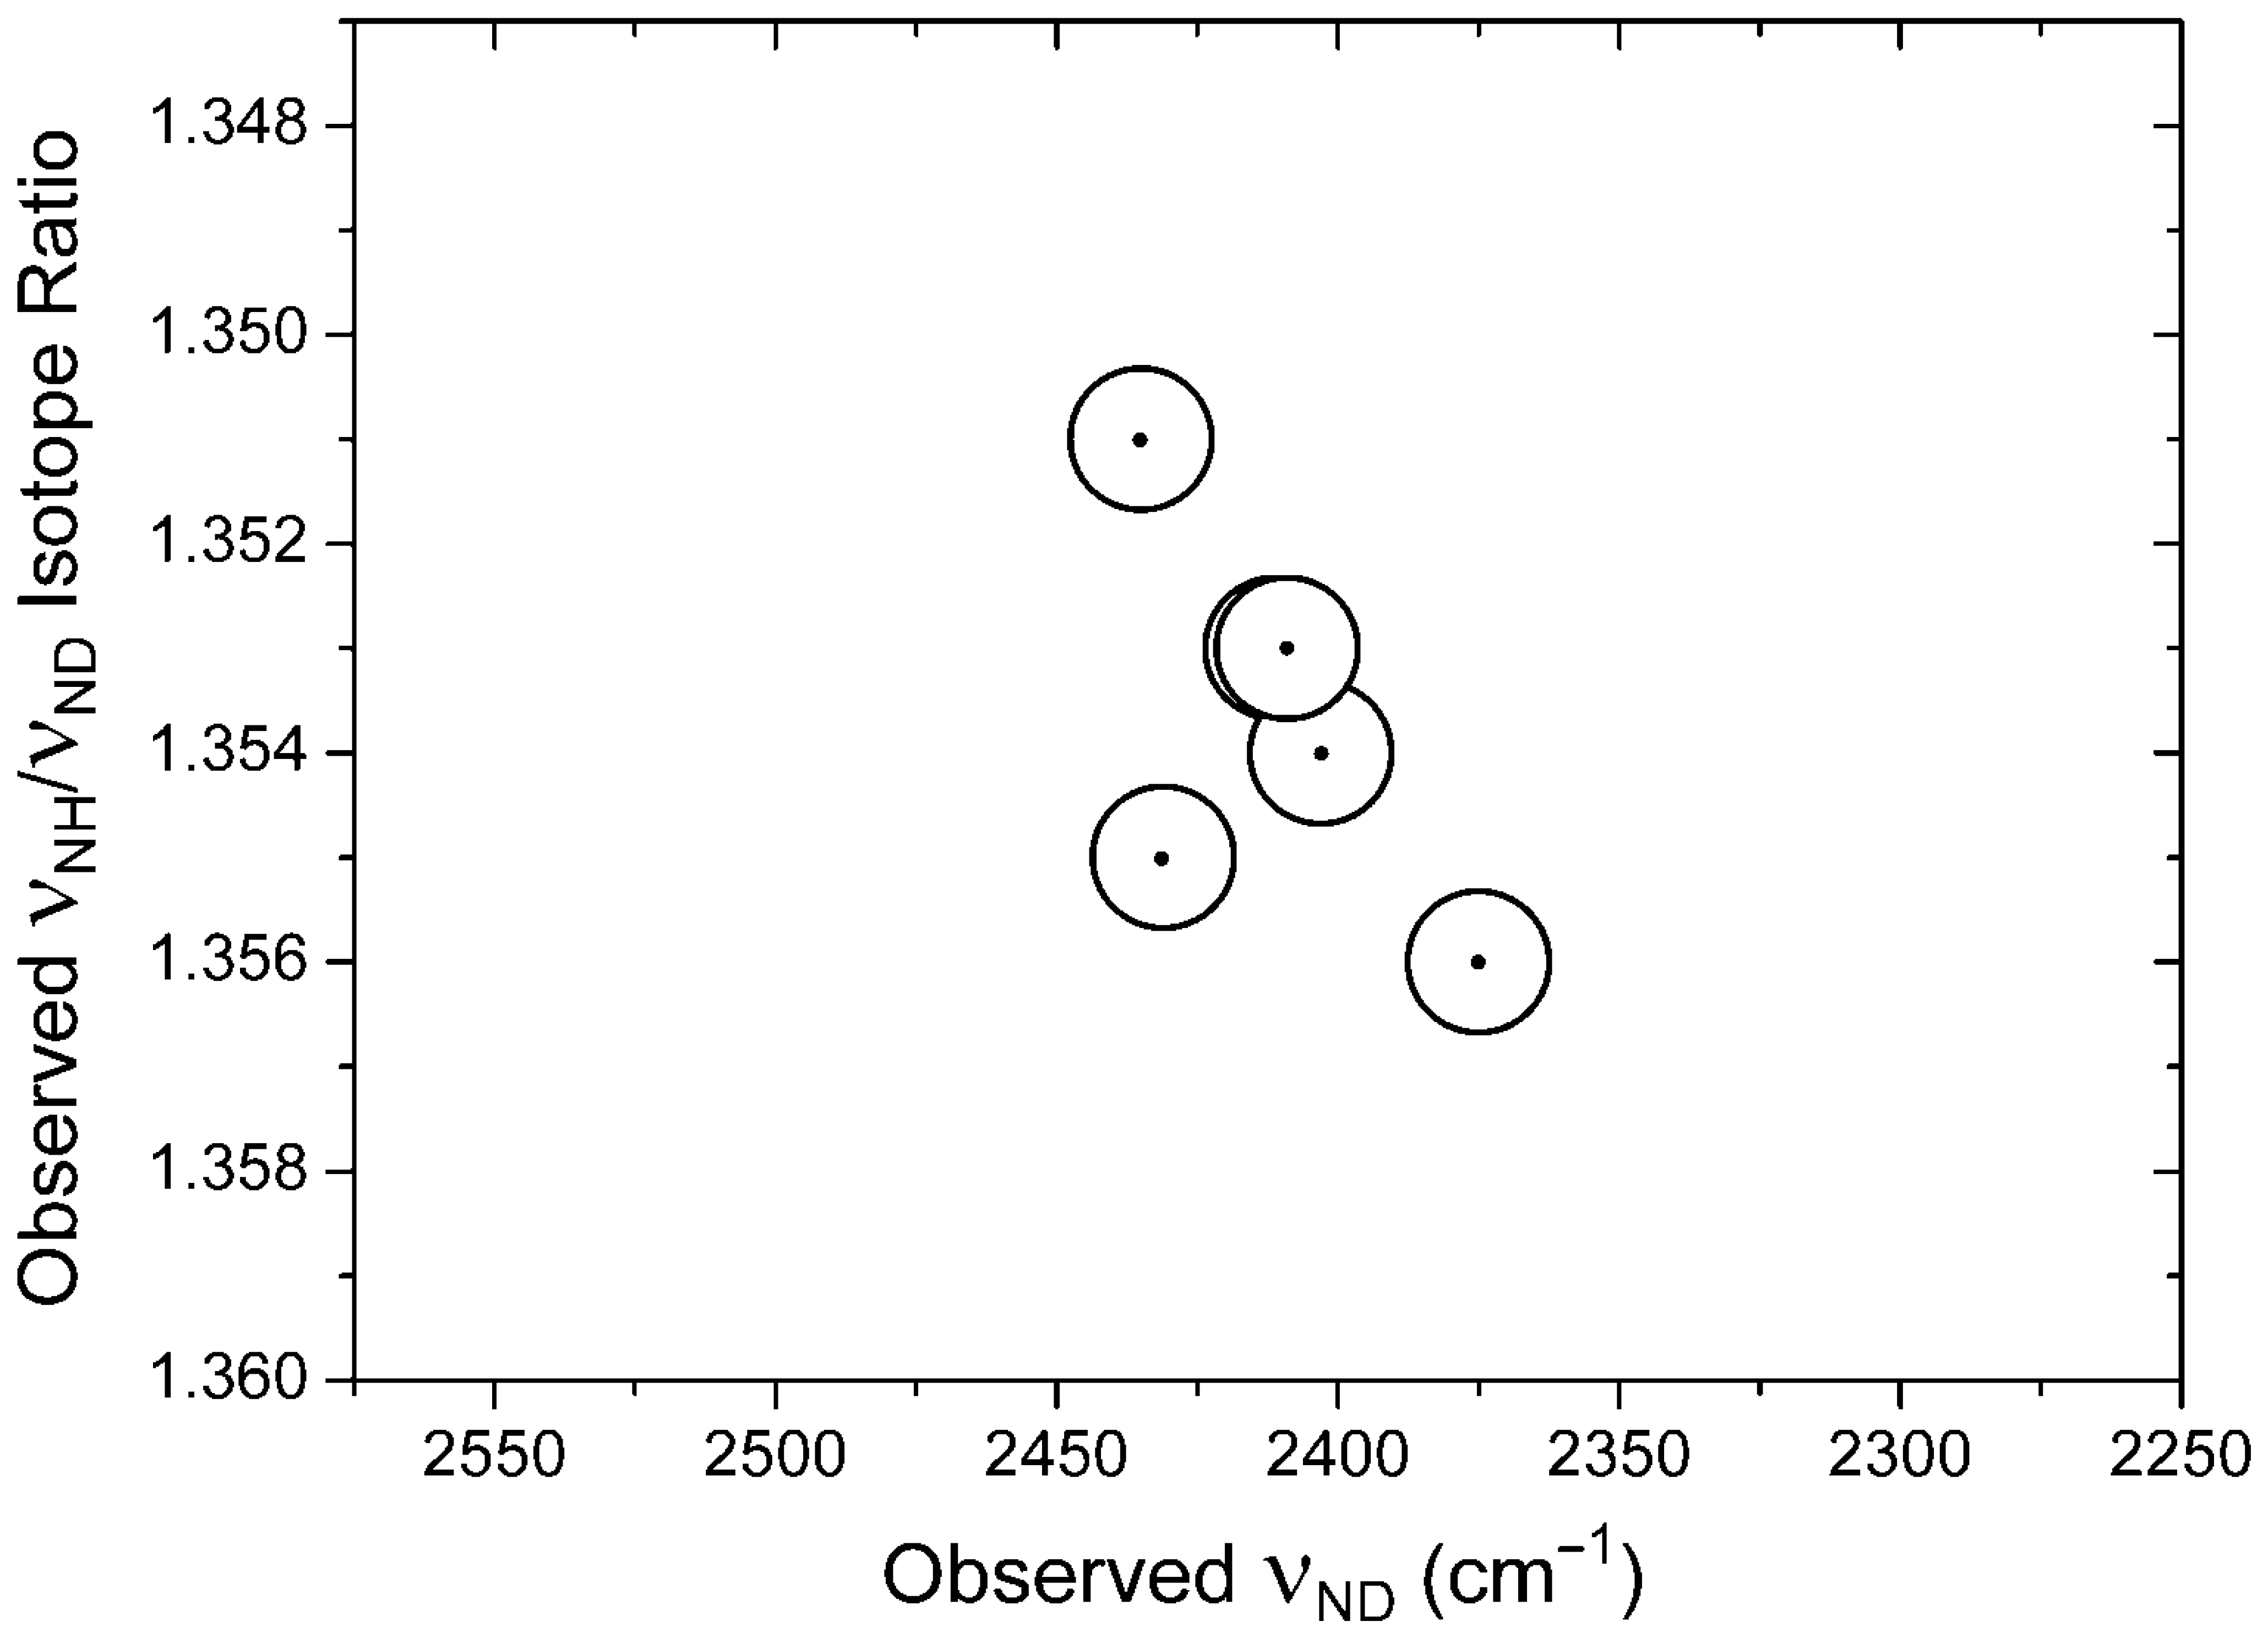
| Compound 1 | νNH | νND |
|---|---|---|
| 6 | 3031 2 | 2262 |
| 8 | 3058 2 | 2280 |
| 9 | 3063 2 | 2286 |
| 10 | 3047 2 | 2274 |
| 11 | 3058 2 | 2282 |
| 14 | 3041 2 | 2270 |
| 16 | 3254, 3185 3 | 2403 |
| 17 | 3295 | 2431 |
| 19 | 3262 | 2411 |
| 20 | 3259 | 2409 |
| 21 | 3289 | 2435 |
| 44 | 3047 2 | 2274 4 |
| 45 | 2975 2 | 2220 |
2. Materials and Methods
2.1. Materials
2.2. Spectroscopy
2.3. Calculational Details
3. Results
3.1. Experimental NH Stretching Wavenumbers
3.2. Calculations
3.3. Structures
4. Discussion
5. Conclusions
Supplementary Materials
Author Contributions
Funding
Institutional Review Board Statement
Informed Consent Statement
Data Availability Statement
Acknowledgments
Conflicts of Interest
References
- Hansen, P.E. Review: A Spectroscopic Overview of Intramolecular Hydrogen Bonds of NH…O,S,N Type. Molecules 2021, 26, 2409. [Google Scholar] [CrossRef] [PubMed]
- Pimentel, G.C.; McClellan, A.L. The Hydrogen Bond; W.H. Freeman: San Francisco, CA, USA, 1960. [Google Scholar]
- Vinograd, S.N.; Linnell, R.H. Hydrogen Bonding; Van Nostrand Reinhold: New York, NY, USA, 1971. [Google Scholar]
- Joesten, M.D.; Schaad, L.J. Hydrogen Bonding; Marcel Dekker: New York, NY, USA, 1974. [Google Scholar]
- Arunan, E.; Desiraju, G.R.; Klein, R.A.; Sadlej, J.; Scheiner, V.; Alkorta, I.; Clary, D.C.; Crabtree, R.H.; Dannenberg, J.J.; Hobza, P.; et al. Definition of the hydrogen bond (IUPAC Recommendation 2011). Pure Appl. Chem. 2011, 83, 1537–1641. [Google Scholar] [CrossRef]
- Tayyari, S.F.; Zeegers-Hyuskens, T.; Wood, J.L. Spectroscopic study of hydrogen bonding in the enol form of β-diketones—II. Symmetry of the hydrogen bond. Spectrochim. Acta A 1979, 35, 1289–1295. [Google Scholar] [CrossRef]
- Dudek, G.O. Spectroscopic Studies of Keto—Enol Equilibria. VIII. Schiff Base Spectroscopic Correlations. J. Org. Chem. 1965, 30, 548–552. [Google Scholar] [CrossRef]
- Kidwai, M.; Bhardwaj, S.; Misshra, N.K.; Bansal, V.; Kumar, A.; Mozumdar, S. A novel method for the synthesis of β-enaminones using Cu-nanoparticles as catalyst. Catal. Commun. 2009, 10, 1514–1517. [Google Scholar] [CrossRef]
- Raissi, H.; Moshfeghi, E.; Farzad, F. Vibrational assignment, structure and intramolecular hydrogen bond of 4-methylamino-3-penten-2-one. Spectrochim. Acta A 2005, 62, 1004–1015. [Google Scholar] [CrossRef]
- Hansen, B.K.V.; Winther, M.; Spanget-Larsen, J. Intramolecular hydrogen bonding. Spectroscopic and theoretical studies of vibrational transitions in dibenzoylmethane enol. J. Mol. Struct. 2006, 790, 74–79. [Google Scholar] [CrossRef]
- Hadži, D. (Ed.) Theoretical Treatment of Hydrogen Bonding; Wiley: Chichester, UK, 1997. [Google Scholar]
- Ferrari, B.C.; Bennett, C.J. A Comparison of Medium-Sized Basis Sets for the Prediction of Geometries, Vibrational Frequencies, Infrared Intensities and Raman Activities for Water. J. Phys. Conf. Ser. 2019, 1290, 012013. [Google Scholar] [CrossRef]
- Foresman, J.B.; Frisch, A.E. Exploring Chemistry with Electronic Structure Methods, 3rd ed.; Gaussian, Inc.: Wallingford, CT, USA, 2015. [Google Scholar]
- Scott, A.P.; Radom, L. Harmonic Vibrational Frequencies: An Evaluation of Hartree-Fock, Møller-Plesset, Quadratic Configuration Interaction, Density Functional Theory, and Semiempirical Scale Factors. J. Phys. Chem. 1996, 100, 16502–16513. [Google Scholar] [CrossRef]
- Wong, M.W. Vibrational frequency prediction using density functional theory. Chem. Phys. Lett. 1996, 256, 391–399. [Google Scholar] [CrossRef]
- Becke, A.D. Perspective: Fifty years of density-functional theory in chemical physics. J. Chem. Phys. 2014, 140, 18A301. [Google Scholar] [CrossRef] [PubMed]
- Becke, A.D. Density functional thermochemistry. III. The role of exact exchange. J. Chem. Phys. 1993, 98, 5648–5652. [Google Scholar] [CrossRef]
- Lee, C.; Yang, W.; Parr, R.G. Development of the Colle-Salvetti correlation-energy formula into a functional of the electron density. Phys. Rev. B. 1988, 37, 785–789. [Google Scholar] [CrossRef]
- Perdew, J.P.; Wang, Y. Accurate and simple analytic representation of the electron gas correlation energy. Phys. Rev. B 1992, 45, 13244–13249. [Google Scholar] [CrossRef]
- Spanget-Larsen, J.; Hansen, B.K.V.; Hansen, P.E. OH stretching frequencies in systems with intramolecular hydrogen bonds. Harmonic and anharmonic analyses. Chem. Phys. 2011, 389, 107–115. [Google Scholar] [CrossRef]
- Hansen, P.E.; Spanget-Larsen, J. Prediction of OH Stretching frequencies in systems with intramolecular hydrogen bonds. J. Mol. Struct. 2012, 1018, 8–13. [Google Scholar] [CrossRef]
- Barone, V. Anharmonic vibrational properties by a fully automated second order pertubative approach. J. Chem. Phys. 2005, 122, 14108. [Google Scholar] [CrossRef]
- Barone, V.; Biczysko, M.; Bloino, J. Fully anharmonic IR and Raman spectra of medium-size molecular systems: Accuracy and interpretation. Phys. Chem. Chem. Phys. 2014, 16, 1759–1787. [Google Scholar] [CrossRef] [PubMed]
- Hansen, P.E.; Spanget-Larsen, J. Review: NMR and IR Investigations of Strong Intramolecular Hydrogen Bonds. Molecules 2017, 22, 552. [Google Scholar] [CrossRef]
- Hansen, P.E.; Jezierska, A.; Panek, J.; Spanget-Larsen, J. Theoretical Calculations Are a Strong Tool in the Investigation of Strong Intramolecular Hydrogen Bonds. In Molecular Spectroscopy: A Quantum Chemistry Approach; Ozaki, Y., Wójcik, M.J., Popp, J., Eds.; Wiley-VCH: Weinheim, Germany, 2019; Volume 1, Chapter 8; pp. 215–251. [Google Scholar]
- Dabrowski, J. IR Spectra and Structure of substituted unsaturated Carbonyl compounds. X. β-alkylaminoacroleins. J. Mol. Struct. 1969, 3, 227–233. [Google Scholar] [CrossRef]
- Dabrowski, J.; Dabrowska, U. Infrarotspektren und Struktur substituierter ungesättigter Carbonylverbindungen, VII. Enaminoketone mit starrer s-cis- und s-trans-Konformation und sekundär Aminogruppe. Chem. Ber. 1968, 101, 2365–2374. [Google Scholar] [CrossRef]
- Vdovenko, S.I.; Gerus, I.I.; Pagacz-Kostrzewa, M.; Wierzejewska, M.; Zhuk, Y.I.; Kukhar, V.P. Special feature of kinetics of ZcE isomerisation of β-N-methylaminovinyl trifluoromethyl ketone in Ar matrix exposed to UV radiation and spontaneous E⇆Z isomerization of α-methyl-β-N-methylaminovinyl trifloromethyl ketone. Spectrochim. Acta A 2018, 199, 130–140. [Google Scholar] [CrossRef]
- Vdovenko, S.I.; Gerus, I.I.; Zhuk, Y.I.; Kukhar, V.P.; Pagacz-Kostrzewa, M.; Wierzejewska, M.; Daniluc, C.-G. The conformation analysis of push-pull enaminones using FTIR and NMR spectroscopy and quantum mechanical calculations.VI. 4-N-Methyl-aminovinyl trifluoromethyl ketone and 3-methyl-2-N-methylaminovinyl trifluoromethyl ketone. J. Mol. Struct. 2017, 1128, 741–753. [Google Scholar] [CrossRef]
- Chiara, J.L.; Gómez-Sánchez, A.; Bellanato, J. Spectral properties and isomerism of nitroenamines. Part 4. β-Amino-α-nitro-α,β-unsaturated ketones. J. Chem. Soc. Perkin Trans. 2 1998, 8, 1797–1806. [Google Scholar] [CrossRef][Green Version]
- Das, B.; Venkateswarly, K.; Majhi, A.; Reddy, M.R.; Reddy, K.N.; Rao, Y.K.; Ravikumar, K.; Sridhar, B. Highly efficient, mild and chemo- and stereoselective synthesis of enaminones and enamino esters using silica supported perchloric acid under solvent-free conditions. J. Mol. Catal. A 2006, 246, 276–281. [Google Scholar] [CrossRef]
- Patil, S.A.; Gonzalez-Flores, D.; Medina, P.A.; Dever, S.; Stentzel, M.; Popp, J.; Pineda, L.W.; Montero, M.L.; Ziller, J.W.; Fahlman, B.D. Synthesis, Characterization and Crystal Structure of (Z)-3-(4-Chlorophenylamino)-1-Phenylbut-2-En-1-One. J. Chem. Crystallogr. 2012, 42, 543–548. [Google Scholar] [CrossRef]
- Zheglova, D.K.; Genov, D.G.; Bolvig, S.; Hansen, P.E. Deuterium Isotope Effects on 13C Chemical Shifts of Enaminones. Acta Chem. Scand. 1997, 51, 1016–1023. [Google Scholar] [CrossRef]
- Chipanina, N.N.; Oznobikhina, L.P.; Aksamentova, T.N.; Romanov, A.R.; Rulev, A.Y. Intramolecular hydrogen bond in the push-pull CF3-aminoenones: DFT and FTIR study, NBO analysis. Tetrahedron 2014, 70, 1207–1213. [Google Scholar] [CrossRef]
- Chen, X.; She, J.; Shang, Z.; Wu, J.; Wu, H.; Zhang, P. Synthesis of Pyrazoles, Diazepines, Enaminones, and Enamino Esters using 12-Tungstophosporic Acid as a Reusable Cata-lyst in Water. Synthesis 2008, 21, 3478–3486. [Google Scholar]
- Wang, D.; Zhang, L.; Luo, S. Visible Light Promoted β-C–H Alkylation of β-Ketocarbonyls via a β-Enaminyl Radical Intermediate. Chin. J. Chem. 2018, 36, 311–320. [Google Scholar] [CrossRef]
- Sánchez, A.G.; Valle, A.M.; Bellanato, J. Infrared Absorption and Isomerism of 3-Aminocrotonic Esters. Part I. 3-(Alkylamino)crotonic Esters. J. Chem. Soc. B: Phys. Org. 1971, 2330–2335. [Google Scholar] [CrossRef]
- Gilli, P.; Bertolasi, V.; Ferretti, V.; Gilli, G. Evidence for Intramolecular N-H···O Resonance-Assisted Hydrogen Bonding in β-Enaminones and Related Heterodienes. A Combined Crystal-Structural, IR and NMR Spectroscopic, and Quantum-Mechanical Investigation. J. Am. Chem. Soc. 2000, 122, 10405–10417. [Google Scholar] [CrossRef]
- Hansen, P.E.; Bolvig, S.; Duus, F.; Petrova, M.V.; Kawecki, R.; Krajewski, R.; Kozerski, L. Deuterium Isotope Effects on 13C Chemical Shifts of Intramolecular Hydrogen-Bonded Olefins. Magn. Reson. Chem. 1995, 33, 621–631. [Google Scholar] [CrossRef]
- Štefane, B.; Polanc, S. A new and a convenient route to enaminones and pyrazoles. New J. Chem. 2002, 26, 28–32. [Google Scholar] [CrossRef]
- Valduga, C.J.; Squizani, A.; Braibante, H.S.; Braibante, M.E.F. The Use of K-10/Ultrasound in the Selective Synthesis of Unsymmetrical β-Enamino Ketones. Synthesis 1998, 1019–1022. [Google Scholar] [CrossRef]
- Koduri, N.D.; Hileman, B.; Cox, J.D.; Scott, H.; Hoang, P.; Robbins, A.; Bowers, K.; Tsebaot, L.; Miao, K.; Castaned, M.; et al. Acceleration of the Eschenmoser coupling reaction by sonication: Efficient synthesis of enaminones. RSC Adv. 2013, 3, 181–188. [Google Scholar] [CrossRef]
- Célérier, J.-P.; Deloisy, E.; Hommet, G.L.; Maittte, P. Lactim Ether Chemistry. Cyclic β-Enamino Ester Synthesis. J. Org. Chem. 1979, 44, 3089. [Google Scholar] [CrossRef]
- Ullah, S.; Zhang, W.; Hansen, P.E. Deuterium Isotope Effects on 13C and 15N Chemical Shifts of Intramolecularly Hydrogen-Bonded β-Enamine Derivatives of Meldrum’s and Tetronic acid. J. Mol. Struct. 2010, 976, 377–391. [Google Scholar] [CrossRef]
- Balogh, M.; Laszlo, P.; Simon, K. Unusual Reactions between 1,4-Dihydropyridines and 1,2,4,5-Tetrazines in the Presence of K-10/Fe(III) Clay Catalyst. J. Org. Chem. 1987, 52, 2026–2029. [Google Scholar] [CrossRef]
- Petrova, M.; Muhamadejev, R.; Vigante, B.; Duburs, G.; Liepinsh, E. Intramolecular hydrogen bonds in 1,4-dihydropyridine derivatives. R. Soc. Open. Sci. 2018, 5, 180088. [Google Scholar] [CrossRef]
- Darugar, V.; Vakili, M.; Tayyari, S.F.; Hansen, P.E.; Kamounah, F.S. Molecular structure, intramolecular hydrogen bond strength, vibrational assignment, and spectroscopic insight of 4-phenylamino-3-penten-2-one and its derivatives: A theoretical and experimental study. J. Mol. Liq. 2021, 334, 116035. [Google Scholar] [CrossRef]
- Seyedkatouli, S.; Vakili, M.; Tayyari, S.F.; Hansen, P.E.; Kamounah, F.S. Molecular structure and intramolecular hydrogen bond strength of 3-methyl-4-amino-3-penten-2-one and its N-Me and N-Ph substitutions by experimental and theoretical methods. J. Mol. Struct. 2019, 1184, 233–245. [Google Scholar] [CrossRef]
- Frisch, M.J.; Trucks, G.W.; Schlegel, H.B.; Scuseria, G.E.; Robb, M.A.; Cheeseman, J.R.; Scalmani, G.; Barone, V.; Mennucci, B.; Petersson, G.A.; et al. Gaussian 09; Revision D.01; Gaussian, Inc.: Wallingford, CT, USA, 2009. [Google Scholar]
- Frisch, M.J.; Trucks, G.W.; Schlegel, H.B.; Scuseria, G.E.; Robb, M.A.; Cheeseman, J.R.; Scalmani, G.; Barone, V.; Petersson, G.A.; Nakatsuji, H.; et al. Gaussian 16; Revision A.03; Gaussian, Inc.: Wallingford, CT, USA, 2016. [Google Scholar]
- Biegler-König, F.W.; Schönbohm, J.; Bayles, D. Software news and updates—AIM2000—A program to analyze and visualize atoms in molecules. J. Comp. Chem. 2001, 22, 545–559. [Google Scholar]
- Mroginski, M.-A.; Németh, K.; Bauschlicher, T.; Klotzbücher, W.; Goddard, R.; Heinemann, O.; Hildebrandt, P.; Mark, F. Calculation of Vibrational Spectra of Linear Tetrapyrroles. 3. Hydrogen-Bonded Hexamethylpyrromethene Dimers. J. Phys. Chem. A 2005, 109, 2139–2150. [Google Scholar] [CrossRef]
- Novak, A. Hydrogen Bonding in Solids, Correlation of Spectroscopic and Crystallographic Data. Struct. Bond. 1974, 18, 177–216. [Google Scholar]
- Sobczyk, L.; Obrzud, M.; Filarowski, A. H/D Isotope Effects in Hydrogen Bonded Systems. Molecules 2013, 18, 4467–4476. [Google Scholar] [CrossRef] [PubMed]
- Rodríguez, M.; Santillan, R.; López, Y.; Farrán, N.; Barba, V.; Nakatani, K.; García-Baéz, E.V.; Padilla-Martínez, I.I. N–H·O Assisted Structural Changes Induced on Ketoenamine Systems. Supramol. Chem. 2007, 19, 641–653. [Google Scholar] [CrossRef]
- Hansen, P.E.; Koch, A.; Kleinpeter, E. Ring Current and Anisotropy Effects on OH Chemical Shifts. Tetrahedron Lett. 2018, 59, 22188–22192. [Google Scholar] [CrossRef]
- Hansen, P.E. Isotope Effects on Chemical Shifts of Hydrogen Bonded Systems. J. Label. Comp. Radiopharm. 2007, 50, 967–981. [Google Scholar] [CrossRef]
- Espinosa, E.; Molins, E.; Lecomte, C. Hydrogen bond strengths revealed by topological analyses of experimentally observed electron densities. Chem. Phys. Lett. 1998, 285, 170–173. [Google Scholar] [CrossRef]
- Benkheira, F.Z.; Amari, M. Etude Spectroscopique de l’équilibre enaminone—Iminenol de la reaction de l’acide dehydroacetique avec les amines primaires. J. Mar. Chim. Heterocycl. 2016, 15, 85–91. [Google Scholar]
- Kolev, T.M.; Angelov, P. 1,1,1-Trichloro-3-(1-phenethylamino-ethylidene)-pentane-2,4-dione—Synthesis, spectroscopic, theoretical and structural elucidation. J. Phys. Org. Chem. 2007, 20, 1108–1113. [Google Scholar] [CrossRef]


Publisher’s Note: MDPI stays neutral with regard to jurisdictional claims in published maps and institutional affiliations. |
© 2021 by the authors. Licensee MDPI, Basel, Switzerland. This article is an open access article distributed under the terms and conditions of the Creative Commons Attribution (CC BY) license (https://creativecommons.org/licenses/by/4.0/).
Share and Cite
Hansen, P.E.; Vakili, M.; Kamounah, F.S.; Spanget-Larsen, J. NH Stretching Frequencies of Intramolecularly Hydrogen-Bonded Systems: An Experimental and Theoretical Study. Molecules 2021, 26, 7651. https://doi.org/10.3390/molecules26247651
Hansen PE, Vakili M, Kamounah FS, Spanget-Larsen J. NH Stretching Frequencies of Intramolecularly Hydrogen-Bonded Systems: An Experimental and Theoretical Study. Molecules. 2021; 26(24):7651. https://doi.org/10.3390/molecules26247651
Chicago/Turabian StyleHansen, Poul Erik, Mohammad Vakili, Fadhil S. Kamounah, and Jens Spanget-Larsen. 2021. "NH Stretching Frequencies of Intramolecularly Hydrogen-Bonded Systems: An Experimental and Theoretical Study" Molecules 26, no. 24: 7651. https://doi.org/10.3390/molecules26247651
APA StyleHansen, P. E., Vakili, M., Kamounah, F. S., & Spanget-Larsen, J. (2021). NH Stretching Frequencies of Intramolecularly Hydrogen-Bonded Systems: An Experimental and Theoretical Study. Molecules, 26(24), 7651. https://doi.org/10.3390/molecules26247651