Article

Determination of 60 Migrant Substances in Plastic Food Contact Materials by Vortex-Assisted Liquid-Liquid Extraction and GC-Q-Orbitrap HRMS

1
Foundation for the Promotion of Health and Biomedical Research in the Valencian Region (FISABIO), Avinguda Catalunya 21, 46020 Valencia, Spain
2
Department of Analytical Chemistry, University of Valencia, Avinguda Doctor Moliner 50, 46100 Burjassot, Spain
3
Public Health Laboratory of Valencia, Avinguda Catalunya 21, 46020 Valencia, Spain
*
Author to whom correspondence should be addressed.
Molecules 2021, 26(24), 7640; https://doi.org/10.3390/molecules26247640
Submission received: 3 December 2021 / Revised: 14 December 2021 / Accepted: 14 December 2021 / Published: 16 December 2021
(This article belongs to the Special Issue Food Contact Materials: Migration and Analysis)

Abstract

:
A GC-HRMS analytical method for the determination of 60 migrant substances, including aldehydes, ketones, phthalates and other plasticizers, phenol derivatives, acrylates, and methacrylates, in plastic food contact materials (FCM) has been developed and validated. The proposed method includes migration tests, according to Commission Regulation (EU) 10/2011, using four food simulants (A, B, C, and D1), followed by vortex-assisted liquid–liquid extraction (VA-LLE) and GC-Q-Orbitrap HRMS analysis in selected ion monitoring (SIM) mode, with a resolving power of 30,000 FWHM and a mass accuracy ≤5 ppm. The method was validated, showing satisfactory linearity (R2 ≥ 0.98 from 40 to 400 µg L−1), limits of quantification (40 µg L−1), precision (RSD, 0.6–12.6%), and relative recovery (81–120%). The proposed method was applied to the analysis of field samples, including an epoxy-coated tin food can, a drinking bottle made of Tritan copolyester, a disposable glass made of polycarbonate, and a baby feeding bottle made of polypropylene, showing that they were in compliance with the current European regulation regarding the studied substances.

Graphical Abstract

1. Introduction

In Europe, the ‘Commission Regulation (EU) No 10/2011 of 14 January 2011 on plastic materials and articles intended to come into contact with food’ [1] (henceforth, Regulation 10/2011) contains the ‘Union list of authorized substances‘ (IAS), which establishes the specific migration limits (SML) that they should comply with in order to ensure the safety of the consumers. Moreover, non-intentionally added substances (NIAS) could also be present in plastic food contact materials (FCM) as impurities of the authorized substances, reaction, or degradation products, formed during the manufacture, storage, or consumption processes [2]. In this sense, the development and validation of analytical methods for the quantification of migrant substances, both IAS and NIAS, in plastic FCM using food simulants are a matter of importance and a research field of growing interest [3,4,5,6].
In the analytical literature, several works regarding the analysis of migrant substances from plastic FCM have been published in recent years. Some of them use screening or non-target approaches for the identification of IAS, NIAS, and unknown migrant substances [7,8,9,10,11,12,13,14], while other published papers deal with the target analysis of selected migrant substances, such as phthalates and plasticizers by gas chromatography (GC) coupled to mass spectrometry (MS) [15,16,17,18]; light stabilizers and antioxidants by liquid chromatography (LC) coupled to ultraviolet-visible spectrophotometry (UV) [19,20], tandem mass spectrometry (MS/MS) [21], and high-resolution mass spectrometry (HRMS) [22]; phenolic compounds, such as 4-nonylphenol by GC-MS [23]; bisphenols, their diglycidyl ethers, and other derivatives by GC-MS [24], LC-UV [25], and LC-HRMS [26]; and primary aromatic amines by GC-MS [27], LC-MS/MS [28], and LC-HRMS [29], among other groups of substances. More information regarding the analytical methods for the target analysis of migrant substances from plastic FCM can be found in several recent review articles published on this topic [4,5,30,31,32,33].
While most of the published studies are focused on the analysis of particular families or groups of substances with a reduced number of target analytes, few multi-residue or multi-analyte methods are available in the analytical literature. The most significant are the determination of 48 contaminant residues in food contact plastic products by microwave-assisted extraction, using methanol as an alternative ‘non-regulated’ food simulant, followed by LC-HRMS, published by Zhang et al. [34]; the determination of 84 migrant substances using food simulants A and C, followed by liquid–liquid extraction using dichloromethane as extraction solvent and GC-MS, published by Tsochatzis et al. [35]; and the determination of 75 migrant substances using food simulants A, C, and D1, followed by salt-assisted liquid–liquid extraction using dichloromethane as extraction solvent and GC-MS/MS, also published by Tsochatzis et al. [36]. Moreover, GC presents the handicap of not being directly compatible with the hydro-ethanolic food simulants of Regulation 10/2011 [1]. For this reason, it is required to use alternative food simulants [17,18,23], such as organic solvents, or to perform a liquid-phase [15,35,36] or a solid-phase extraction [24,27] in order to enable the GC analysis. With regard to the detection technique, currently there are no published methods that use GC coupled to HRMS, which enhances the identification and confirmation confidence of the migrant substances by means of their exact masses.
To the best of our knowledge, this is the first work addressing a simple and reliable analytical procedure for the determination of 60 migrant substances in plastic FCM using four food simulants (A, B, C, and D1), according to Regulation 10/2011 [1], followed by vortex-assisted liquid–liquid extraction (VA-LLE), using only n-hexane as an extraction solvent, and GC-Q-Orbitrap HRMS analysis.
However, in the current market, there is a wide variety of FCM made of different plastics and polymer materials, such as epoxy-coatings, polypropylene (PP), polyethylene (PE), polyethylene terephthalate (PET), polycarbonate (PC), and polyester copolymers, among others. Furthermore, not all the studied substances, both IAS and NIAS, may be relevant for all the plastic FCM. In this sense, a fast and reliable multi-analyte method to quantify a large set of GC-suitable migrant substances, such as those proposed in the present manuscript, could be useful for food control authorities in order to evaluate compliance of plastic FCM with current European regulations as a part of a comprehensive analytical control plan [1,37].

2. Results and Discussion

2.1. Selection of the Target Analytes

The abovementioned Regulation 10/2011 [1], in its ‘Union list of authorized substances’, contains approximately one thousand IAS and their applicable restrictions, including SML. Moreover, NIAS should also be controlled to ensure that their migration does not surpass the established limits [1].
From this enormous number of substances to be controlled, the selection of the target analytes was performed on the basis of two criteria: their analytical standards should be commercially available, and they should be suitable for determination with the selected analytical technique, GC-HRMS (mainly hydrophobic organic compounds). In this sense, inorganic substances, such as oxides, hydroxides, silicates, and metals; macromolecules and oligomers, such as sugars, waxes, and resins; and highly polar compounds, such as acids, alcohols, and amines were not considered. Finally, a representative set of 60 substances, including aldehydes, ketones, phthalates and other plasticizers, phenol derivatives, acrylates, and methacrylates, among others, were selected as target analytes (see Table 1). However, this list of target analytes was not meant to be exhaustive, and it could be extended if necessary.

2.2. Selection of the Quantification and Confirmation Ions

In order to select the quantification and confirmation ions of the target analytes for their acquisition in SIM mode (see Section 3.4.4), individual standard solutions containing the target analytes at 400 µg L−1 in n-hexane were prepared and injected directly into the GC-HRMS system in full scan mode with a resolving power of 60,000 FWHM, in order to obtain their HRMS spectrum. For each target substance, the most abundant fragment ions were selected as quantification and confirmation ions, respectively (see Table S1). If possible, the molecular formulas of the selected fragment ions were obtained, and their theoretical exact masses were considered for further acquisition.
As an example, the chromatographic peak and the selected fragment ions for Octocrylene, with their exact masses, are shown in Figure 1.

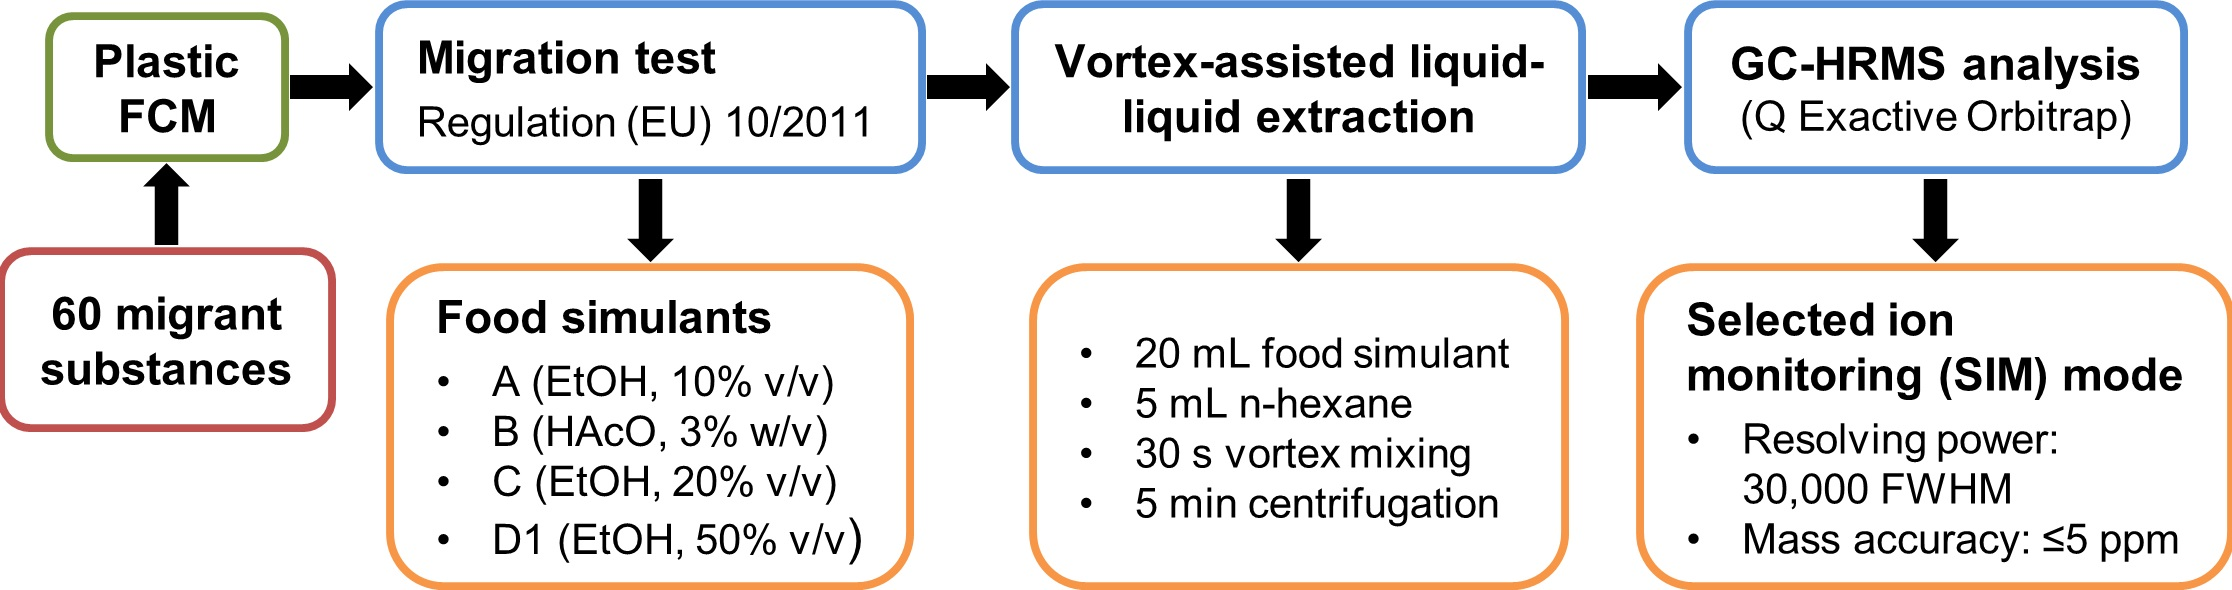
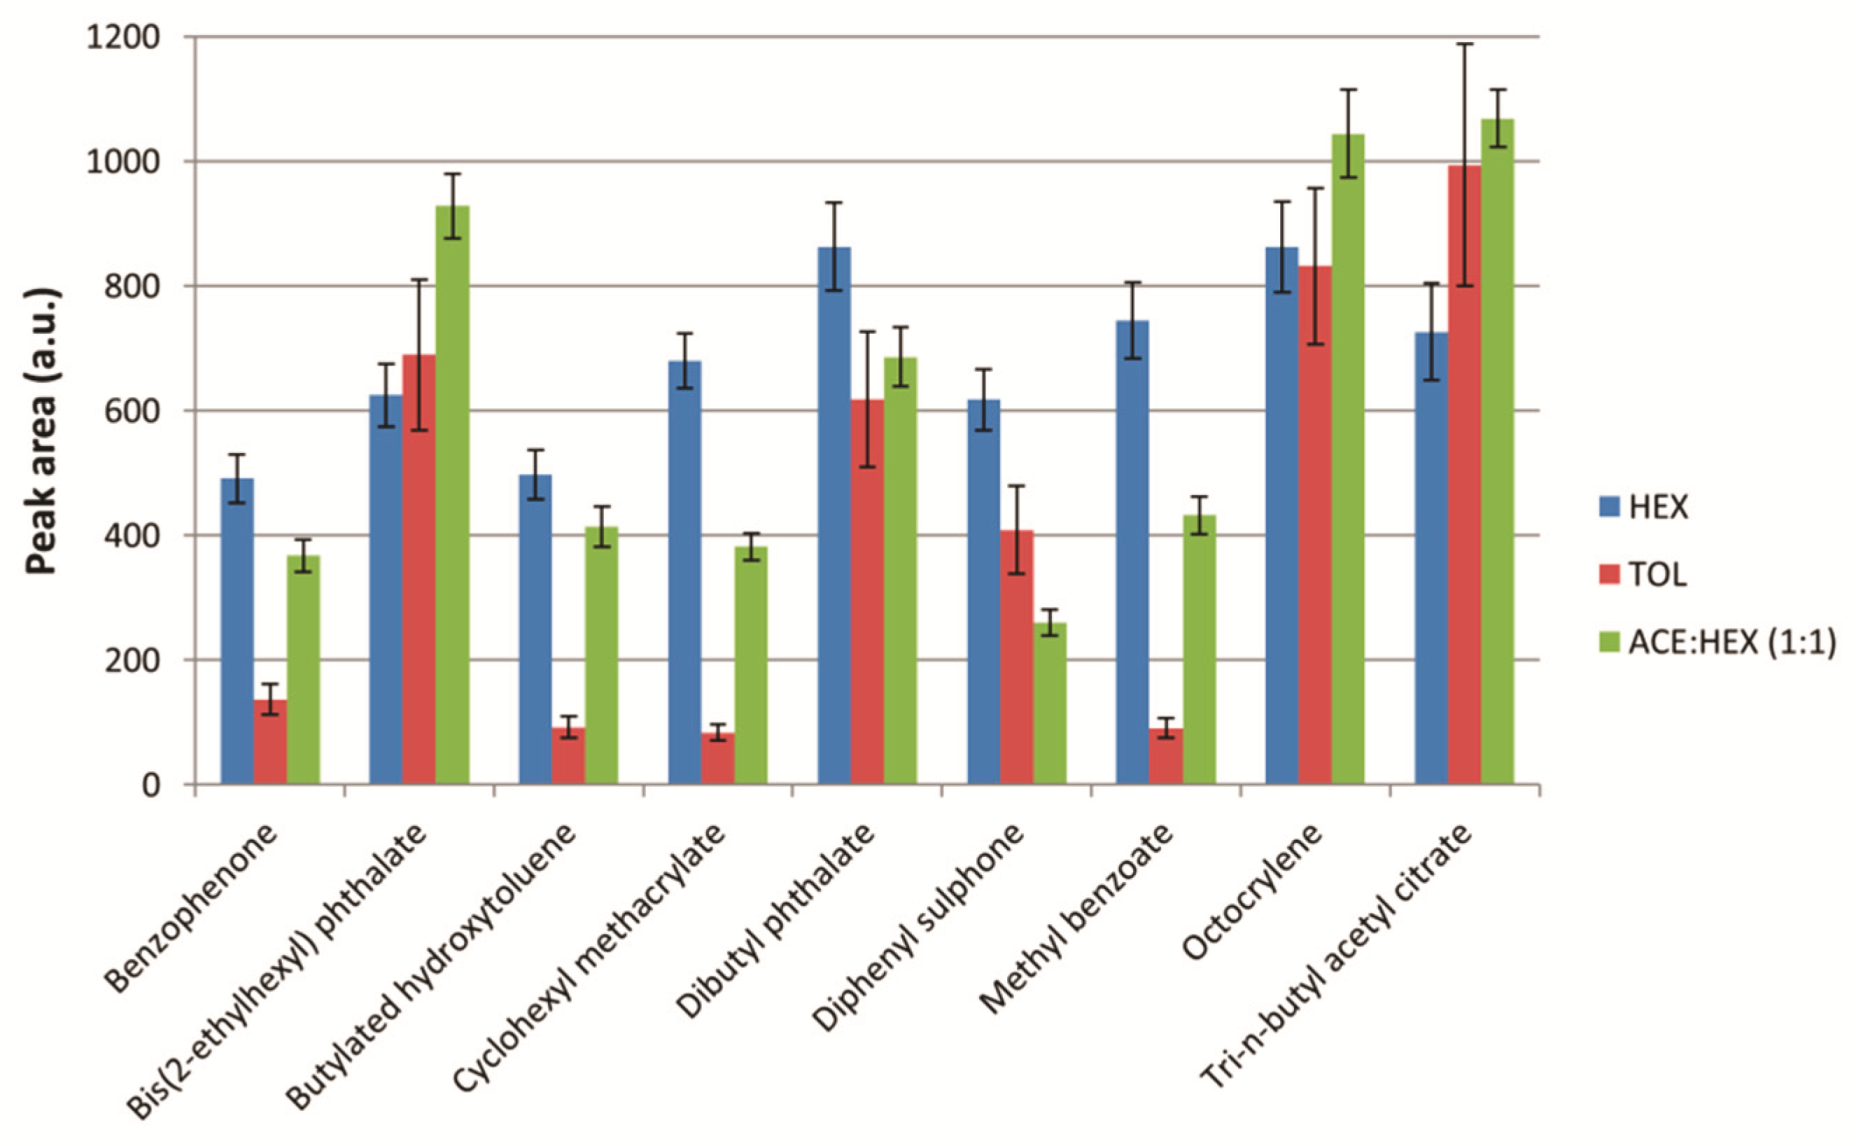
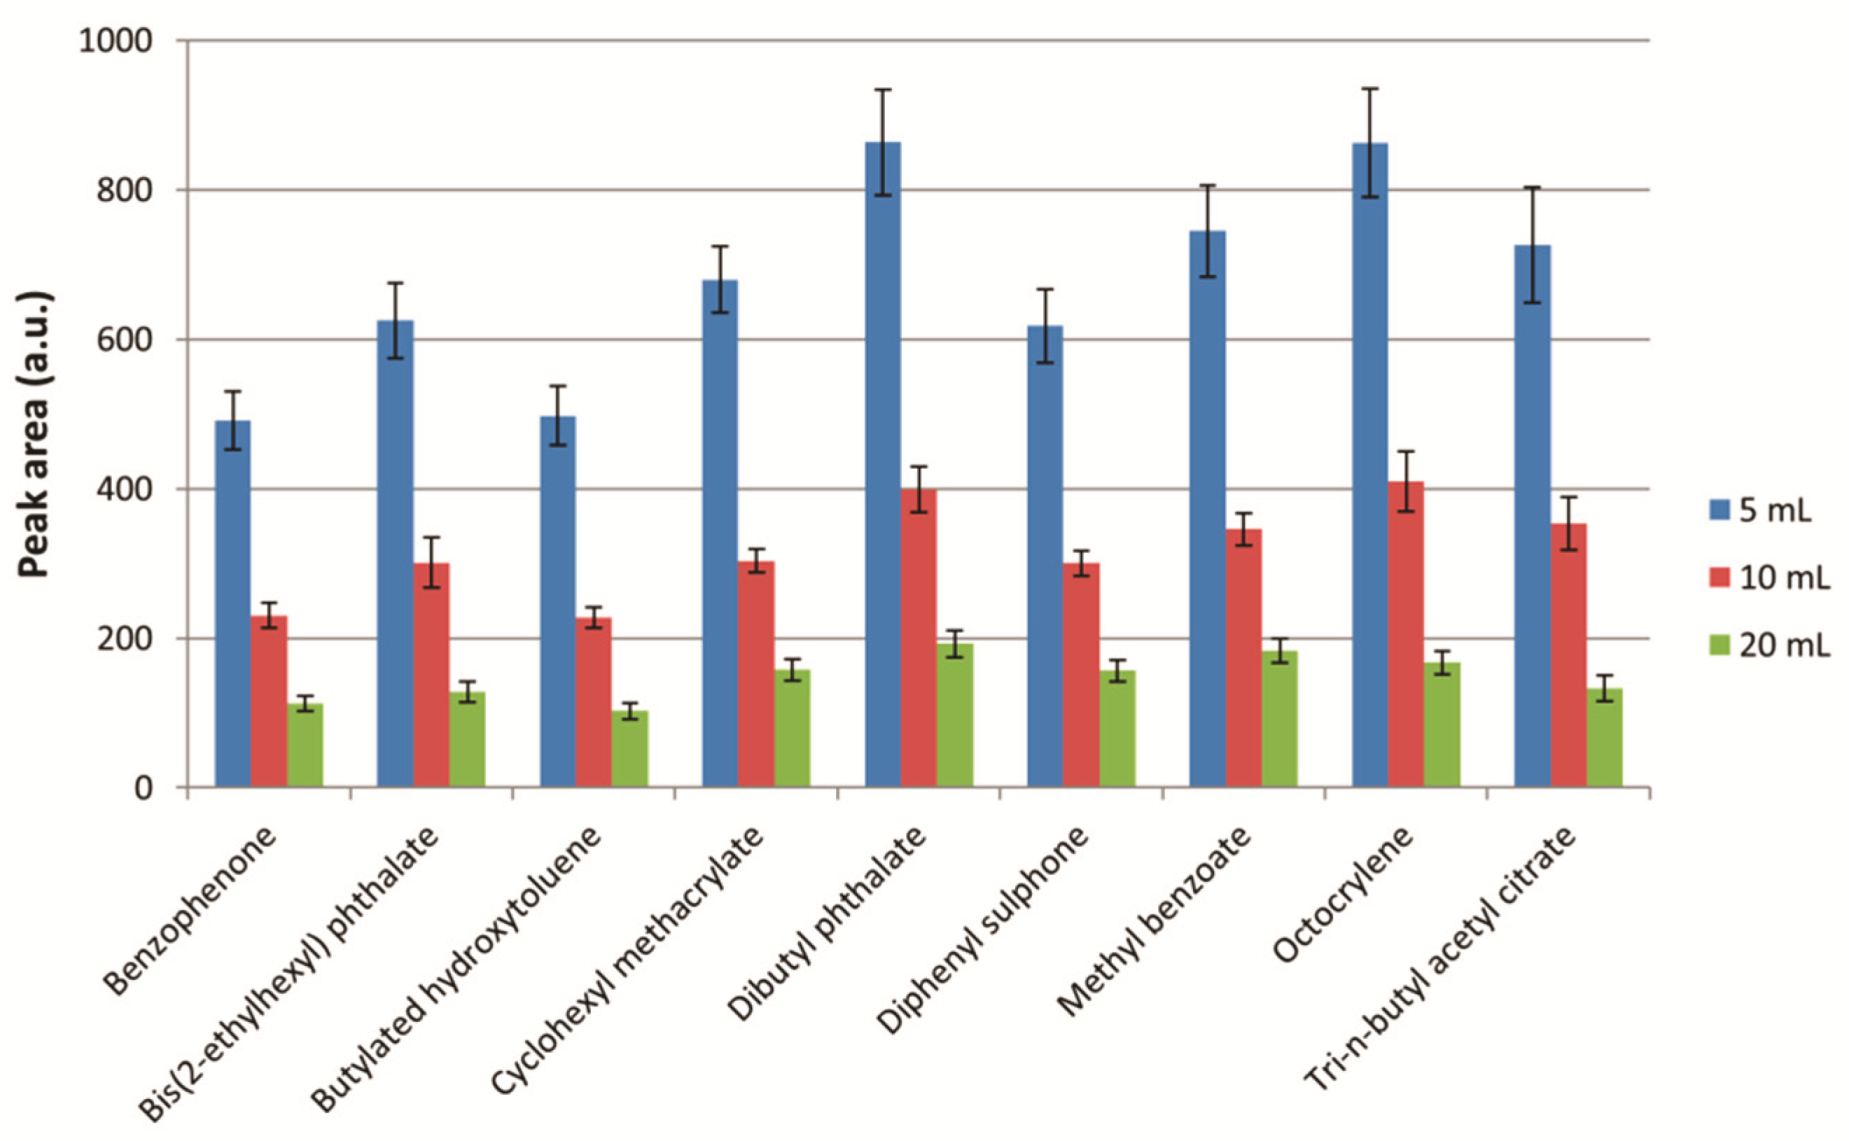
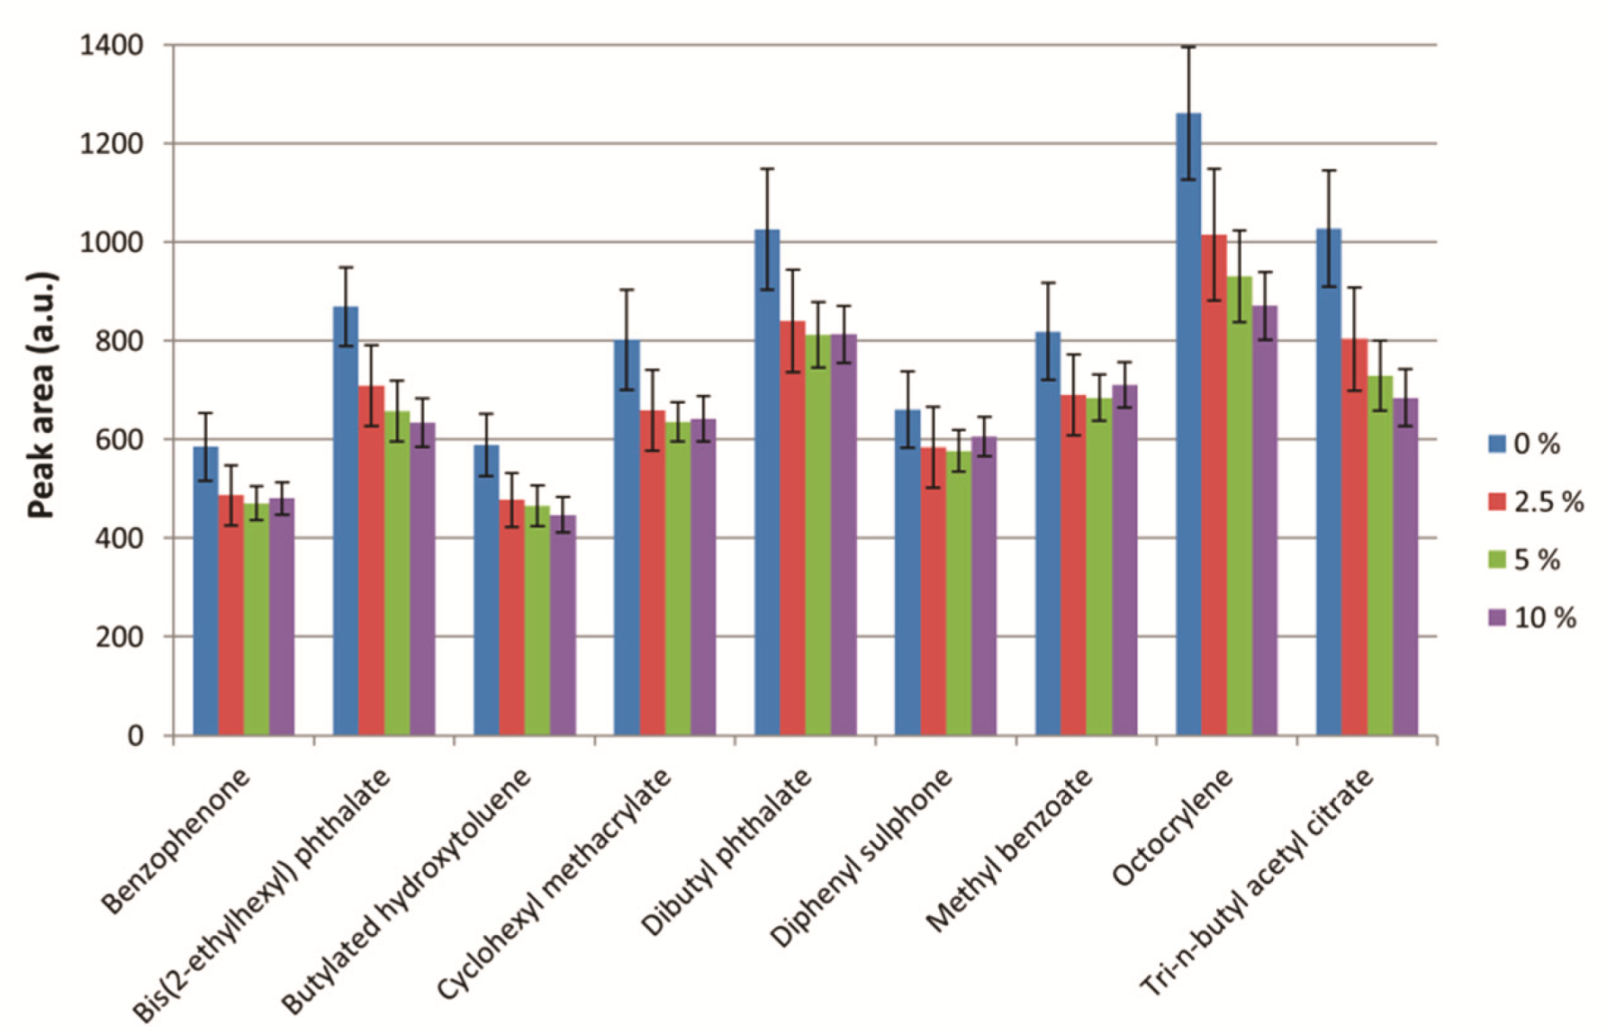
2.3. Study of the Experimental Variables Involved in the VA-LLE Procedure

In order to make the aqueous (or hydro-ethanolic) food simulants obtained from the migration test of the samples (see Section 3.4.1) compatible with the selected analytical technique (GC-HRMS), VA-LLE with an organic solvent was performed.
The experimental variables involved in the extraction process were studied, in triplicate, and those which provided the highest analytical signal (peak area) for a broad number of target compounds were selected. In this sense, extraction solvent composition and volume, ionic strength, and extraction time were studied. To perform these studies, a standard solution containing the target analytes at 160 µg L−1 in food simulant A was used. The volume of the food simulant was fixed at 20 mL.

2.3.1. Extraction Solvent Composition

The organic solvent to perform the extraction had to be immiscible and less dense than water in order to facilitate the collection of the extract as a supernatant phase. In this sense, n-hexane, toluene, and a mixture of acetone/n-hexane (1:1) were tested as extraction solvents. Moreover, chlorinated solvents were not considered due to their higher density and toxicity. The conditions for the other variables were as follows: extraction solvent volume, 5 mL; ionic strength, 5% w/v of NaCl; extraction time, 60 s. The obtained results are shown in Figure 2. It should be noted that only a representative set of nine target analytes (benzophenone, bis(2-ethylhexyl) phthalate, butylated hydroxytoluene, cyclohexyl methacrylate, dibutyl phthalate, diphenyl sulphone, methyl benzoate, octocrylene, and tri-n-butyl acetyl citrate) have been included in the figures below in order to simplify the visualization of the results. These substances were selected for being the most common and/or representative of the different chemical families studied in the present manuscript. Similar trends and conclusions were observed for the other target compounds.
As can be seen, the best results were obtained with n-hexane, so it was selected for further analysis.

2.3.2. Extraction Solvent Volume

The mass transfer of the analytes from the food simulant to the extraction solvent depends on the ratio between the food simulant and the extraction solvent volumes. In this sense, the volume of the food simulant was fixed at 20 mL, and 5, 10, and 20 mL were tested as extraction solvent volumes. The conditions for the other variables were as follows: extraction solvent, n-hexane; ionic strength, 5% w/v of NaCl; extraction time, 60 s. The obtained results are shown in Figure 3.
From the point of view of the mass transfer of the analytes, a higher volume of extraction solvent implies that a higher amount of the analytes could be extracted, but the obtained extract would be more diluted. As can be seen, the analytical signal decreased with higher volumes due to the dilution effect, so 5 mL of extraction solvent were selected for further analysis. Moreover, the obtained sensitivity using the selected volume of extraction solvent allowed us to reduce the organic solvent consumption of the proposed method and to avoid further experimental steps, such as repeated extractions or evaporation and reconstitution steps.

2.3.3. Ionic Strength

The influence of the ionic strength of the food simulant was studied in order to evaluate the so-called ‘salting-out effect’. For this, additions of 0, 2.5, 5, and 10% w/v of NaCl were tested. The conditions for the other variables were as follows: extraction solvent, n-hexane; extraction solvent volume, 5 mL; extraction time, 60 s. These results are shown in Figure 4.
As can be seen, the best results were obtained with the addition of 0% w/v of NaCl, so no adjustment of the ionic strength was selected for further analysis.

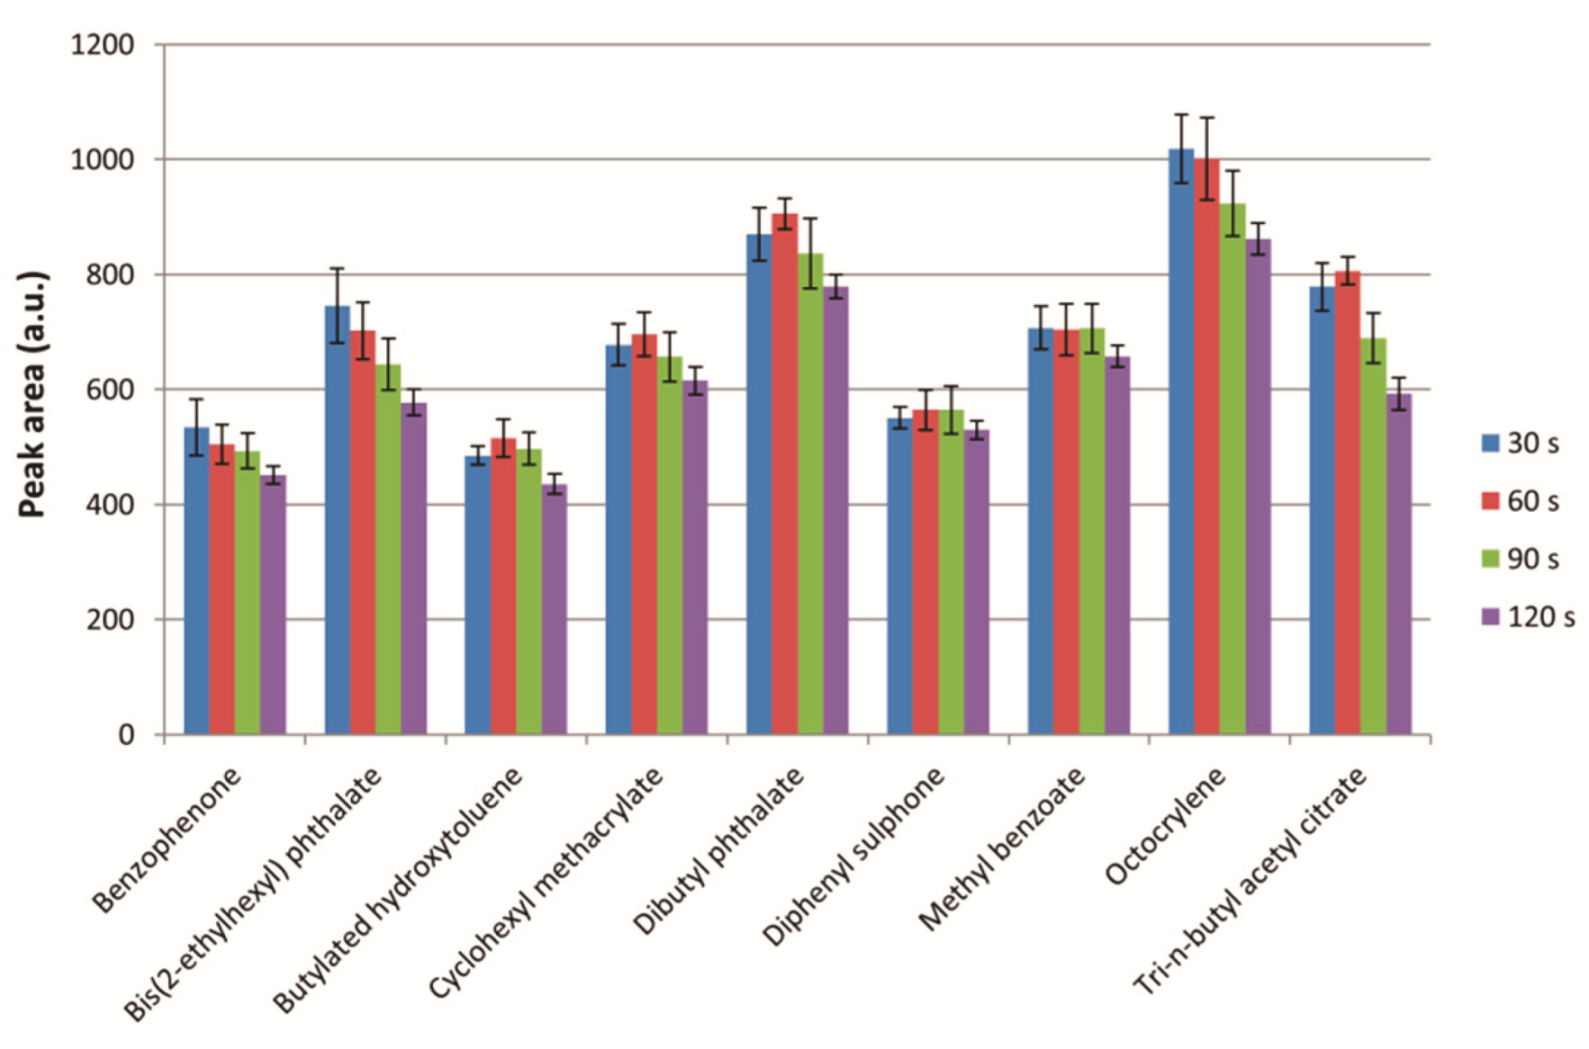
2.3.4. Extraction Time

The influence of the extraction time, as the time of vortex mixing, was studied. For this, 30, 60, 90, and 120 s were tested. The conditions for the other variables were as follows: extraction solvent, n-hexane; extraction solvent volume, 5 mL; ionic strength, not adjusted. These results are shown in Figure 5.
As can be seen, similar results were observed between 30 and 60 s, so the shortest extraction time of 30 s was selected for further analysis. With 90 and 120 s, a decrease in the analytical response was observed for some of the target analytes. This may be due to kinetic or thermodynamic effects that alter the partition coefficient of the analytes between the food simulant and the extraction solvent with longer extraction times.

2.4. Study of the Extraction Efficiency

In order to evaluate the extraction efficiency of the proposed VA-LLE under the selected conditions, a standard solution containing the target analytes at 160 µg L−1 in n-hexane was directly injected into the GC-HRMS system, and the obtained analytical signal was compared with that obtained for a standard solution containing the target analytes at 160 µg L−1 in food simulant after performing the extraction process (see Section 3.4.3).
Considering the ratio between the food simulant (20 mL) and the extraction solvent (5 mL) volumes, the extraction yield was determined. The obtained absolute recovery values (extraction yield) were different depending on the target analyte, ranging from 8 to 110% (Table S2). In this sense, the most polar analytes (such as 4-methylphenol, butyl lactate, and phenol, among others) showed the lowest extraction efficiencies. Moreover, the composition of the studied food simulants (A, B, C, and D1) also affected the observed extraction yield, thus showing that procedural standard calibration (i.e., performing the extraction process in the preparation of the calibration curve) would be necessary in order to compensate for the variation of the extraction yields to obtain accurate results.

2.5. Study of Stability of the Target Analytes

In cases where it was necessary to perform the proposed analytical method, including migration tests, VA-LLE, and GC-HRMS analysis, in different working sessions, the stability of the target analytes in the food simulants and in the n-hexane extracts was studied.
In triplicate, a standard solution containing the target analytes at 160 µg L−1 in the food simulant was analyzed following the proposed method immediately after its preparation, and after 1, 3, and 5 days of fridge storage (4 °C). The variation in the analytical signal was evaluated, and the obtained results shown that the target analytes were stable during the first 24 h of fridge storage (RSD, <15%). After 1 day of fridge storage, a decrease of the analytical signal was observed for some of the target analytes, such as 3-(trimethoxysilyl)propyl methacrylate, lauryl acrylate, triethoxyvinyl silane, triethyl phosphite, and vinyltrimethoxysilane. Similar results were obtained for all the tested food simulants (A, B, C, and D1).
Moreover, the stability of the target analytes was also tested in the n-hexane extract obtained after the VA-LLE analysis. In triplicate, a standard solution containing the target analytes at 160 µg L−1 in the food simulant was subjected to VA-LLE, and the obtained n-hexane extract was analyzed immediately, and after 1, 3, and 5 days of freezer storage (−24 °C). The variation in the analytical signal was evaluated, and the obtained results showed that the target analytes were stable for at least 3 days of freezer storage after the VA-LLE analysis (RSD, <20%). Similar results were obtained for all the tested food simulants (A, B, C, and D1).

2.6. Method Validation

In order to validate the proposed methodology, the analytical figures of merit (i.e., linearity, limits of quantification (LOQ), precision, and relative recovery) were evaluated in the studied food simulants (A, B, C, and D1) following the guidelines of the ‘Analytical quality control and method validation procedures for pesticide residues analysis in food and feed‘ (Document No. SANTE/12682/2019) [38]. The obtained analytical figures of merit using food simulant A are shown in Table 2, while those obtained for food simulants B, C, and D1 are shown in Tables S3–S5, respectively.
Linearity comprised at least from 40 to 400 µg L−1, obtaining coefficients of determination (R2) ≥ 0.98 in all the cases.
The LOQ, defined for practical reasons as the lowest concentration of the calibration curve, was fixed at 40 µg L−1 in the food simulant. Although many of the target analytes could be determined in concentrations below the reported LOQ, lower concentration limits were not pursued because the achieved method LOQ enables the evaluation of compliance with their SML [1]. The method LOQ, expressed in mg kg−1 of food, depends on the contact surface of the material exposed to the food simulant, considering the conventional ratio of 6 dm2 of contact surface per kg of food (see Section 3.4.5). As an example, a migration test performed with 1 dm2 of the plastic FCM exposed to 40 mL of food simulant would provide a method LOQ of 0.01 mg kg−1, applying the proposed methodology. According to Regulation 10/2011 [1], the SML for IAS range from 0.05 to 60 mg kg−1 of food, except for those whose SML states ND (not detected) and for NIAS, which should not be found in concentrations higher than 0.01 mg kg−1 [1].
Precision was evaluated in terms of the relative standard deviation (RSD, %) obtained in the analysis of five replicates of standard solutions containing the target analytes at three concentration levels (40, 160, and 400 µg L−1). The obtained results ranged from 0.6 to 12.6%, thus showing that satisfactory precision was achieved.

2.6.1. Study of Matrix Effects

In order to validate the method accuracy, the matrix effects were studied by comparing the analytical response obtained in the analysis of solvent standards and matrix-matched standards (spiked samples). In this sense, the relative recovery values (%) obtained in the analysis of spiked and non-spiked field samples, applying the proposed methodology with the four food simulants (A, B, C, and D1), were calculated.
In triplicate, the sample extracts obtained in the migration tests of the field samples (see Section 3.4.1) were spiked with the target analytes at three concentration levels (40, 160, and 400 µg L−1), and they were quantified using the proposed procedural standard calibration. The relative recovery values (%) were evaluated by comparing the determined concentration of the target analytes in the spiked and non-spiked samples with the known spiked concentration (solvent standard). The obtained relative recovery values ranged from 81 to 120%, thus showing that there were no matrix effects and, therefore, the proposed procedural standard calibration provided accurate results.

2.7. Analysis of Field Samples

The proposed method was applied in the analysis of four field samples made of different plastic FCM (see Section 3.2). The migration tests were performed according to Regulation 10/2011 [1] (see Section 3.4.1).
In the analysis of the field samples, no target analytes were found in concentrations above the method LOQ, thus showing that the tested samples were in accordance with the abovementioned regulation with regard to the studied substances [1]. Moreover, the study of matrix effects discussed above (see Section 2.6.1) demonstrated that there were no matrix effects that could affect the accuracy of the obtained results.
However, it could be interesting to apply the proposed methodology to a larger number of field samples of plastic FCM to obtain data regarding the appearance rate of the studied substances as market surveillance.

3. Materials and Methods

3.1. Reagents

Analytical standards of the target analytes were purchased from Merck KGaA (Darmstadt, Germany). The migrant substances studied in this paper, and their SML, are summarized in Table 1.
Analytical standards of phenol-13C6 (CAS 89059-34-7), and bis(2-ethylhexyl) phthalate-D4 (CAS 93951-87-2), both from LGC Standards (Bury, UK), were used as internal standards.
Acetone, residue-analysis grade; n-hexane, residue-analysis grade; and methanol, MS-grade, all from VWR International (Radnor, PA, USA), were used as solvents.
Glacial acetic acid, reagent-grade, from Panreac Química (Barcelona, Spain); absolute ethanol, gradient-grade; and water, MS-grade, both from VWR International (Radnor, PA, USA), were used to prepare the food simulants.

3.2. Samples

An epoxy-coated tin food can (Sample 1), a drinking bottle made of Tritan copolyester (Sample 2), a disposable glass made of polycarbonate (Sample 3), and a baby feeding bottle made of polypropylene (Sample 4) were analyzed. The samples were obtained directly from the manufacturer, and they had not previously been in contact with food.

3.3. Instruments

A Trace 1310 GC system equipped with a TraceGOLD TG-5MS column (30 m, 0.25 mm, 0.25 µm), coupled to a Q-Exactive GC Orbitrap HRMS detector, all from Thermo Fisher Scientific (Waltham, MA, USA), were used for GC-HRMS analysis.
A Conterm laboratory oven, from J.P. Selecta (Barcelona, Spain); an Advanced IR vortex mixer, from VELP Scientifica (Usmate Velate, Italy); and an Allegra X-15R centrifuge, from Beckman Coulter (Indianapolis, IN, USA), were also used.

3.4. Proposed Method

3.4.1. Preparation of Samples. Migration Tests

According to Regulation 10/2011 [1], migration tests have to be performed by exposing the plastic FCM in the appropriate food simulant under standardized test conditions, according to its worst foreseeable use.
The food simulants that were considered and can be applied in the proposed method are as follows: food simulant A (ethanol, 10% v/v), food simulant B (acetic acid, 3% w/v), food simulant C (ethanol, 20% v/v), and food simulant D1 (ethanol, 50% v/v).
The intended use of the analyzed samples and the selected conditions for the migration tests are summarized in Table 3. Briefly, Sample 1, intended to contain preserved vegetables or animal products in an oily medium at room temperature for a long period of time (above 30 days), was tested using food simulant A for 10 days at 60 °C; Sample 2, intended to contain clear drinks, such as water, fruit juice, or energy drinks, was tested using food simulant B for 24 h at 40 °C; Sample 3, intended to contain alcoholic or non-alcoholic beverages, such as wine or beer, was tested using food simulant C for 2 h at 40 °C; and Sample 4, intended to contain milk or milk-based drinks, including reconstituted milk-based on infant formula, was tested using food simulant D1 for 2 hours at 70 °C, followed by 24 h at 40 °C.
Three individual units of each sample were filled with the selected food simulant, sealed with aluminum foil to prevent solvent evaporation, and placed into a laboratory oven for its incubation. After the migration tests, the food simulants were collected and submitted to the subsequent VA-LLE procedure.
It should be noted that the specific conditions for the migration test (food simulant composition, contact time, and contact temperature) depend on the worst foreseeable use of the plastic FCM. The methodology proposed in this paper can be applied to the analysis of any plastic FCM that uses any of the described food simulants (A, B, C, and D1) for its migration test.

3.4.2. Preparation of Standards

Stock individual standard solutions of the target analytes and the internal standards were prepared at 1600 mg L−1 in methanol. From these solutions, stock multicomponent solutions containing the target analytes and the internal standards, respectively, at 16 mg L−1 were prepared in acetone. These stock standard solutions were stored in a freezer (−24 °C) when necessary until use.
The standard solutions used to prepare the calibration curve, containing the target analytes from 40 to 400 µg L−1, were prepared using the four food simulants. Within the working range, a 6-point calibration curve was constructed using the following concentration levels: 40, 80, 160, 240, 320, and 400 µg L−1. For this, aliquots of the stock multicomponent standard solution, ranging from 50 to 500 µL, were placed into a series of 20 mL volumetric flasks, and they were filled to the line using food simulant as a solvent. These standard solutions were freshly prepared in each analytical sequence.

3.4.3. Vortex-Assisted Liquid–Liquid Extraction (VA-LLE)

After the migration test, 20 mL of the food simulant were collected and placed into a 50 mL glass centrifuge tube, and 5 mL of n-hexane were added. The mixture was stirred vigorously for 30 s in a vortex mixer (ca. 2000 rpm) in order to enhance the extraction effectiveness, and it was then centrifuged at 3000 rpm for 5 min for phase separation. Finally, 1 mL of the n-hexane extract (supernatant phase) was collected, placed into an injection vial, and spiked with 20 µL of the internal standards solution for subsequent GC-HRMS analysis. Additionally, sample blanks consisting of blank food simulant subjected to VA-LLE were also prepared in triplicate following the same procedure.
The VA-LLE was also applied to the calibration curve (see Section 3.4.2) following the described extraction procedure under the same conditions prior to GC-HRMS analysis (procedural standard calibration).

3.4.4. GC-HRMS Analysis

One microliter of the standard or sample extract was injected into the GC-HRMS system (splitless injection). The inlet temperature was set at 280 °C. The GC operated in constant flow mode at 1.2 mL min−1 with helium as a carrier gas, using the following oven temperature programs: 40 °C, held for 5 min; 5 °C min−1 up to 315 °C, held for 10 min. The MS transfer line was set at 300 °C. The EI ion source operated at 70 eV, and its temperature was 250 °C. The acquisition was performed in selected ion monitoring (SIM) mode with a resolving power of 30,000 FWHM and a mass accuracy ≤ 5 ppm. The selected ions for signal acquisition and the retention times of the target analytes are shown in Table S1.

3.4.5. Quantification and Confirmation

The quantification of the target analytes was performed by procedural standard calibration with internal standards in the working range, from 40 to 400 µg L−1 (6-point calibration curve). The calibration curves were obtained by simple linear regression, with the analytical signal (i.e., ratio between the target analyte peak area and the internal standard peak area) being the dependent variable and the analyte concentration (µg L−1) being the independent variable. The internal standard bis(2-ethylhexyl) phthalate-D4 was used to quantify benzyl butyl phthalate, bis(2-ethylhexyl) adipate, bis(2-ethylhexyl) phthalate, diallyl phthalate, dibutyl adipate, dibutyl maleate, dibutyl phthalate, diethyl phthalate, diisobutyl phthalate, dimethyl isophthalate, dimethyl terephthalate, and diphenyl phthalate, and the internal standard phenol-13C6 was used to quantify the other target analytes.
The results, expressed in µg L−1 of food simulant, were obtained by interpolation in the calibration curves. In order to evaluate compliance with the SML of Regulation 10/2011 [1], the results needed to be converted to mg kg−1 of food. For this, the conventional ratio of 6 dm2 of food contact surface per kg of food was considered using the following expression: M = C × (6 V/S) × 10−3; ‘M’ being the migration of the target analyte in mg kg−1 of food; ‘C’ the obtained concentration of the target analyte in µg L−1 of food simulant; ‘V’ the volume of food simulant in L or dm3; and ‘S’ the contact surface of the FCM in dm2.
The identification and confirmation of the target analytes was performed by comparing the chromatographic peaks obtained for the standards and the samples, considering the following criteria: retention time should not differ by more than 0.1 min, the two selected ions should be detected (quantification ion and confirmation ion) (see Table S1) with mass accuracy ≤2 ppm, and the analyte peaks in the extracted ion chromatogram of the two selected ions must fully overlap.

4. Conclusions

In this work, a useful analytical method for the determination of 60 migrant substances, including aldehydes, ketones, phthalates and other plasticizers, phenol derivatives, acrylates, and methacrylates, from plastic FCM using food simulants has been developed and validated. The proposed methodology included migration tests of plastic FCM using food simulants A, B, C, and D1, followed by VA-LLE using only n-hexane as an extraction solvent and GC-Q-Orbitrap HRMS analysis. Migration tests were performed following standardized conditions, according to current Regulation 10/2011, and the experimental variables involved in the vortex-assisted liquid–liquid extraction were studied. The proposed method was then validated using procedural standard calibration, showing satisfactory linearity, method limits of quantification, precision, and relative recovery; it was applied in the analysis of four field samples made of different plastic FCM, showing that the target analytes were in compliance with their SML according to Regulation 10/2011. In this sense, the analytical method addressed in this paper constitutes a fast, useful, and reliable procedure for the analysis of plastic FCM using food simulants for the control of compliance with current European regulations. It should be noted that, in the current market, there is a wide variety of FCM made of different plastics and polymer materials and not all the studied substances, both IAS and NIAS, may be relevant for all the plastic FCM. In this sense, a multi-analyte method such as the one proposed in the present manuscript, could be useful for food control authorities in order to evaluate compliance of plastic FCM with current European regulations as a part of a comprehensive analytical control plan.

Supplementary Materials

The following are available online. Table S1: Selected ions (m/z) for HRMS acquisition and retention time (RT) of the target analytes, Table S2: Extraction efficiencies of the target analytes from the studied food simulants (A, B, C, and D1), Table S3: Analytical figures of merit of the proposed method using food simulant B, Table S4: Analytical figures of merit of the proposed method using food simulant C, Table S5: Analytical figures of merit of the proposed method using food simulant D1.

Author Contributions

Conceptualization, P.M., V.Y. and C.C.; methodology, P.M. and Y.S.; validation, P.M. and Y.S.; investigation, P.M., Y.S. and V.Y.; resources, V.Y. and C.C.; data curation, P.M., V.Y. and C.C.; writing—original draft preparation, P.M. and Y.S.; writing—review and editing, P.M., V.Y. and C.C.; supervision, V.Y. and C.C; funding acquisition, V.Y. and C.C. All authors have read and agreed to the published version of the manuscript.

Funding

This research was supported by the European Union through the European Regional Development Fund (ERDF) Operational Programme of the Valencian Region (2014-2020). The APC was funded by FISABIO (Valencia, Spain).

Institutional Review Board Statement

Not applicable.

Informed Consent Statement

Not applicable.

Data Availability Statement

Data are available from corresponding author upon reasonable request.

Acknowledgments

P.M. would like to thank the Spanish “Ministerio de Universidades” for his “Margarita Salas” postdoctoral fellowship (funded by the European Union—Next Generation EU).

Conflicts of Interest

The authors declare no conflict of interest.

References

  1. European Commission. Commission Regulation (EU) No 10/2011 of 14 January 2011 on Plastic Materials and Articles Intended to Come into Contact with Food. Available online: http://data.europa.eu/eli/reg/2011/10/2020-09-23 (accessed on 2 December 2021).
  2. International Life Science Institute (ILSI) Europe. Guidance on Best Practices on the Risk Assessment of Non-Intentionally Added Substances (NIAS) in Food Contact Materials and Articles; ILSI Europe: Brussels, Belgium, 2015. [Google Scholar]
  3. Sanchís, Y.; Yusà, V.; Coscollà, C. Analytical strategies for organic food packaging contaminants. J. Chromatogr. A 2017, 1490, 22–46. [Google Scholar] [CrossRef]
  4. Martínez-Bueno, M.J.; Gómez Ramos, M.J.; Bauer, A.; Fernández-Alba, A.R. An overview of non-targeted screening strategies based on high resolution accurate mass spectrometry for the identification of migrants coming from plastic food packaging materials. TrAC Trends Anal. Chem. 2019, 110, 191–203. [Google Scholar] [CrossRef]
  5. Wrona, M.; Nerín, C. Analytical approaches for analysis of safety of modern food packaging: A review. Molecules 2020, 25, 752. [Google Scholar] [CrossRef] [PubMed] [Green Version]
  6. Ouyang, X.; Lu, Z.; Hu, Y.; Xie, Z.; Li, G. Research progress on sample pretreatment methods for migrating substances from food contact materials. J. Sep. Sci. 2021, 44, 879–894. [Google Scholar] [CrossRef]
  7. Canellas, E.; Vera, P.; Nerín, C. UPLC-ESI-Q-TOF-MSE and GC-MS identification and quantification of non-intentionally added substances coming from biodegradable food packaging. Anal. Bioanal. Chem. 2015, 407, 6781–6790. [Google Scholar] [CrossRef]
  8. Martínez-Bueno, M.J.; Cimmino, S.; Silvestre, C.; Tadeo, J.L.; García-Valcárcel, A.I.; Fernández-Alba, A.R.; Hernando, M.D. Characterization of non-intentionally added substances (NIAS) and zinc oxide nanoparticle release from evaluation of new antimicrobial food contact materials by both LC-QTOF-MS, GC-QTOF-MS and ICP-MS. Anal. Methods 2016, 8, 7209–7216. [Google Scholar] [CrossRef]
  9. Carrero-Carralero, C.; Escobar-Arnanz, J.; Ros, M.; Jiménez-Falcao, S.; Sanz, M.L.; Ramos, L. An untargeted evaluation of the volatile and semi-volatile compounds migrating into food simulants from polypropylene food containers by comprehensive two-dimensional gas chromatography-time-of-flight mass spectrometry. Talanta 2019, 195, 800–806. [Google Scholar] [CrossRef]
  10. Yusà, V.; López, A.; Dualde, P.; Pardo, O.; Fochi, I.; Pineda, A.; Coscollà, C. Analysis of unknowns in recycled LDPE plastic by LC-Orbitrap Tribrid HRMS using MS3 with an intelligent data acquisition mode. Microchem. J. 2020, 158, 105256. [Google Scholar] [CrossRef]
  11. Horodytska, O.; Cabanes, A.; Fullana, A. Non-intentionally added substances (NIAS) in recycled plastics. Chemosphere 2020, 251, 126373. [Google Scholar] [CrossRef]
  12. Yusà, V.; López, A.; Dualde, P.; Pardo, O.; Fochi, I.; Miralles, P.; Coscollà, C. Identification of 24 unknown substances (IAS/NIAS) from food contact polycarbonate by LC-Orbitrap Tribrid HRMS-DDMS3: Safety assessment. Int. J. Anal. Chem. 2021, 2021, 6654611. [Google Scholar] [CrossRef]
  13. Miralles, P.; López, A.; Dualde, P.; Coscollà, C.; Yusà, V. LC-Orbitrap Tribrid high-resolution MS using data dependent-tandem mass spectrometry with triple stage fragmentation as a screening tool to perform identification and risk assessment of unknown substances in food contact epoxy resin. J. Sep. Sci. 2021, 44, 3020–3030. [Google Scholar] [CrossRef] [PubMed]
  14. Miralles, P.; Yusà, V.; Pineda, A.; Coscollà, C. A fast and automated strategy for the identification and risk assessment of unknown substances (IAS/NIAS) in plastic food contact materials by GC-Q-Orbitrap HRMS: Recycled LDPE as a proof-of-concept. Toxics 2021, 9, 283. [Google Scholar] [CrossRef] [PubMed]
  15. Guo, G.; Bo, H.; Duan, W.; Jia, H.; Chen, R.; Ma, Y.; Ai, L. Determination of 46 plasticizers in food contact polyvinyl chloride packaging materials and their migration into food simulants by gas chromatography-mass spectrometry. Chin. J. Chromatogr. 2011, 29, 42–48. [Google Scholar] [CrossRef]
  16. García Ibarra, V.; Rodríguez Bernaldo de Quirós, A.; Paseiro Losada, P.; Sendón, R. Identification of intentionally and non-intentionally added substances in plastic packaging materials and their migration into food products. Anal. Bioanal. Chem. 2018, 410, 3789–3803. [Google Scholar] [CrossRef] [PubMed]
  17. García Ibarra, V.; Sendón, R.; García-Fonte, X.X.; Paseiro Losada, P.; Rodríguez Bernaldo de Quirós, A. Migration studies of butylated hydroxytoluene, tributyl acetylcitrate and dibutyl phthalate into food simulants. J. Sci. Food Agric. 2019, 99, 1586–1595. [Google Scholar] [CrossRef] [PubMed]
  18. Andjelkovic, T.; Bogdanovic, D.; Kostic, I.; Kocic, G.; Nikolic, G.; Pavlovic, R. Phthalates leaching from plastic food and pharmaceutical contact materials by FTIR and GC-MS. Environ. Sci. Pollut. Res. 2021, 28, 31380–31390. [Google Scholar] [CrossRef]
  19. Li, C.; Li, Y.; Chen, Z.; Liang, F.; Chen, X.; Wu, S.; Li, Y.; Sun, X. Simultaneous determination of migration amounts of antioxidants and ultraviolet absorbents by high performance liquid chromatography in food contact materials. Chin. J. Chromatogr. 2014, 32, 616–622. [Google Scholar] [CrossRef] [Green Version]
  20. Qiu, Y.; Li, G.; Long, M.; Li, Y.; Xia, Z. Rapid determination of 13 ultraviolet absorbents in plastic food contact materials by ultra-performance convergence chromatography. Chin. J. Chromatogr. 2019, 37, 990–995. [Google Scholar] [CrossRef] [PubMed]
  21. Gou, X.; Zhao, X.; Chi, H.; Gao, X.; Zhou, M.; Liu, W. Simultaneous determination of ten benzotriazole ultraviolet stabilizers in food contact plastic materials by solid phase extraction and ultra performance liquid chromatography with tandem mass spectrometry. Chin. J. Chromatogr. 2015, 33, 571–576. [Google Scholar] [CrossRef]
  22. Wang, C.; Li, C.; Lin, J.; Xie, T.; Chu, N. Simulatenous determination of the specific migration amounts of light stabilizers and antioxidants in plastic materials in contact with foodstuffs by ultra-high performance liquid chromatography/orbitrap high resolution mass spectrometry. Chin. J. Chromatogr. 2017, 35, 509–519. [Google Scholar] [CrossRef]
  23. Fernandes, A.R.; Rose, M.; Charlton, C. 4-Nonylphenol (NP) in food contact materials: Analytical methodology and occurrence. Food Addit. Contam. 2008, 25, 364–372. [Google Scholar] [CrossRef]
  24. Oca, M.L.; Ortiz, M.C.; Herrero, A.; Sarabia, L.A. Optimization of a GC/MS procedure that uses parallel factor analysis for the determination of bisphenols and their diglycidyl ethers after migration from polycarbonate tableware. Talanta 2013, 106, 266–280. [Google Scholar] [CrossRef]
  25. Qiu, Y.; Li, G.; Long, M.; Ruan, Y.; Tan, C.; Zhang, L.; Xia, Z. Determination of 11 kinds of bisphenols in plastic food contact materials by ultra-performance convergence chromatography. Chin. J. Chromatogr. 2020, 48, 255–261. [Google Scholar]
  26. Bignardi, C.; Cavazza, A.; Lagana, C.; Salvadeo, P.; Corradini, C. UHPLC-high-resolution mass spectrometry determination of bisphenol A and plastic additives released by polycarbonate tableware: Influence of ageing and surface damage. Anal. Bioanal. Chem. 2015, 407, 7917–7924. [Google Scholar] [CrossRef]
  27. Li, Y.; Li, C.; Xiao, D.; Liang, F.; Chen, Z.; Chen, X.; Sun, X.; Li, Y. Determination of migration of 25 primary aromatic amines from food contact plastic materials by gas chromatography-mass spectrometry. Chin. J. Chromatogr. 2013, 31, 46–52. [Google Scholar] [CrossRef] [Green Version]
  28. Mortensen, S.K.; Trier, X.T.; Foverskov, A.; Petersen, J.H. Specific determination of 20 primary aromatic amines in aqueous food simulants by liquid chromatography-electrospray ionization-tandem mass spectrometry. J. Chromatogr. A 2005, 1091, 40–50. [Google Scholar] [CrossRef] [Green Version]
  29. Sanchís, Y.; Coscollà, C.; Roca, M.; Yusà, V. Target analysis of primary aromatic amines combined with a comprehensive screening of migrating substances in kitchen utensils by liquid chromatography-high resolution mass spectrometry. Talanta 2015, 138, 290–297. [Google Scholar] [CrossRef]
  30. Sanches Silva, A.; Sendón García, R.; Cooper, I.; Franz, R.; Paseiro Losada, P. Compilation of analytical methods and guidelines for the determination of selected model migrants from plastic packaging. Trends Food Sci. Technol. 2006, 17, 535–546. [Google Scholar] [CrossRef]
  31. Dopico-García, M.S.; Noguerol-Cal, R.; Castro-López, M.M.; Cela-Pérez, M.C.; Pinon-Giz, E.; López-Vilarino, J.M.; González-Rodríguez, M.V. Determination of polyolefin additives by reversed phase-liquid chromatography. Cent. Eur. J. Chem. 2012, 10, 585–610. [Google Scholar] [CrossRef] [Green Version]
  32. Gallart-Ayala, H.; Nunez, O.; Lucci, P. Recent advances in LC-MS analysis of food-packaging contaminants. TrAC Trends Anal. Chem. 2013, 42, 99–124. [Google Scholar] [CrossRef] [Green Version]
  33. Hoppe, M.; de Voogt, P.; Franz, R. Identification and quantification of oligomers as potential migrants in plastics food contact materials with a focus in polycondensates—A review. Trends Food Sci. Technol. 2016, 50, 118–130. [Google Scholar] [CrossRef]
  34. Zhang, X.; Zhang, P.; Shi, C.; Hua, H.; Rong, Y.; Lu, J.; Yang, F. Rapid determination of 48 contaminant residues in food contact plastic products by ultra performance liquid chromatography-quadrupole/electrostatic field orbitrap high resolution mass spectrometry coupled with microwave-assisted extraction. Chin. J. Chromatogr. 2018, 36, 634–642. [Google Scholar] [CrossRef]
  35. Tsochatzis, E.D.; Lopes, J.A.; Hoekstra, E.; Emons, H. Development and validation of a multi-analyte GC-MS method for the determination of 84 substances from plastic food contact materials. Anal. Bioanal. Chem. 2020, 412, 5419–5434. [Google Scholar] [CrossRef] [PubMed]
  36. Tsochatzis, E.D.; Lopes, J.A.; Gika, H.; Dalsgaard, T.K.; Theodoridis, G. A fast SALLE GC-MS/MS multi-analyte method for the determination of 75 food packaging substances in food simulants. Food Chem. 2021, 361, 129998. [Google Scholar] [CrossRef] [PubMed]
  37. European Commission. Commission Recommendation (EU) 2019/794 of 15 May 2019 on a Coordinated Control Plan with a View to Establishing the Prevalence of Certain Substances Migrating from Materials and Articles Intended to Come into Contact with Food. Available online: http://data.europa.eu/eli/reco/2019/794/oj (accessed on 2 December 2021).
  38. European Commission. Analytical Quality Control and Method Validation Procedures for Pesticide Residues Analysis in Food and Feed. Available online: https://www.eurl-pesticides.eu/userfiles/file/EurlALL/AqcGuidance_SANTE_2019_12682.pdf (accessed on 2 December 2021).
Figure 1. Acquired features for Octoctylene: (a) Chromatographic peak; (b) HRMS spectrum with the exact masses of selected fragment ions.
Molecules 26 07640 g001
Figure 2. Study of the extraction solvent composition. Experimental conditions: extraction solvent volume, 5 mL; ionic strength, 5% w/v of NaCl; extraction time, 60 s. Bars in the graph represent the mean value of three replicates ± standard deviation. HEX: n-hexane; TOL: toluene; ACE:HEX: mixture of acetone/n-hexane (1:1).
Molecules 26 07640 g002
Figure 3. Study of the extraction solvent volume. Experimental conditions: extraction solvent, n-hexane; ionic strength, 5% w/v of NaCl; extraction time, 60 s. Bars in the graph represent the mean value of three replicates ± standard deviation.
Molecules 26 07640 g003
Figure 4. Study of the ionic strength. Experimental conditions: extraction solvent, n-hexane; extraction solvent volume, 5 mL; extraction time, 60 s. Bars in the graph represent the mean value of three replicates ± standard deviation.
Molecules 26 07640 g004
Figure 5. Study of the extraction solvent volume. Experimental conditions: extraction solvent, n-hexane; extraction solvent volume, 5 mL; ionic strength, not adjusted. Bars in the graph represent the mean value of three replicates ± standard deviation.
Molecules 26 07640 g005
Table 1. List of target analytes and their specific migration limits (SML).
AnalyteCAS No.FCM No. aSML
(mg kg−1) b
1,4-Butanediol dimethacrylate2082-81-74340.05
1,4-Dichlorobenzene106-46-721712
2,2,4-Trimethyl-1,3-pentanediol diisobutyrate6846-50-04975
2-Ethyl-1-hexanol104-76-720930
2-Ethylhexyl acrylate103-11-72060.05
3-(4-Isopropylphenyl)-2-methylpropionaldehyde103-95-7--
3-(Trimethoxysilyl)propyl methacrylate2530-85-07880.05
4,4′-Difluorobenzophenone345-92-63370.05
4-Methylphenol106-44-5216-
4-tert-Butylphenol98-54-41860.05
Allyl methacrylate96-05-91750.05
α-Methylstyrene98-83-91870.05
α-Pinene80-56-8155-
Benzaldehyde100-52-7195-
Benzophenone119-61-92860.6
Benzyl butyl phthalate85-68-715930(1)
Benzyl methacrylate2495-37-64476(2)
β-Pinene127-91-3314-
Bis(2-ethylhexyl) adipate103-23-120718(1)
Bis(2-ethylhexyl) phthalate117-81-72831.5(1)
Bis(4-chlorophenyl) sulphone80-07-91520.05
Butyl acrylate141-32-23256(3)
Butyl benzoate136-60-7320-
Butyl lactate138-22-7322-
Butyl methacrylate97-88-11846(2)
Butylated hydroxytoluene128-37-03153
Camphor76-22-2136-
Cyclohexyl methacrylate101-43-91970.05
Diallyl phthalate131-17-9316ND
Dibutyl adipate105-99-7--
Dibutyl maleate105-76-0--
Dibutyl phthalate84-74-21570.3(1)
Diethyl phthalate84-66-2--
Diisobutyl phthalate84-69-5--
Dimethyl isophthalate1459-93-44200.05
Dimethyl terephthalate120-61-6288-
Diphenyl phthalate84-62-8--
Diphenyl sulfone127-63-93133
Divinyl benzene1321-74-0405ND
Ethyl benzoate93-89-0172-
Ethylene glycol dimethacrylate97-90-51850.05
Etocrylene5232-99-54870.05
Isobutyl acrylate106-63-82186(3)
Lauryl acrylate2156-97-04370.05
Methyl benzoate93-58-3171-
Methyl dihydrojasmonate24851-98-7--
Methyl salicilate119-36-828430
Octocrylene6197-30-44920.05
Phenol108-95-22413
Phenyl methacrylate2177-70-04396(2)
Propyl benzoate2315-68-6441-
Styrene100-42-5193-
tert-Butyl methacrylate585-07-93556(2)
Triethoxyvinylsilane78-08-01420.05
Triethyl citrate77-93-014060(1)
Triethyl phosphite122-52-1293ND
Trimethylolpropane trimethacrylate3290-92-44630.05
Tri-n-butyl acetyl citrate77-90-713860(1)
Vinyl laurate2146-71-6436-
Vinyltrimethoxysilane2768-02-74530.05
a Food contact material (FCM) number according to Regulation 10/2011 [1]. Substances with no FCM No. are not authorized and considered as non-intentionally added substances (NIAS). b Specific migration limit (SML) according to Regulation 10/2011 [1]. For authorized substances (IAS) with no SML, the applicable limit is 60 mg kg−1; and for substances whose SML is ND (not detected) and NIAS, the applicable limit is 0.01 mg kg−1. (1) Group restriction (32): 60 mg kg−1 expressed as the sum of the substances. (2) Group restriction (23): 6 mg kg−1 expressed as methacrylic acid. (3) Group restriction (22): 6 mg kg−1 expressed as acrylic acid.
Table 2. Analytical figures of merit of the proposed method using food simulant A.
AnalyteCoefficient of Determination (R2) aRelative Recovery (%) bPrecision (RSD, %) c
40 µg L−1160 µg L−1400 µg L−140 µg L−1160 µg L−1400 µg L−1
1,4-Butanediol dimethacrylate0.99895 ± 6106 ± 3101 ± 15.82.91.3
1,4-Dichlorobenzene0.998105 ± 9101 ± 699 ± 38.75.73.5
2,2,4-Trimethyl-1,3-pentanediol diisobutyrate0.999106 ± 397 ± 295 ± 23.22.01.7
2-Ethyl-1-hexanol0.99792 ± 8101 ± 4100 ± 48.34.14.1
2-Ethylhexyl acrylate0.999101 ± 8113 ± 499 ± 27.53.81.6
3-(4-Isopropylphenyl)-2-methylpropionaldehyde0.994104 ± 396 ± 3101 ± 22.53.52.1
3-(Trimethoxysilyl)propyl methacrylate0.993108 ± 581 ± 383 ± 14.84.21.2
4,4′-Difluorobenzophenone0.99789 ± 5106 ± 397 ± 26.03.32.1
4-Methylphenol0.99787 ± 5101 ± 7103 ± 56.06.85.1
4-tert-Butylphenol0.99794 ± 5103 ± 7105 ± 55.06.44.7
Allyl methacrylate0.996105 ± 1099 ± 2101 ± 49.52.44.1
α-Methylstyrene0.994103 ± 9102 ± 3108 ± 48.63.03.8
α-Pinene0.993100 ± 497 ± 2100 ± 34.42.52.7
Benzaldehyde0.99690 ± 799 ± 4102 ± 48.33.73.6
Benzophenone0.99792 ± 7106 ± 4102 ± 78.04.17.1
Benzyl butyl phthalate0.99497 ± 4104 ± 5102 ± 14.15.30.9
Benzyl methacrylate0.99994 ± 7106 ± 5102 ± 47.65.24.4
β-Pinene0.996104 ± 6101 ± 3100 ± 46.02.73.6
Bis(2-ethylhexyl) adipate0.98882 ± 4103 ± 8111 ± 114.67.810.0
Bis(2-ethylhexyl) phthalate0.99299 ± 4103 ± 5113 ± 84.44.87.2
Bis(4-chlorophenyl) sulphone0.99790 ± 795 ± 895 ± 28.18.62.1
Butyl acrylate0.998106 ± 994 ± 2104 ± 28.72.32.2
Butyl benzoate0.99992 ± 8107 ± 5100 ± 18.34.40.8
Butyl lactate0.99696 ± 3101 ± 1100 ± 63.60.76.0
Butyl methacrylate0.99198 ± 1099 ± 3103 ± 410.03.24.1
Butylated hydroxytoluene0.99794 ± 5106 ± 5100 ± 15.14.71.3
Camphor0.99793 ± 7112 ± 3106 ± 27.62.82.2
Cyclohexyl methacrylate0.997100 ± 9113 ± 7103 ± 19.36.21.3
Diallyl phthalate0.99897 ± 798 ± 3100 ± 16.83.50.6
Dibutyl adipate0.99890 ± 5100 ± 5100 ± 66.05.16.0
Dibutyl maleate0.993100 ± 592 ± 5101 ± 15.15.71.0
Dibutyl phthalate0.99799 ± 6105 ± 5100 ± 16.14.70.8
Diethyl phthalate0.99998 ± 2104 ± 496 ± 22.53.71.9
Diisobutyl phthalate0.99792 ± 7105 ± 596 ± 17.64.80.9
Dimethyl isophthalate0.99492 ± 9101 ± 299 ± 19.41.81.3
Dimethyl terephthalate0.99488 ± 699 ± 498 ± 17.03.71.1
Diphenyl phthalate0.99891 ± 496 ± 6102 ± 14.66.50.8
Diphenyl sulphone0.99488 ± 9105 ± 497 ± 810.23.88.1
Divinyl benzene0.997104 ± 7107 ± 5108 ± 36.84.92.5
Ethyl benzoate0.99596 ± 8106 ± 1106 ± 78.41.46.4
Ethylene glycol dimethacrylate0.99996 ± 6103 ± 5101 ± 16.64.41.4
Etocrylene0.99893 ± 697 ± 6104 ± 96.56.08.5
Isobutyl acrylate0.99793 ± 499 ± 398 ± 24.53.22.1
Lauryl acrylate0.98994 ± 8113 ± 799 ± 38.66.23.4
Methyl benzoate0.99093 ± 8103 ± 3102 ± 68.53.36.0
Methyl dihydrojasmonate0.99399 ± 697 ± 5102 ± 16.15.61.0
Methyl salicylate0.99695 ± 6102 ± 4107 ± 66.33.55.9
Octocrylene0.994102 ± 391 ± 7109 ± 52.67.64.8
Phenol0.99093 ± 597 ± 5106 ± 45.14.84.0
Phenyl methacrylate0.99996 ± 7103 ± 2105 ± 37.01.93.1
Propyl benzoate0.99899 ± 8108 ± 2101 ± 18.32.01.3
Styrene0.995100 ± 396 ± 3100 ± 22.63.02.1
tert-Butyl methacrylate0.992103 ± 5100 ± 296 ± 24.42.51.8
Triethoxyvinylsilane0.99598 ± 896 ± 685 ± 38.76.53.8
Triethyl citrate0.99999 ± 491 ± 598 ± 94.45.78.9
Triethyl phosphite0.99281 ± 199 ± 482 ± 41.13.64.6
Trimethylolpropane trimethacrylate0.994106 ± 493 ± 4104 ± 13.44.90.9
Tri-n-butyl acetyl citrate0.995101 ± 488 ± 7103 ± 104.27.59.3
Vinyl laurate0.99990 ± 6110 ± 5100 ± 26.94.41.8
Vinyltrimethoxysilane0.999101 ± 11100 ± 998 ± 1011.18.810.6
a Coefficient of determination (R2) of the calibration curve in the range 40–400 µg L−1, n = 6. b Relative recovery values (%) obtained in the analysis of Sample 1, expressed as the mean value of three replicates ± standard deviation. c Precision expressed as relative standard deviation (RSD, %), n = 5.
Table 3. Migration test conditions for the analyzed samples according to Regulation 10/2011 [1].
SampleFood Category of
Intended Use
Worst Foreseeable Food Contact Time (t) and Temperature (T)Selected Conditions for Migration Test
1Preserved vegetables or preserved animal products (fish, meat) in an oily mediumAbove 30 days,
20 °C < T ≤ 40 °C
Food simulant A,
10 days at 60 °C
2Clear drinks: Water, ciders, fruit or vegetable juices, infusions, coffee, tea, energy drinks, etc. 6 hours < t ≤ 24 h,
20 °C < T ≤ 40 °C
Food simulant B,
24 h at 40 °C
3Alcoholic beverages of an alcoholic strength <20% (wine, beer, etc.) or clear drinks1 hour < t ≤ 2 h,
20 °C < T ≤ 40 °C
Food simulant C,
2 h at 40 °C
4Milk and milk-based drinks whole, partly dried and skimmed, or partly skimmed6 hours < t ≤ 24 h,
20 °C < T ≤ 40 °C, including a hot filling up to 70 °C
Food simulant D1, 2 hours at 70 °C and 24 h at 40 °C
Publisher’s Note: MDPI stays neutral with regard to jurisdictional claims in published maps and institutional affiliations.

