
A Comparison of Cysteine-Conjugated Nitroxide Spin Labels for Pulse Dipolar EPR Spectroscopy


Abstract
:1. Introduction
2. Materials and Methods
2.1. Protein Construct and Spin Labelling
2.2. Continuous Wave (CW) EPR Spectroscopy
2.3. Pulse Dipolar EPR—Sample Preparation and Measurement
2.4. Modelling
3. Results and Discussion
3.1. Spin Labelling
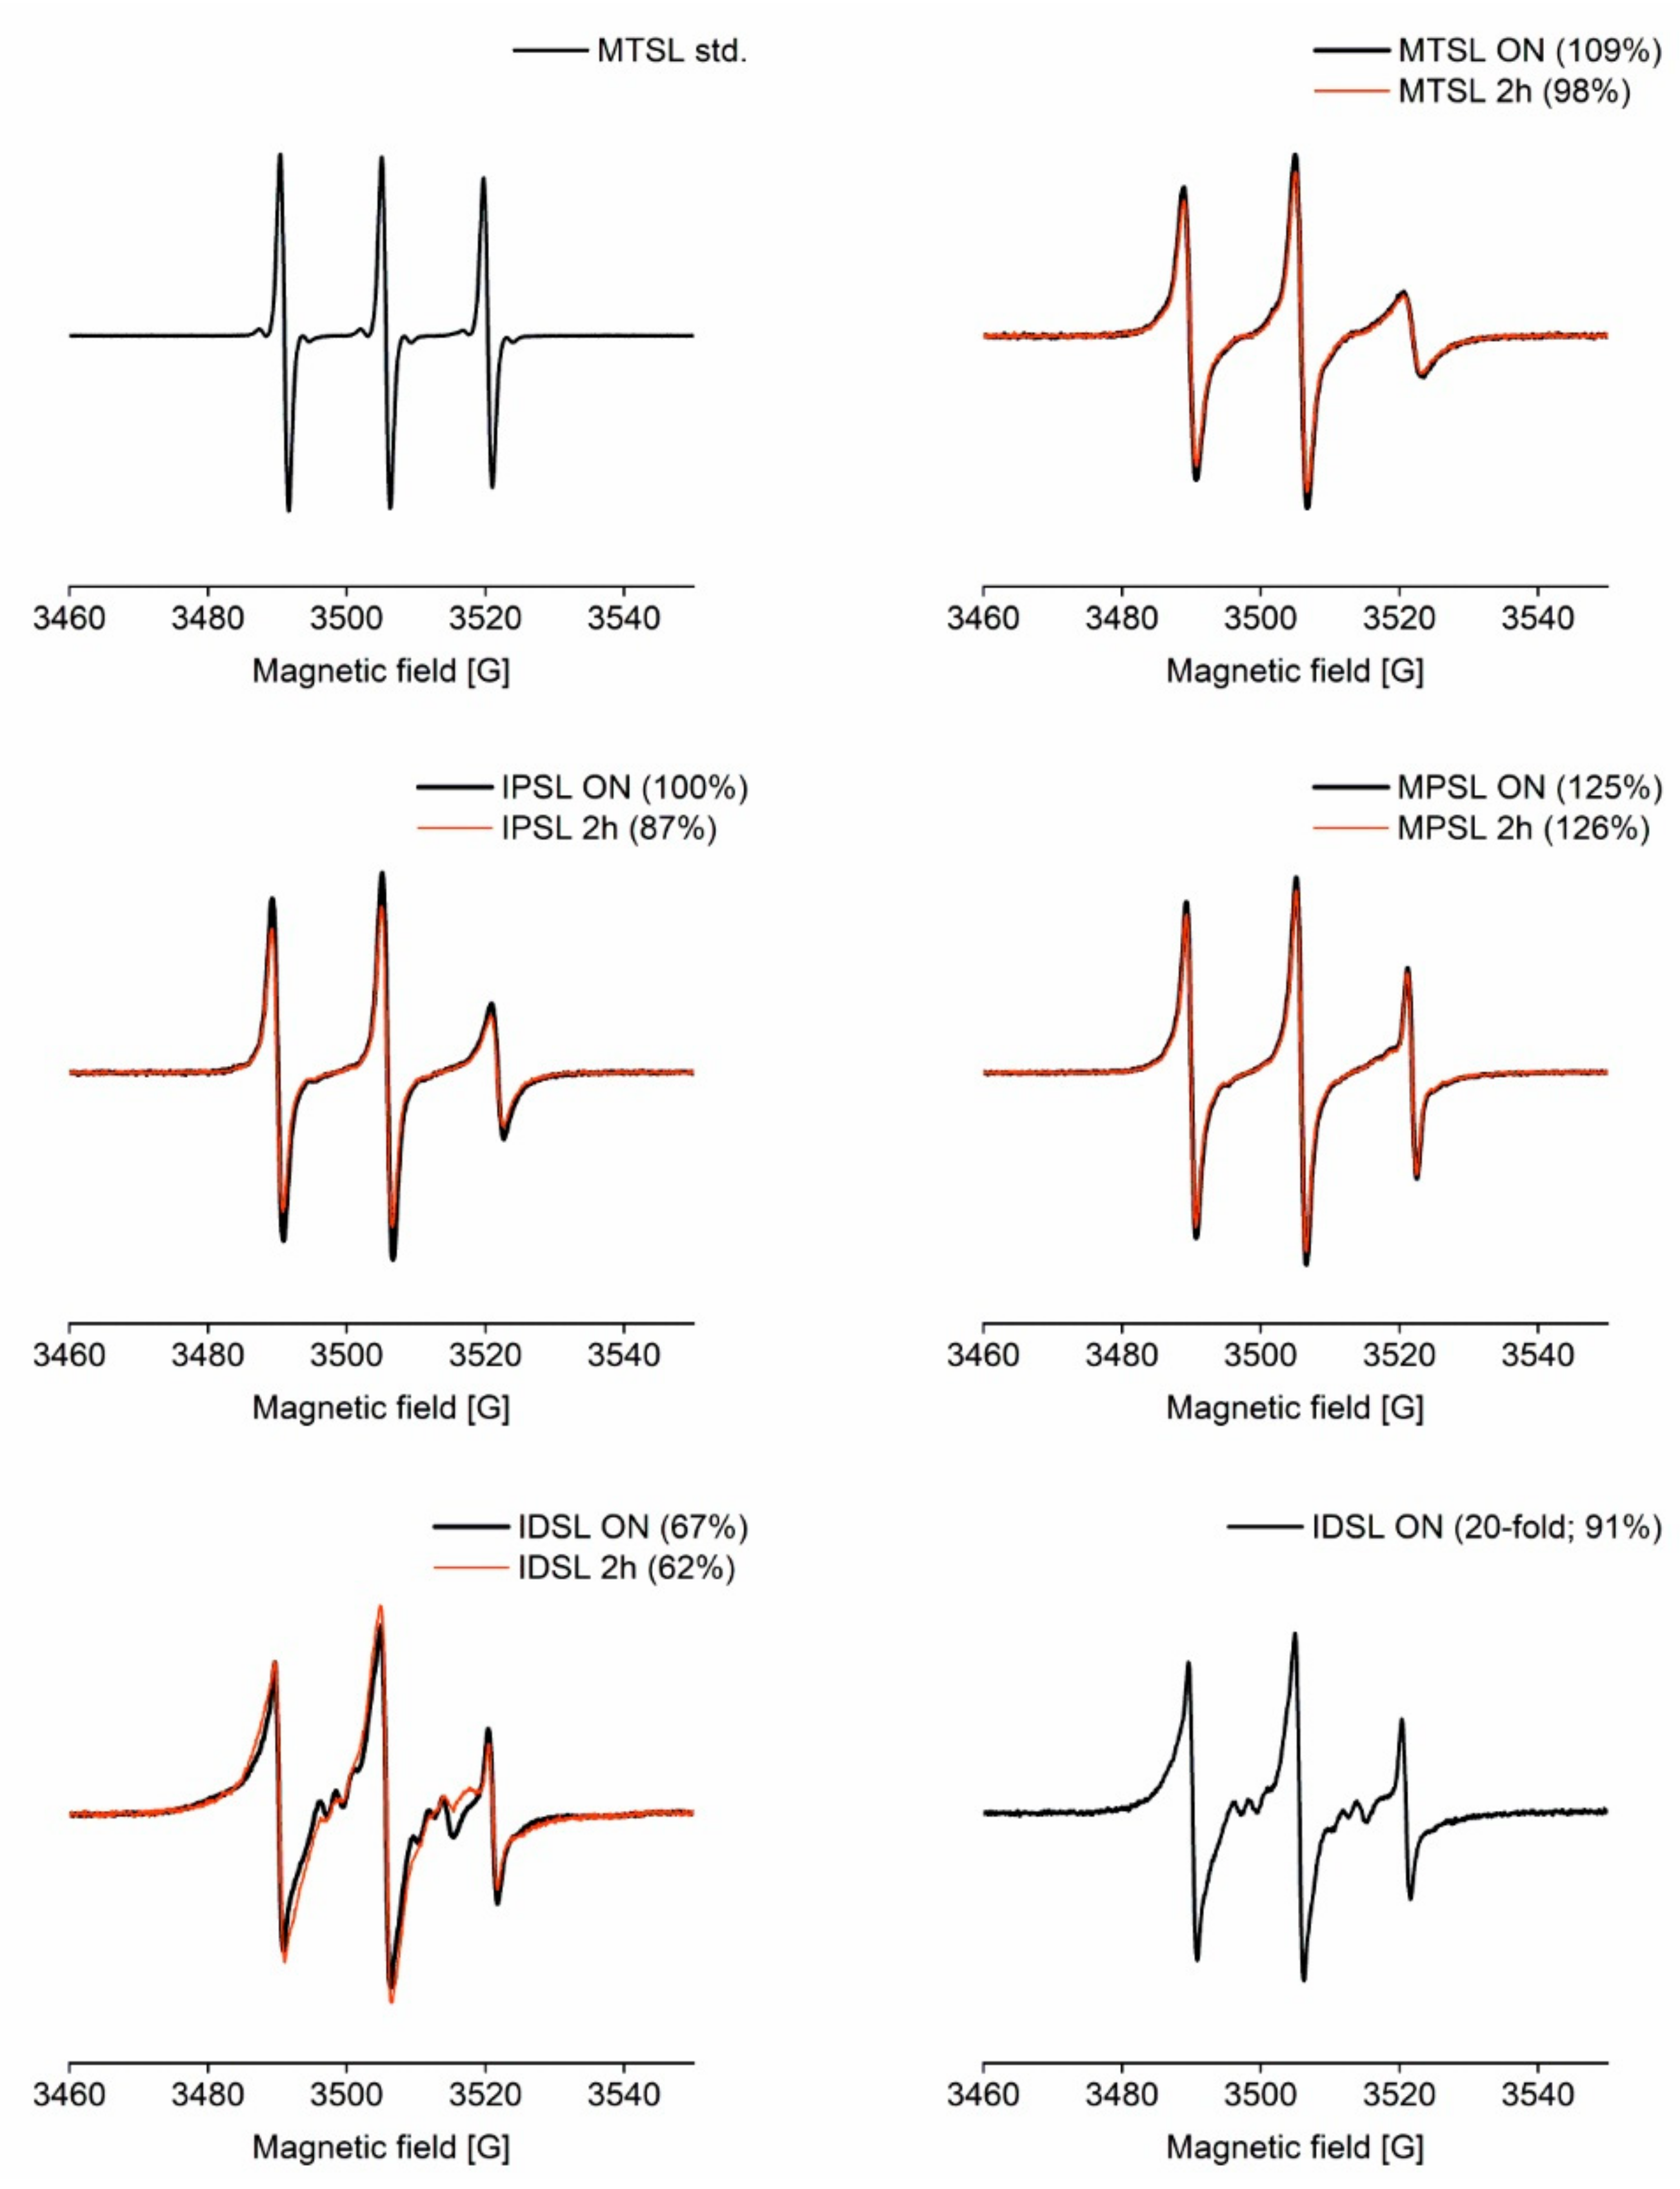
3.1.1. CW EPR
3.1.2. Mass Spectrometry
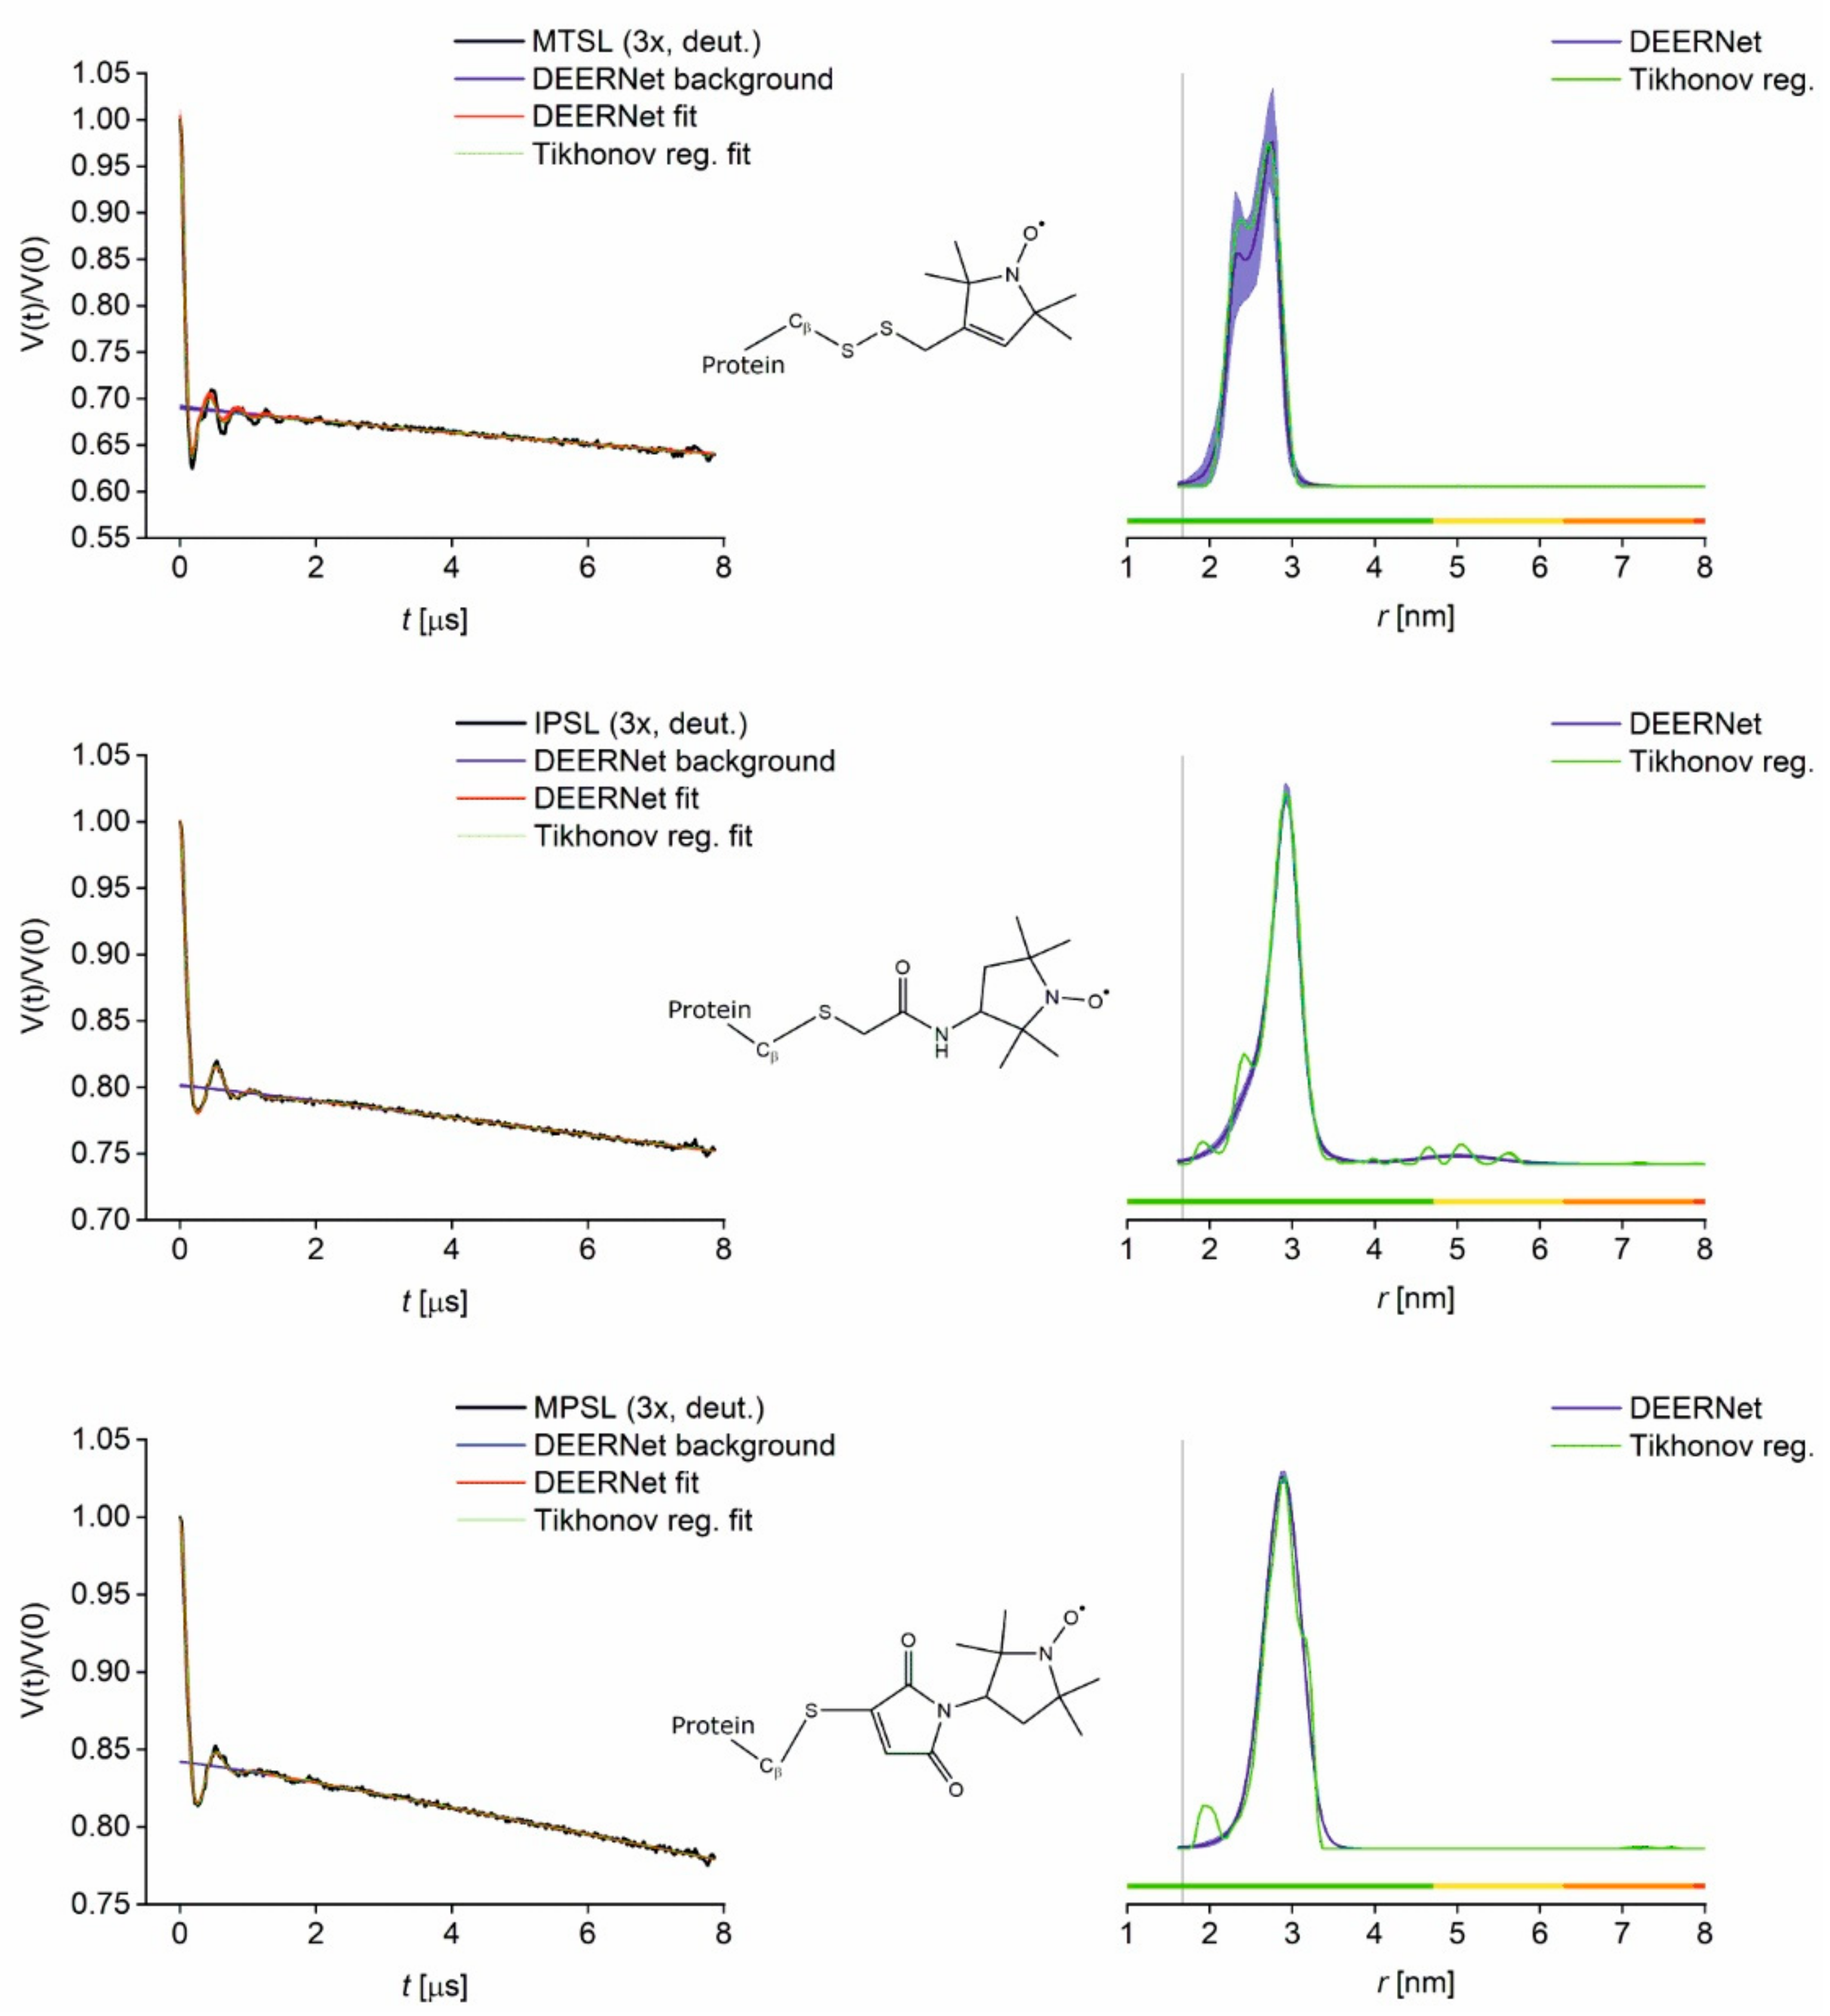
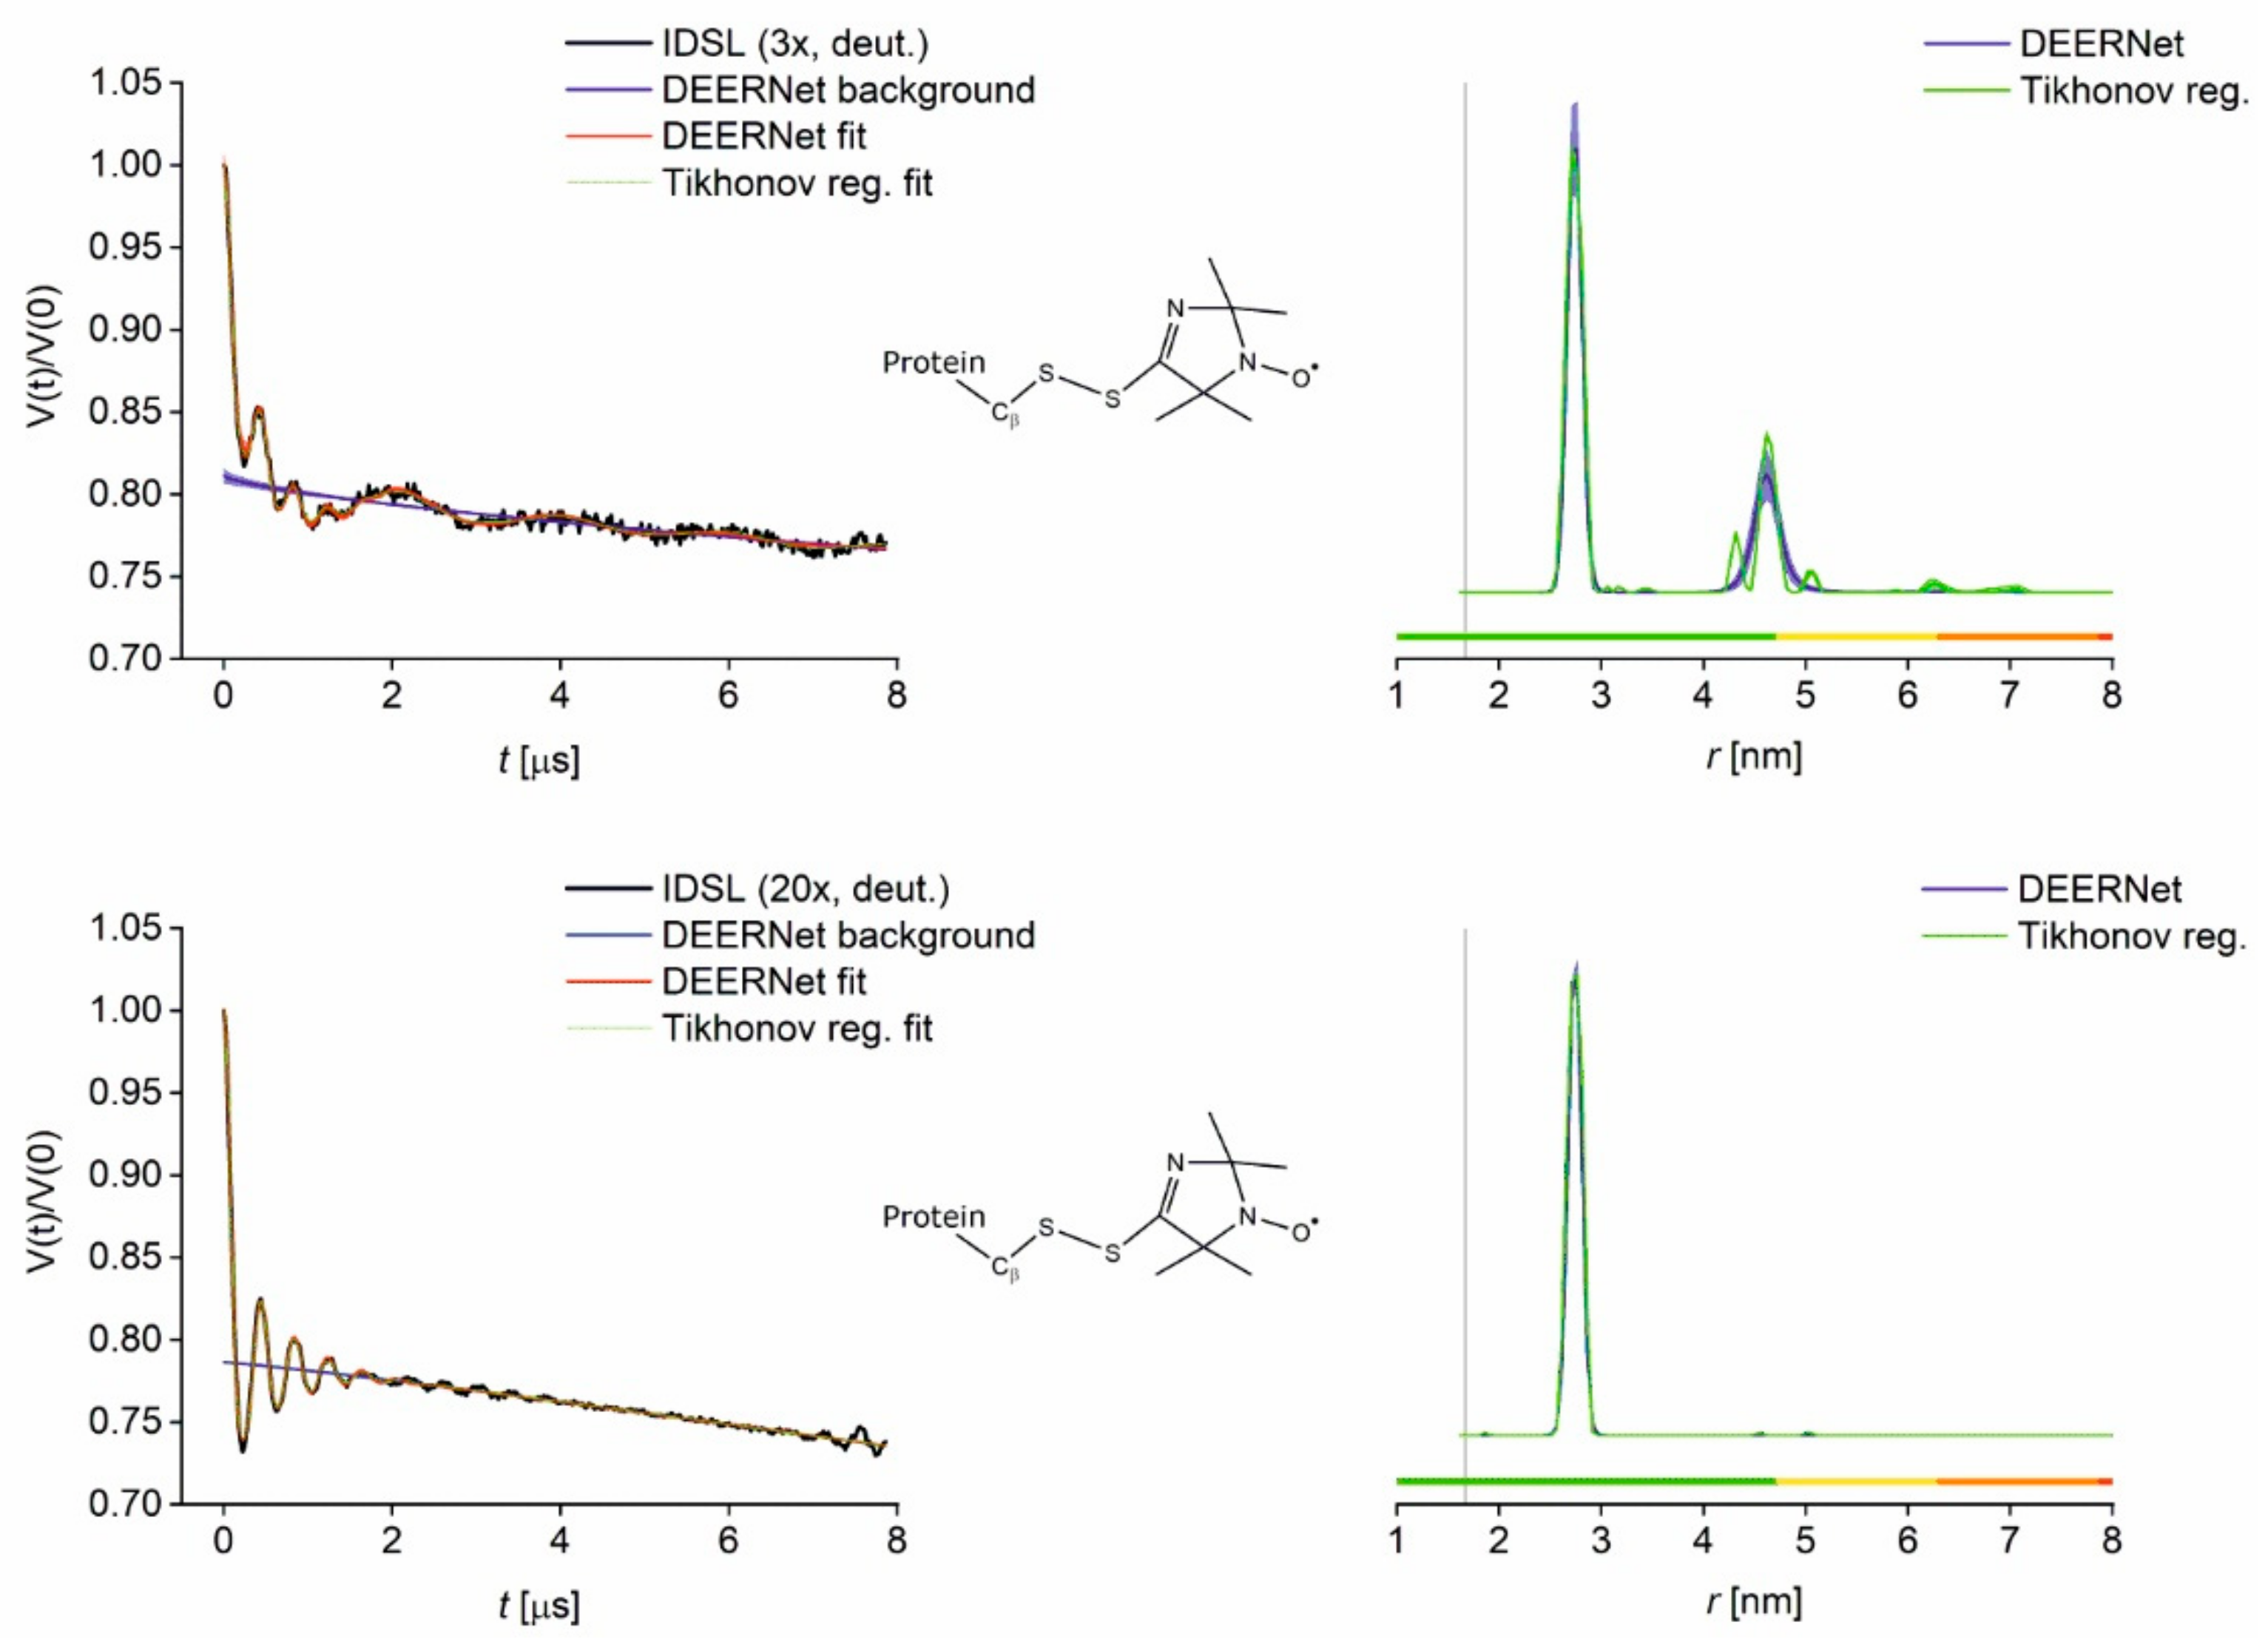
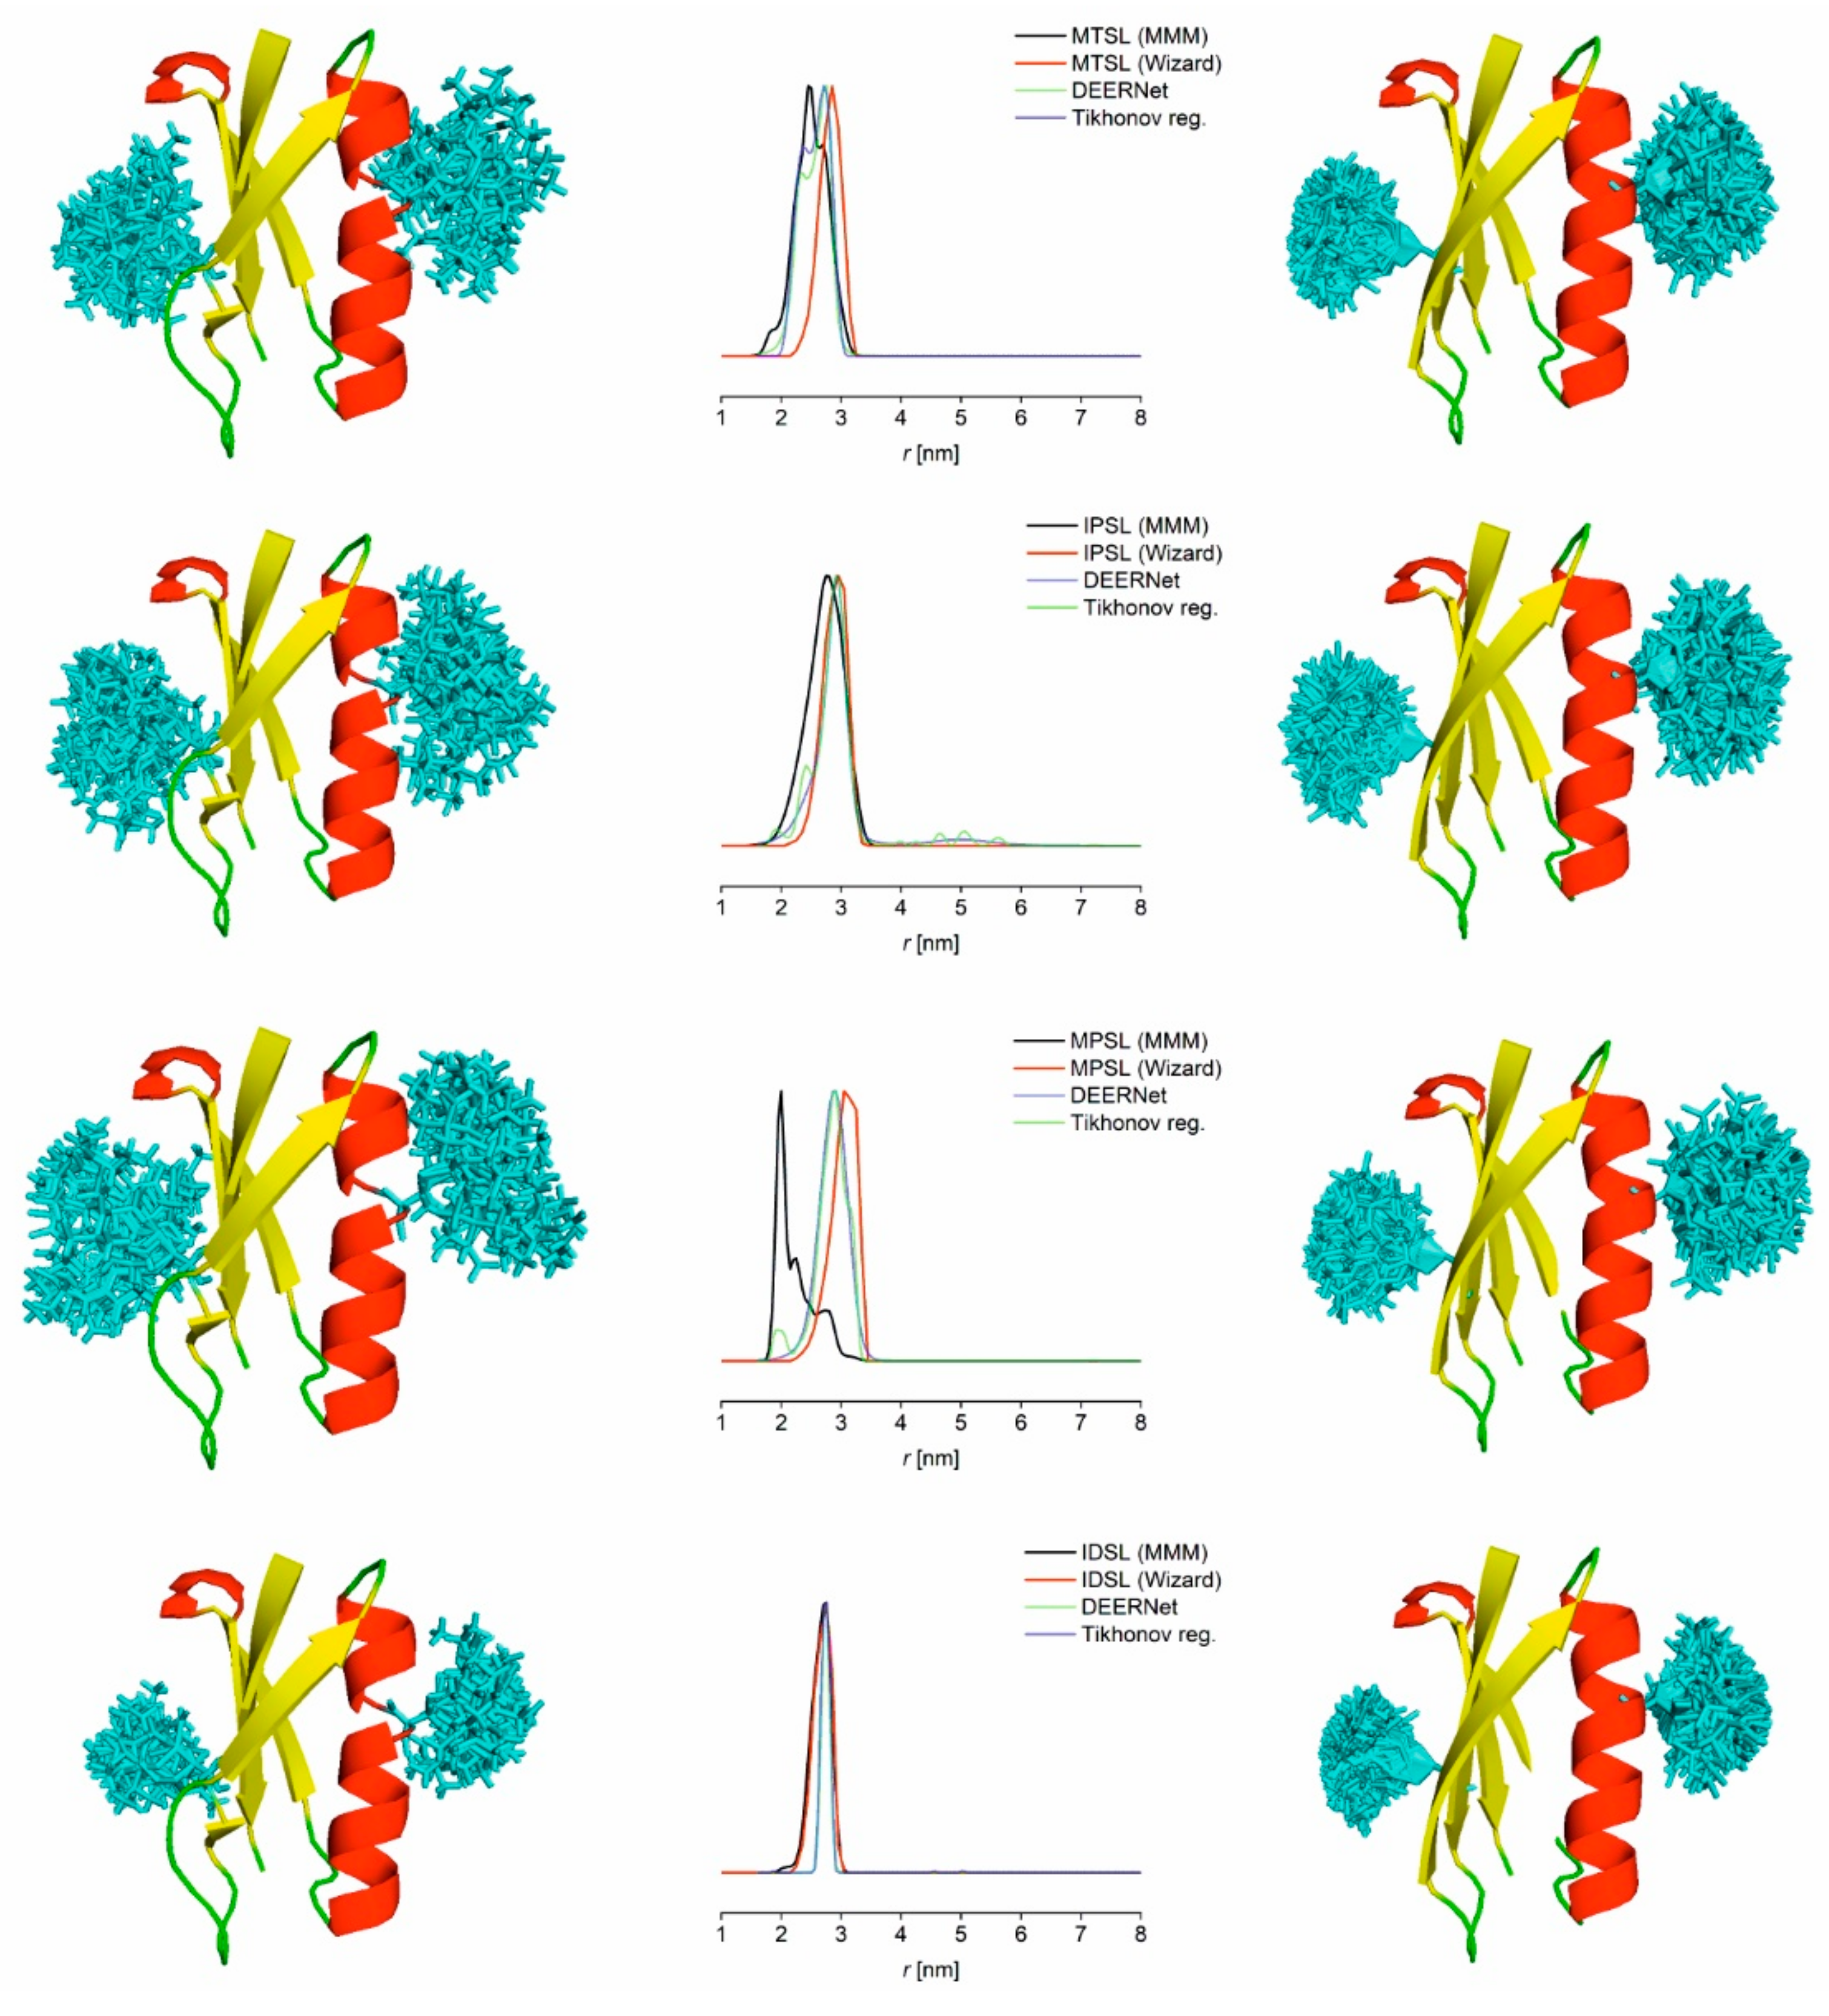
3.2. PDS Distance Measurements (PELDOR/DEER) and Comparison to Modelling
4. Conclusions and Outlook
Supplementary Materials
Author Contributions
Funding
Institutional Review Board Statement
Informed Consent Statement
Data Availability Statement
Acknowledgments
Conflicts of Interest
Sample Availability
References
- Bragg, W.H.; Bragg, W.L. The Reflection of X-rays by Crystals. Proc. R. Soc. Lond. A 1913, 88, 428–438. [Google Scholar] [CrossRef]
- Anfinsen, C.B. Principles that Govern the Folding of Protein Chains. Science 1973, 181, 223–230. [Google Scholar] [CrossRef] [Green Version]
- Fuller, A.L.; Scott-Hayward, L.A.S.; Li, Y.; Bühl, M.; Slawin, A.M.Z.; Woollins, J.D. Automated Chemical Crystallography. J. Am. Chem. Soc. 2010, 132, 5799–5802. [Google Scholar] [CrossRef] [PubMed] [Green Version]
- Jeschke, G. DEER Distance Measurements on Proteins. Annu. Rev. Phys. Chem. 2012, 63, 419–446. [Google Scholar] [CrossRef] [PubMed] [Green Version]
- Schiemann, O.; Prisner, T.F. Long-Range Distance Determinations in Biomacromolecules by EPR Spectroscopy. Q. Rev. Biophys. 2007, 40, 1–53. [Google Scholar] [CrossRef]
- Kerry, P.S.; Turkington, H.L.; Ackermann, K.; Jameison, S.A.; Bode, B.E. Analysis of Influenza A Virus NS1 Dimer Interfaces in Solution by Pulse EPR Distance Measurements. J. Phys. Chem. B 2014, 118, 10882–10888. [Google Scholar] [CrossRef] [PubMed] [Green Version]
- Theillet, F.-X.; Binolfi, A.; Bekei, B.; Martorana, A.; Rose, H.M.; Stuiver, M.; Verzini, S.; Lorenz, D.; van Rossum, M.; Goldfarb, D.; et al. Structural Disorder of Monomeric α-Synuclein Persists in Mammalian Cells. Nature 2016, 530, 45–50. [Google Scholar] [CrossRef] [Green Version]
- Bleicken, S.; Assafa, T.E.; Stegmueller, C.; Wittig, A.; Garcia-Saez, A.J.; Bordignon, E. Topology of Active, Membrane-Embedded Bax in the Context of a Toroidal Pore. Cell Death Differ. 2018, 25, 1717–1731. [Google Scholar] [CrossRef] [Green Version]
- Joseph, B.; Sikora, A.; Cafiso, D.S. Ligand Induced Conformational Changes of a Membrane Transporter in E. coli Cells Observed with DEER/PELDOR. J. Am. Chem. Soc. 2016, 138, 1844–1847. [Google Scholar] [CrossRef] [PubMed] [Green Version]
- Sameach, H.; Narunsky, A.; Azoulay-Ginsburg, S.; Gevorkyan-Aiapetov, L.; Zehavi, Y.; Moskovitz, Y.; Juven-Gershon, T.; Ben-Tal, N.; Ruthstein, S. Structural and Dynamics Characterization of the MerR Family Metalloregulator CueR in its Repression and Activation States. Structure 2017, 25, 988–996.e3. [Google Scholar] [CrossRef] [PubMed] [Green Version]
- Kulik, L.V.; Dzuba, S.A.; Grigoryev, I.A.; Tsvetkov, Y.D. Electron Dipole–Dipole Interaction in ESEEM of Nitroxide Biradicals. Chem. Phys. Lett. 2001, 343, 315–324. [Google Scholar] [CrossRef]
- Milov, A.D.; Ponomarev, A.B.; Tsvetkov, Y.D. Electron-Electron Double Resonance in Electron Spin Echo: Model Biradical Systems and the Sensitized Photolysis of Decalin. Chem. Phys. Lett. 1984, 110, 67–72. [Google Scholar] [CrossRef]
- Milov, A.D.; Salikov, K.M.; Shirov, M.D. Application of ELDOR in Electron-Spin Echo for Paramagnetic Center Space Distribution in Solids. Fiz. Tverd. Tela 1981, 23, 975–982. [Google Scholar]
- Altenbach, C.; Marti, T.; Khorana, H.G.; Hubbell Wayne, L. Transmembrane Protein Structure: Spin Labeling of Bacteriorhodopsin Mutants. Science 1990, 248, 1088–1092. [Google Scholar] [CrossRef] [PubMed]
- Hubbell, W.L.; Altenbach, C. Investigation of Structure and Dynamics in Membrane Proteins Using Site-Directed Spin Labeling. Curr. Opin. Struct. Biol. 1994, 4, 566–573. [Google Scholar] [CrossRef]
- Abdullin, D.; Hagelueken, G.; Schiemann, O. Determination of Nitroxide Spin Label Conformations via PELDOR and X-ray Crystallography. Phys. Chem. Chem. Phys. 2016, 18, 10428–10437. [Google Scholar] [CrossRef] [PubMed]
- Hagelueken, G.; Ward, R.; Naismith, J.H.; Schiemann, O. MtsslWizard: In Silico Spin-Labeling and Generation of Distance Distributions in PyMOL. Appl. Magn. Reson. 2012, 42, 377–391. [Google Scholar] [CrossRef] [PubMed] [Green Version]
- Jeschke, G. Conformational Dynamics and Distribution of Nitroxide Spin Labels. Prog. Nucl. Magn. Reson. Spectrosc. 2013, 72, 42–60. [Google Scholar] [CrossRef] [PubMed] [Green Version]
- Polyhach, Y.; Bordignon, E.; Jeschke, G. Rotamer Libraries of Spin Labelled Cysteines for Protein Studies. Phys. Chem. Chem. Phys. 2011, 13, 2356–2366. [Google Scholar] [CrossRef] [PubMed] [Green Version]
- Spicher, S.; Abdullin, D.; Grimme, S.; Schiemann, O. Modeling of Spin–Spin Distance Distributions for Nitroxide Labeled Biomacromolecules. Phys. Chem. Chem. Phys. 2020, 22, 24282–24290. [Google Scholar] [CrossRef] [PubMed]
- Jeschke, G. The Contribution of Modern EPR to Structural Biology. Emerg. Top. Life Sci. 2018, 2, 9–18. [Google Scholar]
- Margraf, D.; Bode, B.E.; Marko, A.; Schiemann, O.; Prisner, T.F. Conformational Flexibility of Nitroxide Biradicals Determined by X-Band PELDOR Experiments. Mol. Phys. 2007, 105, 2153–2160. [Google Scholar] [CrossRef]
- Bode, B.E.; Plackmeyer, J.; Bolte, M.; Prisner, T.F.; Schiemann, O. PELDOR on an Exchange Coupled Nitroxide Copper(II) Spin Pair. J. Organomet. Chem. 2009, 694, 1172–1179. [Google Scholar] [CrossRef]
- Richert, S.; Cremers, J.; Kuprov, I.; Peeks, M.D.; Anderson, H.L.; Timmel, C.R. Constructive Quantum Interference in a Bis-Copper Six-Porphyrin Nanoring. Nat Commun 2017, 8, 14842. [Google Scholar] [CrossRef] [PubMed] [Green Version]
- Weber, A.; Schiemann, O.; Bode, B.; Prisner, T.F. PELDOR at S- and X-Band Frequencies and the Separation of Exchange Coupling from Dipolar Coupling. J. Magn. Reson. 2002, 157, 277–285. [Google Scholar] [CrossRef] [PubMed] [Green Version]
- Ackermann, K.; Giannoulis, A.; Cordes, D.B.; Slawin, A.M.Z.; Bode, B.E. Assessing Dimerisation Degree and Cooperativity in a Biomimetic Small-Molecule Model by Pulsed EPR. Chem. Commun. 2015, 51, 5257–5260. [Google Scholar] [CrossRef] [PubMed] [Green Version]
- Bode, B.E.; Margraf, D.; Plackmeyer, J.; Dürner, G.; Prisner, T.F.; Schiemann, O. Counting the Monomers in Nanometer-Sized Oligomers by Pulsed Electron−Electron Double Resonance. J. Am. Chem. Soc. 2007, 129, 6736–6745. [Google Scholar] [CrossRef] [PubMed]
- Bode, B.E.; Dastvan, R.; Prisner, T.F. Pulsed Electron–Electron Double Resonance (PELDOR) Distance Measurements in Detergent Micelles. J. Magn. Reson. 2011, 211, 11–17. [Google Scholar] [CrossRef] [PubMed]
- Dastvan, R.; Bode, B.E.; Karuppiah, M.P.R.; Marko, A.; Lyubenova, S.; Schwalbe, H.; Prisner, T.F. Optimization of Transversal Relaxation of Nitroxides for Pulsed Electron−Electron Double Resonance Spectroscopy in Phospholipid Membranes. J. Phys. Chem. B 2010, 114, 13507–13516. [Google Scholar] [CrossRef] [PubMed]
- Valera, S.; Bode, B.E. Strategies for the Synthesis of Yardsticks and Abaci for Nanometre Distance Measurements by Pulsed EPR. Molecules 2014, 19, 20227–20256. [Google Scholar] [CrossRef] [PubMed] [Green Version]
- Assafa, T.E.; Nandi, S.; Śmiłowicz, D.; Galazzo, L.; Teucher, M.; Elsner, C.; Pütz, S.; Bleicken, S.; Robin, A.Y.; Westphal, D.; et al. Biophysical Characterization of Pro-apoptotic BimBH3 Peptides Reveals an Unexpected Capacity for Self-Association. Structure 2020, 29, 114–124. [Google Scholar] [CrossRef] [PubMed]
- Giannoulis, A.; Ward, R.; Branigan, E.; Naismith, J.H.; Bode, B.E. PELDOR in Rotationally Symmetric Homo-Oligomers. Mol. Phys. 2013, 111, 2845–2854. [Google Scholar] [CrossRef] [PubMed] [Green Version]
- Jeschke, G.; Sajid, M.; Schulte, M.; Godt, A. Three-Spin Correlations in Double Electron–Electron Resonance. Phys. Chem. Chem. Phys. 2009, 11, 6580–6591. [Google Scholar] [CrossRef] [PubMed]
- Valera, S.; Taylor, J.E.; Daniels, D.S.B.; Dawson, D.M.; Athukorala Arachchige, K.S.; Ashbrook, S.E.; Slawin, A.M.Z.; Bode, B.E. A Modular Approach for the Synthesis of Nanometer-Sized Polynitroxide Multi-Spin Systems. J. Org. Chem. 2014, 79, 8313–8323. [Google Scholar] [CrossRef] [Green Version]
- von Hagens, T.; Polyhach, Y.; Sajid, M.; Godt, A.; Jeschke, G. Suppression of Ghost Distances in Multiple-Spin Double Electron–Electron Resonance. Phys. Chem. Chem. Phys. 2013, 15, 5854–5866. [Google Scholar] [CrossRef] [Green Version]
- Ackermann, K.; Pliotas, C.; Valera, S.; Naismith, J.H.; Bode, B.E. Sparse Labeling PELDOR Spectroscopy on Multimeric Mechanosensitive Membrane Channels. Biophys. J. 2017, 113, 1968–1978. [Google Scholar] [CrossRef] [PubMed] [Green Version]
- Valera, S.; Ackermann, K.; Pliotas, C.; Huang, H.; Naismith, J.H.; Bode, B.E. Accurate Extraction of Nanometer Distances in Multimers by Pulse EPR. Chem. Eur. J. 2016, 22, 4700–4703. [Google Scholar] [CrossRef] [PubMed] [Green Version]
- Kapsalis, C.; Wang, B.; El Mkami, H.; Pitt, S.J.; Schnell, J.R.; Smith, T.K.; Lippiat, J.D.; Bode, B.E.; Pliotas, C. Allosteric Activation of an Ion Channel Triggered by Modification of Mechanosensitive Nano-Pockets. Nat. Commun. 2019, 10, 4619. [Google Scholar] [CrossRef] [Green Version]
- Morten, M.J.; Peregrina, J.R.; Figueira-Gonzalez, M.; Ackermann, K.; Bode, B.E.; White, M.F.; Penedo, J.C. Binding Dynamics of a Monomeric SSB Protein to DNA: A Single-Molecule Multi-Process Approach. Nucleic Acids Res. 2015, 43, 10907–10924. [Google Scholar] [CrossRef]
- Ackermann, K.; Wort, J.L.; Bode, B.E. Nanomolar Pulse Dipolar EPR Spectroscopy in Proteins: CuII–CuII and Nitroxide–Nitroxide Cases. J. Phys. Chem. B 2021, 125, 5358–5364. [Google Scholar] [CrossRef] [PubMed]
- Cunningham, T.F.; Putterman, M.R.; Desai, A.; Horne, W.S.; Saxena, S. The Double-Histidine Cu2+-Binding Motif: A Highly Rigid, Site-Specific Spin Probe for Electron Spin Resonance Distance Measurements. Angew. Chem. Int. Ed. 2015, 54, 6330–6334. [Google Scholar] [CrossRef] [PubMed] [Green Version]
- Singewald, K.; Bogetti, X.; Sinha, K.; Rule, G.S.; Saxena, S. Double Histidine Based EPR Measurements at Physiological Temperatures Permit Site-Specific Elucidation of Hidden Dynamics in Enzymes. Angew. Chem. Int. Ed. 2020, 59, 23040–23044. [Google Scholar] [CrossRef] [PubMed]
- Wort, J.L.; Ackermann, K.; Giannoulis, A.; Stewart, A.J.; Norman, D.G.; Bode, B.E. Sub-Micromolar Pulse Dipolar EPR Spectroscopy Reveals Increasing CuII-labelling of Double-Histidine Motifs with Lower Temperature. Angew. Chem. Int. Ed. 2019, 58, 11681–11685. [Google Scholar] [CrossRef] [Green Version]
- Wort, J.L.; Ackermann, K.; Norman, D.G.; Bode, B.E. A General Model to Optimise CuII Labelling Efficiency of Double-Histidine Motifs for Pulse Dipolar EPR Applications. Phys. Chem. Chem. Phys. 2021, 23, 3810–3819. [Google Scholar] [CrossRef] [PubMed]
- Wort, J.L.; Arya, S.; Ackermann, K.; Stewart, A.J.; Bode, B.E. Pulse Dipolar EPR Reveals Double-Histidine Motif CuII–NTA Spin-Labeling Robustness against Competitor Ions. J. Phys. Chem. Lett. 2021, 12, 2815–2819. [Google Scholar] [CrossRef] [PubMed]
- Bordignon, E.; Polyhach, Y. EPR Techniques to Probe Insertion and Conformation of Spin-Labeled Proteins in Lipid Bilayers. In Lipid-Protein Interactions: Methods and Protocols; Kleinschmidt, J.H., Ed.; Humana Press: Totowa, NJ, USA, 2013; pp. 329–355. [Google Scholar]
- Joseph, B.; Jaumann, E.A.; Sikora, A.; Barth, K.; Prisner, T.F.; Cafiso, D.S. In Situ Observation of Conformational Dynamics and Protein Ligand–Substrate Interactions in Outer-Membrane Proteins with DEER/PELDOR Spectroscopy. Nat. Protoc. 2019, 14, 2344–2369. [Google Scholar] [CrossRef] [PubMed]
- Structural Information from Spin-Labels and Intrinsic Paramagnetic Centres in the Biosciences; Timmel, C.R.; Harmer, J.R. (Eds.) Springer: Berlin/Heidelberg, Germany, 2013. [Google Scholar]
- Bordignon, E. EPR Spectroscopy of Nitroxide Spin Probes. eMagRes 2017, 6, 235–254. [Google Scholar]
- Fanucci, G.E.; Cafiso, D.S. Recent Advances and Applications of Site-Directed Spin Labeling. Curr. Opin. Struct. Biol. 2006, 16, 644–653. [Google Scholar] [CrossRef] [PubMed]
- Berliner, L.J.; Grunwald, J.; Hankovszky, H.O.; Hideg, K. A Novel Reversible Thiol-Specific Spin Label: Papain Active Site Labeling and Inhibition. Anal. Biochem. 1982, 119, 450–455. [Google Scholar] [CrossRef]
- Gmeiner, C.; Dorn, G.; Allain, F.H.T.; Jeschke, G.; Yulikov, M. Spin Labelling for Integrative Structure Modelling: A Case Study of the Polypyrimidine-Tract Binding Protein 1 Domains in Complexes with Short RNAs. Phys. Chem. Chem. Phys. 2017, 19, 28360–28380. [Google Scholar] [CrossRef]
- Hellmich, U.A.; Lyubenova, S.; Kaltenborn, E.; Doshi, R.; van Veen, H.W.; Prisner, T.F.; Glaubitz, C. Probing the ATP Hydrolysis Cycle of the ABC Multidrug Transporter LmrA by Pulsed EPR Spectroscopy. J. Am. Chem. Soc. 2012, 134, 5857–5862. [Google Scholar] [CrossRef] [PubMed]
- Volkov, A.; Dockter, C.; Bund, T.; Paulsen, H.; Jeschke, G. Pulsed EPR Determination of Water Accessibility to Spin-Labeled Amino Acid Residues in LHCIIb. Biophys. J. 2009, 96, 1124–1141. [Google Scholar] [CrossRef] [Green Version]
- Páli, T.; Finbow, M.E.; Marsh, D. Membrane Assembly of the 16-kDa Proteolipid Channel from Nephrops norvegicus Studied by Relaxation Enhancements in Spin-Label ESR. Biochemistry 1999, 38, 14311–14319. [Google Scholar] [CrossRef] [PubMed]
- Pantusa, M.; Sportelli, L.; Bartucci, R. Spectroscopic and Calorimetric Studies on the Interaction of Human Serum Albumin with DPPC/PEG:2000-DPPE Membranes. Eur. Biophys. J. 2008, 37, 961–973. [Google Scholar] [CrossRef] [PubMed]
- Shenberger, Y.; Gottlieb, H.E.; Ruthstein, S. EPR and NMR Spectroscopies Provide Input on the Coordination of Cu(I) and Ag(I) to a Disordered Methionine Segment. JBIC J. Biol. Inorg. Chem. 2015, 20, 719–727. [Google Scholar] [CrossRef] [PubMed]
- Balo, A.R.; Feyrer, H.; Ernst, O.P. Toward Precise Interpretation of DEER-Based Distance Distributions: Insights from Structural Characterization of V1 Spin-Labeled Side Chains. Biochemistry 2016, 55, 5256–5263. [Google Scholar] [CrossRef] [PubMed]
- Toledo Warshaviak, D.; Khramtsov, V.V.; Cascio, D.; Altenbach, C.; Hubbell, W.L. Structure and Dynamics of an Imidazoline Nitroxide Side Chain with Strongly Hindered Internal Motion in Proteins. J. Magn. Reson. 2013, 232, 53–61. [Google Scholar] [CrossRef] [PubMed] [Green Version]
- Weiner, L.M. [8] Quantitative Determination of Thiol Groups in Low and High Molecular Weight Compounds by Electron Paramagnetic Resonance. In Methods in Enzymology; Elsevier: Amsterdam, The Netherlands, 1995; Volume 251, pp. 87–105. [Google Scholar]
- Wingler, L.M.; Elgeti, M.; Hilger, D.; Latorraca, N.R.; Lerch, M.T.; Staus, D.P.; Dror, R.O.; Kobilka, B.K.; Hubbell, W.L.; Lefkowitz, R.J. Angiotensin Analogs with Divergent Bias Stabilize Distinct Receptor Conformations. Cell 2019, 176, 468–478.e11. [Google Scholar] [CrossRef] [Green Version]
- Larsen, R.G.; Singel, D.J. Double Electron-Electron Resonance Spin-Echo Modulation—Spectroscopic Measurement of Electron-Spin Pair Separations in Orientationally Disordered Solids. J. Chem. Phys. 1993, 98, 5134–5146. [Google Scholar] [CrossRef] [Green Version]
- Pannier, M.; Veit, S.; Godt, A.; Jeschke, G.; Spiess, H.W. Dead-Time Free Measurement of Dipole-Dipole Interactions between Spins. J. Magn. Reson. 2000, 142, 331–340. [Google Scholar] [CrossRef] [Green Version]
- Jeschke, G.; Chechik, V.; Ionita, P.; Godt, A.; Zimmermann, H.; Banham, J.; Timmel, C.R.; Hilger, D.; Jung, H. DeerAnalysis2006—A Comprehensive Software Package for Analyzing Pulsed ELDOR Data. Appl. Magn. Reson. 2006, 30, 473–498. [Google Scholar] [CrossRef]
- Schiemann, O.; Heubach, C.A.; Abdullin, D.; Ackermann, K.; Azarkh, M.; Bagryanskaya, E.G.; Drescher, M.; Endeward, B.; Freed, J.H.; Galazzo, L.; et al. Benchmark Test and Guidelines for DEER/PELDOR Experiments on Nitroxide-Labeled Biomolecules. J. Am. Chem. Soc. 2021, 143, 17875–17890. [Google Scholar] [CrossRef] [PubMed]
- Worswick, S.G.; Spencer, J.A.; Jeschke, G.; Kuprov, I. Deep Neural Network Processing of DEER Data. Sci. Adv. 2018, 4, eaat5218. [Google Scholar] [CrossRef] [PubMed] [Green Version]
- Fábregas Ibáñez, L.; Jeschke, G.; Stoll, S. DeerLab: A Comprehensive Software Package for Analyzing Dipolar Electron Paramagnetic Resonance Spectroscopy Data. Magn. Reson. 2020, 1, 209–224. [Google Scholar] [CrossRef] [PubMed]
- Hagelueken, G.; Abdullin, D.; Schiemann, O. mtsslSuite: Probing Biomolecular Conformation by Spin-Labeling Studies. Methods Enzymol. 2015, 563, 595–622. [Google Scholar] [PubMed]
- The PyMOL Molecular Graphics System; Version 1.2r3pre; Schrödinger, LLC: New York, NY, USA, 2011.
- Ackermann, K.; Chapman, A.; Bode, B.E. A Comparison of Cysteine-Conjugated Nitroxide Spin Labels for Pulse Dipolar EPR Spectroscopy (Dataset), University of St Andrews Research Portal. Available online: https://doi.org/10.17630/70739623-1bb5-40e6-b326-5fff1e22c289. [CrossRef]


| Spin Label Name This Study | Side-Chain in MMM | Side-Chain in MtsslSuite |
|---|---|---|
| MTSL | MTSL | R1 |
| IPSL | IA-Proxyl | Proxyl |
| MPSL | MA-Proxyl | malR1 |
| IDSL | V1 | sR1 |
| Incubation | MTSL | IPSL | MPSL | IDSL |
|---|---|---|---|---|
| 2 h, 3-fold | 98% | 87% | 126% | 62% |
| ON, 3-fold | 109% | 100% | 125% | 67% |
| ON, 20-fold | - | - | - | 91% |
| Wizard/MMM | Deuterated/Protonated | DEERNet | Regularised | ||||
|---|---|---|---|---|---|---|---|
| RMSD | DEERNet | Regularised | Deuterated/Wizard | Deuterated/MMM | Deuterated/Wizard | Deuterated/MMM | |
| MTSL | 0.1363 | 0.1118 | 0.1161 | 0.1165 | 0.0459 | 0.1237 | 0.0421 |
| IPSL | 0.0803 | 0.0568 | 0.0628 | 0.0311 | 0.0750 | 0.0340 | 0.0732 |
| MPSL | 0.1866 | 0.0432 | 0.0613 | 0.0981 | 0.1741 | 0.0917 | 0.1624 |
| IDSL | 0.0156 | 0.0907 | 0.1099 | 0.0771 | 0.0819 | 0.0714 | 0.0769 |
Publisher’s Note: MDPI stays neutral with regard to jurisdictional claims in published maps and institutional affiliations. |
© 2021 by the authors. Licensee MDPI, Basel, Switzerland. This article is an open access article distributed under the terms and conditions of the Creative Commons Attribution (CC BY) license (https://creativecommons.org/licenses/by/4.0/).
Share and Cite
Ackermann, K.; Chapman, A.; Bode, B.E. A Comparison of Cysteine-Conjugated Nitroxide Spin Labels for Pulse Dipolar EPR Spectroscopy. Molecules 2021, 26, 7534. https://doi.org/10.3390/molecules26247534
Ackermann K, Chapman A, Bode BE. A Comparison of Cysteine-Conjugated Nitroxide Spin Labels for Pulse Dipolar EPR Spectroscopy. Molecules. 2021; 26(24):7534. https://doi.org/10.3390/molecules26247534
Chicago/Turabian StyleAckermann, Katrin, Alexandra Chapman, and Bela E. Bode. 2021. "A Comparison of Cysteine-Conjugated Nitroxide Spin Labels for Pulse Dipolar EPR Spectroscopy" Molecules 26, no. 24: 7534. https://doi.org/10.3390/molecules26247534
APA StyleAckermann, K., Chapman, A., & Bode, B. E. (2021). A Comparison of Cysteine-Conjugated Nitroxide Spin Labels for Pulse Dipolar EPR Spectroscopy. Molecules, 26(24), 7534. https://doi.org/10.3390/molecules26247534