Article

Seriniquinones as Therapeutic Leads for Treatment of BRAF and NRAS Mutant Melanomas

by
Amanda S. Hirata
1,
Paula Rezende-Teixeira
1,
João Agostinho Machado-Neto
1,
Paula C. Jimenez
2,
James J. La Clair
3,
William Fenical
4 and
Leticia V. Costa-Lotufo
1,*
1
Department of Pharmacology, Institute of Biomedical Sciences, University of São Paulo, São Paulo 05508-900, SP, Brazil
2
Institute of Marine Science, Federal University of São Paulo, Santos 11070-100, SP, Brazil
3
Department of Chemistry and Biochemistry, University of California, La Jolla, San Diego, CA 92093-0358, USA
4
Center for Marine Biotechnology and Biomedicine, Scripps Institution of Oceanography, University of California, La Jolla, San Diego, CA 92093-0204, USA
*
Author to whom correspondence should be addressed.
Molecules 2021, 26(23), 7362; https://doi.org/10.3390/molecules26237362
Submission received: 27 October 2021 / Revised: 27 November 2021 / Accepted: 1 December 2021 / Published: 4 December 2021

Abstract

:
Isolated from the marine bacteria Serinicoccus sp., seriniquinone (SQ1) has been characterized by its selective activity in melanoma cell lines marked by its modulation of human dermcidin and induction of autophagy and apoptosis. While an active lead, the lack of solubility of SQ1 in both organic and aqueous media has complicated its preclinical evaluation. In response, our team turned its effort to explore analogues with the goal of returning synthetically accessible materials with comparable selectivity and activity. The analogue SQ2 showed improved solubility and reached a 30–40-fold greater selectivity for melanoma cells. Here, we report a detailed comparison of the activity of SQ1 and SQ2 in SK-MEL-28 and SK-MEL-147 cell lines, carrying the top melanoma-associated mutations, BRAFV600E and NRASQ61R, respectively. These studies provide a definitive report on the activity, viability, clonogenicity, dermcidin expression, autophagy, and apoptosis induction following exposure to SQ1 or SQ2. Overall, these studies showed that SQ1 and SQ2 demonstrated comparable activity and modulation of dermcidin expression. These studies are further supported through the evaluation of a panel of basal expression of key-genes related to autophagy and apoptosis, providing further insight into the role of these mutations. To explore this rather as a survival or death mechanism, autophagy inhibition sensibilized BRAF mutants to SQ1 and SQ2, whereas the opposite happened to NRAS mutants. These data suggest that the seriniquinones remain active, independently of the melanoma mutation, and suggest the future combination of their application with inhibitors of autophagy to treat BRAF-mutated tumors.

Graphical Abstract

1. Introduction

Seriniquinone (SQ1, Figure 1A), a natural product isolated from a marine bacterium of the genus Serinicoccus, displays potent cytotoxic activity against a panel of tumor cell lines with particular selectivity towards melanoma [1]. This activity is associated with the induction of autophagy and apoptosis [1]. Interestingly, SQ1 was shown to target dermcidin [1], a small protein for which no small-molecule modulator has been reported. To date, a small panel of SQ1 analogues, illustrated by SQ2SQ5, Figure 1A, have been prepared, displaying an improvement of solubility, cytotoxicity, and modulation of dermcidin expression [2]. Here, we report on the activity of these materials in cell lines representing key mutation profiles observed in melanoma using SK-MEL-28 and SK-MEL-147 cell lines.
Melanoma, a cancer originated from melanocytes, frequently presents mutations in the MAPK pathway, mainly in BRAF and NRAS proteins, at incidences up to 52% and 28%, respectively, according to The Cancer Genome Atlas Network [3]. This disease has limited therapeutic options and frequent chemoresistance represents a major hindrance [4], as reported for dacarbazine [5], BRAFV600E inhibitors [6], and immunotherapies [7]. Thus, the pursuit for alternatives, with different targets and mechanisms/modes of action (MOAs), is crucial for advancing treatment options for melanoma. Furthermore, the lack of specificity for tumor cells in detriment of normal tissue remains an unmet challenge.
Human dermcidin is a 110 amino acid protein encoded by the dermcidin (DCD) gene. This full-length protein is known to be the source of peptides, including the proteolysis-inducing factor (PIF) and antimicrobial peptides constitutively produced by eccrine sweat glands [8]. Despite this protective function, dermcidin has been reported at high expression levels with a suggested survival-promoting activity in select cancers [9], but its role in carcinogenesis and tumor maintenance is still unclear. Further studies have shown that knockdown of DCD in breast and lung cancer cell lines repressed cell proliferation and tumorigenesis, therefore reinforcing its relevance for cancer progression [10,11]. Further studies have shown that high dermcidin levels are associated with late-stage melanoma in patients with metastasis, indicating a role in melanoma progression and suggesting a prognostic value as a marker [12]. Here, we further our exploration of the utility of seriniquinone (SQ1) and its analogues (SQ2SQ5) as agents that target cancer’s bearing point mutations on BRAF and NRAS genes.

2. Results

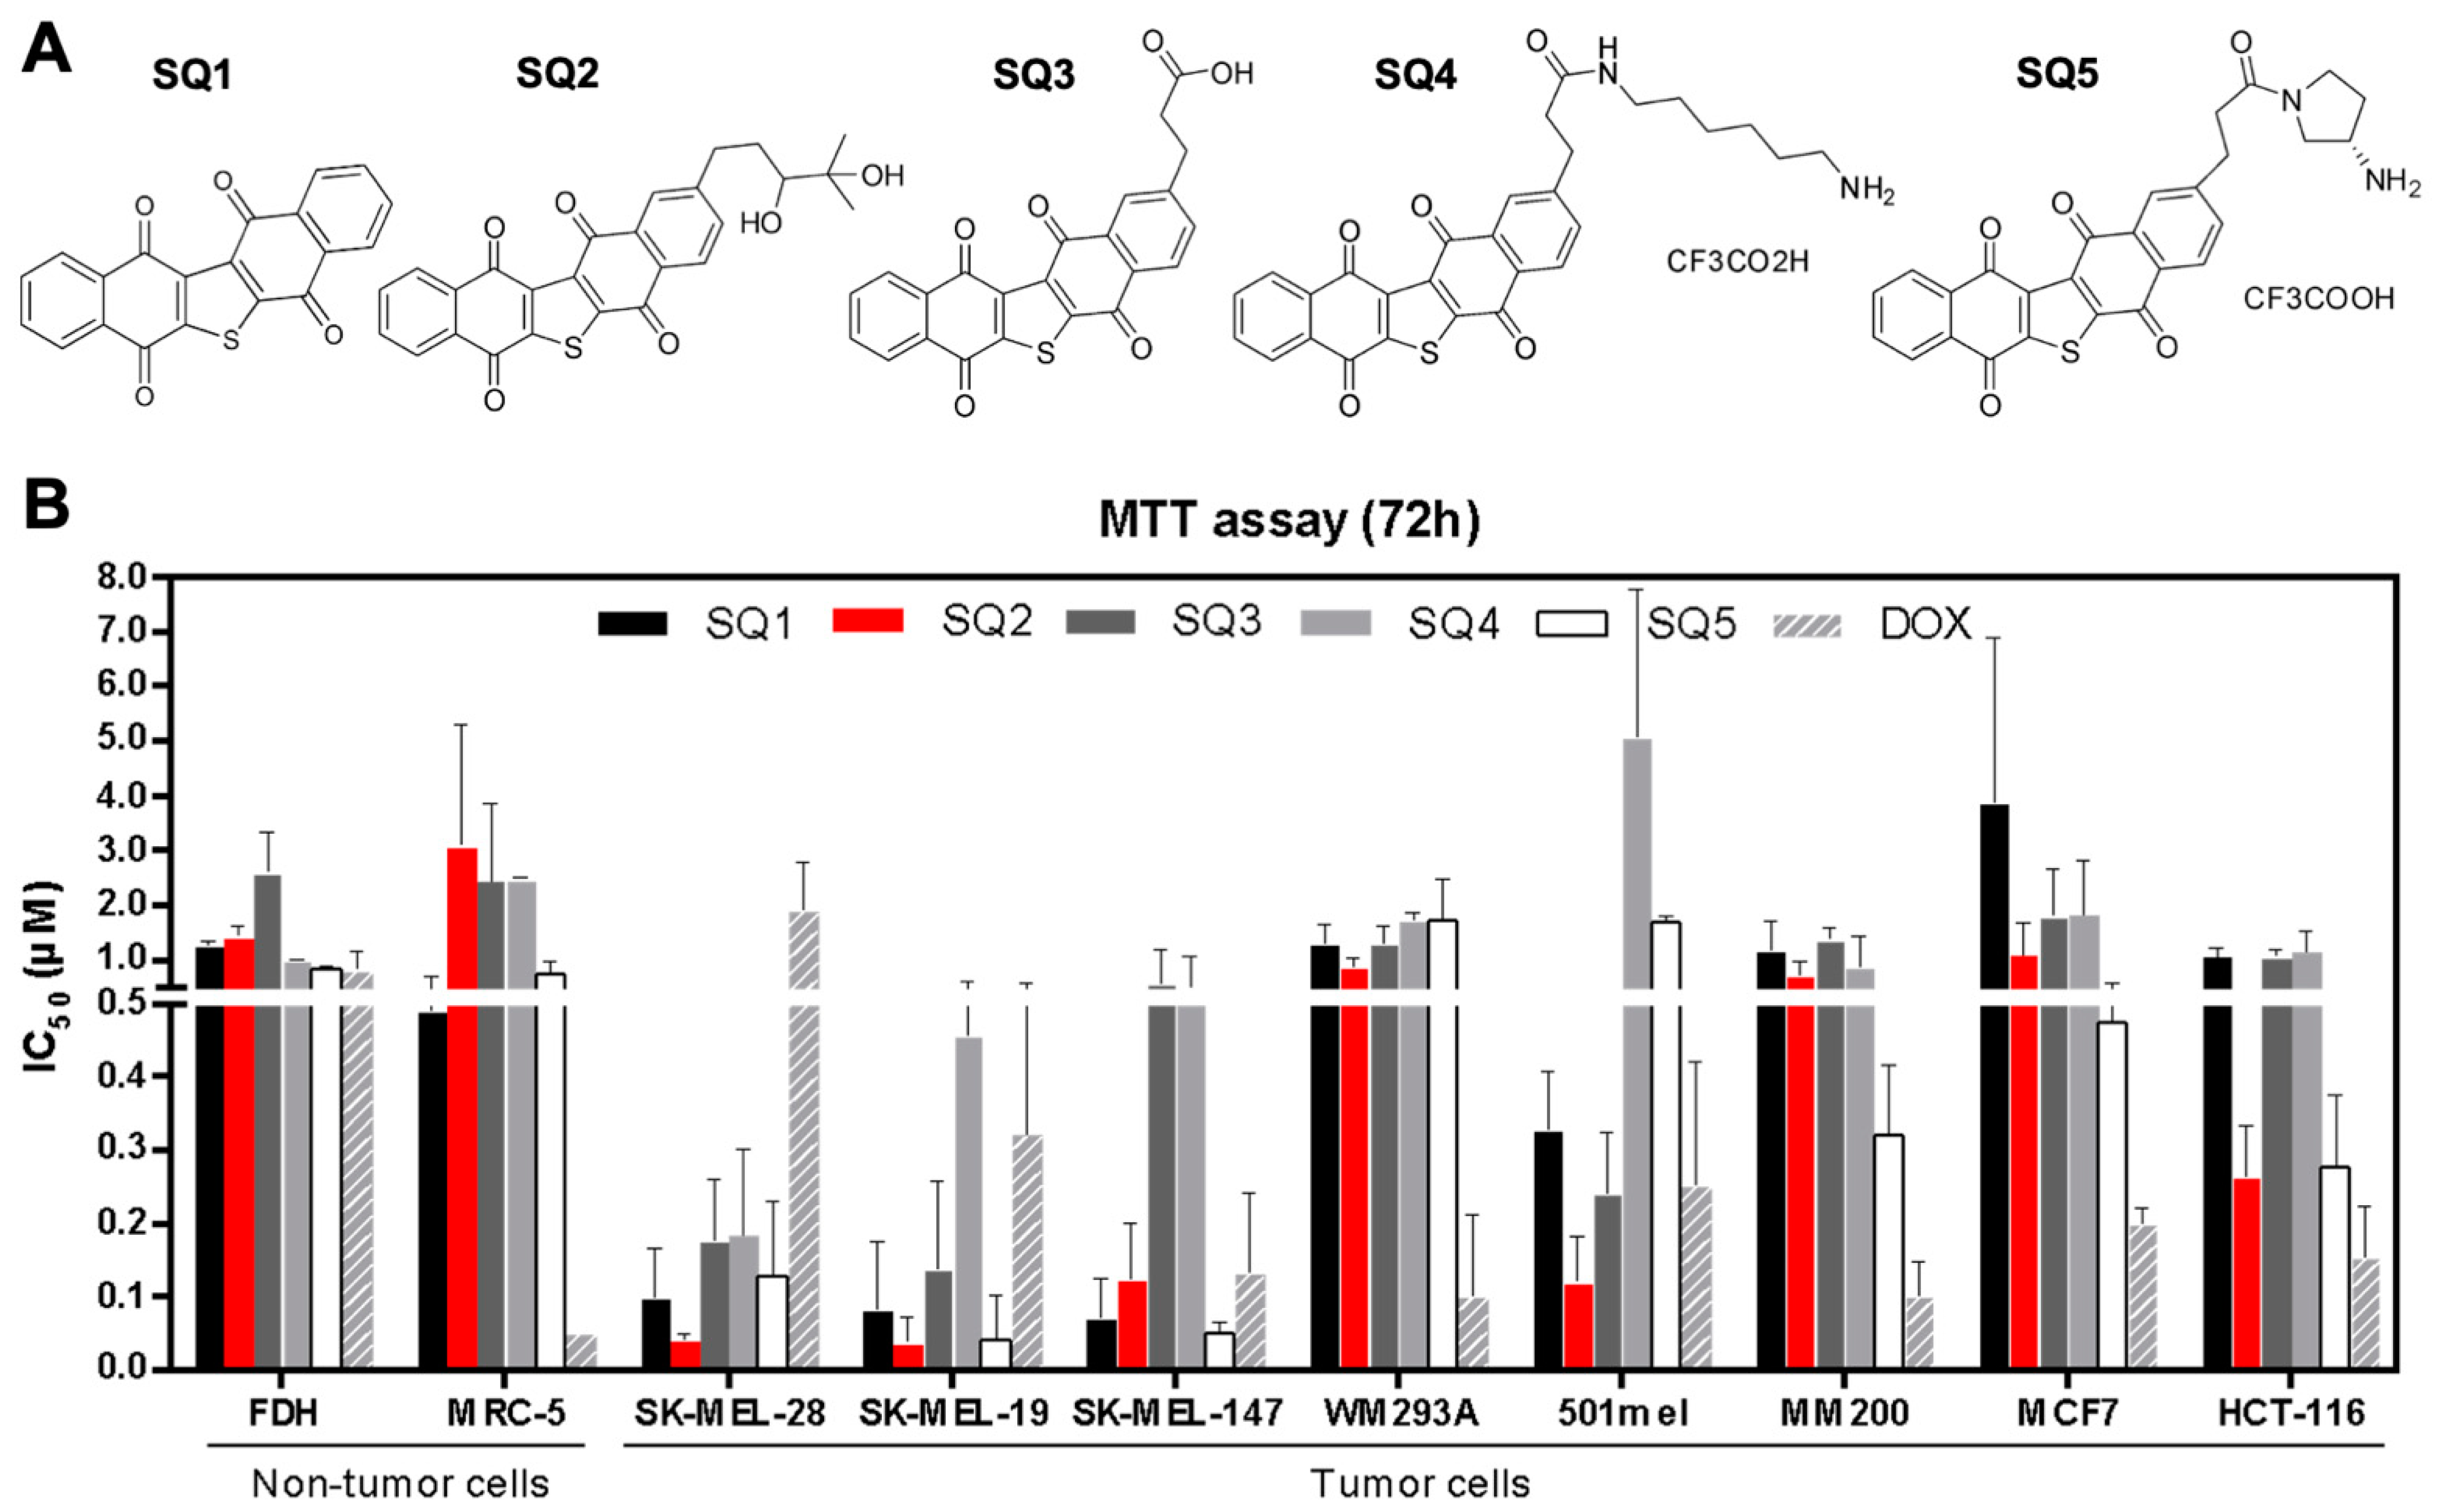
2.1. Seriniquinone Analogues Display Cytotoxic Activity in Cancer Cells

Seriniquinone (SQ1, Figure 1A) and its synthetic analogues SQ2SQ5 (Figure 1A) displayed cytotoxicity against melanoma, breast adenocarcinoma, colorectal carcinoma, and non-tumor cell lines (Figure 1B; Table S1). The IC50 (half-maximal inhibitory concentration) value for SQ1 in melanoma cells ranged from 0.06 µM in SK-MEL-19 to 1.4 µM for MM200 cell lines, while it reached 3.3 µM in breast adenocarcinoma (MCF7 cell line) and 1.0 µM in colorectal carcinoma (HCT-116 cell line). For the synthetic analogues, cytotoxicity varied from 0.04 to 1.8 µM for melanoma cells and from 0.15 to 1.9 µM for MCF7 and HCT-116. The most prominent effects were obtained for melanoma cell lines (SK-MEL-19, SK-MEL-28, and SK-MEL-147). For fibroblast cells (MRC-5 and FDH cell lines), SQ1 had an activity of 0.6 and 1.2 µM, respectively. In comparable assays, the synthetic analogues ranged between 0.6 and 3.5 µM for MRC-5 and FDH cells, respectively. Doxorubicin, a positive control, was generally less toxic than seriniquinone and its analogues in melanoma cells, with the exception of WM293A and MM200 cell lines. Nonetheless, it was far more toxic to breast carcinoma (MCF-7) and colon carcinoma (HCT-116) cells, and nontumor cell lines (MRC-5 and FDH).
Selectivity indices (SI, the ratio of the IC50 value for the respective tumor cell line to the IC50 for MRC-5 or FDH, the non-tumor cell lines) were improved mainly for SQ2 and SQ3, relative to those of SQ1 (Table 1 and Table 2). SK-MEL cell lines displayed the highest SI values, while SQ2 presented greater levels of selectivity, reaching a 30–40 ratio favoring melanoma cells (red in Table 1 and Table 2). Doxorubicin showed in the lowest SI values for most cell lines screened (Table 1 and Table 2). To further explore and compare the effects of natural SQ1 and analogue SQ2 on melanoma cells, both compounds were subjected to an in depth evaluation of their MOAs using BRAFV600E mutated (SK-MEL-28) and NRASQ61R mutated (SK-MEL-147) cell lines.

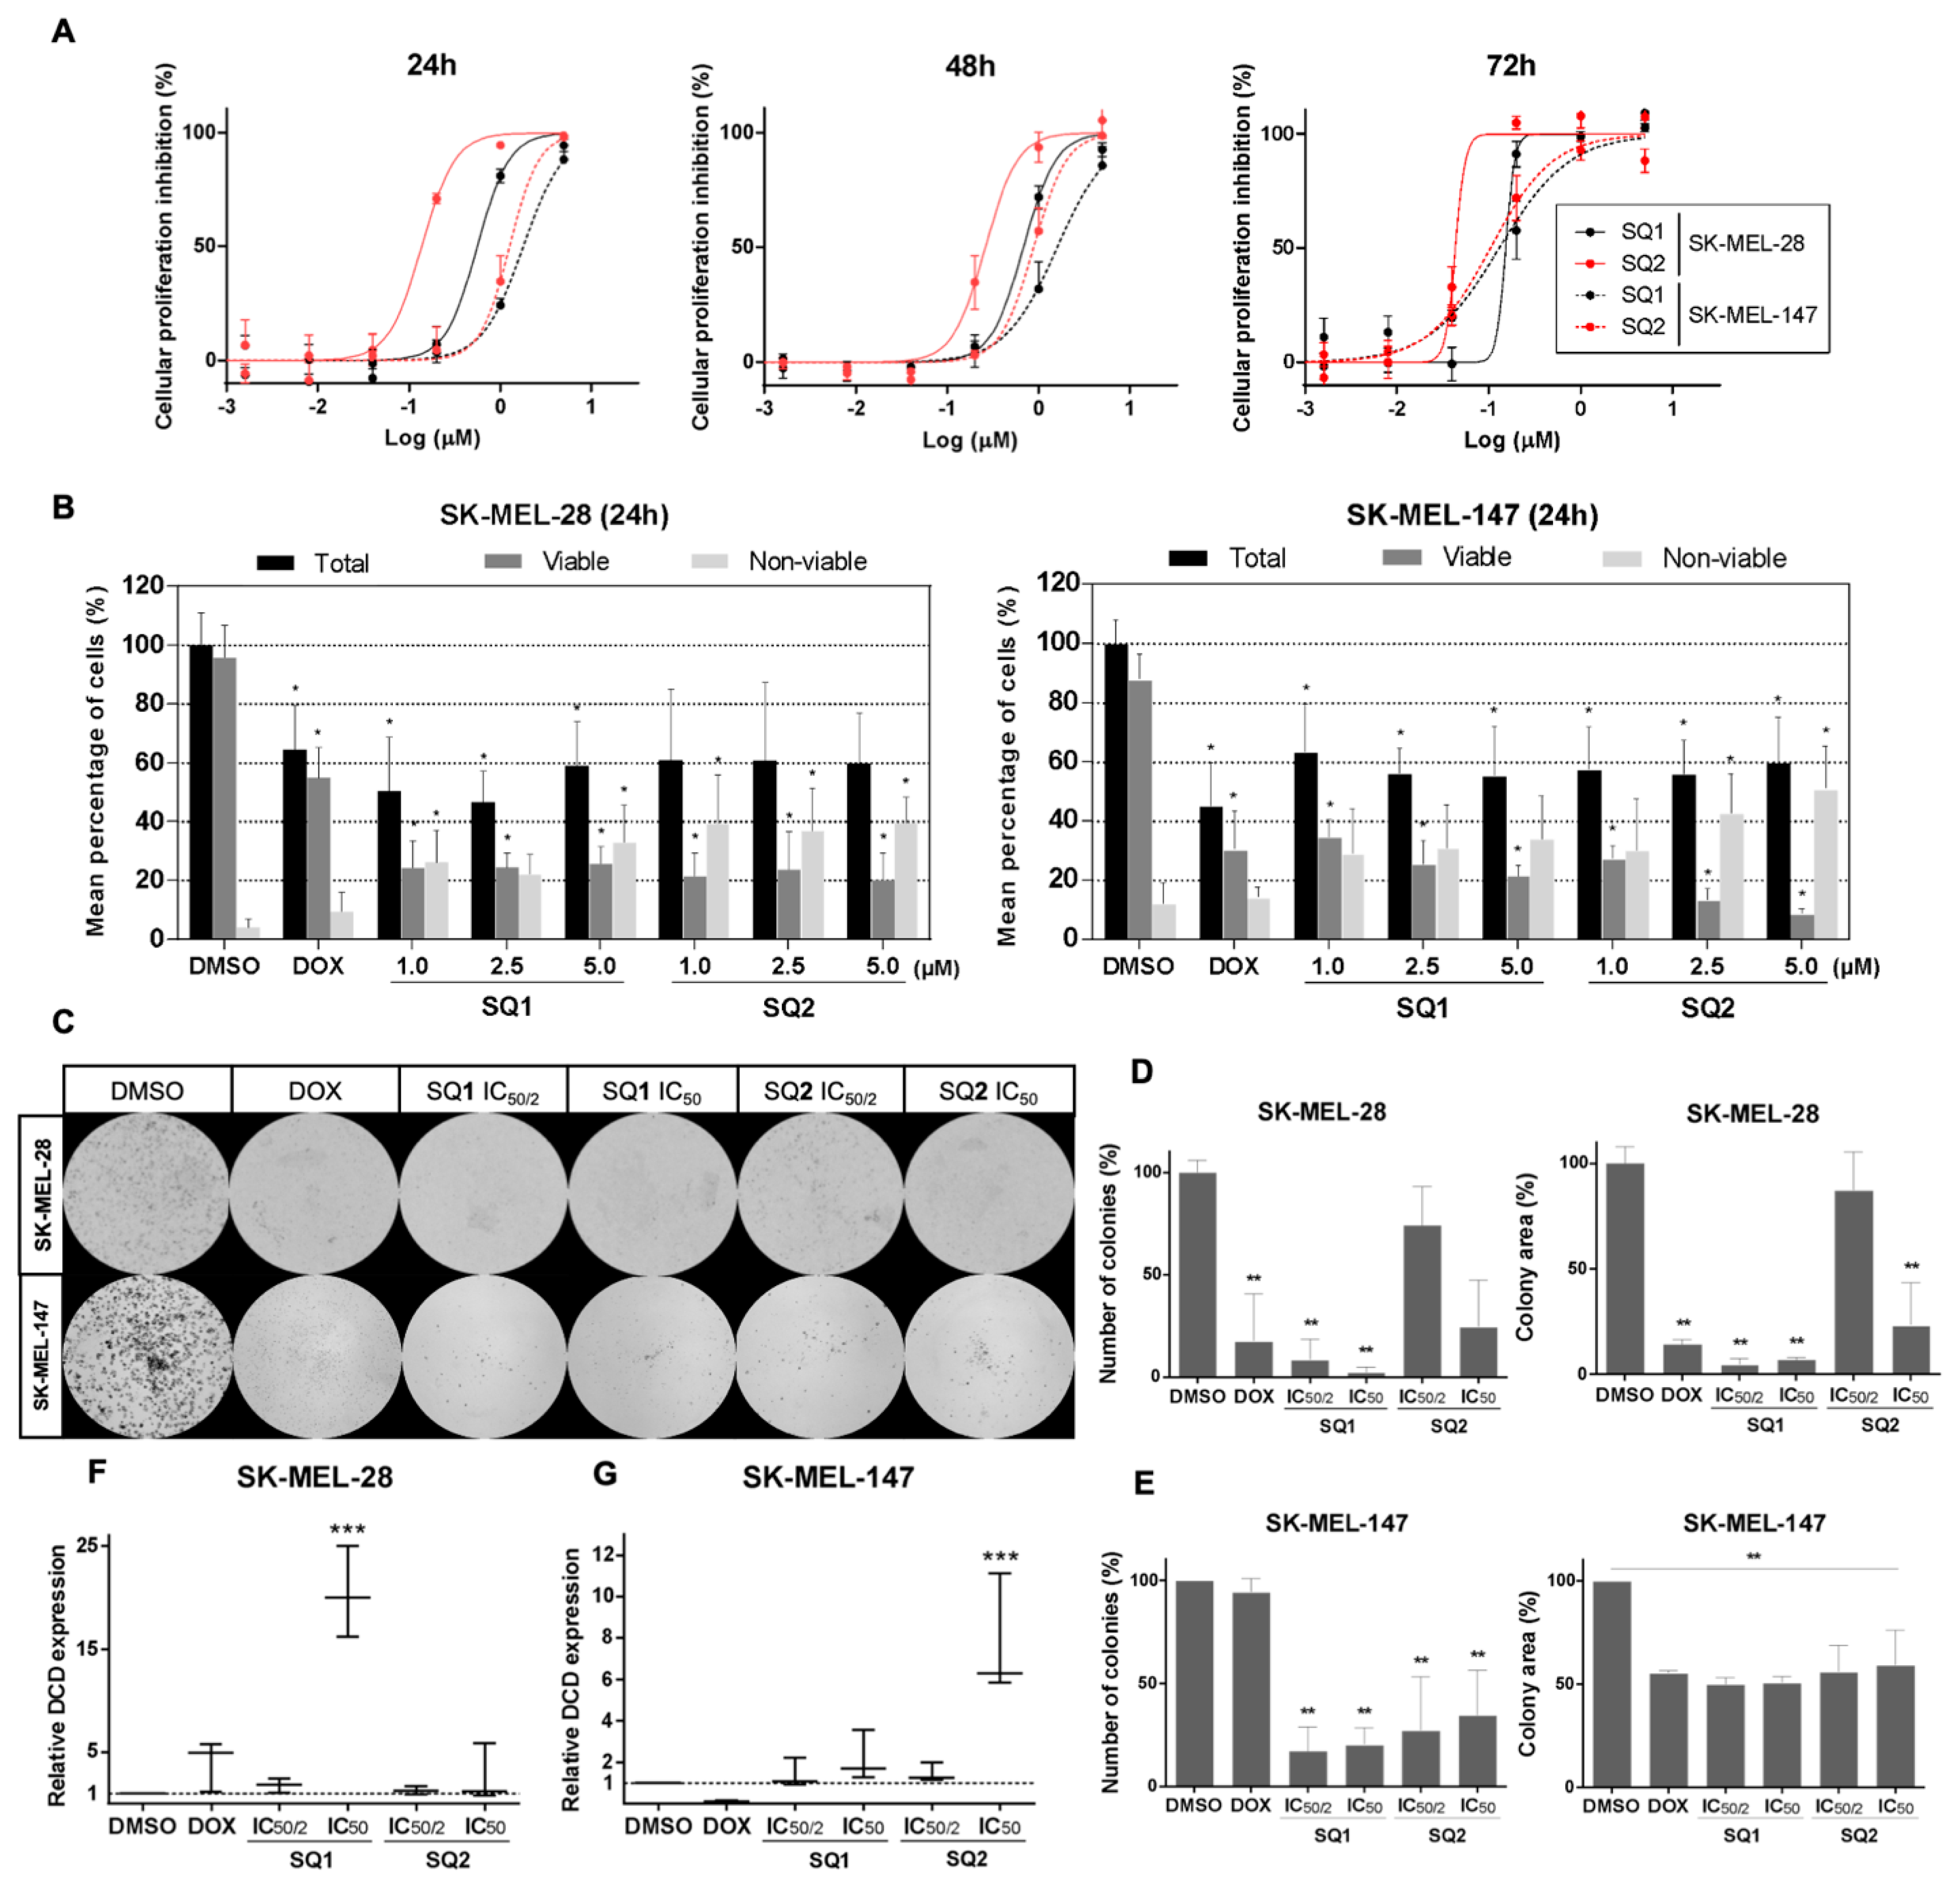
2.2. SQ1 and SQ2 Are Active in BRAF and NRAS Mutant Melanoma Cells

SK-MEL-28 and SK-MEL-147 cells were treated with SQ1 or SQ2 for 24, 48, and 72 h in order to analyze their sensitivity after short (24 h) and long exposure (72 h) periods (Figure 2A). IC50 values for these cell lines suggest that SQ1 and SQ2 display a time-dependent cytotoxicity, with more potent inhibition of cell proliferation at longer exposures (72 h, Table S2). Interestingly, compound SQ2 was more active when compared to SQ1 in each cell line at 24 and 48 h but showed similar potency after 72-h exposure in SK-MEL-147 cells. In the Trypan blue exclusion test (cell viability), 24-h treatments induced toxicity by significantly reducing the number of viable cells and increasing non-viable ones in either cell lines (Figure 2B). However, for SK-MEL-147, the proportion of non-viable cells was significantly higher when treated with SQ2 at 2.5 and 5.0 µM.
In order to evaluate the effects of these compounds on long-term survival, cells were treated for 24 h with low concentrations of SQ1 and SQ2, based on their half IC50 and IC50 values, and followed by clonogenic assay of the remaining viable cells in drug-free medium (Figure 2C). SQ1 decreased the ability of cells to readhere, expressed by a significant reduction in the number of colonies, and inhibited proliferation, a factor revealed by a lower colony area (Figure 2D,E). Overall, we found that the reduction of the colony levels was greater in SK-MEL-28 (Figure 2E) than SK-MEL-147 (Figure 2D), with reduction levels greater than 50% in both cell lines.

2.3. SQ1 and SQ2 Modulate Dermcidin Expression

To validate the targeting of dermcidin by SQ1 [1], RNA transcription of the DCD gene was evaluated in treated cells. For SK-MEL-28, SQ1 modulated DCD expression in a dose-dependent manner, increasing almost twofold at 0.3 µM reaching 20 times at 0.6 µM (Figure 2F). In comparison, SQ2 treatment up-regulated nearly three times only at 0.1 µM. In SK-MEL-147 cells, both compounds modulated DCD expression only at the highest tested concentrations (1.8 µM for SQ1 and 1.2 for SQ2), for which SQ1 reached an expression twofold higher than the control and SQ2 induced overexpression almost eight times (Figure 2G). These data suggest that structural modifications that yielded SQ2 did not affect the capability of this seriniquinone analogue to modulate dermcidin; however, it does so with seemingly distinct specificities than those of the natural compound.

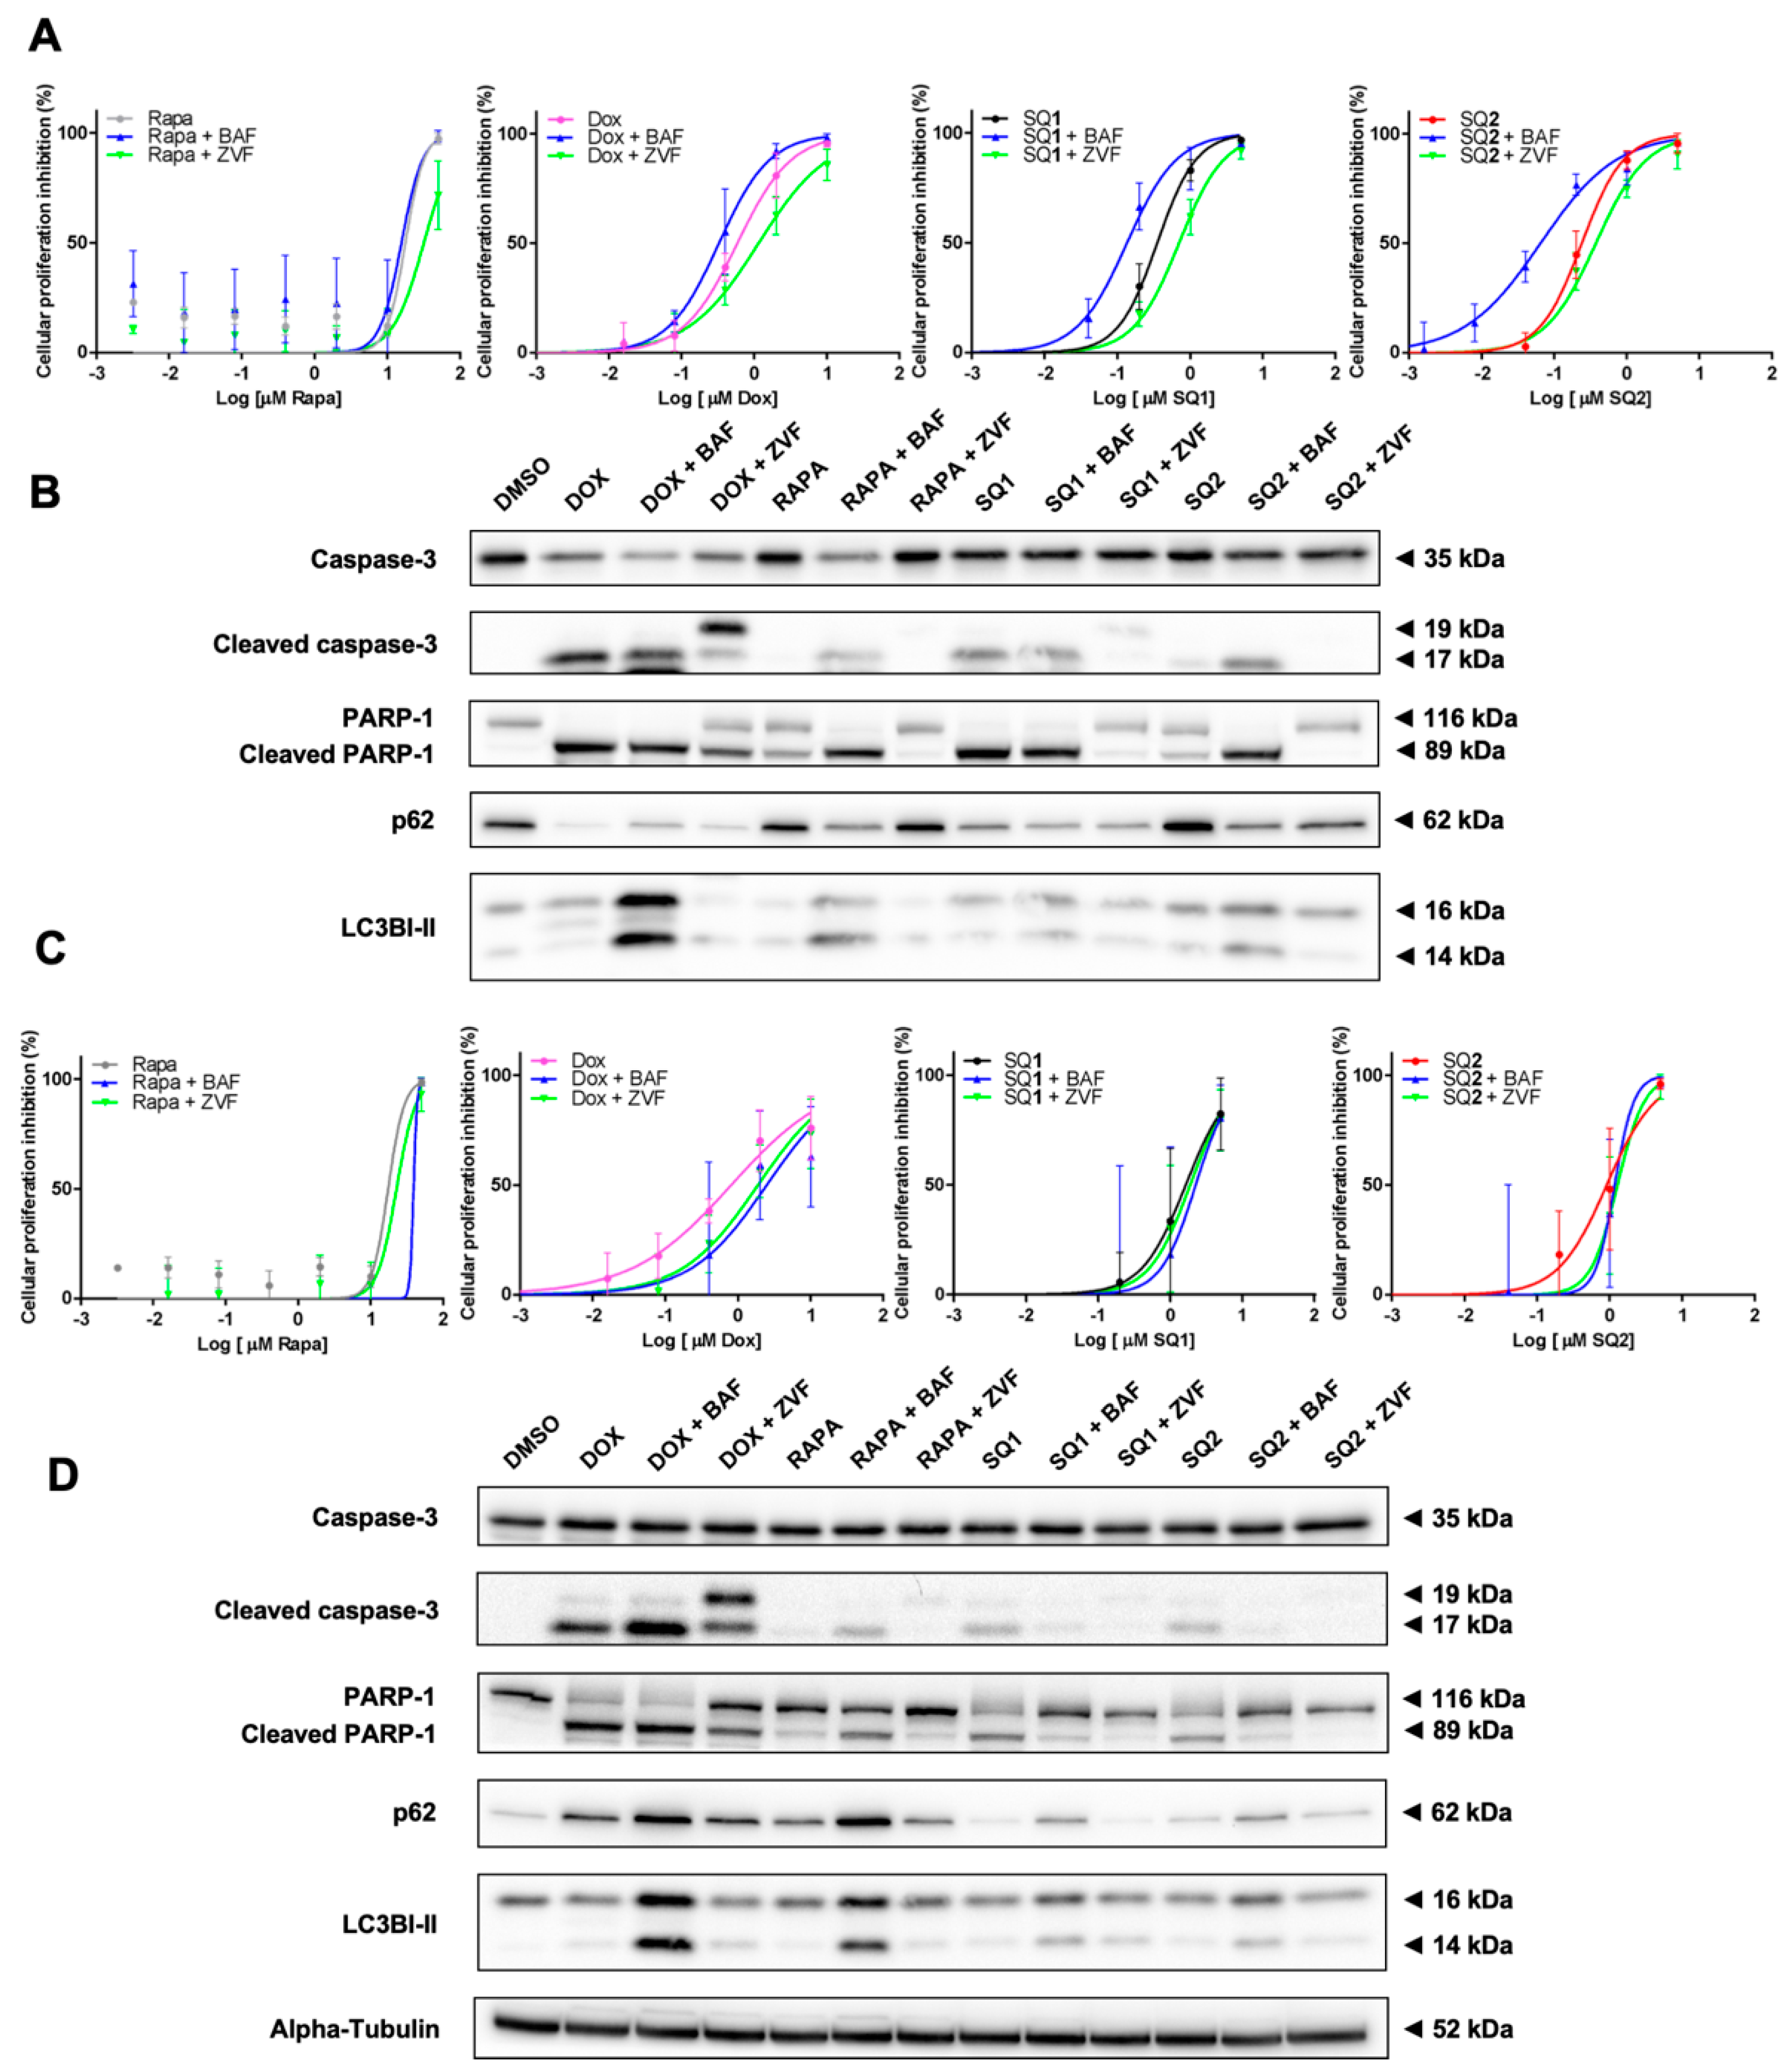
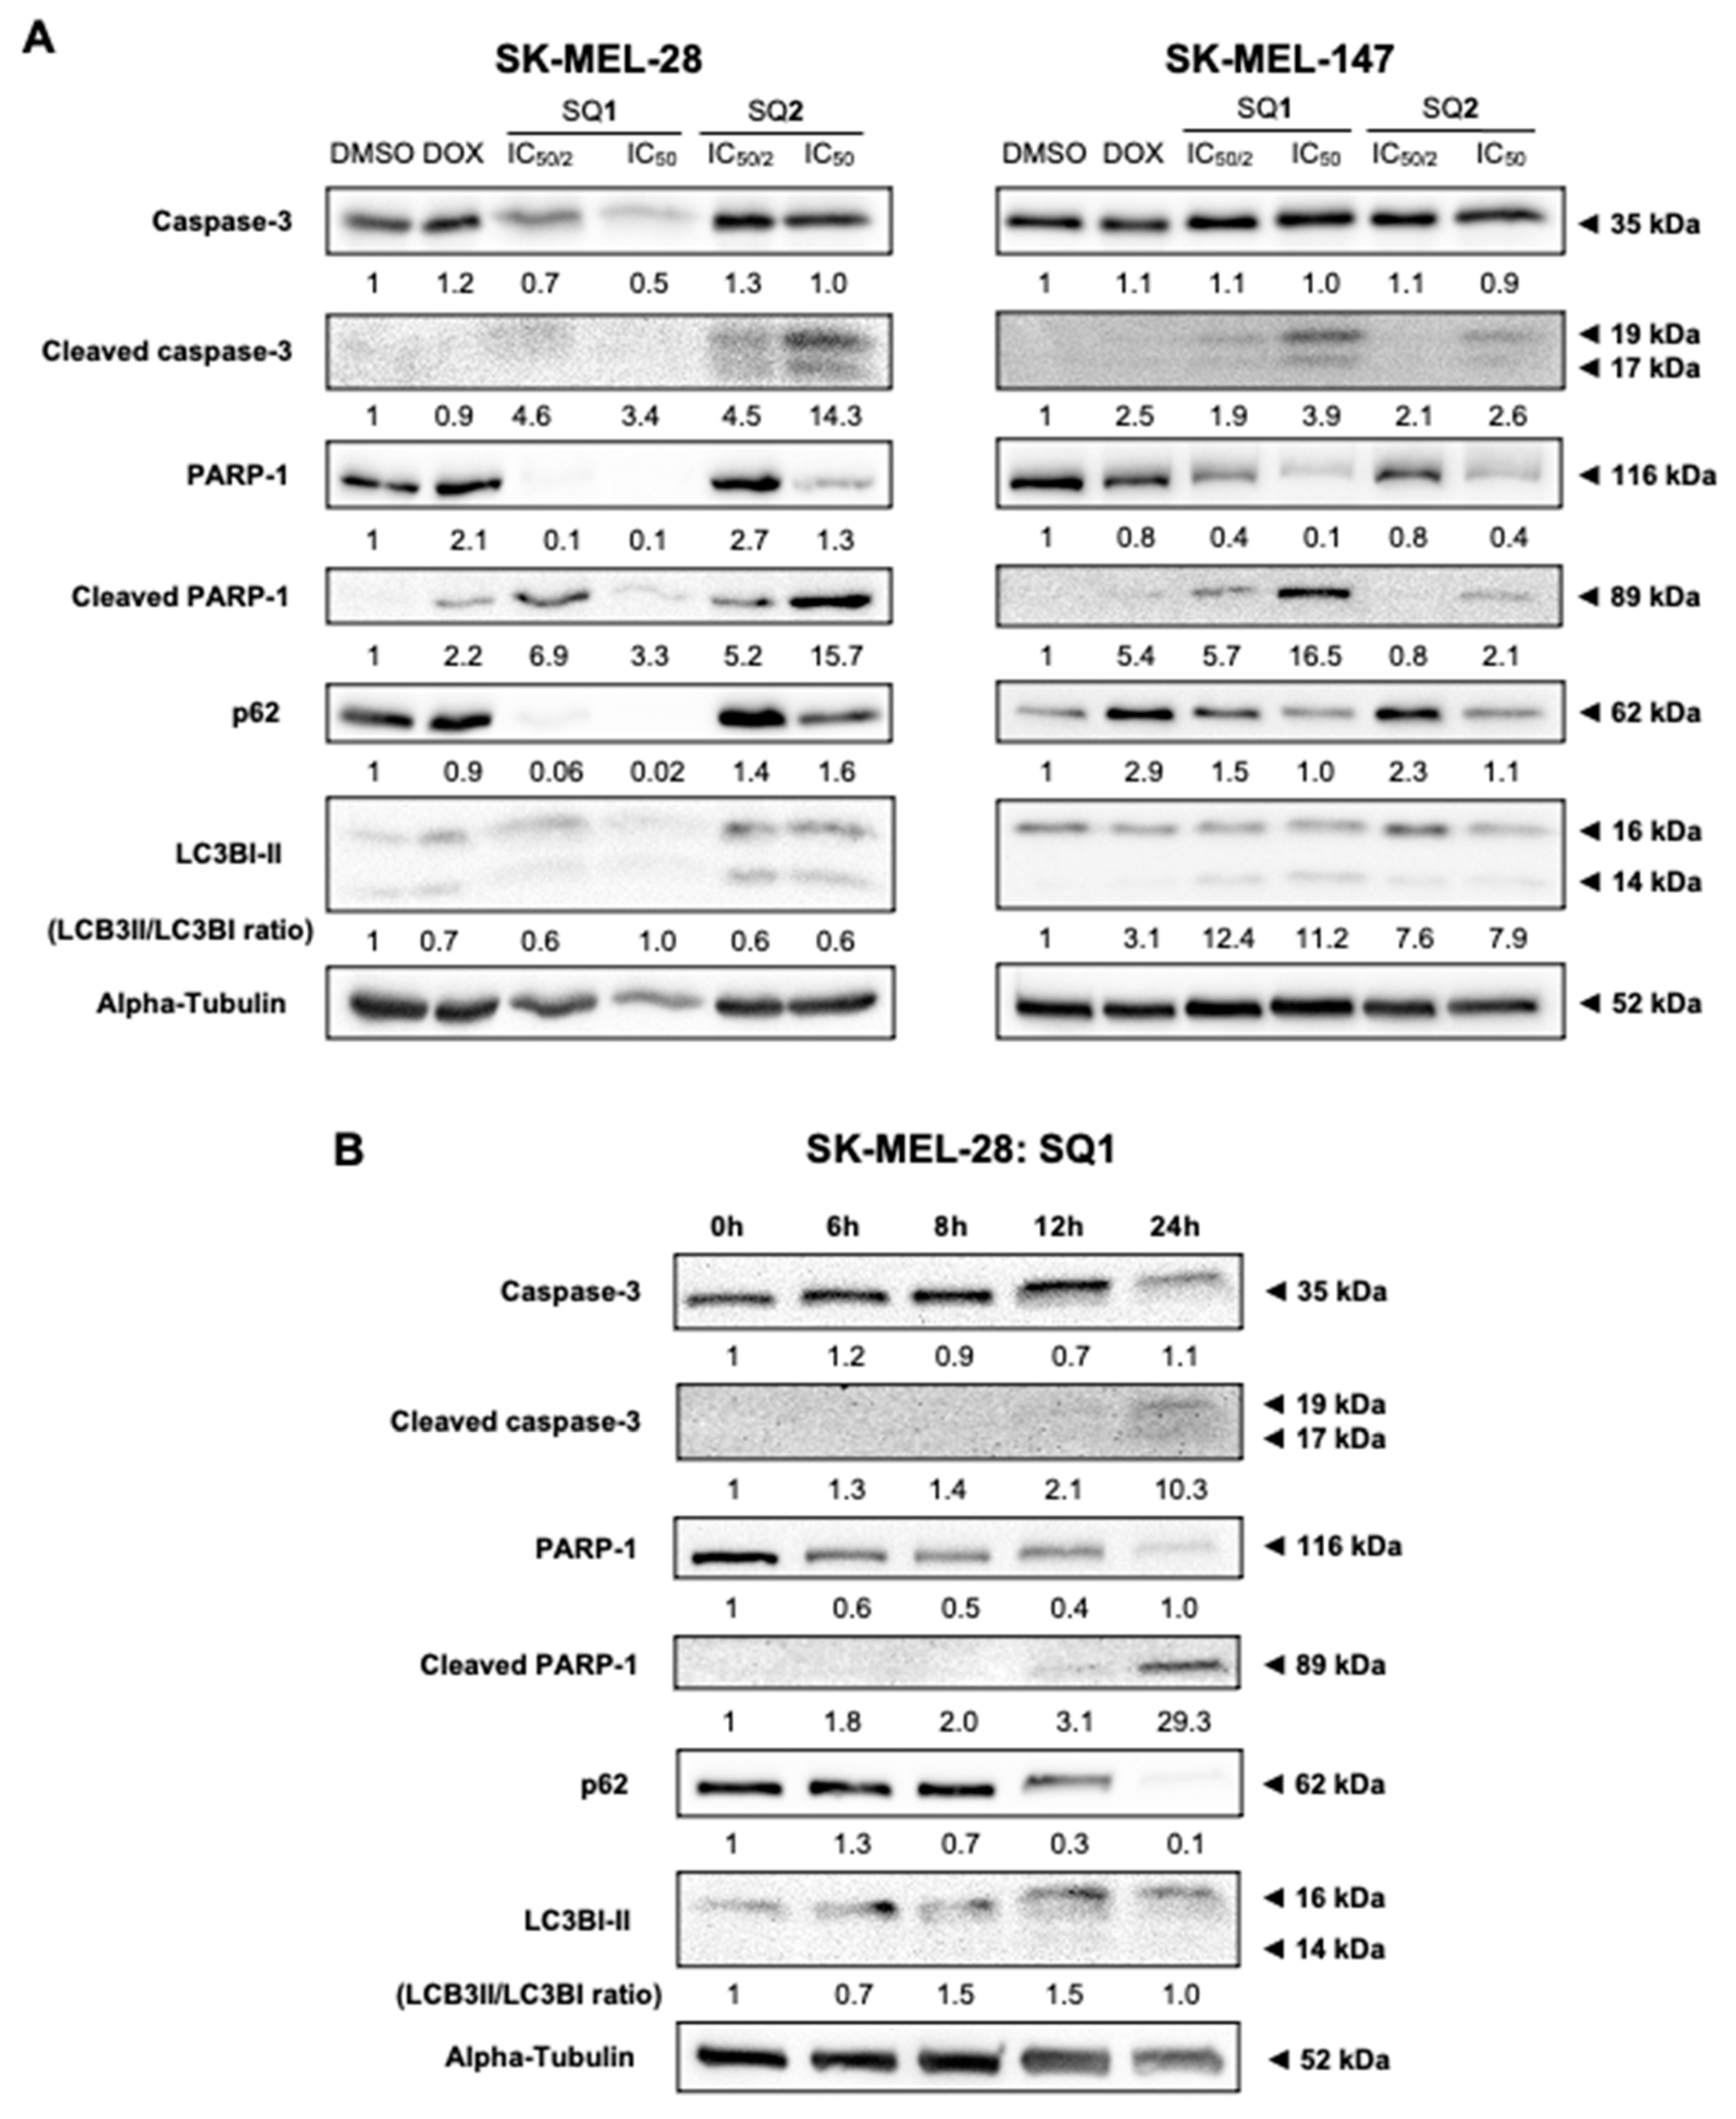
2.4. SQ1 and SQ2 Lead to Cell Death through Autophagy and Apoptosis

Evaluation of indicators for apoptosis and autophagy revealed that both BRAF and NRAS mutated cell lines are sensitive to SQ1 and SQ2, as evidenced by the increase of typical apoptotic markers, including cleaved PARP-1 and cleaved caspase-3 (Figure 3A). Signs of cellular autophagy were also revealed by decreased p62 or LC3BI-II synthesis. Seriniquinone-treated SK-MEL-147 cells showed more expressive signs of apoptosis. SK-MEL-28 cells treated with SQ1 had a more prominent response to autophagic flux, expressed through the extinction of p62. Here, protein expression was evaluated in a time-dependent manner following treatment of SK-MEL-28 with SQ1 (Figure 3B). Significant changes on cleavage of PARP-1 and caspase-3 occurred between 8 and 12 h indicating the initiation of apoptosis, while a concomitant initiation of autophagy was observed through the decrease in the levels of p62 and an increase in LC3B ratios.

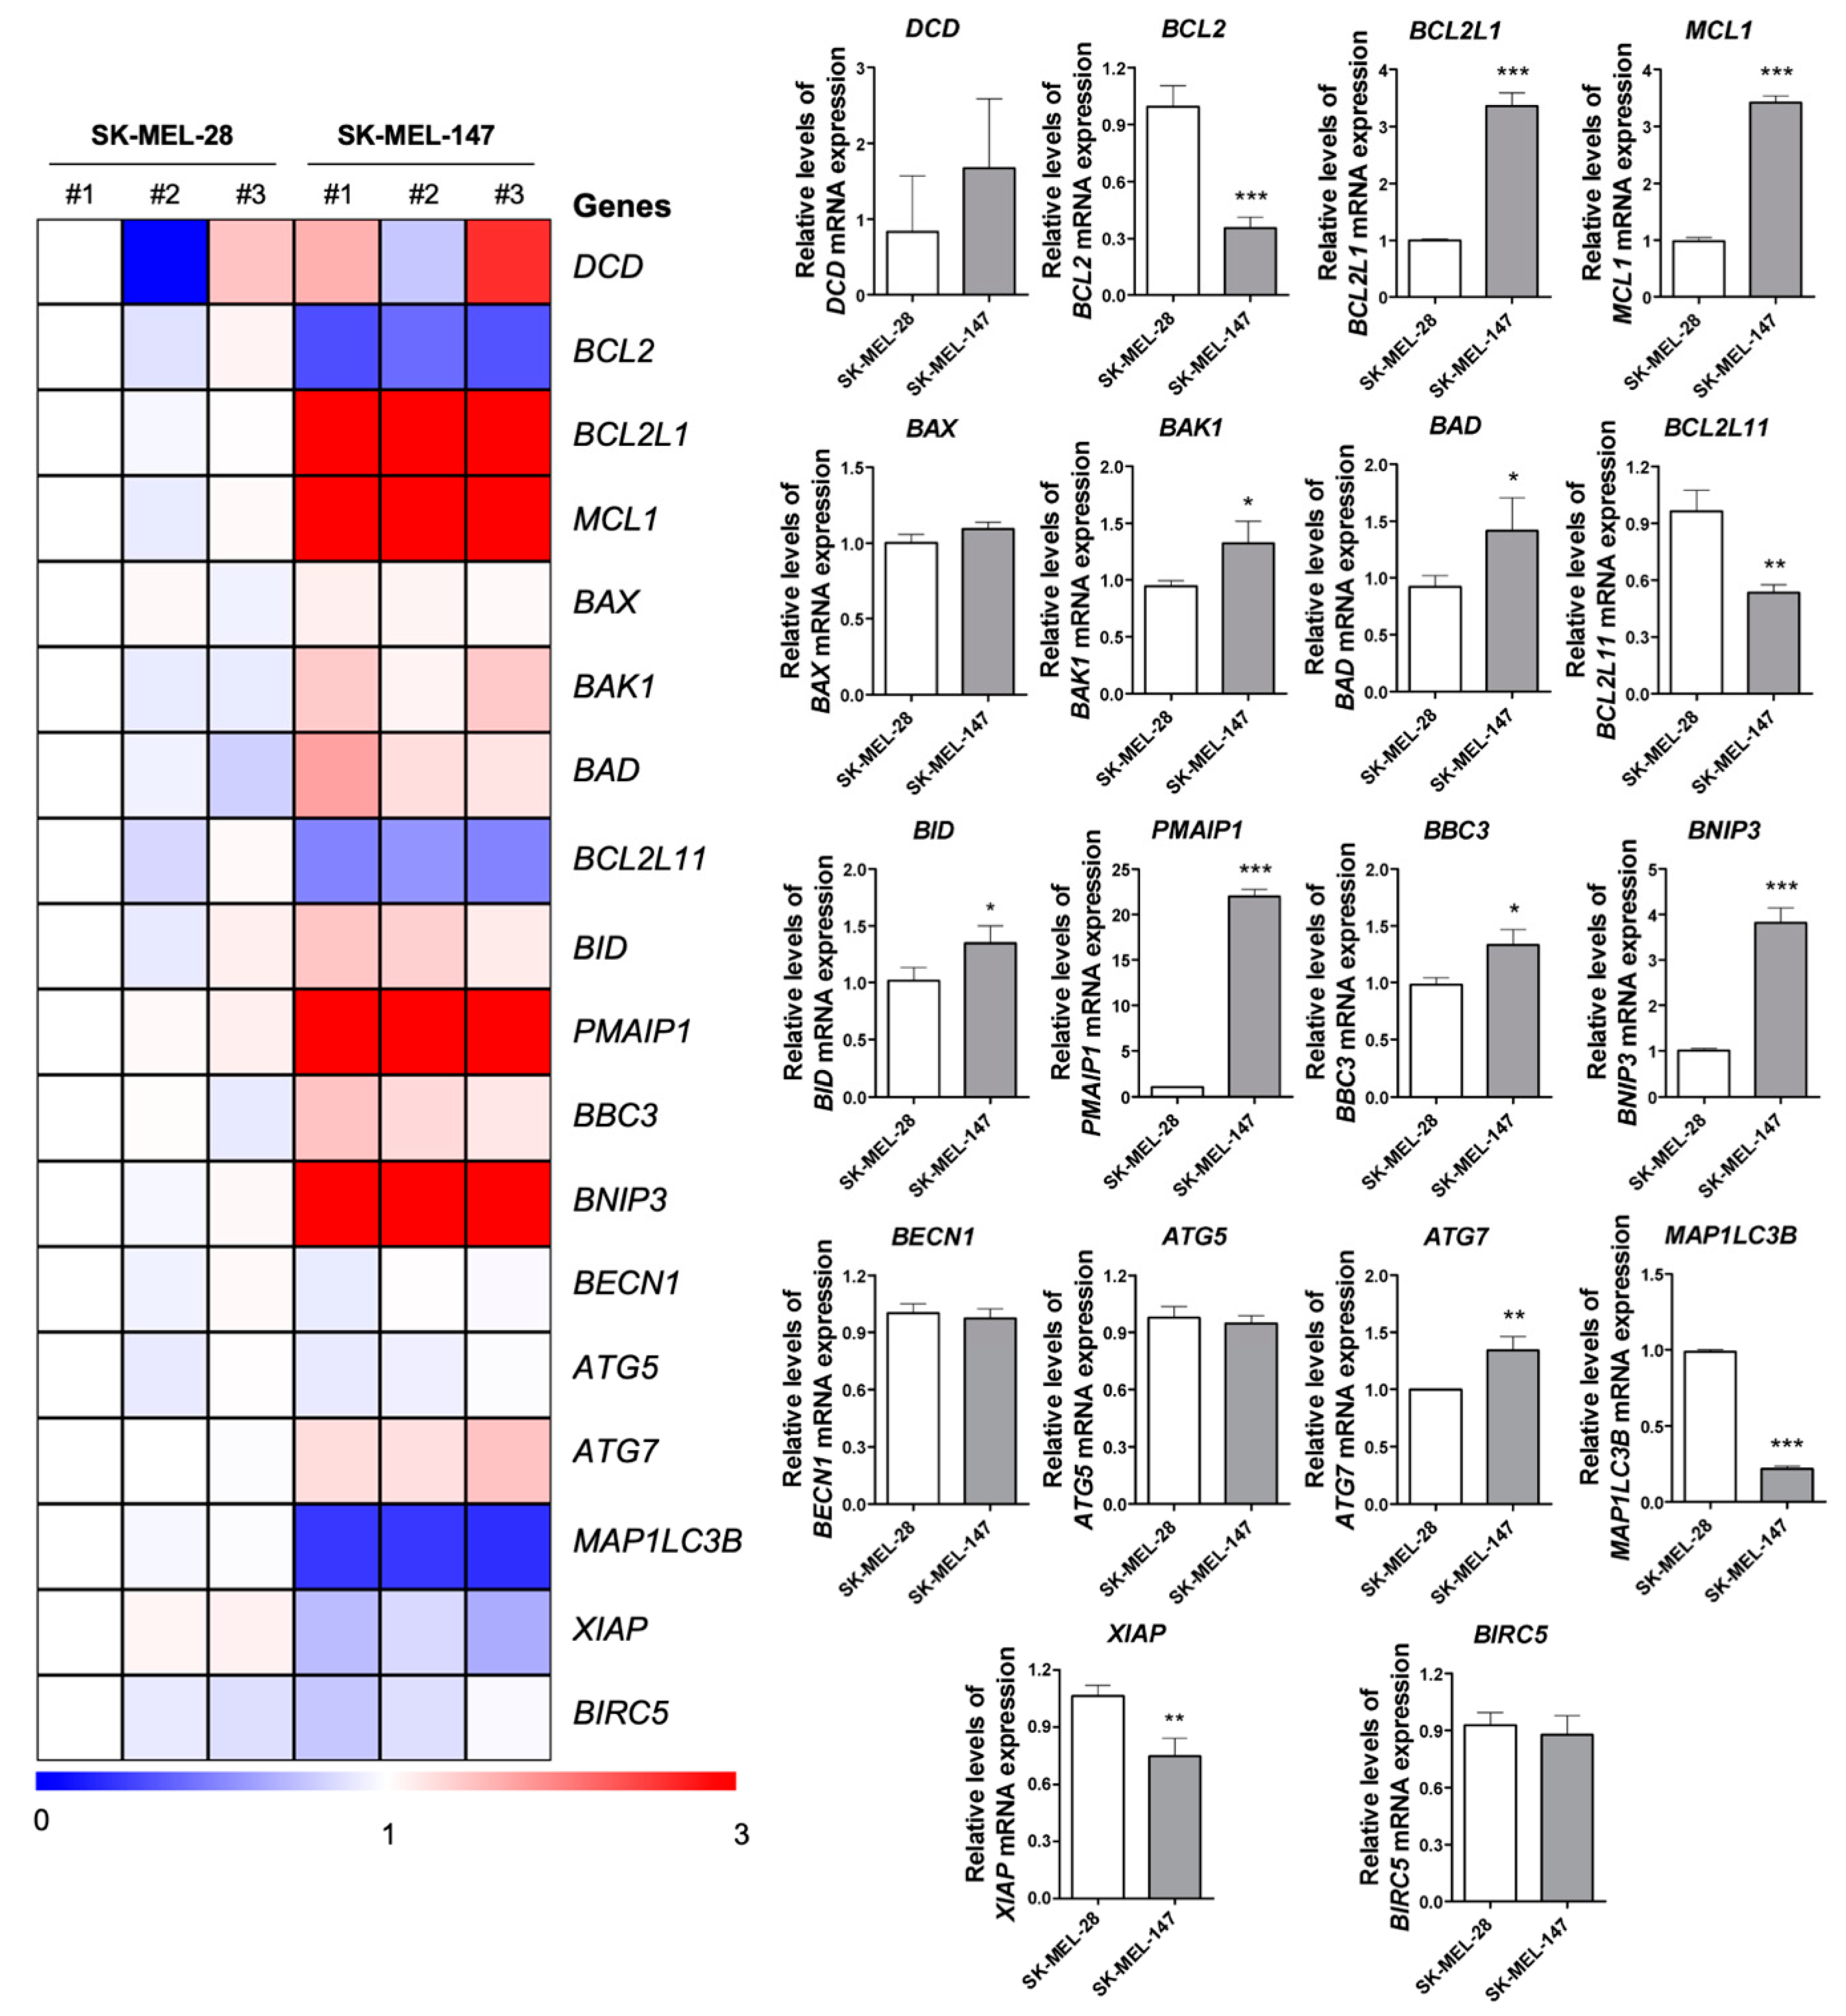
2.5. BRAF and NRAS Mutants Have Different Basal Profiles

Basal expression of key genes associated with autophagy and apoptosis were quantified by qPCR (Figure 4), due to the different expression profiles of cell death-related proteins between cell lines. Prior to compound exposure, SK-MEL-28 and SK-MEL-147 were found to significantly differed in their expression of 13 of the 18 genes assessed: BCL2, BCL2L1, MCL1, BAK1, BAD, BCL2L11, BID, PMAIP1, BBC3, BNIP3, ATG7, MAP1LC3B, and XIAP. Some genes related to apoptosis, BAK1, BAD, BID, PMAIP1, BBC3, and BNIP3, were overexpressed in SK-MEL-147, while MAP1LC3B, related to autophagy, was suppressed. Despite a seemingly apoptotic profile in SK-MEL-147 cells, further corroborated by the low levels of BCL2 and XIAP, apoptosis suppressor genes, such as BCL2L1 and MCL1, were overexpressed. Additionally, DCD basal expression varied among the independent samples from both lines, however, the overall expression of this gene in SK-MEL-147 was found higher than that in SK-MEL-28.

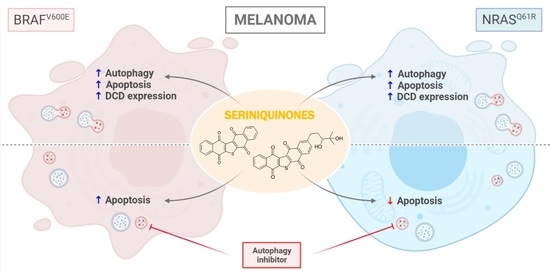
2.6. Inhibition of Autophagy Induces Different Responses in NRAS and BRAF Mutated Cells

Next, we explored the effects of pre-treatment with bafilomycin A1 (an autophagy inhibitor) or rapamycin (an autophagy inducer) to further explore cell death mechanisms elicited by seriniquinones. We complemented this study with a similar approach to understand the role of the seriquinones on apoptosis using pre-treatments with Z-VAD-FMK (an apoptosis inhibitor) or doxorubicin (apoptosis inducer). In both cell lines, it was possible to demonstrate the difference of cell death triggered by SQ1 and SQ2 when autophagy is inhibited, expressed by the accumulation of p62 and LC3B. SK-MEL-28 cells were more sensitive to the SQ-treatments, indicated by decrease in cell viability (Figure 5A, Table S4), corroborating with an increase of apoptosis (Figure 5B). In contrast, SK-MEL-147 increased cell survival following autophagy inhibition, just as the Z-VAD-FMK pan-caspase inhibitor (Figure 5C,D, Table S4). Also, for both cell lines, pre-exposure to Z-VAD-FMK seem to restore the autophagy signal just as in SQ1, SQ2, or rapamycin treatment alone. DOX treatments are marked for apoptosis activation and the cell lines displayed the same behavior described for autophagy inhibition through MTT analysis. However, SK-MEL-147 revealed an increase in cleaved PARP-1 and cleaved caspase 3 for this combination, while a decrease in cell death was shown by the results of the MTT assay. Exposure to the pan-caspase inhibitor reduced transformation of 19 kDa cleaved caspase 3 into the 17 kDa fragment and, consequently, less PARP-1 cleavage. Interestingly, p62 reduction and/or LC3B accumulation were observed (Figure 5). IC50 values and Western blotting quantifications for this study can be found at Table S4 and Figure S1, respectively.

3. Discussion

The main therapeutic barrier for melanoma is tumor aggressiveness and propensity to recur. Both features can be related to development of resistance to available treatments, due, in part, to the malleable metabolism within the tumor microenvironment [13,14]. The high incidence of melanoma mutations occurring in BRAFV600E has prompted a clinical exploration for drugs that selectively inhibit the mutated protein, such as vemurafenib and dabrafenib. However, most patients develop resistant tumors after 5–6 months of treatment [15,16,17]. While RAS has been the first oncogene described for melanoma [18], no successful NRAS mutated protein inhibitor has gained clinical approval. Currently, MEK inhibitors serve as the primary therapeutic strategy for mutated melanoma; however, with modest efficacy [19].
Considering these limited treatments, alternative treatments are necessary. Medicinal chemical studies on the natural product seriniquinone (SQ1) have advanced analogues with improved solubility, cytotoxicity, and tumor selectivity [1]. Such efficacy is due to the unique MOA of this compound, which could, indeed, uncover a novel chemotherapeutic target, the dermcidin. Still, little is known on how modulation of dermcidin affects cellular activity and further studies are required. Some of these issues have been addressed through synthesis of analogues of SQ1, which displayed higher solubility and similar or improved toxicity [2], representing an important step for the development of a class of dermcidin targeting anticancer agents.
Our studies demonstrated that synthetic analogues (SQ2, SQ3, SQ4, and SQ5) maintained or improved the biological activity of the natural compound SQ1. Further studies showed that SQ2, SQ3, SQ4, and SQ5 provided effective selectivity indices (≥twofold) to SK-Mel cells in relation to non-tumor cell lines. Interestingly, SQ2 showed 30–40-times greater selectivity toward melanoma cell lines. Such selectivity is important to minimize side effects and has been widely explored for the development of novel anticancer drugs [20].
According to Trzoss et al. [1], the cytotoxicity of SQ1 was time-dependent requiring a 24-h exposure for efficacy in colorectal adenocarcinoma cells (HCT-116). For the BRAFV600E and NRASQ61R melanoma cells, SQ1 also displayed a time-dependent activity, increasing its activity between 24 and 72 h. After the initial 24-h exposure, SQ2 caused a higher decrease in cell viability than SQ1. Here, we found that viable SK-MEL-28 cells were able to adhere and proliferate in fresh, drug-free medium, in contrast to those exposed to SQ1. For SK-MEL-147, the parameters of colony number and area were also decreased by exposure to either SQ1 or SQ2 with cell proliferation, expressed by colony area, decreased only 50%. These data suggest that SQ1 may produce an irreversible scenario for cell survival in SK-MEL-28. Additionally, these studies provided the first evidence that BRAFV600E and NRASQ61R melanoma cells may have different responses to SQ1 and SQ2. Supporting this observation, we found that the gene expression of dermcidin, the target of SQ1, was modulated at different levels within these cell lines.
Besides the well-established role for the dermcidin in skin defense, this protein has been described as a cancer survival factor [21,22,23,24] with overexpressed in select tumors. Herein, the basal DCD expression varied among the biological triplicates from both SK-MEL-28 and SK-MEL-147 cells with enhanced expression in the NRAS mutant cell line. This observation may suggest why SK-MEL-147 cells are more resistant to SQ1 and SQ2 treatments during short periods (24 and 48 h) where DCD can act as an oncogene. Previous studies have shown that SQ1 and its analogues modulated DCD mRNA expression in HCT-116 (colorectal carcinoma), PC-3M (prostate carcinoma), MALME-3M (melanoma) and SK-MEL-28 (melanoma) cell lines [1,2]. We now find that SQ1 and SQ2 also up-regulated the expression of such transcripts in SK-MEL-28 and SK-MEL-147 cells in a dose-dependent manner, suggesting that analogs such as SQ2 also act by targeting dermcidin.
Autophagy plays an important role in cellular homeostasis, such as regular intracellular maintenance, tissue development and regeneration, aging and cell survival through starvation, and other stress conditions [25]. However, depending on the tumor scenario, therapeutic strategies for cancer treatment involving induction of autophagy is still controversial [26]. Current assessments of autophagy suggest that it acts as a cell survival mechanism, supplying necessary basal conditions for cancer cells to recover and resist transient adversity, which associates with tumor aggressiveness [27]. On the other hand, this cytoprotective autophagy can switch to a cytotoxic phenomenon depending on tumor profile or compound’s MOA, but still through unclear pathways [28,29]. Despite the mutations carried by SK-MEL-28 and SK-MEL-147, both SQ1 and SQ2 induced caspase-mediated apoptosis; nonetheless, the cell lines responded differently through autophagy inhibition. The BRAFV600E mutant cells were sensitized by pre-treatment with an autophagy inducer, while the opposite happened to the NRASQ61R bearing cells. Other groups reported a higher basal autophagy level for BRAF mutant cells, which corroborates with our gene panel data, and abolition of this process also caused a decrease in cell viability due to its relation to the maintenance of functional mitochondria [30,31,32]. However, only recently has the association between NRAS mutant melanomas and autophagy inhibition matured [33,34] despite the existence of a clinical trial in progress exploring the combination of MEK pathway modulators and autophagy inhibitors (NCT03979651). Zheng et al. reported that flunarizine, a drug approved for migraine and epilepsy treatment, triggered cytotoxic autophagy in basal-like breast cancer. When blocked, flunarizine treated cells partially restored NRAS levels [35]. These studies established that that small molecule induction of autophagy could lead to the degradation of NRAS and subsequent processing of RAS proteins in lysosomes [36]. These data support our hypothesis that NRASQ61R cells also trigger cytotoxic autophagy that, when inhibited, may cause a restoration of NRAS protein levels, which could explain the increase in cell proliferation. Studies are now underway to explore this phenomenon.
Challenges remain in clinical treatment of melanoma. When addressed with the conventional therapy, such as the alkylating agent dacarbazine, melanoma easily turns into a refractory tumor. There are some available options of molecular targeted inhibitors for this type of cancer, like BRAF and MEK inhibitors. However, the fast tumor recurrence is still problematic. Immunotherapies (anti-CTLA-4 and anti-PD-1 immune checkpoint inhibitor) have shown promising outcomes; however, these extensive treatments have shown to be non-responsive in patient cohorts [37]. Consequently, new strategies are urgently needed to manage melanoma. Ideally, the next generation therapies should embrace novel targets to reduce onset of resistance. Therefore, the differential mechanism of activating cytotoxic autophagy, induced by SQ1 and SQ2, may be key for melanoma treatment [38]. Here, we showed that autophagic dysregulation in melanoma may lead to apoptotic cell death through induction of autophagy in cells that already have a higher basal autophagy activity, as seen in BRAFV600E mutant cells. Furthermore, after triggered, autophagy may turn into a cytotoxic process in cells that have this mechanism suppressed. Here, small molecule modulation provided a response that can be detrimental to their basal maintenance, as evident in NRASQ61R mutant cells. Further studies are needed to elucidate the relation between dermcidin modulation and autophagy activation. Moreover, additional effort is required to understand the role of dermcidin in tumor cell survival and resistance. Additionally, to advance with seriniquinone into preclinical studies using animal models, it is necessary to overcome its poor water-solubility. As discussed by Apolinario et al. [39], the development of nanotechnology-based formulations, as observed for other lipophilic natural compounds, including paclitaxel and doxorubicin, can be an effective strategy to enable in vivo studies with seriniquinone.

4. Materials and Methods

4.1. Cell Culture

Human cell lines were used throughout this program. SK-MEL-19 (melanoma BRAFV600E, NRASWT), SK-MEL-28 (melanoma BRAFV600E, NRASWT), SK-MEL-147 (melanoma BRAFWT, NRASQ61R), MRC-5 (fibroblasts), and primary fibroblast (FDH) were kindly provided by Professor Glaucia Santelli (University of São Paulo, Brazil). MCF7 (breast adenocarcinoma, ATCC HTB-22), and HCT-116 (colorectal carcinoma, ATCC 247) cells were obtained from American Type Culture Collection (ATCC) and deposited in the Cell Bank of Rio de Janeiro, Brazil. WM293A (metastatic melanoma BRAFV600D, NRASWT), 501mel (metastatic melanoma BRAFV600E; NRASG12D), and MM200 (melanoma BRAFV600E, NRASWT) were kindly provided by Professor Sharon Prince, University of Cape Town, South Africa. All human melanoma and breast cell lines were cultivated with Dulbecco’s Modified Eagle Medium: Nutrient Mixture F-12 (Thermo Fisher Scientific, San Jose, CA, USA). MM200 and HCT-116 were maintained with Roswell Park Memorial Institute (RPMI) medium (Thermo Fisher Scientific, San Jose, CA, USA). Unless stated otherwise, media was supplemented with 10% fetal bovine serum (FBS) and 1% penicillin-streptomycin (Thermo Fisher Scientific, San Jose, CA, USA). Cells were incubated with 5% CO2 at 37 °C. When required, cells were detached from flask using trypsin-EDTA 0.05% (Thermo Fisher Scientific, San Jose, CA, USA).

4.2. Seriniquinone Analogues and Control Agents

Unless noted, all compounds were prepared as stocks in DMSO (Synth, Diadema, SP, Brazil). Seriniquinone (SQ1) and its synthetic analogues SQ2, SQ3, SQ4, and SQ5 (Figure 1A) were obtained as described in [2] and were used with ≥98% purity. All other compounds were obtained from commercial sources, as follows: doxorubicin (DOX; Sigma-Aldrich, St. Louis, MO, USA), rapamycin (RAPA; Sigma-Aldrich, St. Louis, MO, USA), bafilomycin A1 (Selleck Chemicals, Houston, TX, USA), and Z-VAD-FMK (Cayman Chemical Company, Ann Arbor, MI, USA).

4.3. Cytotoxicity Analyses via the MTT Assay

Cytotoxic activity was evaluated by the transformation of 3-(4,5-dimethylthiazol-2-yl)-2,5-diphenyltetrazolium bromide (MTT; Thermo Fisher Scientific, San Jose, CA, USA) into formazan by viable cells [40]. Cells were plated in a 96-well plate (1 × 10⁴ cells/well) and, 24 h later, exposed to serial dilutions of the test compounds (from 0.00032 to 5.0 µM) for 24, 48, and 72 h. For each analysis, negative controls received 0.5% DMSO and positive control was delivered by doxorubicin (DOX; 0.05 to 10.0 µM). At the end of the incubation periods, the medium was replaced with fresh medium containing 0.5 mg/mL of MTT and supernatant was removed 3 h later. The plates were dried at 50 °C for 30 min and formazan was solubilized in DMSO (150 µL/well) for the absorbance measure at 570 nm on a plate reader (Thermo Fisher Scientific, San Jose, CA, USA). IC50 values (half-maximal inhibitory concentration) along with 95% CI (confidence intervals) were calculated by non-linear regression using GraphPad Prism 8.0 software (GraphPad Software, Inc., San Diego, CA, USA).

4.4. Selectivity Indices

Based on the respective IC50 values obtained through MTT assay (72 h), a selectivity index (SI) was determined for each tumor cell line treated with SQ1 or SQ2 in relation to a non-tumor cell by the following formula:
SI = IC50 value from tumor cell line/IC50 from non-tumor cell line

4.5. Cell Viability Analyses through the Trypan Blue Exclusion Test

Fifty thousand (5 × 10⁴) cells in 1 mL of media were seeded in cell culture dishes and, 24 h later, treated with SQ1 or SQ2 (1.0, 2.5, and 5.0 µM), vehicle (DMSO) and doxorubicin (DOX, positive control) for 24 h. Cells were detached, stained with Trypan Blue solution 0.4% (1:10, v/v; Sigma-Aldrich, St. Louis, MO, USA) and counted in a Neubauer chamber under optical microscopy to determine concentrations of viable and non-viable cells.

4.6. Treatment Scheme

Twenty fifty thousand (2.5 × 10⁵) cells in 1 mL of media were seeded in cell culture dishes and, 24 h later, treated with SQ1 (0.3 µM and 0.6 µM for SK-MEL-28 and 0.9 µM and 1.8 µM for SK-MEL-147) or SQ2 (0.05 µM and 0.1 µM for SK-MEL-28 and 0.6 µM and 1.2 µM for SK-MEL-147) for 24 h. Doxorubicin (DOX; 1.4 µM for SK-MEL-28 and 0.8 µM for SK-MEL-147) was used as positive control and 0.5% DMSO as negative control. Concentrations were based on ½ IC50 values at 24 h and IC50 values at 24 h, respectively, from each cell line.

4.7. Clonogenic Assays

After the cells were submitted to the treatment scheme (Section 4.6), adherent cells were collected, plated at 1 × 10³ cell/plate on 35-mm plates and maintained in culture for 6 days in treatment-free medium. The medium was replaced every 2 days. Cells were then fixed and stained with a solution of 20% MeOH (Synth, Diadema, São Paulo, Brazil) and 0.5 g crystal violet (Sigma-Aldrich, St. Louis, MO, USA). Images were acquired using G:BOX Chemi XRQ (Syngene, Cambridge, UK) and quantified using the ImageJ program (ColonyArea; US National Institutes of Health, Bethesda, MD, USA).

4.8. Quantitative PCR Analyses

Treated cells (Section 4.6) had their total RNA extracted and purified using TRIzol reagent (Thermo Fisher Scientific, San Jose, CA, USA), in accordance with the manufacturer’s recommendations. For analysis of DCD expression, purified total RNA was quantified using an Eon Microplate Spectrophotometer (BioTek Instruments, Winooski, VT, USA). Quantitative PCR (qPCR) was conducted on a Rotor Gene 6000 real-time cycler (Corbett Life Science, Sydney, NSW, Australia) using GoTaq 1-Step RT-qPCR System (Promega, Madison, WI, EUA). The cycle conditions were as follows: 45 °C for 10 min, 95 °C for 15 min and 40 cycles of 95 °C for 15 s; 60 °C for 60 s, followed by the melt. Relative expression was calculated using the comparative CT method Delta-Delta-Ct (DDCt) [41]. The primer sequences and concentrations utilized (DCD and RPLPO) can be consulted in Table S3.
For the gene panel, the total RNA from three independent samples was extracted using TRIzol reagent. The samples were quantified, and their quality assessed by NanoDrop 2000 One Microvolume UV-Vis Spectrophotometer (Thermo Fisher Scientific, San Jose, CA, USA). cDNA was synthesized from 1 µg RNA using a High-Capacity cDNA Reverse Transcription Kit (Thermo Fisher Scientific, San Jose, CA, USA). qPCR was performed using a QuantStudio 3 Real-Time PCR System in conjunction with a SybrGreen System (Thermo Fisher Scientific, San Jose, CA, USA). Relative expression was calculated using the comparative CT method Delta-Delta-Ct (DDCt) [38]. All primer sequences and concentrations utilized can be consulted in Table S3.

4.9. Protein Expression Analyses by Western Blotting

Treated cells (Section 4.6) had their proteins extracted with the following solution: 10 mM ethylenediaminetetraacetic acid (EDTA), 10% triton, 2 mM phenylmethanesulfonyl fluoride (PMSF), 10 mM Tris base, 10 mM sodium pyrophosphate, 100 mM sodium fluoride, 2.5 mM sodium orthovanadate, and deionized water. The resulting extract was quantified for protein concentration and 30 µg of protein were subjected to SDS-PAGE and to Western blot analysis with the indicated antibodies: cleaved PARP-1 (#5625), PARP1 (#9542), cleaved caspase-3 (#9604), caspase-3 (#9662), SQSTM1/p62 (#5114), LC3B (#2775), and α-tubulin (#2144) from Cell Signaling Technology (Danvers, MA, USA). Images of membranes were made using Pierce ECL Western Blotting Substrate (Thermo Fisher Scientific, San Jose, CA, USA) and G:BOX Chemi XRQ (Syngene, Cambridge, UK). Band intensities were quantified using UN-SCAN-IT gel 6.1 software (Silk Scientific; Orem, UT, USA).

4.10. Statistical Analyses

Data were analyzed in GraphPad Prism 8.0 (GraphPad Software, Inc.) using one-way ANOVA followed by Dunnett’s test or Student’s t-test. Data are expressed in terms of mean and standard deviation (mean ± SD).

5. Conclusions

This study provides an in-depth evaluation of the biological activity of the natural product seriniquinone (SQ1) and synthetic analogue SQ2 in melanoma cell lines. The resulting data provided new insights into the molecular MOA of this novel class of chemotherapeutic, as well as, revealing a further understanding of the mechanisms associated with induction of autophagy and apoptosis. Additionally, the cancer driver mutations (BRAFV600E and NRASQ61R) were found to not impact SQ1 or SQ2 cytotoxicity. The evidence herein suggests that a combination of SQ1 or SQ2 with autophagy inhibitors could be further explored to expand the efficacy of these agents and ideally enhance the targeting of BRAF mutated melanomas.

Supplementary Materials

The following are available online, Figure S1: Quantifications from Western blotting analysis with inhibitor treatments. Table S1: IC50 values for seriniquinone (SQ1) and its synthetic analogs for 72-h treatment determined by MTT assay on cell lines (n = 3). Table S2: IC50 values for seriniquinone (SQ1) and its synthetic analog 2 (SQ2) by MTT assay on melanoma cell lines SK-MEL-28 and SK-MEL-147 in different times of treatments (n = 3). Table S3: Primer sequences and concentrations for quantitative PCR. Table S4: IC50 values (µM) of seriniquinone (SQ1), its synthetic analog (SQ2), rapamycin and doxorubicin by MTT assay in SK-MEL-28 and SK-MEL-147 melanoma cell lines of 24-h treatment. Cells were 1h pre-treated with 30 nM bafilomycin A1 and 20 µM Z-VAD-FMK (n = 3).

Author Contributions

Conceptualization, A.S.H., P.C.J. and L.V.C.-L.; methodology, A.S.H., P.R.-T., J.A.M.-N. and J.J.L.C.; validation, A.S.H., J.A.M.-N. and J.J.L.C.; formal analysis, A.S.H., P.R.-T., J.A.M.-N. and L.V.C.-L.; investigation, A.S.H., P.R.-T. and J.A.M.-N.; resources, L.V.C.-L., J.J.L.C. and W.F.; data curation, L.V.C.-L. and A.S.H.; original draft preparation, A.S.H. and J.J.L.C.; writing, review and editing, A.S.H., P.R.-T., J.A.M.-N., P.C.J., J.J.L.C., W.F. and L.V.C.-L.; supervision, L.V.C.-L.; project administration, L.V.C.-L.; funding acquisition, A.S.H., L.V.C.-L. and J.A.M.-N. All authors have read and agreed to the published version of the manuscript.

Funding

This research was funded by The State of São Paulo Research Foundation, FAPESP (2016/10854-5, 2018/07661-6, 2020/06613-8, 2015/17177-6, 2019/23864-7) and National Council for Scientific and Technological Development, CNPq (443281/2019-0).

Institutional Review Board Statement

Not applicable.

Informed Consent Statement

Not applicable.

Data Availability Statement

The datasets used and/or analyzed during the current study are available from the corresponding author upon reasonable request.

Acknowledgments

We acknowledge Helory Vanni Domingos and Simone Aparecida Teixeira for technical assistance.

Conflicts of Interest

The authors declare no conflict of interest.

Sample Availability

Samples of the compounds are available from the authors.

References

  1. Trzoss, L.; Fukuda, T.; Costa-Lotufo, L.V.; Jimenez, P.; La Clair, J.J.; Fenical, W. Seriniquinone, a selective anticancer agent, induces cell death by autophagocytosis, targeting the cancer-protective protein dermcidin. Proc. Natl. Acad. Sci. USA 2014, 111, 14687–14692. [Google Scholar] [CrossRef] [Green Version]
  2. Hammons, J.C.; Trzoss, L.; Jimenez, P.C.; Hirata, A.S.; Costa-Lotufo, L.V.; La Clair, J.J.; Fenical, W. Advance of Seriniquinone Analogues as Melanoma Agents. ACS Med. Chem. Lett. 2019, 10, 186–190. [Google Scholar] [CrossRef] [PubMed]
  3. Akbani, R.; Akdemir, K.C.; Aksoy, B.A.; Albert, M.; Ally, A.; Amin, S.B.; Arachchi, H.; Arora, A.; Ayala, B.; Kwong, L.N.; et al. Genomic classification of cutaneous melanoma. Cell 2015, 161, 1681–1696. [Google Scholar] [CrossRef] [Green Version]
  4. Manzano, J.L.; Layos, L.; Bugés, C.; de Los Llanos Gil, M.; Vila, L.; Martínez-Balibrea, E.; Martinez-Cardus, A. Resistant mechanisms to BRAF inhibitors in melanoma. Ann. Transl. Med. 2016, 4, 237. [Google Scholar] [CrossRef] [PubMed] [Green Version]
  5. Lev, D.C.; Onn, A.; Melinkova, V.O.; Miller, C.; Stone, V.; Ruiz, M.; McGary, E.C.; Ananthaswamy, H.N.; Price, J.E.; Bar-Eli, M. Exposure of Melanoma Cells to Dacarbazine Results in Enhanced Tumor Growth and Metastasis In Vivo. J. Clin. Oncol. 2004, 22, 2092–2100. [Google Scholar] [CrossRef]
  6. Kozar, I.; Margue, C.; Rothengatter, S.; Haan, C.; Kreis, S. Many ways to resistance: How melanoma cells evade targeted therapies. Biochim. Biophys. Acta Bioenergy 2019, 1871, 313–322. [Google Scholar] [CrossRef] [PubMed]
  7. Sade-Feldman, M.; Jiao, Y.J.; Chen, J.H.; Rooney, M.S.; Barzily-Rokni, M.; Eliane, J.-P.; Bjorgaard, S.L.; Hammond, M.R.; Vitzthum, H.; Blackmon, S.M.; et al. Resistance to checkpoint blockade therapy through inactivation of antigen presentation. Nat. Commun. 2017, 8, 1–11. [Google Scholar] [CrossRef] [PubMed]
  8. Schittek, B. The Multiple Facets of Dermcidin in Cell Survival and Host Defense. J. Innate Immun. 2012, 4, 349–360. [Google Scholar] [CrossRef]
  9. Hirata, A.S.; Miguel, R.A.; Jimenez, P.C.; Costa-Lotufo, L.V. DCD (dermcidin). Atlas Genet. Cytogenet. Oncol. Haematol. 2021, 25, 73–82. [Google Scholar] [CrossRef]
  10. Bancovik, J.; Moreira, D.F.; Carrasco, D.; Yao, J.; Porter, D.; Moura, R.; Camargo, A.; Fontes-Oliveira, C.C.; Malpartida, M.G.; Carambula, S.; et al. Dermcidin exerts its oncogenic effects in breast cancer via modulation of ERBB signaling. BMC Cancer 2015, 15, 1–13. [Google Scholar] [CrossRef] [PubMed]
  11. Chang, W.C.; Huang, M.S.; Yang, C.J.; Wang, W.Y.; Lai, T.C.; Hsiao, M.; Chen, C.H. Dermcidin identification from exhaled air for lung cancer diagnosis. Eur. Respir. J. 2010, 35, 1182–1185. [Google Scholar] [CrossRef]
  12. Ortega-Martínez, I.; Gardeazabal, J.; Erramuzpe, A.; Sanchez-Diez, A.; Cortés, J.; García-Vázquez, M.D.; Pérez-Yarza, G.; Izu, R.; Díaz-Ramón, J.L.; de la Fuente, I.M.; et al. Vitronectin and dermcidin serum levels predict the metastatic progression of AJCC I–II early-stage melanoma. Int. J. Cancer 2016, 139, 1598–1607. [Google Scholar] [CrossRef] [PubMed] [Green Version]
  13. Fischer, G.M.; Vashisht Gopal, Y.N.; McQuade, J.L.; Peng, W.; DeBerardinis, R.J.; Davies, M.A. Metabolic strategies of melanoma cells: Mechanisms, interactions with the tumor microenvironment, and therapeutic implications. Pigment. Cell Melanoma Res. 2018, 31, 11–30. [Google Scholar] [CrossRef]
  14. Dorard, C.; Estrada, C.; Barbotin, C.; Larcher, M.; Garancher, A.; Leloup, J.; Beermann, F.; Baccarini, M.; Pouponnot, C.; LaRue, L.; et al. RAF proteins exert both specific and compensatory functions during tumour progression of NRAS-driven melanoma. Nat. Commun. 2017, 8, 1–13. [Google Scholar] [CrossRef] [PubMed] [Green Version]
  15. Flaherty, K.T.; Puzanov, I.; Kim, K.B.; Ribas, A.; McArthur, G.; Sosman, J.A.; O’Dwyer, P.J.; Lee, R.J.; Grippo, J.F.; Nolop, K.; et al. Inhibition of Mutated, Activated BRAF in Metastatic Melanoma. N. Engl. J. Med. 2010, 363, 809–819. [Google Scholar] [CrossRef] [Green Version]
  16. Chapman, P.B.; Hauschild, A.; Robert, C.; Haanen, J.B.; Ascierto, P.; Larkin, J.; McArthur, G.A. Improved survival with vemurafenib in melanoma with BRAF V600E mutation. N. Engl. J. Med. 2011, 364, 2507–2516. [Google Scholar] [CrossRef] [PubMed] [Green Version]
  17. Hauschild, A.; Grob, J.-J.; Demidov, L.V.; Jouary, T.; Gutzmer, R.; Millward, M.; Rutkowski, P.; Blank, C.U.; Miller, W.H.; Kaempgen, E.; et al. Dabrafenib in BRAF-mutated metastatic melanoma: A multicentre, open-label, phase 3 randomised controlled trial. Lancet 2012, 380, 358–365. [Google Scholar] [CrossRef]
  18. Albino, A.P.; Le Strange, R.; Oliff, A.I.; Furth, M.E.; Old, L.J. Transforming ras genes from human melanoma: A manifestation of tumour heterogeneity? Nat. Cell Biol. 1984, 308, 69–72. [Google Scholar] [CrossRef] [PubMed]
  19. Jenkins, R.W.; Sullivan, R.J. NRAS mutant melanoma: An overview for the clinician for melanoma management. Melanoma Manag. 2016, 3, 47–59. [Google Scholar] [CrossRef]
  20. Pérez-Herrero, E.; Fernández-Medarde, A. Advanced targeted therapies in cancer: Drug nanocarriers, the future of chemotherapy. Eur. J. Pharm. Biopharm. 2015, 93, 52–79. [Google Scholar] [CrossRef] [PubMed] [Green Version]
  21. Stewart, G.D.; Lowrie, A.G.; Riddick, A.C.P.; Fearon, K.C.H.; Habib, F.K.; Ross, J.A. Dermcidin expression confers a survival advantage in prostate cancer cells subjected to oxidative stress or hypoxia. Prostate 2007, 67, 1308–1317. [Google Scholar] [CrossRef] [PubMed]
  22. Lowrie, A.G.; Wigmore, S.J.; Wright, D.J.; Waddell, I.D.; A Ross, J. Dermcidin expression in hepatic cells improves survival without N-glycosylation, but requires asparagine residues. Br. J. Cancer 2006, 94, 1663–1671. [Google Scholar] [CrossRef] [PubMed]
  23. Brauer, H.A.; D’Arcy, M.; Libby, T.; Thompson, H.J.; Yasui, Y.Y.; Hamajima, N.; Li, C.I.; Troester, M.A.; Lampe, P.D. Dermcidin expression is associated with disease progression and survival among breast cancer patients. Breast Cancer Res. Treat. 2014, 144, 299–306. [Google Scholar] [CrossRef] [Green Version]
  24. Porter, D.; Weremowicz, S.; Chin, K.; Seth, P.; Keshaviah, A.; Lahti-Domenici, J.; Bae, Y.K.; Monitto, C.L.; Merlos-Suarez, A.; Chan, J.; et al. A neural survival factor is a candidate oncogene in breast cancer. Proc. Natl. Acad. Sci. USA 2003, 100, 10931–10936. [Google Scholar] [CrossRef] [Green Version]
  25. Mizushima, N.; Komatsu, M. Autophagy: Renovation of Cells and Tissues. Cell 2011, 147, 728–741. [Google Scholar] [CrossRef] [Green Version]
  26. Onorati, A.V.; Dyczynski, M.; Ojha, R.; Amaravadi, R.K. Targeting autophagy in cancer. Cancer 2018, 124, 3307–3318. [Google Scholar] [CrossRef] [PubMed] [Green Version]
  27. Ndoye, A.; Weeraratna, A.T. Autophagy-An emerging target for melanoma therapy. F1000Research 2016, 5. [Google Scholar] [CrossRef] [PubMed] [Green Version]
  28. Wilson, E.N.; Bristol, M.L.; Di, X.; Maltese, W.A.; Koterba, K.; Beckman, M.J.; Gewirtz, D.A. A Switch between Cytoprotective and Cytotoxic Autophagy in the Radiosensitization of Breast Tumor Cells by Chloroquine and Vitamin D. Horm. Cancer 2011, 2, 272–285. [Google Scholar] [CrossRef] [PubMed] [Green Version]
  29. Sophia, J.; Kowshik, J.; Dwivedi, A.; Bhutia, S.K.; Manavathi, B.; Mishra, R.; Nagini, S. Nimbolide, a neem limonoid inhibits cytoprotective autophagy to activate apoptosis via modulation of the PI3K/Akt/GSK-3β signalling pathway in oral cancer. Cell Death Dis. 2018, 9, 1–18. [Google Scholar] [CrossRef] [PubMed] [Green Version]
  30. Strohecker, A.M.; White, E. Targeting Mitochondrial Metabolism by Inhibiting Autophagy in BRAF-Driven Cancers. Cancer Discov. 2014, 4, 766–772. [Google Scholar] [CrossRef] [Green Version]
  31. Strohecker, A.M.; Guo, J.Y.; Karsli-Uzunbas, G.; Price, S.M.; Chen, G.J.; Mathew, R.; McMahon, M.; White, E. Autophagy Sustains Mitochondrial Glutamine Metabolism and Growth of BrafV600E–Driven Lung Tumors. Cancer Discov. 2013, 3, 1272–1285. [Google Scholar] [CrossRef] [Green Version]
  32. Xie, X.; Koh, J.Y.; Price, S.; White, E.; Mehnert, J.M. Atg7 Overcomes Senescence and Promotes Growth of BrafV600E-Driven Melanoma. Cancer Discov. 2015, 5, 410–423. [Google Scholar] [CrossRef] [Green Version]
  33. Yu, Y.; Xie, Y.; Cao, L.; Yang, L.; Yang, M.; Lotze, M.T.; Zeh, H.J.; Kang, R.; Tang, D. The ferroptosis inducer erastin enhances sensitivity of acute myeloid leukemia cells to chemotherapeutic agents. Mol. Cell. Oncol. 2015, 2, e1054549. [Google Scholar] [CrossRef] [PubMed] [Green Version]
  34. Kinsey, C.G.; Camolotto, S.A.; Boespflug, A.M.; Guillen, K.P.; Foth, M.; Truong, A.; Schuman, S.S.; Shea, J.E.; Seipp, M.T.; Yap, J.T.; et al. Protective autophagy elicited by RAF→MEK→ERK inhibition suggests a treatment strategy for RAS-driven cancers. Nat. Med. 2019, 25, 620–627. [Google Scholar] [CrossRef] [PubMed]
  35. Zheng, Z.-Y.; Li, J.; Li, F.; Zhu, Y.; Cui, K.; Wong, S.T.; Chang, E.C.; Liao, Y.-H. Induction of N-Ras degradation by flunarizine-mediated autophagy. Sci. Rep. 2018, 8, 1–7. [Google Scholar] [CrossRef]
  36. Lu, A.; Tebar, F.; Alvarez-Moya, B.; López-Alcalá, C.; Calvo, M.; Enrich, C.; Agell, N.; Nakamura, T.; Matsuda, M.; Bachs, O. A clathrin-dependent pathway leads to KRas signaling on late endosomes en route to lysosomes. J. Cell Biol. 2009, 184, 863–879. [Google Scholar] [CrossRef] [Green Version]
  37. Mattia, G.; Puglisi, R.; Ascione, B.; Malorni, W.; Carè, A.; Matarrese, P. Cell death-based treatments of melanoma:conventional treatments and new therapeutic strategies. Cell Death Dis. 2018, 9, 1–14. [Google Scholar] [CrossRef] [PubMed] [Green Version]
  38. Fairlie, W.D.; Tran, S.; Lee, E.F. Crosstalk between apoptosis and autophagy signaling pathways. Int. Rev. Cell Mol. Biol. 2020, 352, 115–158. [Google Scholar] [CrossRef]
  39. Apolinário, A.C.; Hirata, A.S.; Miguel, R.D.A.; Costa-Lotufo, L.V.; Pessoa, A.; La Clair, J.J.; Fenical, W.; Lopes, L.B. Exploring the benefits of nanotechnology for cancer drugs in different stages of the drug development pipeline. Nanomedicine 2020, 15, 2539–2542. [Google Scholar] [CrossRef]
  40. Mosmann, T. Rapid colorimetric assay for cellular growth and survival: Application to proliferation and cytotoxicity assays. J. Immunol. Methods 1983, 65, 55–63. [Google Scholar] [CrossRef]
  41. Livak, K.J.; Schmittgen, T.D. Analysis of relative gene expression data using realtime quantitative PCR and the 2(-Delta Delta C(T)) method. Methods 2001, 25, 402–408. [Google Scholar] [CrossRef] [PubMed]
Figure 1. Seriniquinone (SQ1) and synthetic analogues (SQ2, SQ3, SQ4, and SQ5) are cytotoxic to cancer cell lines. (A) SQ1, the natural compound, was the prototype for designing the analogues. (B) All compounds were tested by 72-h treatment using the MTT assay in a panel of tumor and non-tumor cell lines, for which the IC50 values are expressed in µM (n = 3; mean ± SD). All experiments used DMSO (vehicle) and doxorubicin as negative and positive controls, respectively.
Molecules 26 07362 g001
Figure 2. Characterization of SQ1 and SQ2 activity in BRAF and NRAS mutant cell lines. (A) Dose-response curves for SQ1 (black) and SQ2 (red) treatments of SK-MEL-28 (BRAFV600E mutant; full line) and SK-MEL-147 (NRASQ61R mutant; dotted line) during 24-, 48-, and 72-h treatments. (B) SQ1 and SQ2 decreased the percentage of viable cells and increased non-viable cells. SK-MEL-28 and SK-MEL-147 were treated with 1% DMSO (negative control), 10 µM doxorubicin (DOX, positive control), SQ1 and SQ2 (1.0, 2.5, or 5.0 µM) for 24 h. With Trypan blue dye, cells were counted and viability was demonstrated as a percentage. (C) Representative images from the clonogenic assay. Cells were treated for 24 h with DMSO (negative control: 0.5%), doxorubicin (DOX; positive control: 1.4 µM for SK-MEL-28 or 0.8 µM for SK-MEL-147), SQ1 (0.3 or 0.6 µM for SK-MEL-28 and 0.9 µM or 1.8 µM for SK-MEL-147) and SQ2 (0.05 or 0.1 µM for SK-MEL-28 and 0.6 or 1.2 µM for SK-MEL-147). Viable cells formed colonies in 6 days in treatment-free medium. Quantifications (ImageJ program, ColonyArea) of number of colonies and colony areas (D) for SK-MEL-28 and (E) for SK-MEL-147. Relative expressions of DCD gene in (F) SK-MEL-28 and (G) SK-MEL-147 performed by qPCR (housekeeping gene: RPLPO). Cells were treated for 24 h with the same concentrations described for (C) and data are shown as box plots (minimum to maximum values). All the experiments were performed in biological triplicates (mean ± SD) and submitted to statistical analysis: ANOVA one way followed by Dunnett’s test (* p < 0.05, ** p < 0.002, *** p < 0.0005).
Molecules 26 07362 g002
Figure 3. SQ1 and SQ2 induce cell death triggering autophagy and apoptosis. SQ1 induce cell death marked by activation of autophagy and apoptosis. (A) SK-MEL-28 and SK-MEL-147 were treated for 24 h with DMSO (negative control: 0.2%), doxorubicin (DOX; positive control: 1.4 µM for SK-MEL-28 and 0.8 µM for SK-MEL-147), SQ1 (0.3 and 0.6 µM for SK-MEL-28 and 0.89 and 1.79 µM for SK-MEL-147) and SQ2 (0.05 and 0.1 µM for SK-MEL-28 and 0.63 and 1.26 µM for SK-MEL-147). (B) SK-MEL-28 was treated with the higher concentration of SQ1 (0.6 µM) and proteins were extracted at times of 0, 6, 8, 12, and 24 h, demonstrating that autophagy and apoptosis processes occur concomitantly with initiation between 8 and 12 h. By Western blotting, proteins PARP-1, cleaved PARP-1, caspase 3, and cleaved caspase 3 were analyzed as apoptosis markers, while p62 and LC3B were probed for autophagy. Quantifications were carried out in the UN-SCAN-IT Gel 6.1 (Silk Scientific), normalized by comparison with α-tubulin and compared with the negative control of each experiment, showing the mean values (n = 3).
Molecules 26 07362 g003
Figure 4. Basal expression of apoptosis and autophagy associated genes in BRAFV600E and NRASQ61R melanoma cells. A heatmap depicting the levels of select apoptosis- and autophagy-related genes by qPCR analysis in three independent samples from SK-MEL-28 (BRAFV600E) and SK-MEL-147 (NRASQ61R) cell lines. The data are presented as fold change of a sample from SK-MEL-28 cells. Downregulated and upregulated genes are illustrated in blue and red, respectively. Fold-changes of genes expression are presented in bar graphs (mean ± SD). The p values are indicated; * p < 0.05; ** p < 0.01; *** p < 0.001 as determined by a Student’s t-test.
Molecules 26 07362 g004
Figure 5. BRAF and NRAS respond differently under inhibition of the autophagy signaling. SK-MEL-28 (A,B) and SK-MEL-147 (C,D) cells were submitted to 1-h pre-treatments with 30 nM bafilomycin A1 (BAF) or 20 µM Z-VAD-FMK (ZVF). Dose-response curves (AC) were calculated using the MTT assay with increasing concentrations of SQ1 and SQ2 following 24-h treatment (n = 3; mean ± SD). Protein expression (BD) (PARP-1, cleaved PARP-1, caspase 3 and cleaved caspase 3, p62, and LC3B) was evaluated by Western blotting after 24 h of incubation with: DMSO (negative control: 0.2%), doxorubicin (DOX; positive control: 1.4 µM for SK-MEL-28 and 0.8 µM for SK-MEL-147), rapamycin (RAPA, 18 µM), SQ1 (0.6 µM for SK-MEL-28 and 1.79 µM for SK-MEL-147), and SQ2 (0.1 µM for SK-MEL-28 and 1.26 µM for SK-MEL-147). Quantifications were carried out in the UN-SCAN-IT Gel 6.1 (Silk Scientific), normalized by α-tubulin and compared with the negative control of each experiment (n = 3).
Molecules 26 07362 g005
Table 1. Selectivity Index (SI) of SQ1, the synthetic analogues (SQ2–SQ5) and doxorubicin (DOX) for cancer (SK-MEL-19, SK-MEL-28, SK-MEL-147, WM293A, 501mel, MM200, MCF7, and HCT-116) versus normal fibroblast cells (MRC-5). Data is reported as the ratio of the respective 72-h IC50 value to that of MRC-5 cells. Highlighted in red, SQ2 presented higher SI values than SQ1.
Selectivity Index (SI)
SK-MEL-28SK-MEL-19SK-MEL-147WM293A501melMM200MCF7HCT-116
SQ14.310.74.90.62.00.50.20.6
SQ239.339.315.72.114.32.12.26.8
SQ36.013.05.51.07.21.00.81.4
SQ412.97.76.11.4 -2.12.52.4
SQ53.714.08.00.30.31.91.12.5
DOX0.040.10.30.90.20.50.10.3
Table 2. Selectivity Index (SI) of SQ1, the synthetic analogues (SQ2–SQ5) and doxorubicin (DOX) for cancer (SK-MEL-19, SK-MEL-28, SK-MEL-147, WM293A, 501mel, MM200, MCF7, and HCT-116) versus normal primary fibroblast cells (FDH). Data was reported as the ratio of the 72-h IC50 value as compared to FDH cells. Highlighted in red, SQ2 presented higher SI values than SQ1.
Selectivity Index (SI)
SK-MEL-28SK-MEL-19SK-MEL-147WM293A501melMM200MCF7HCT-116
SQ17.719.28.81.13.60.80.31.1
SQ229.329.311.71.610.61.61.65.1
SQ314.631.813.52.317.52.41.83.4
SQ45.33.22.50.6-0.91.01.0
SQ56.223.313.30.60.53.11.94.2
DOX0.62.04.313.03.07.81.45.2
Publisher’s Note: MDPI stays neutral with regard to jurisdictional claims in published maps and institutional affiliations.

