
Insights into the Ligand Binding to Bromodomain-Containing Protein 9 (BRD9): A Guide to the Selection of Potential Binders by Computational Methods


Abstract
: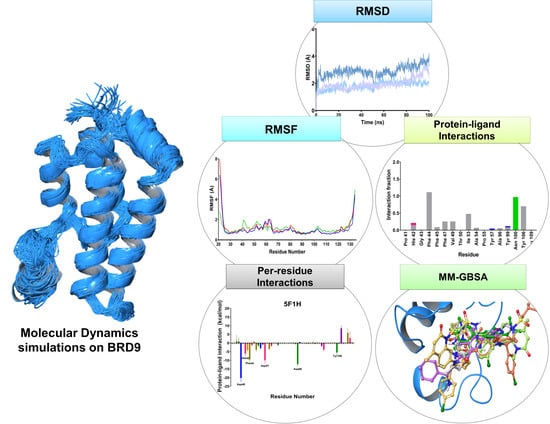
1. Introduction
2. Results
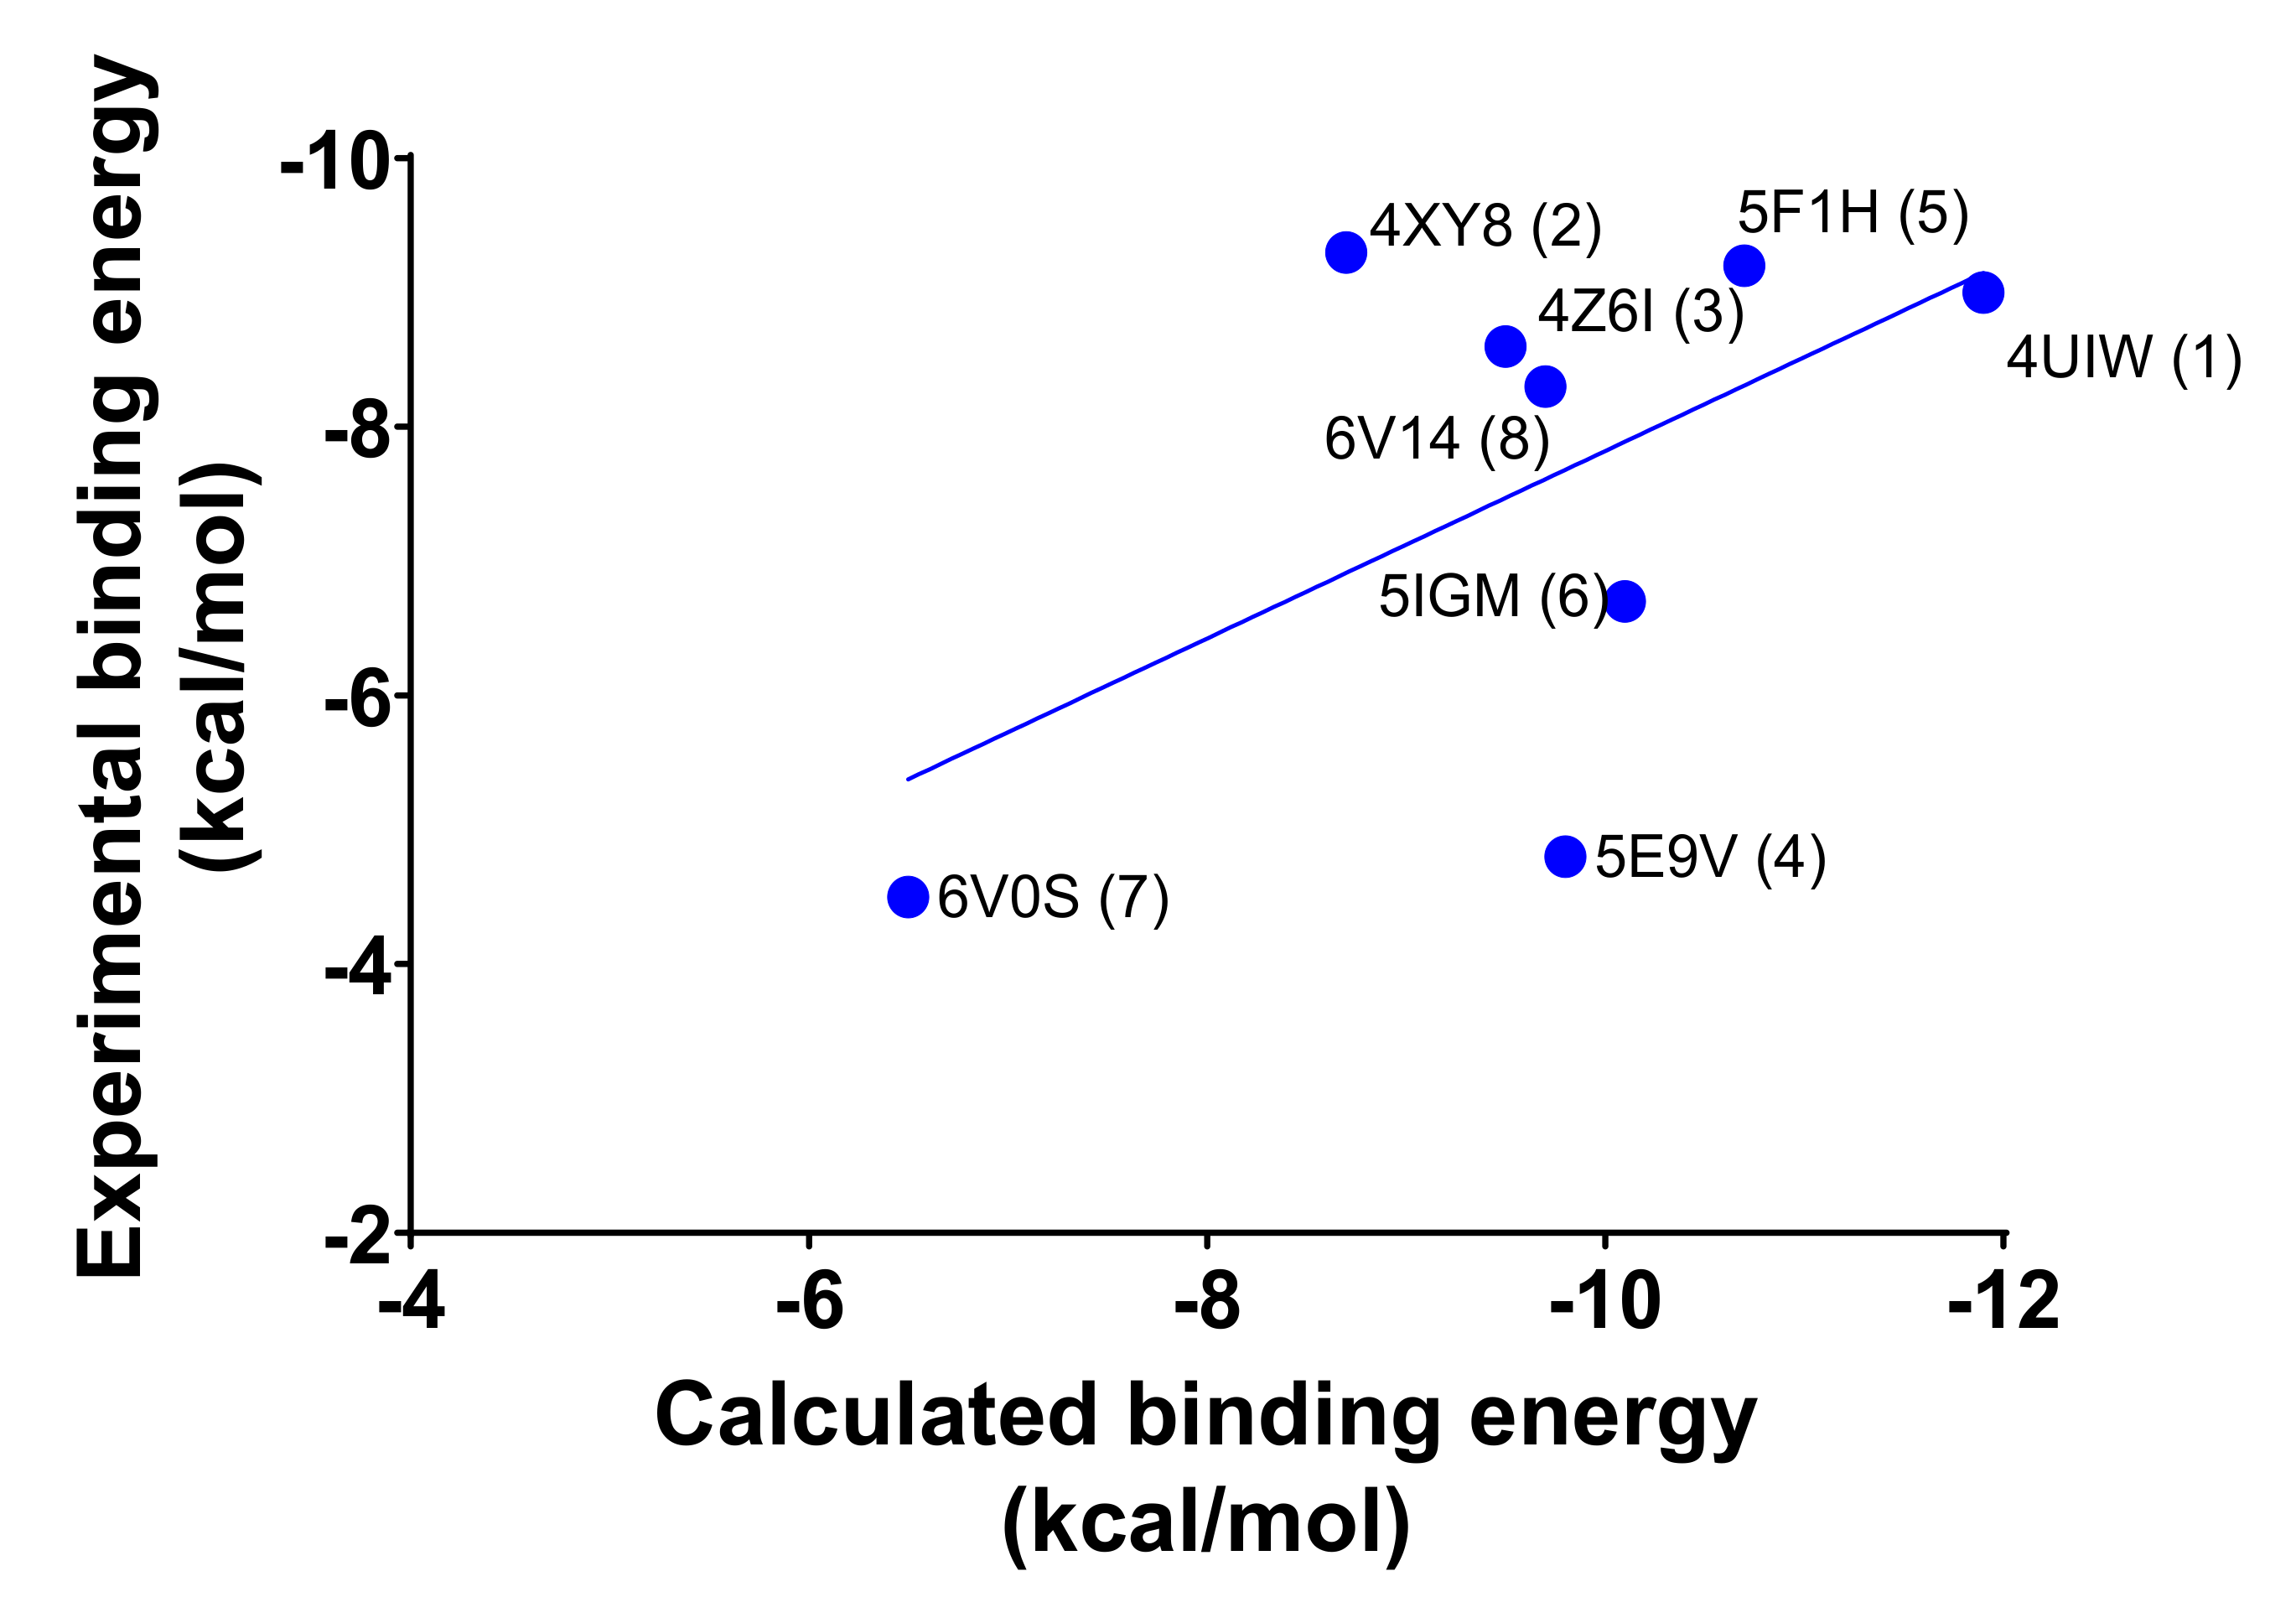
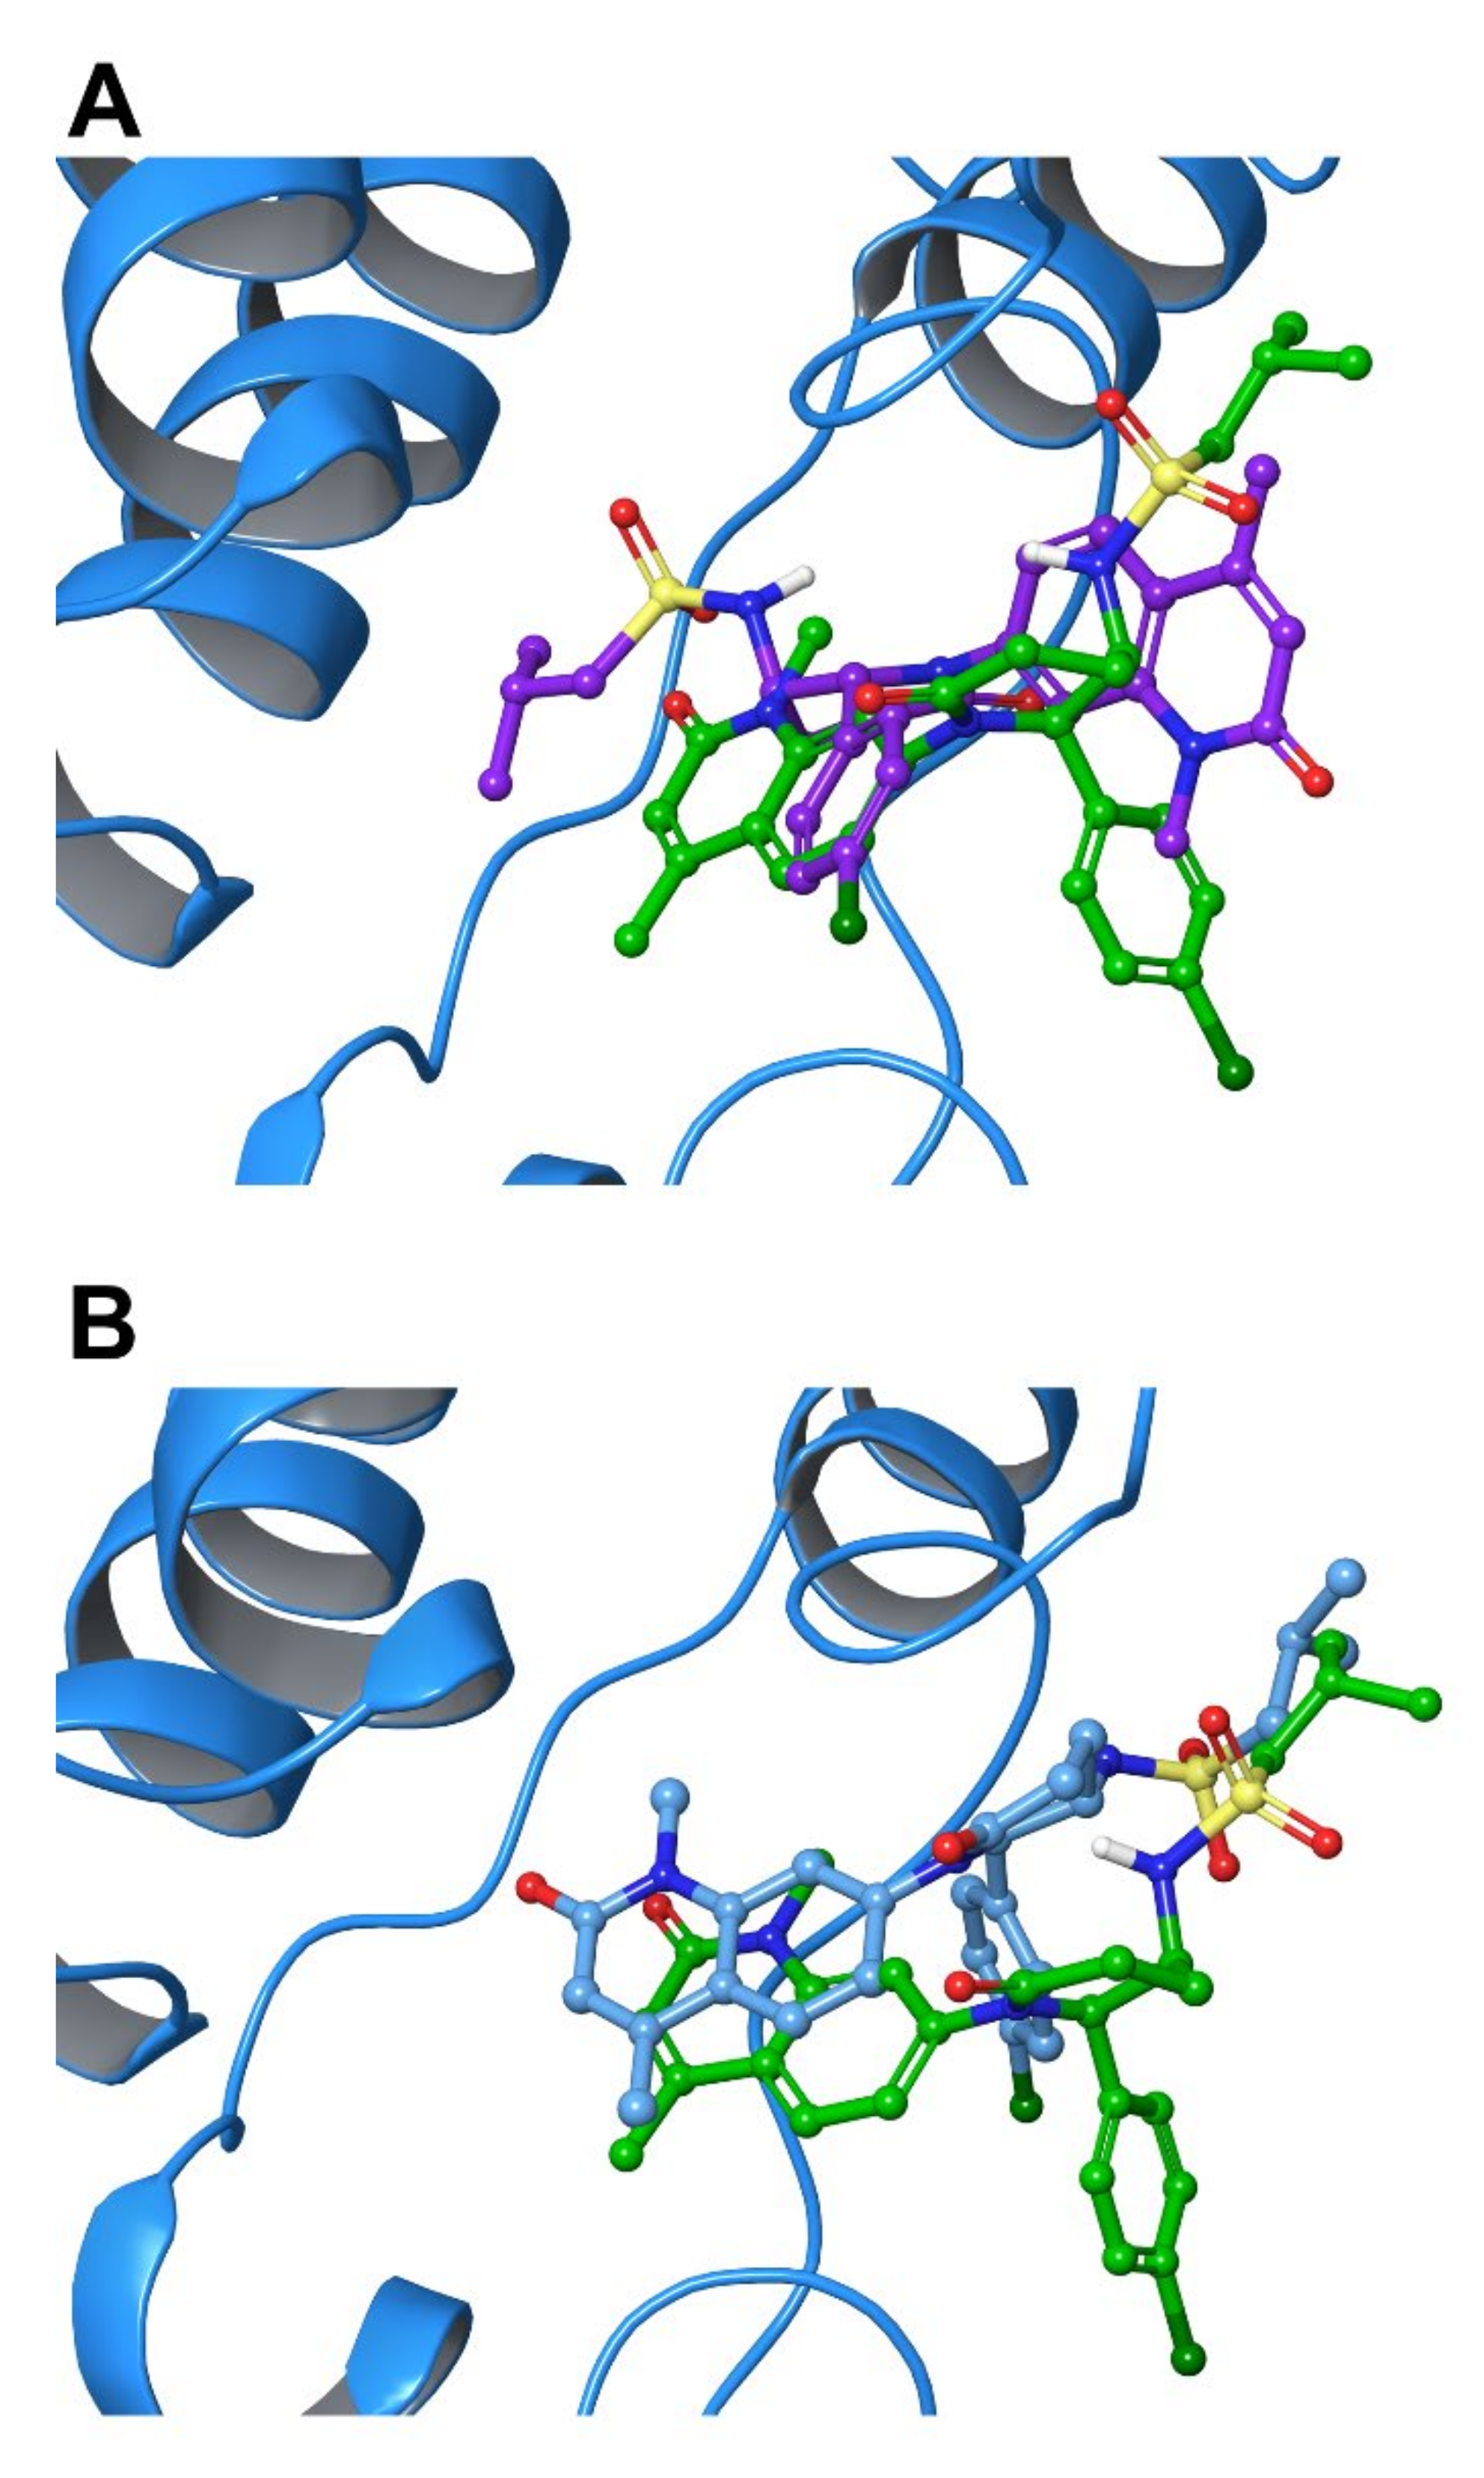
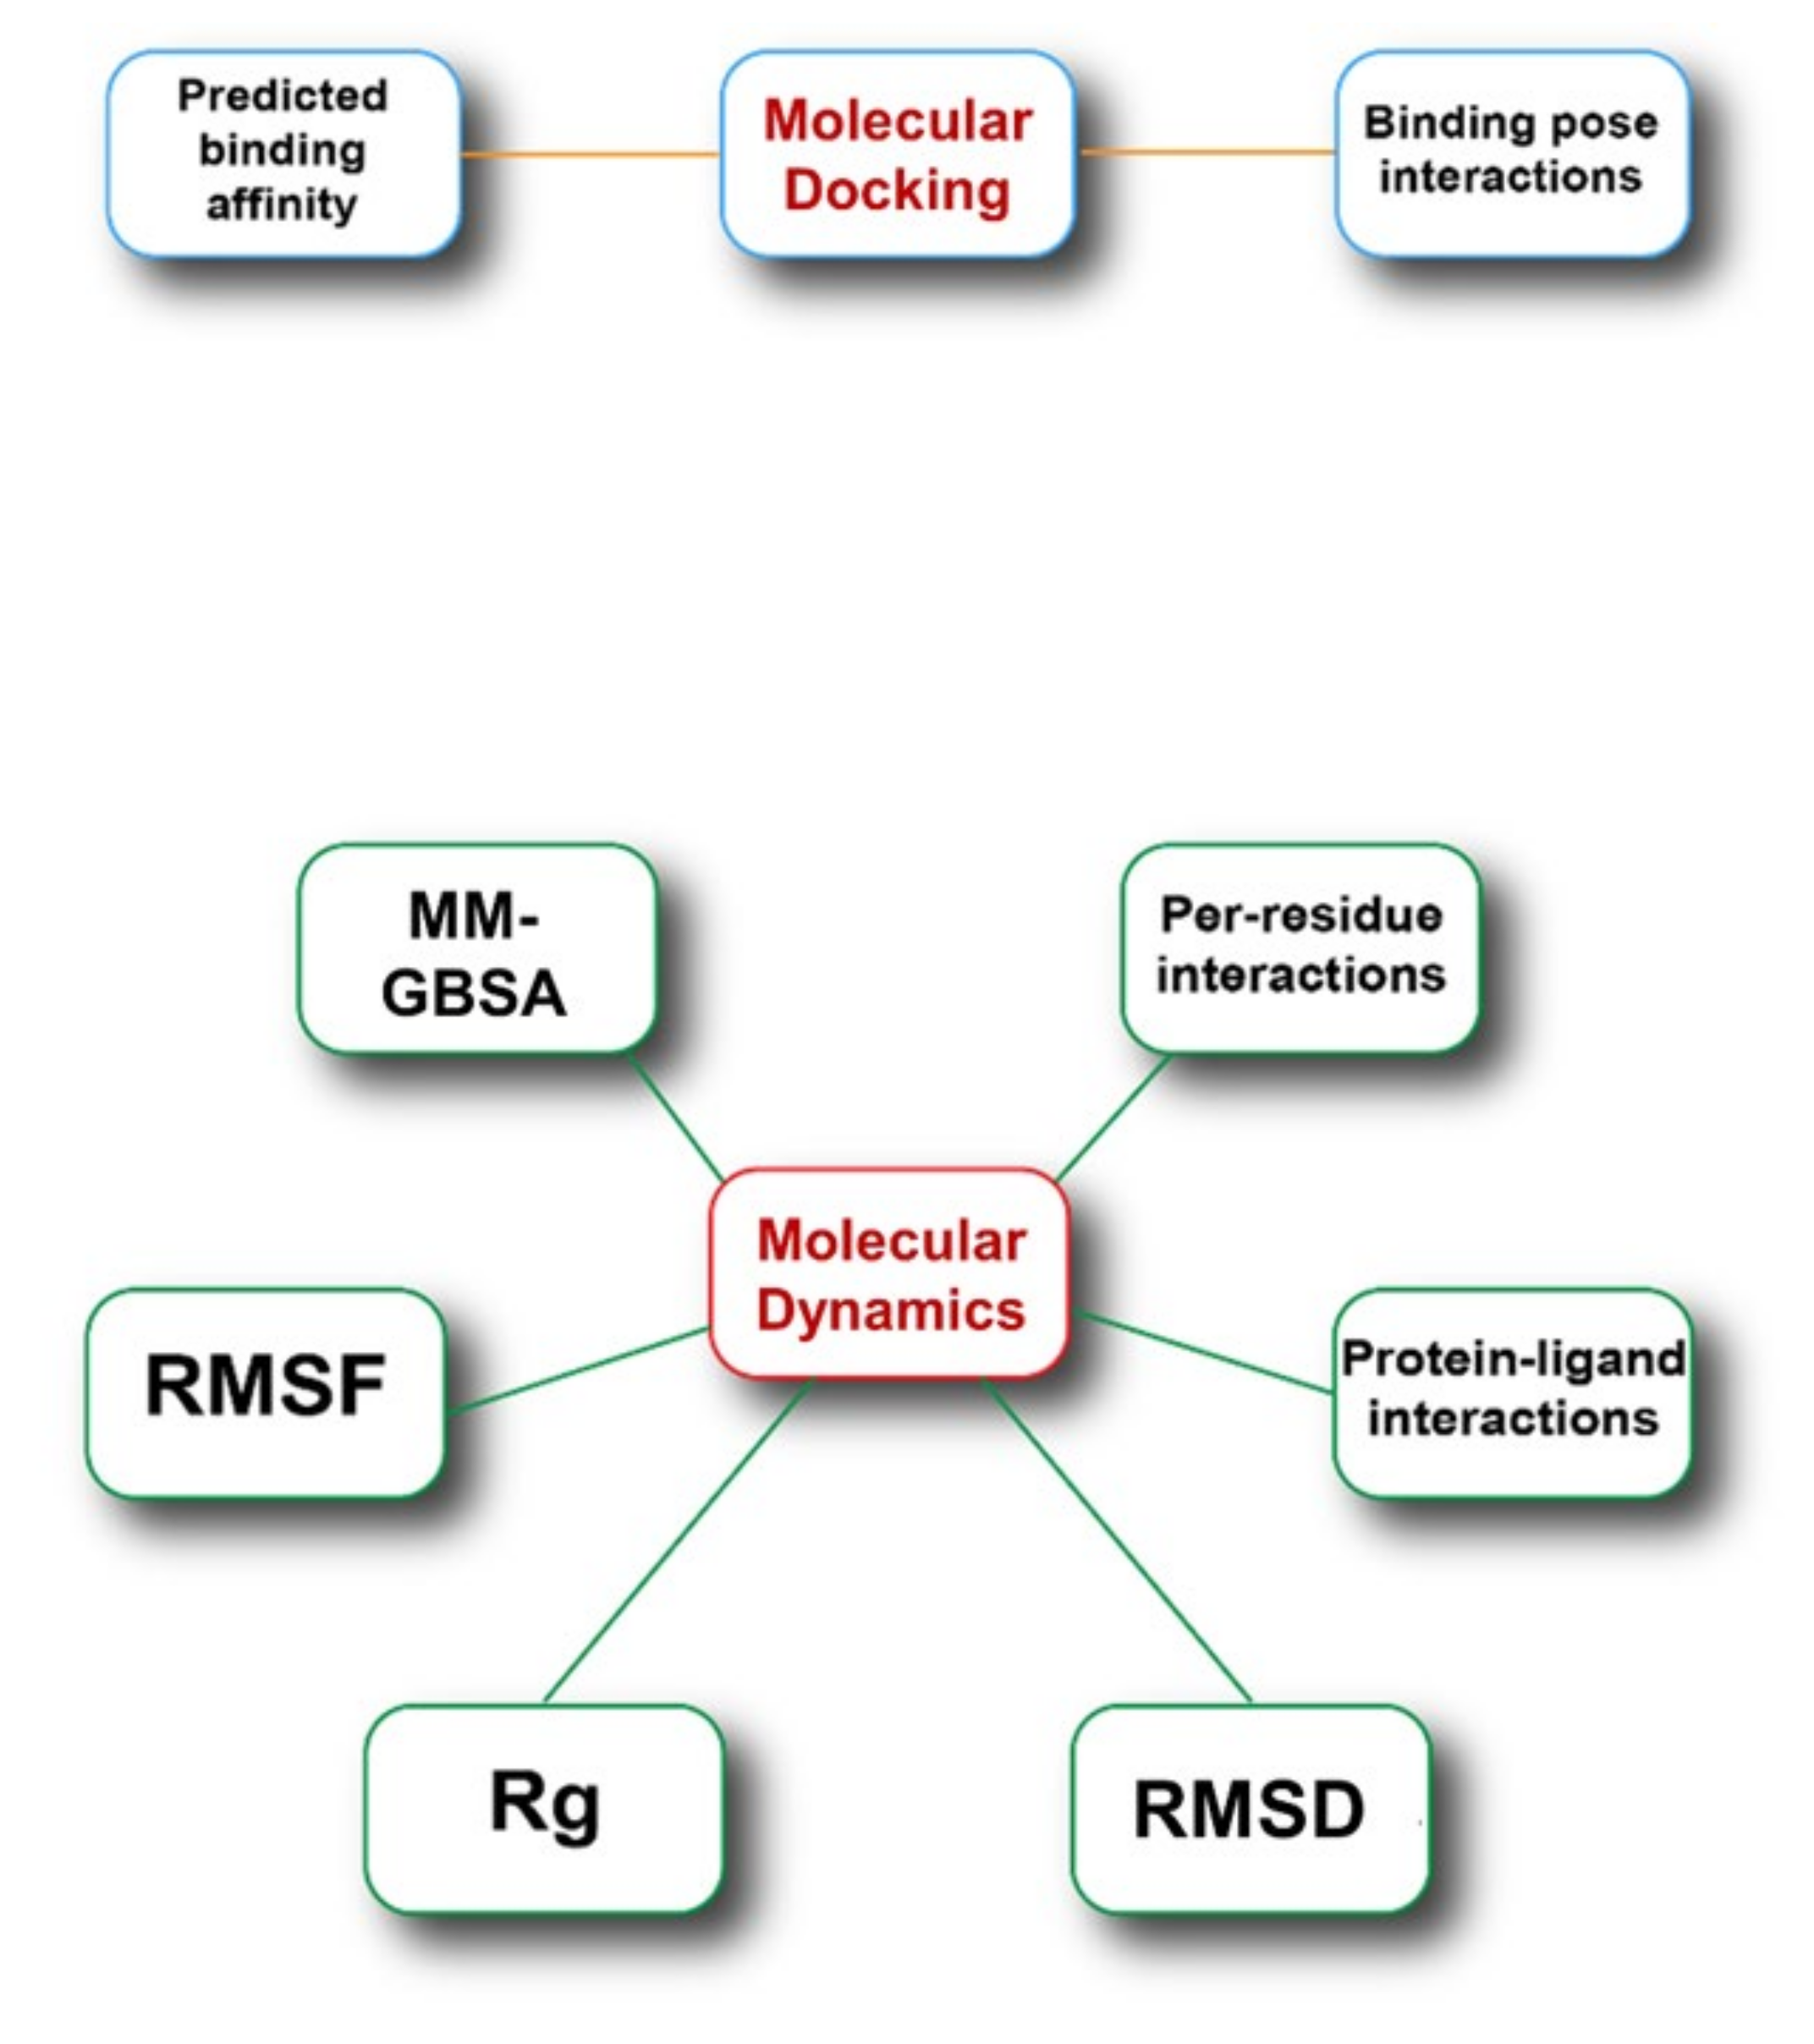
2.1. Molecular Redocking Experiments and Binding Free Energy (MM-GBSA)
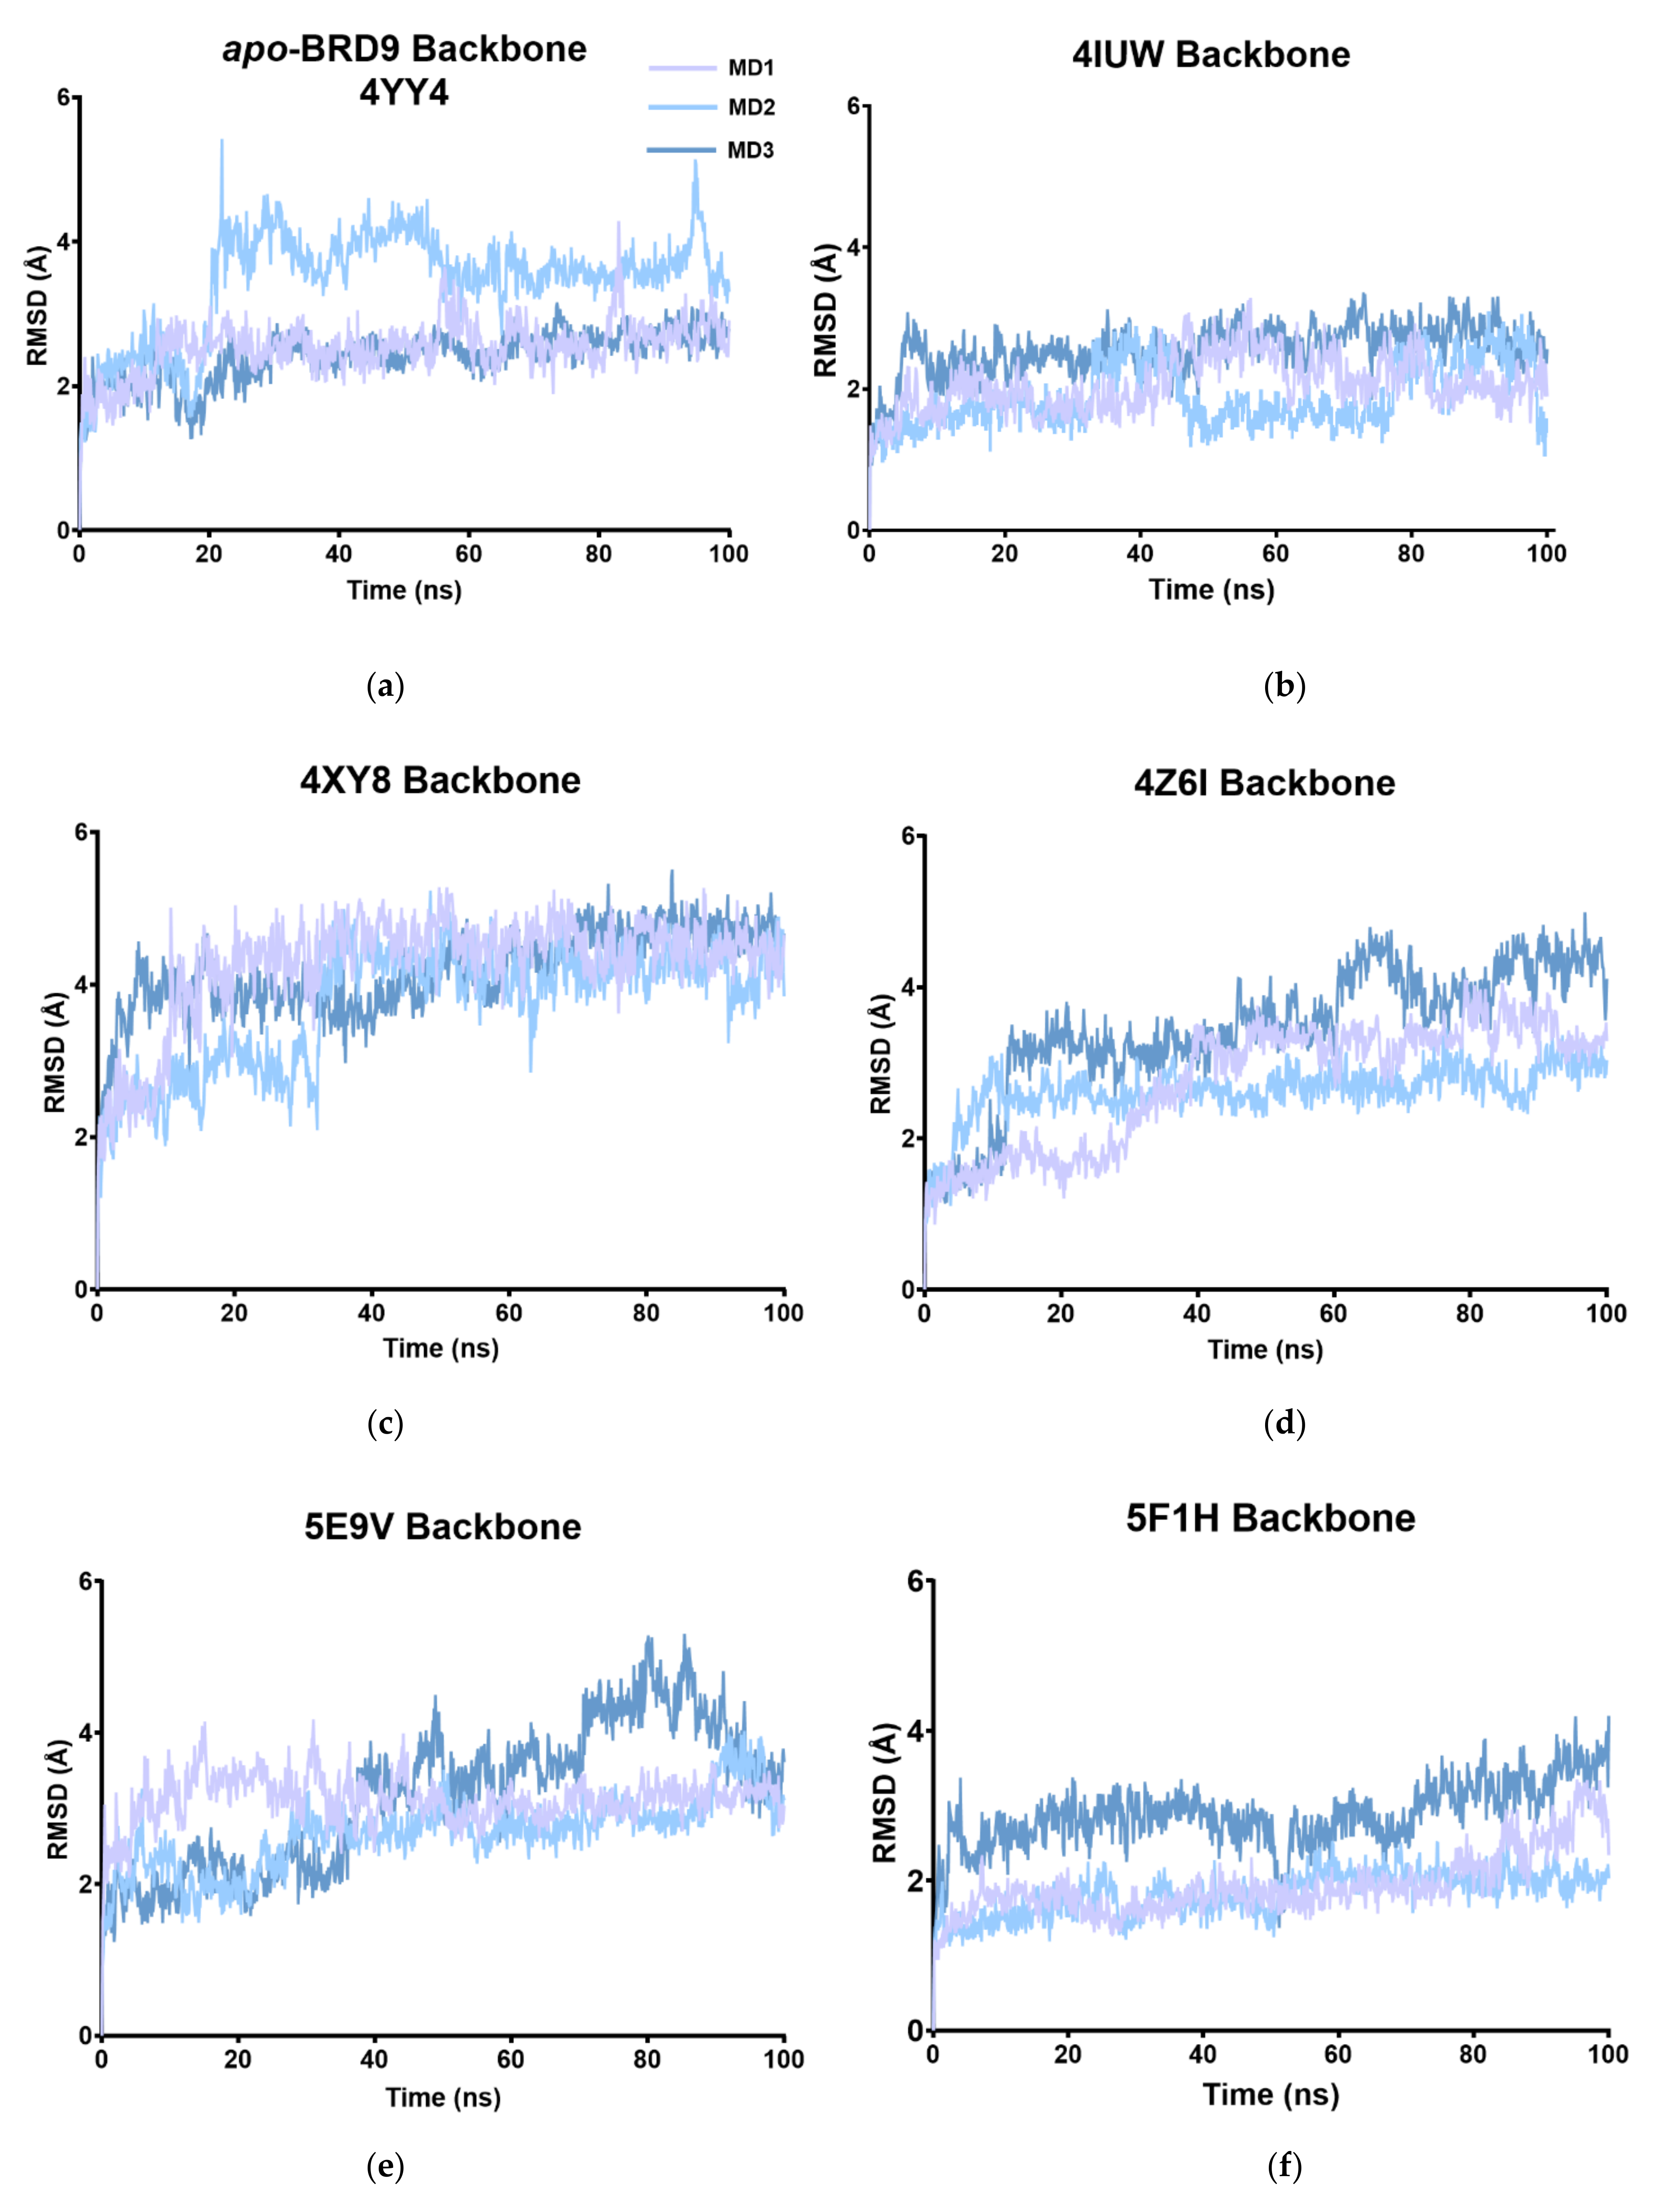
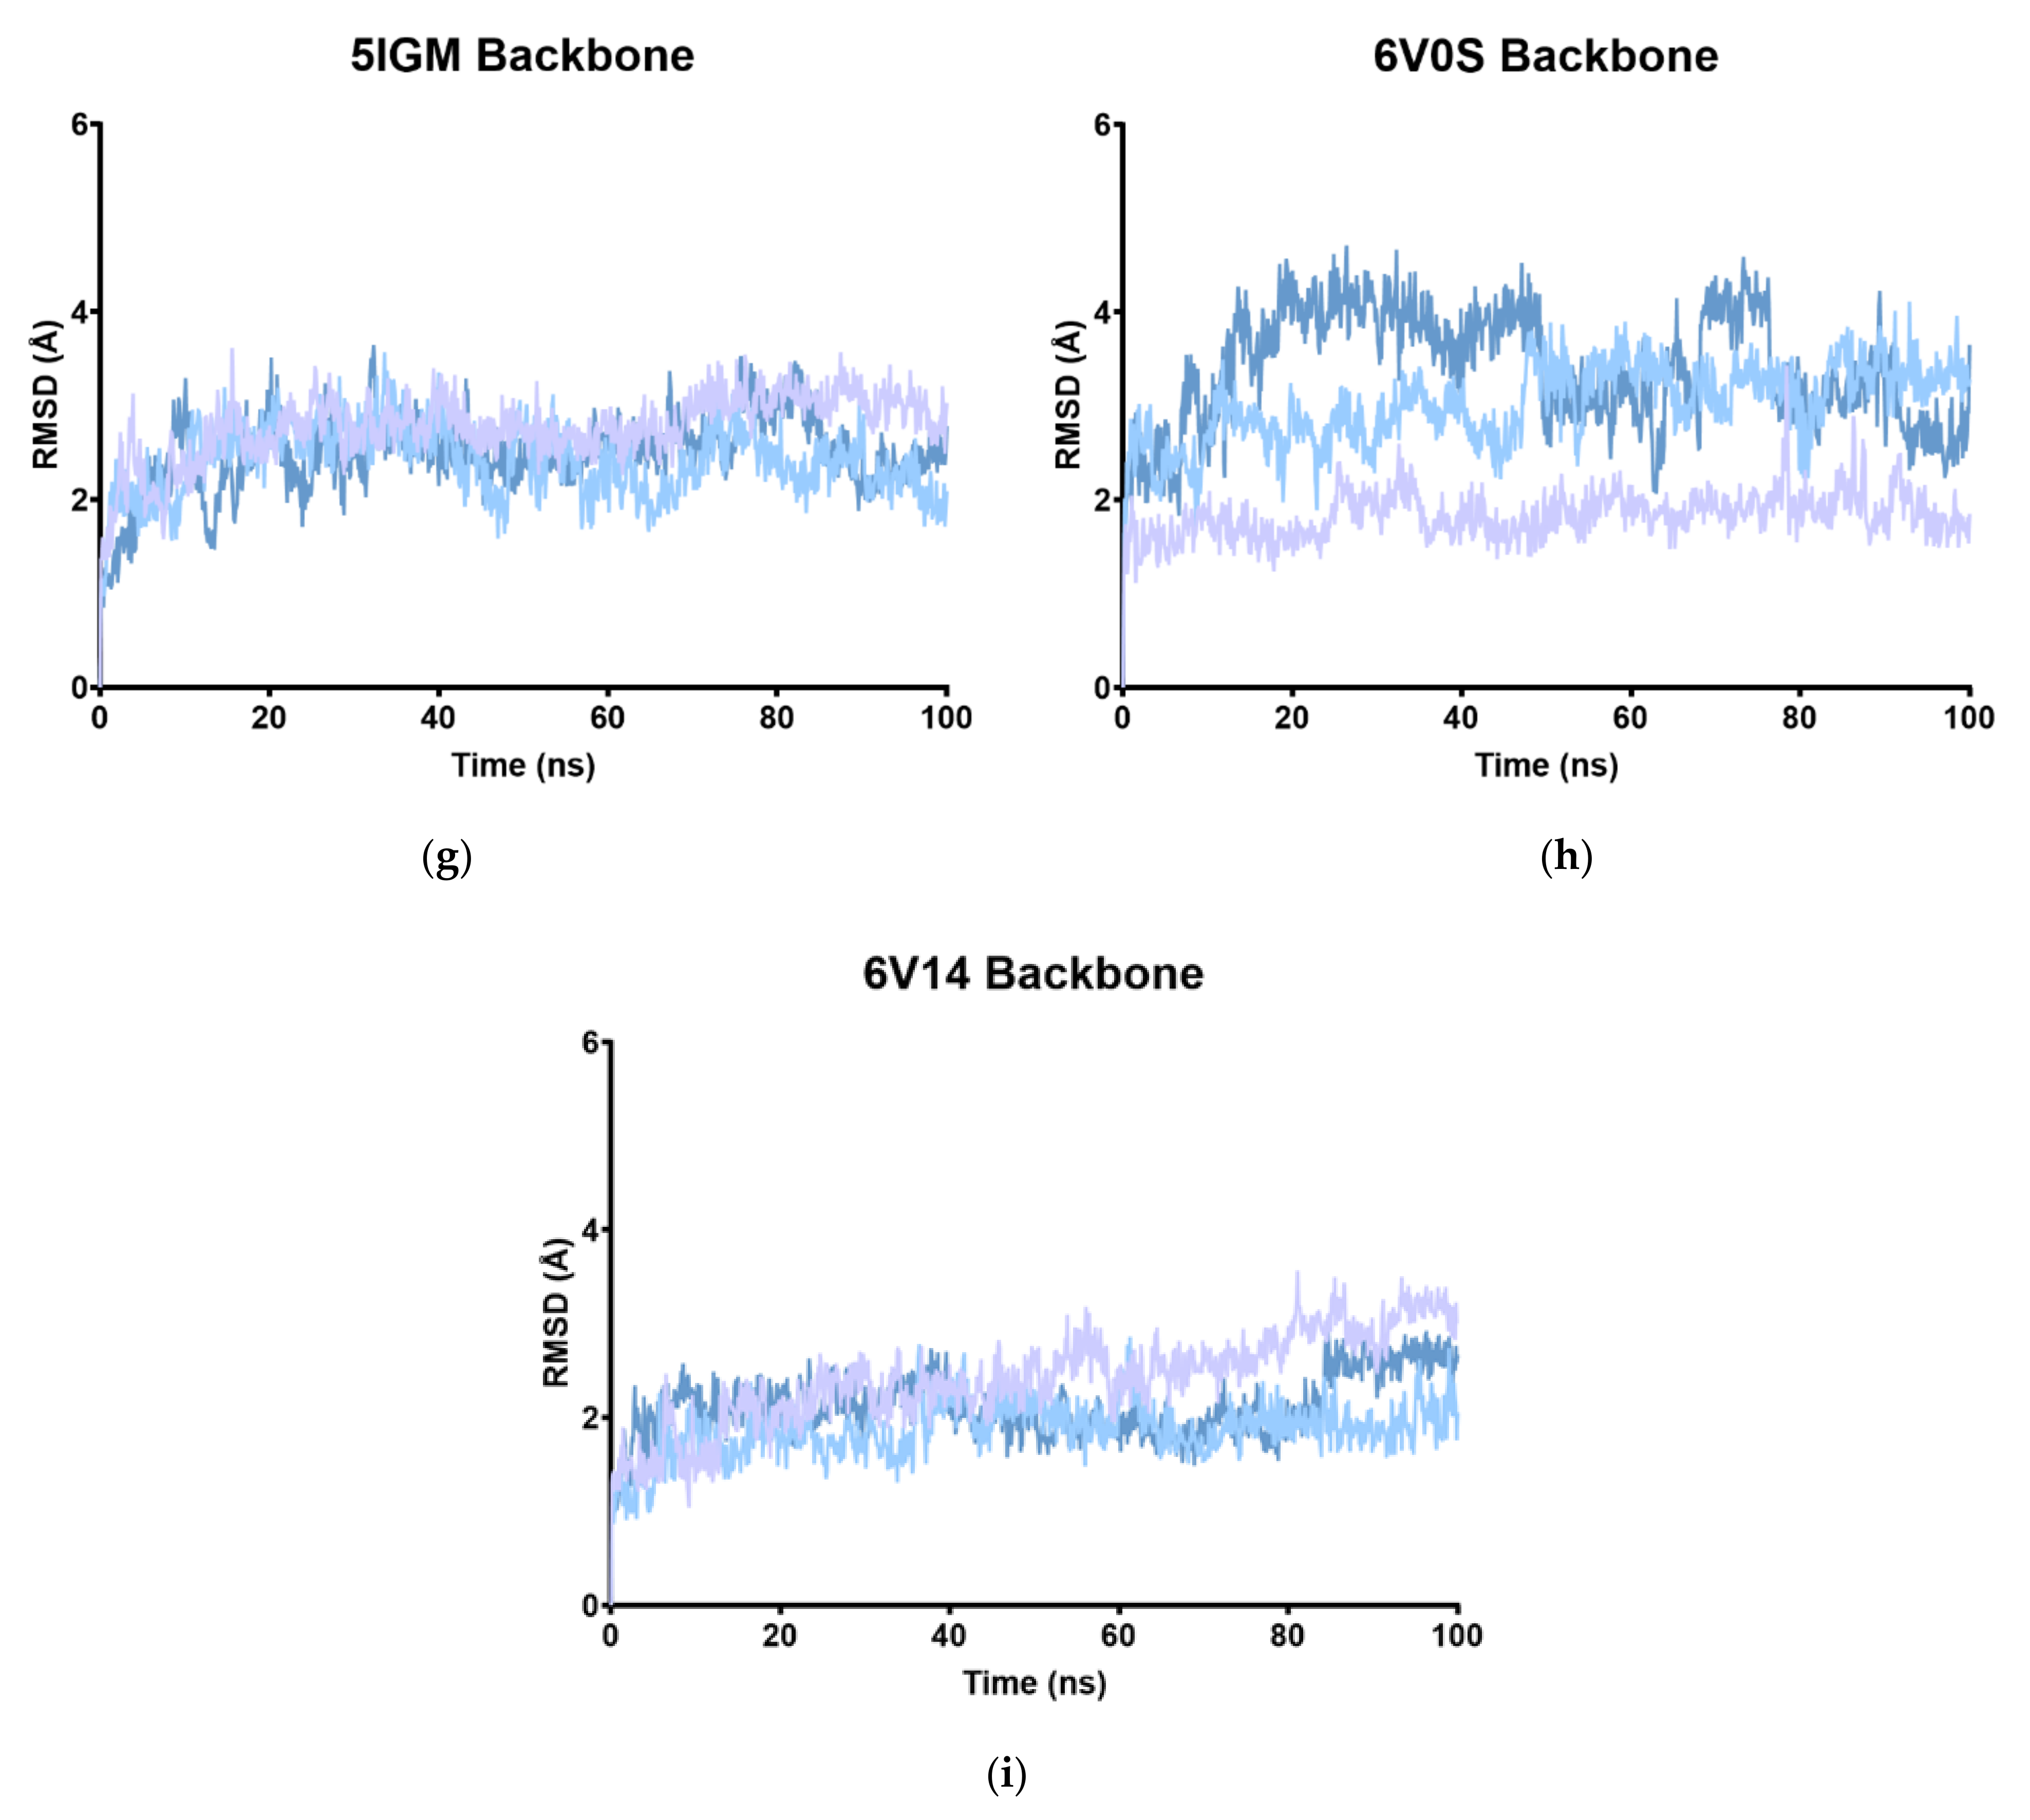
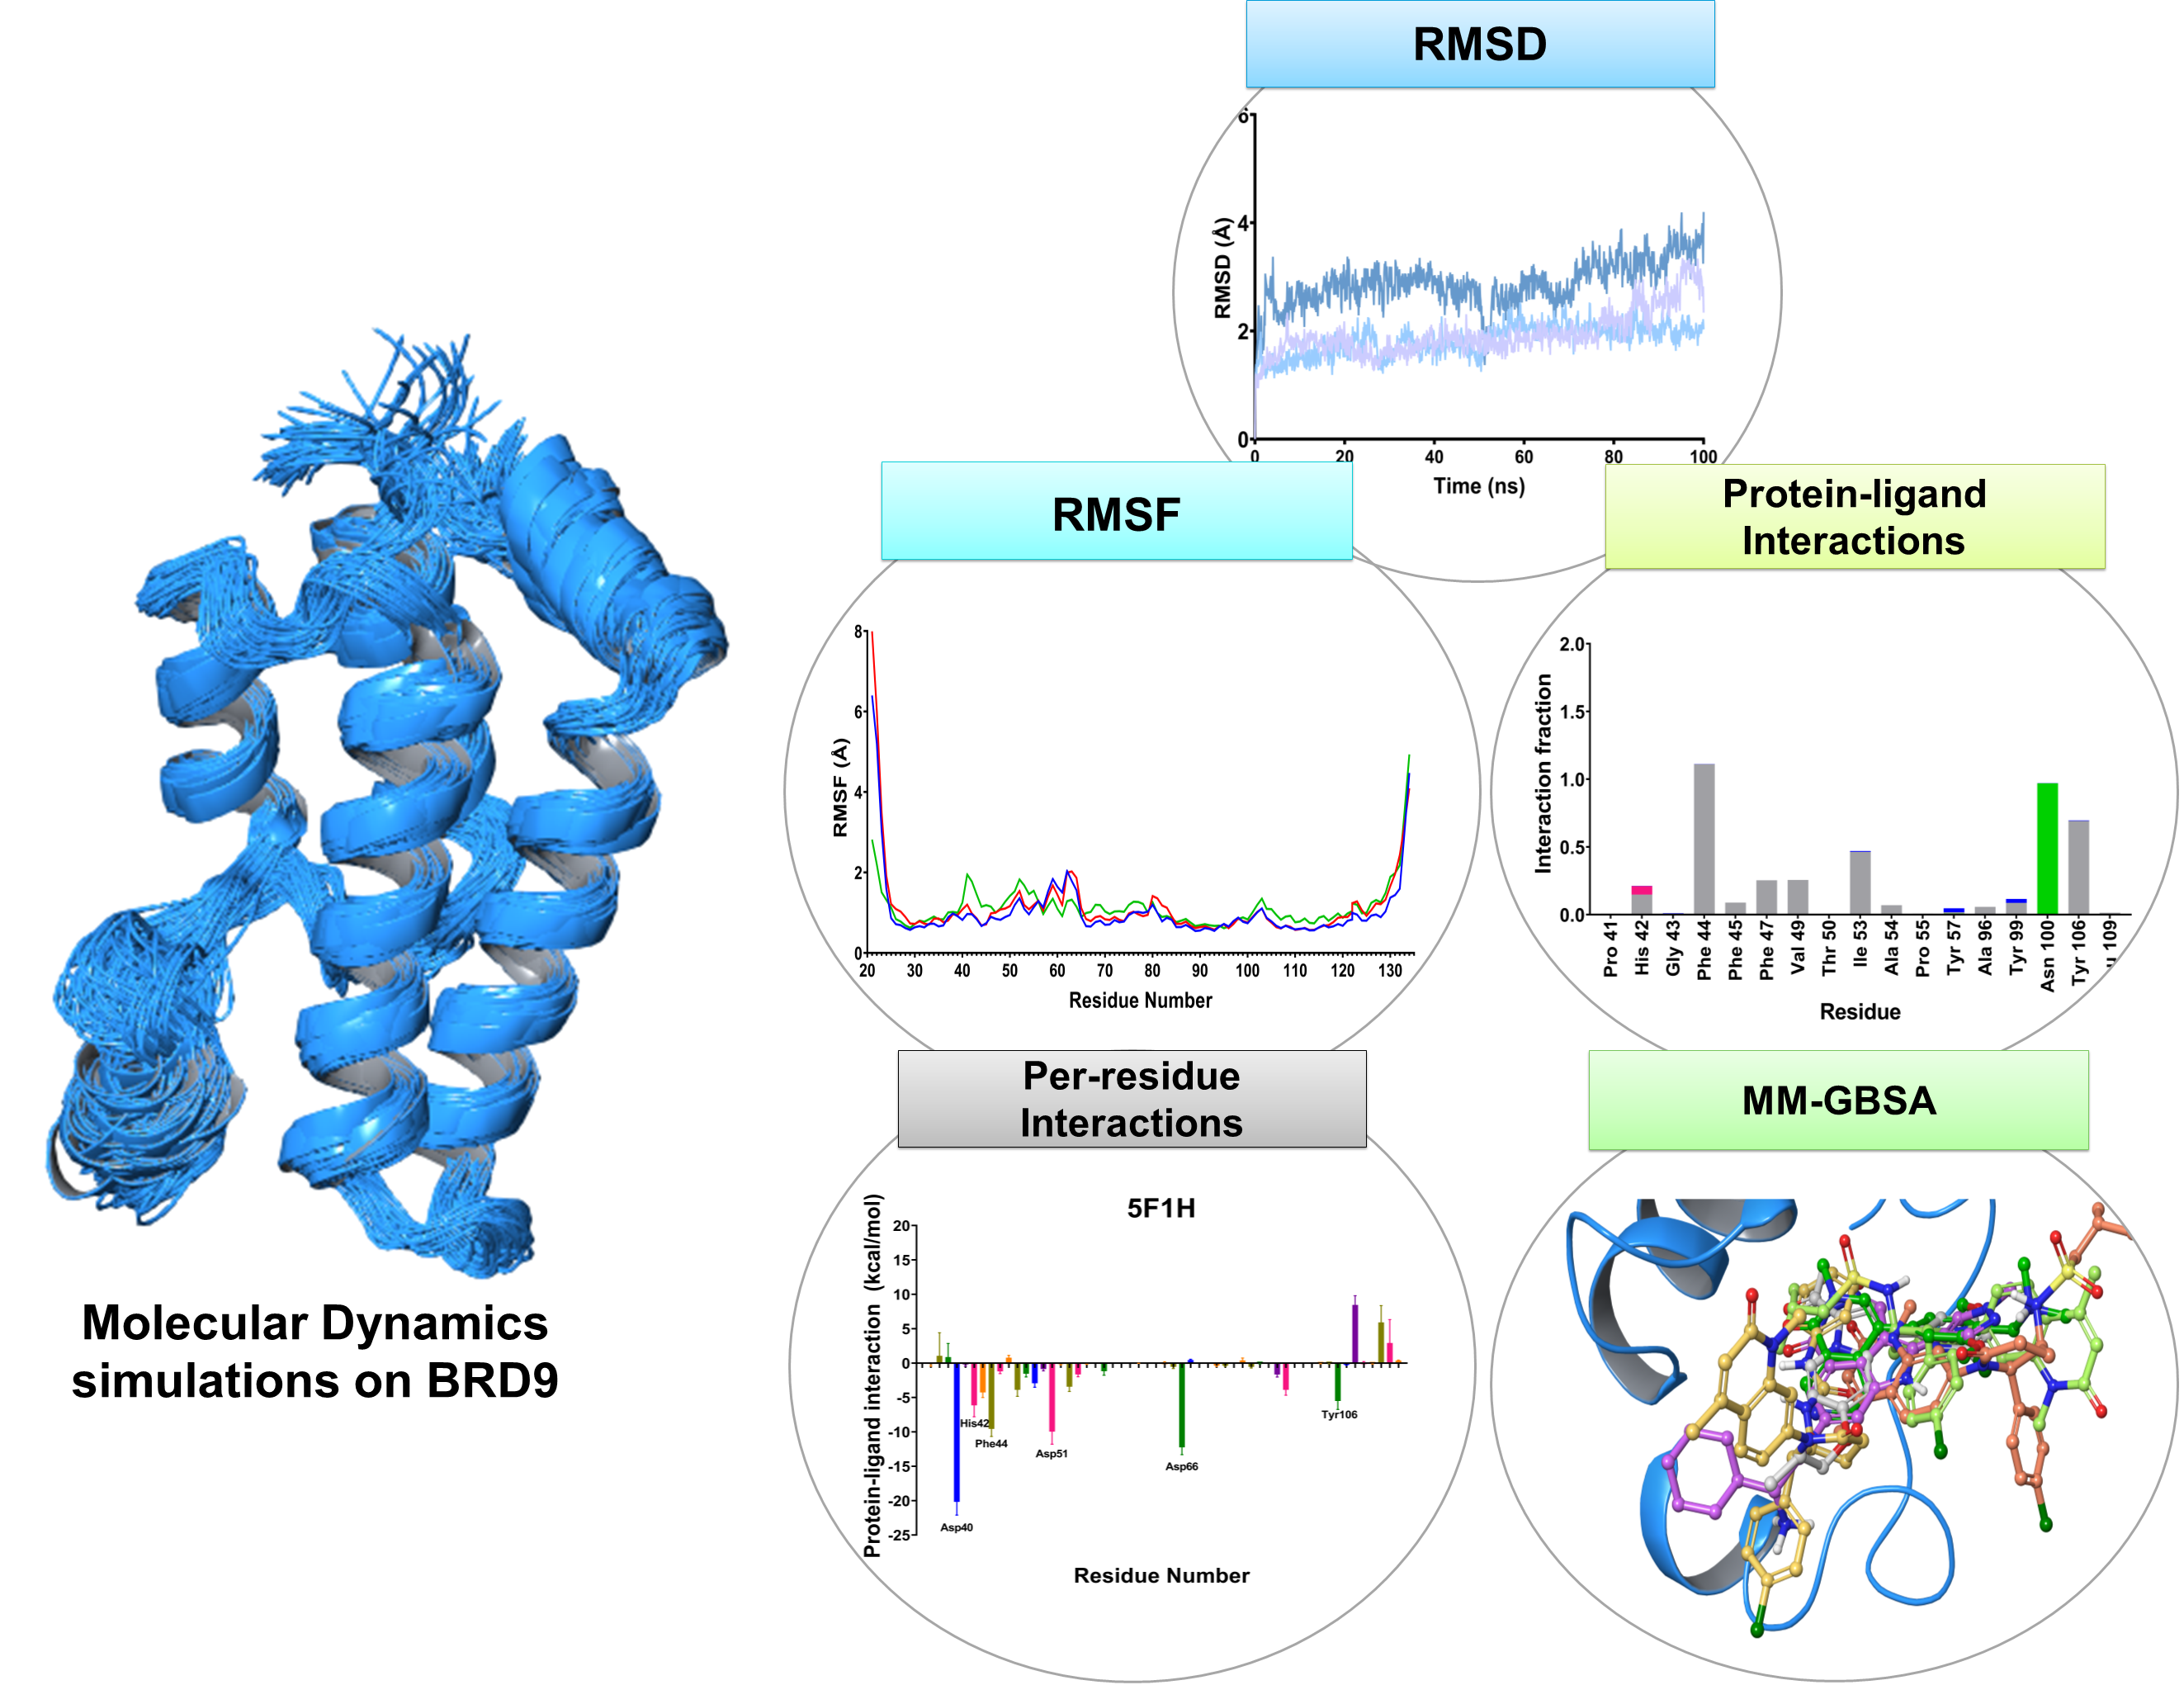
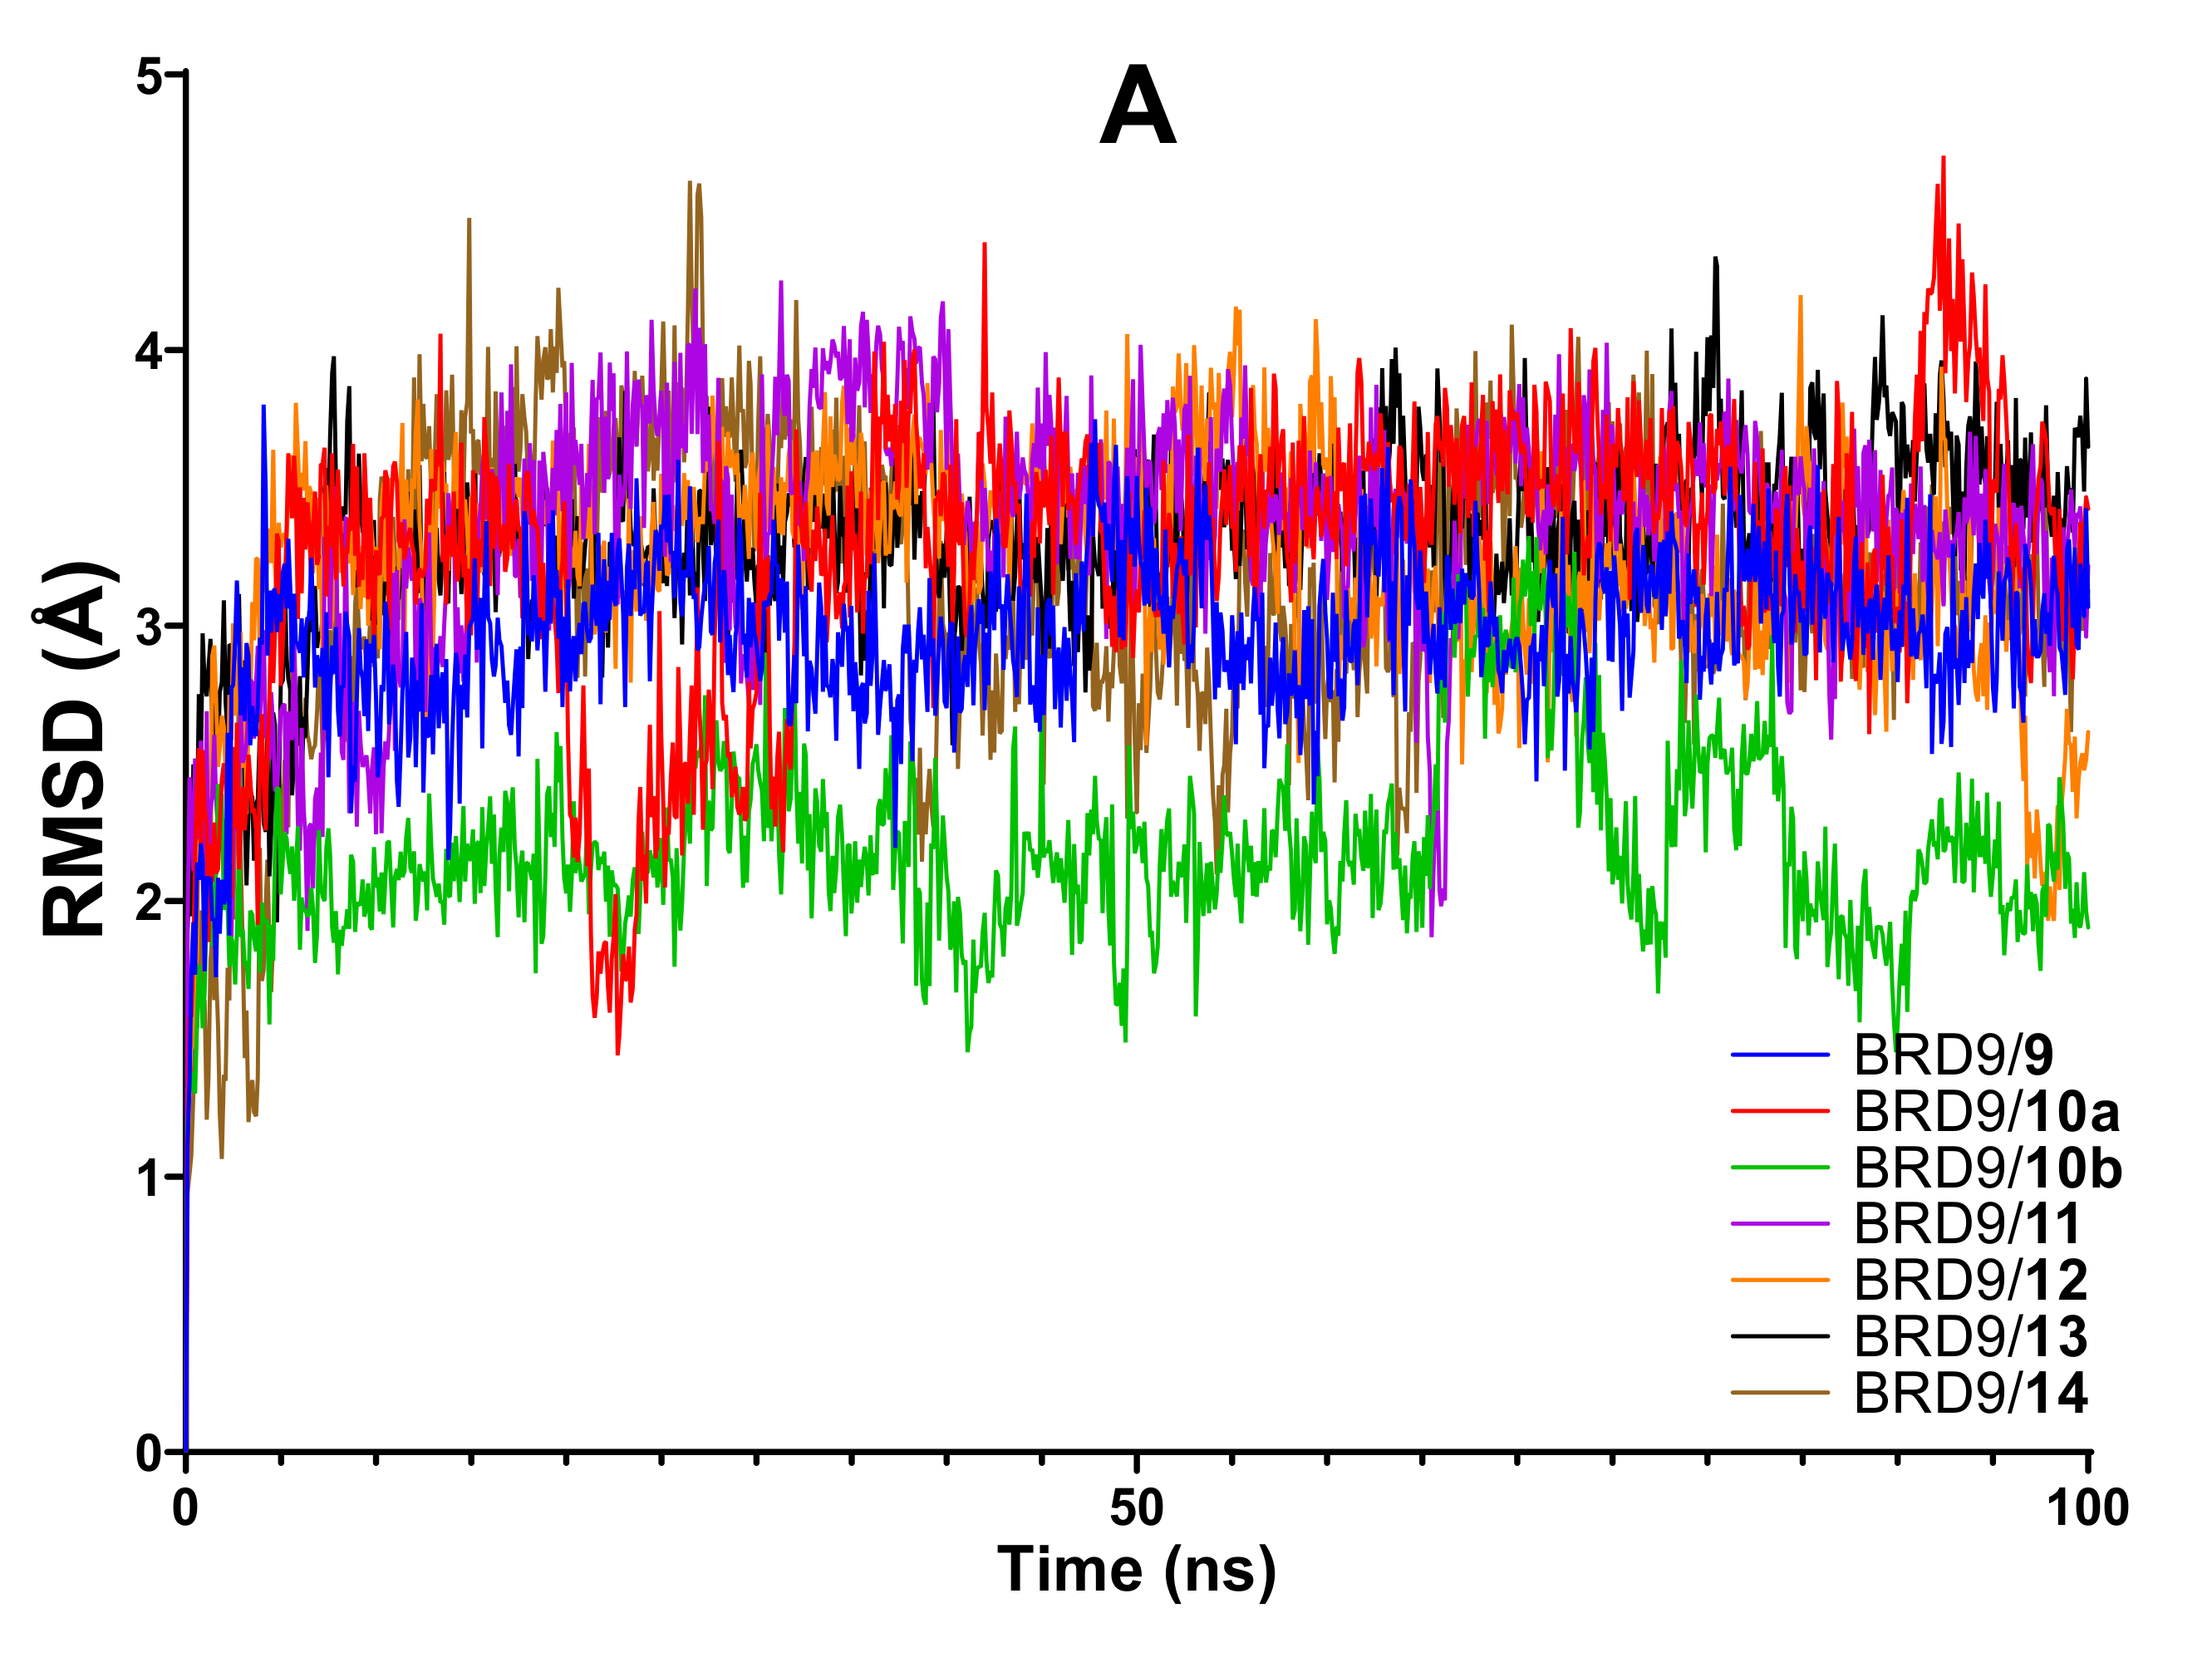
2.2. RMSD
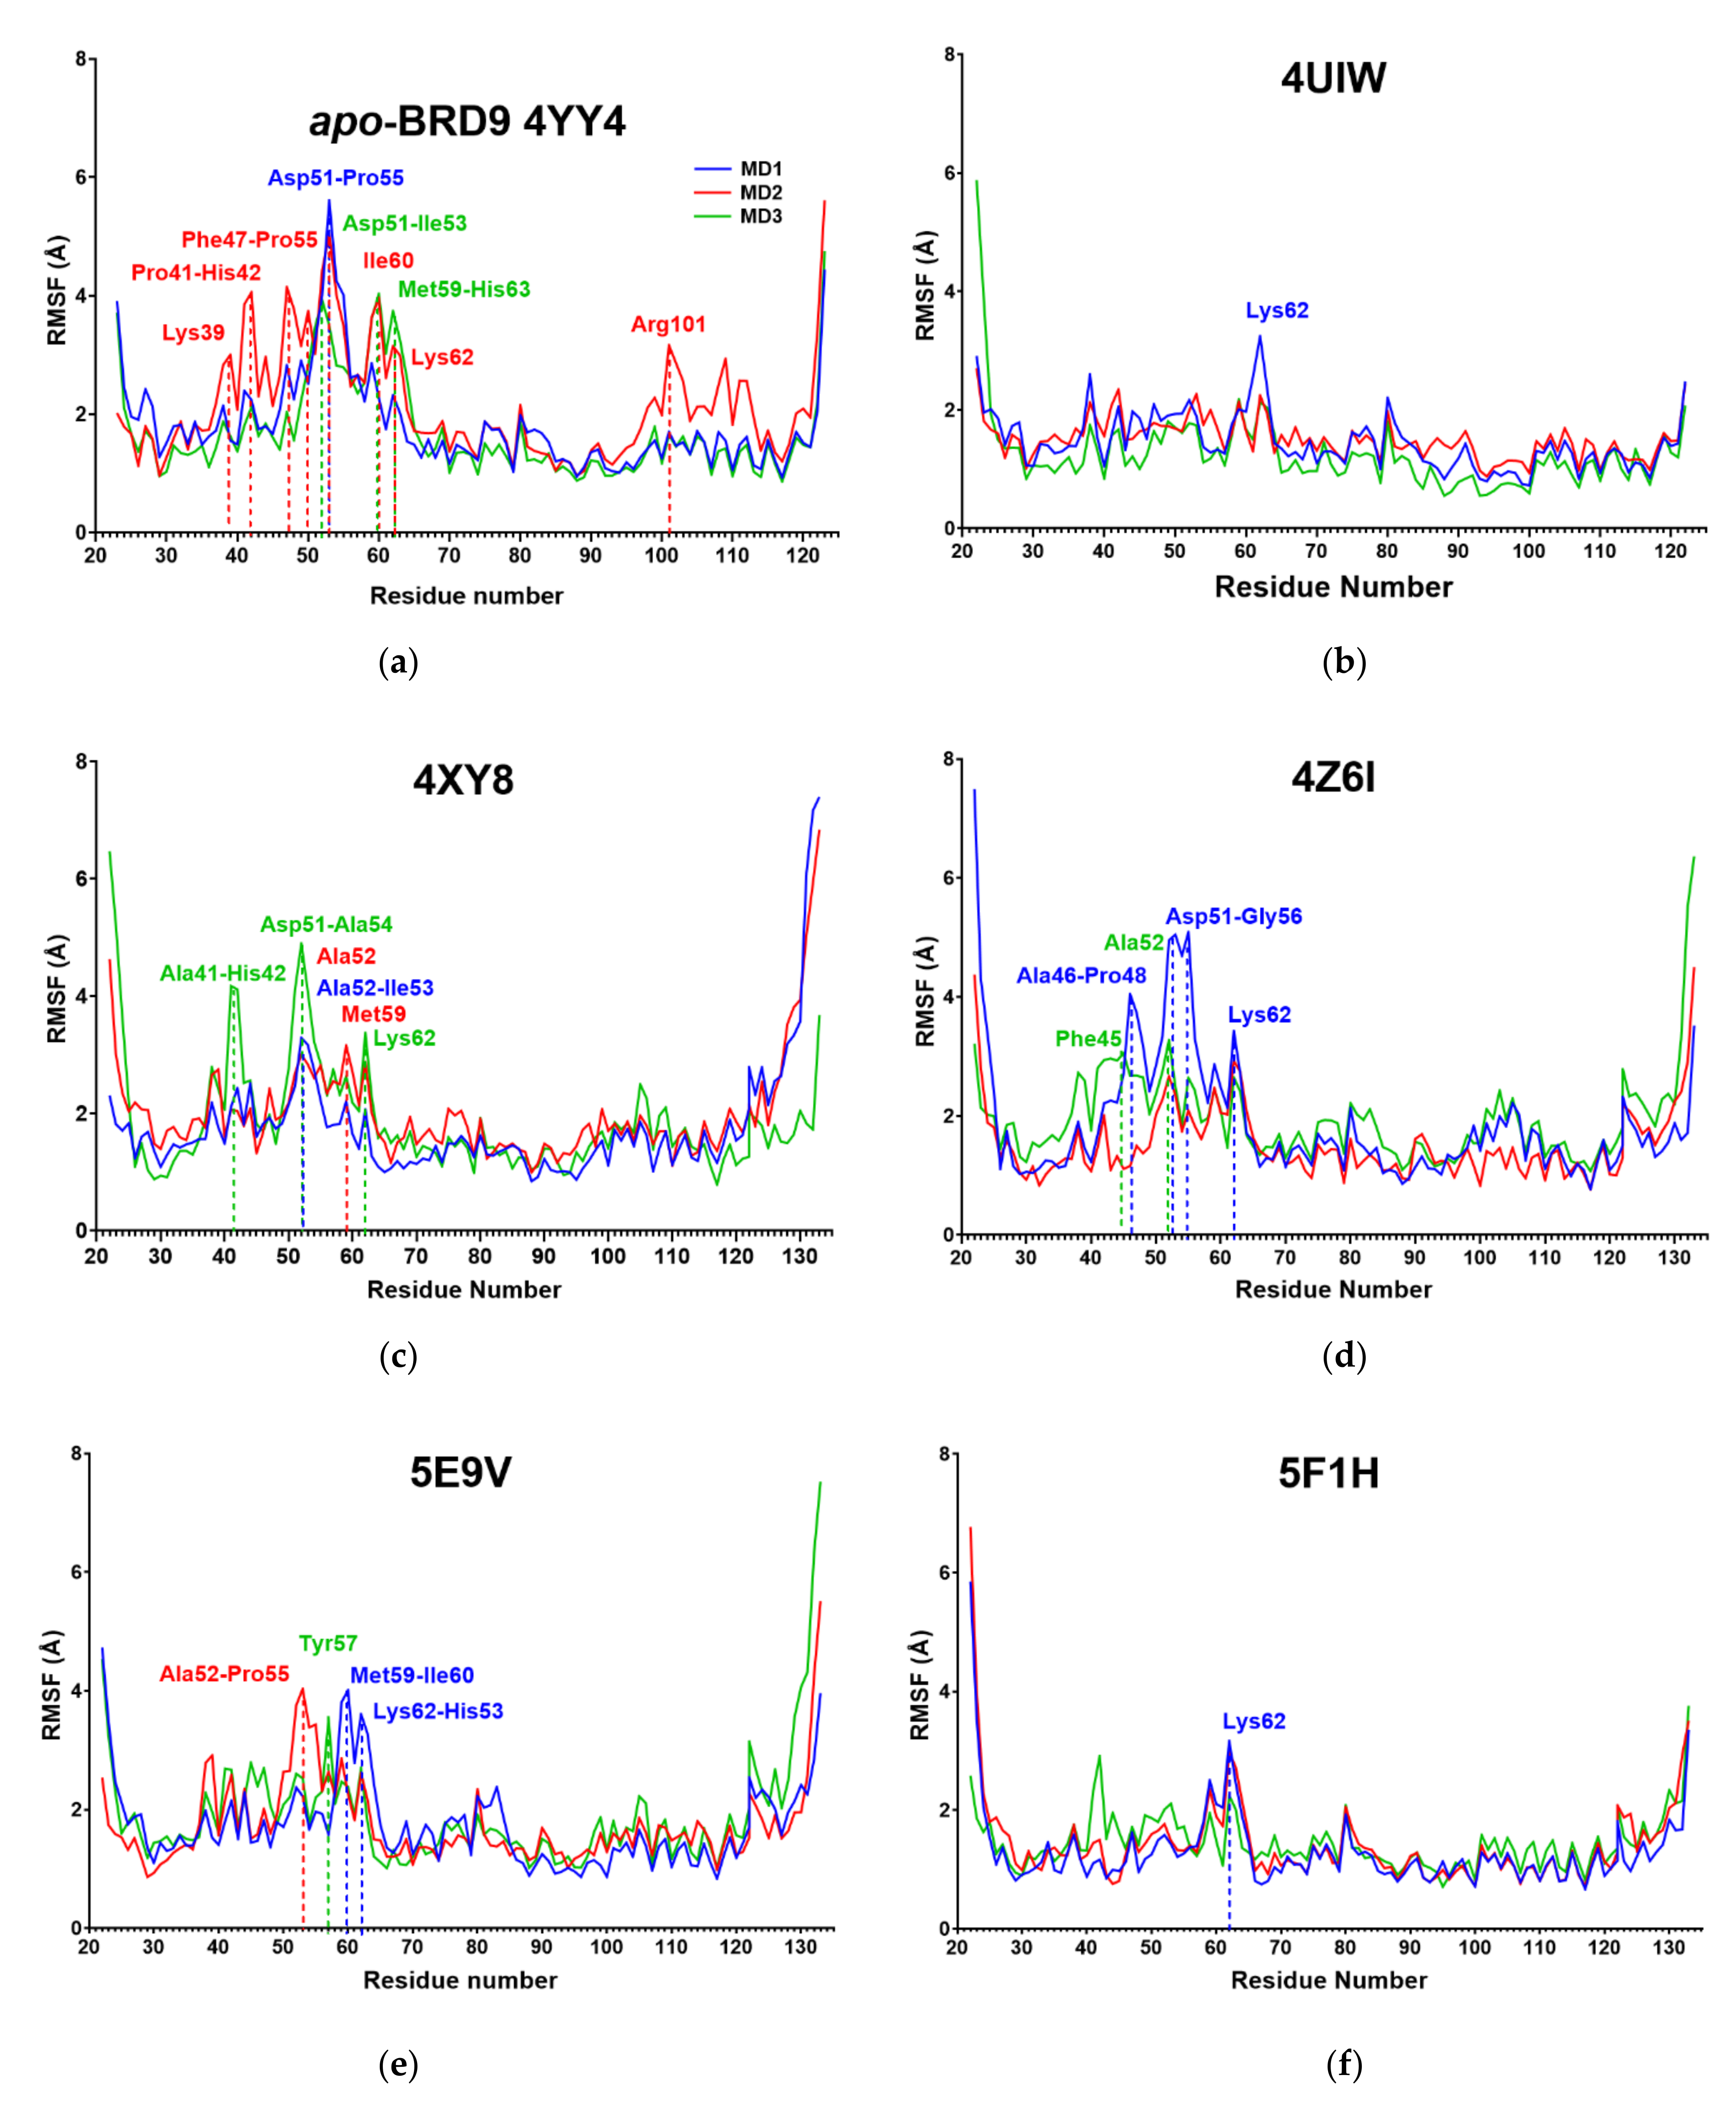
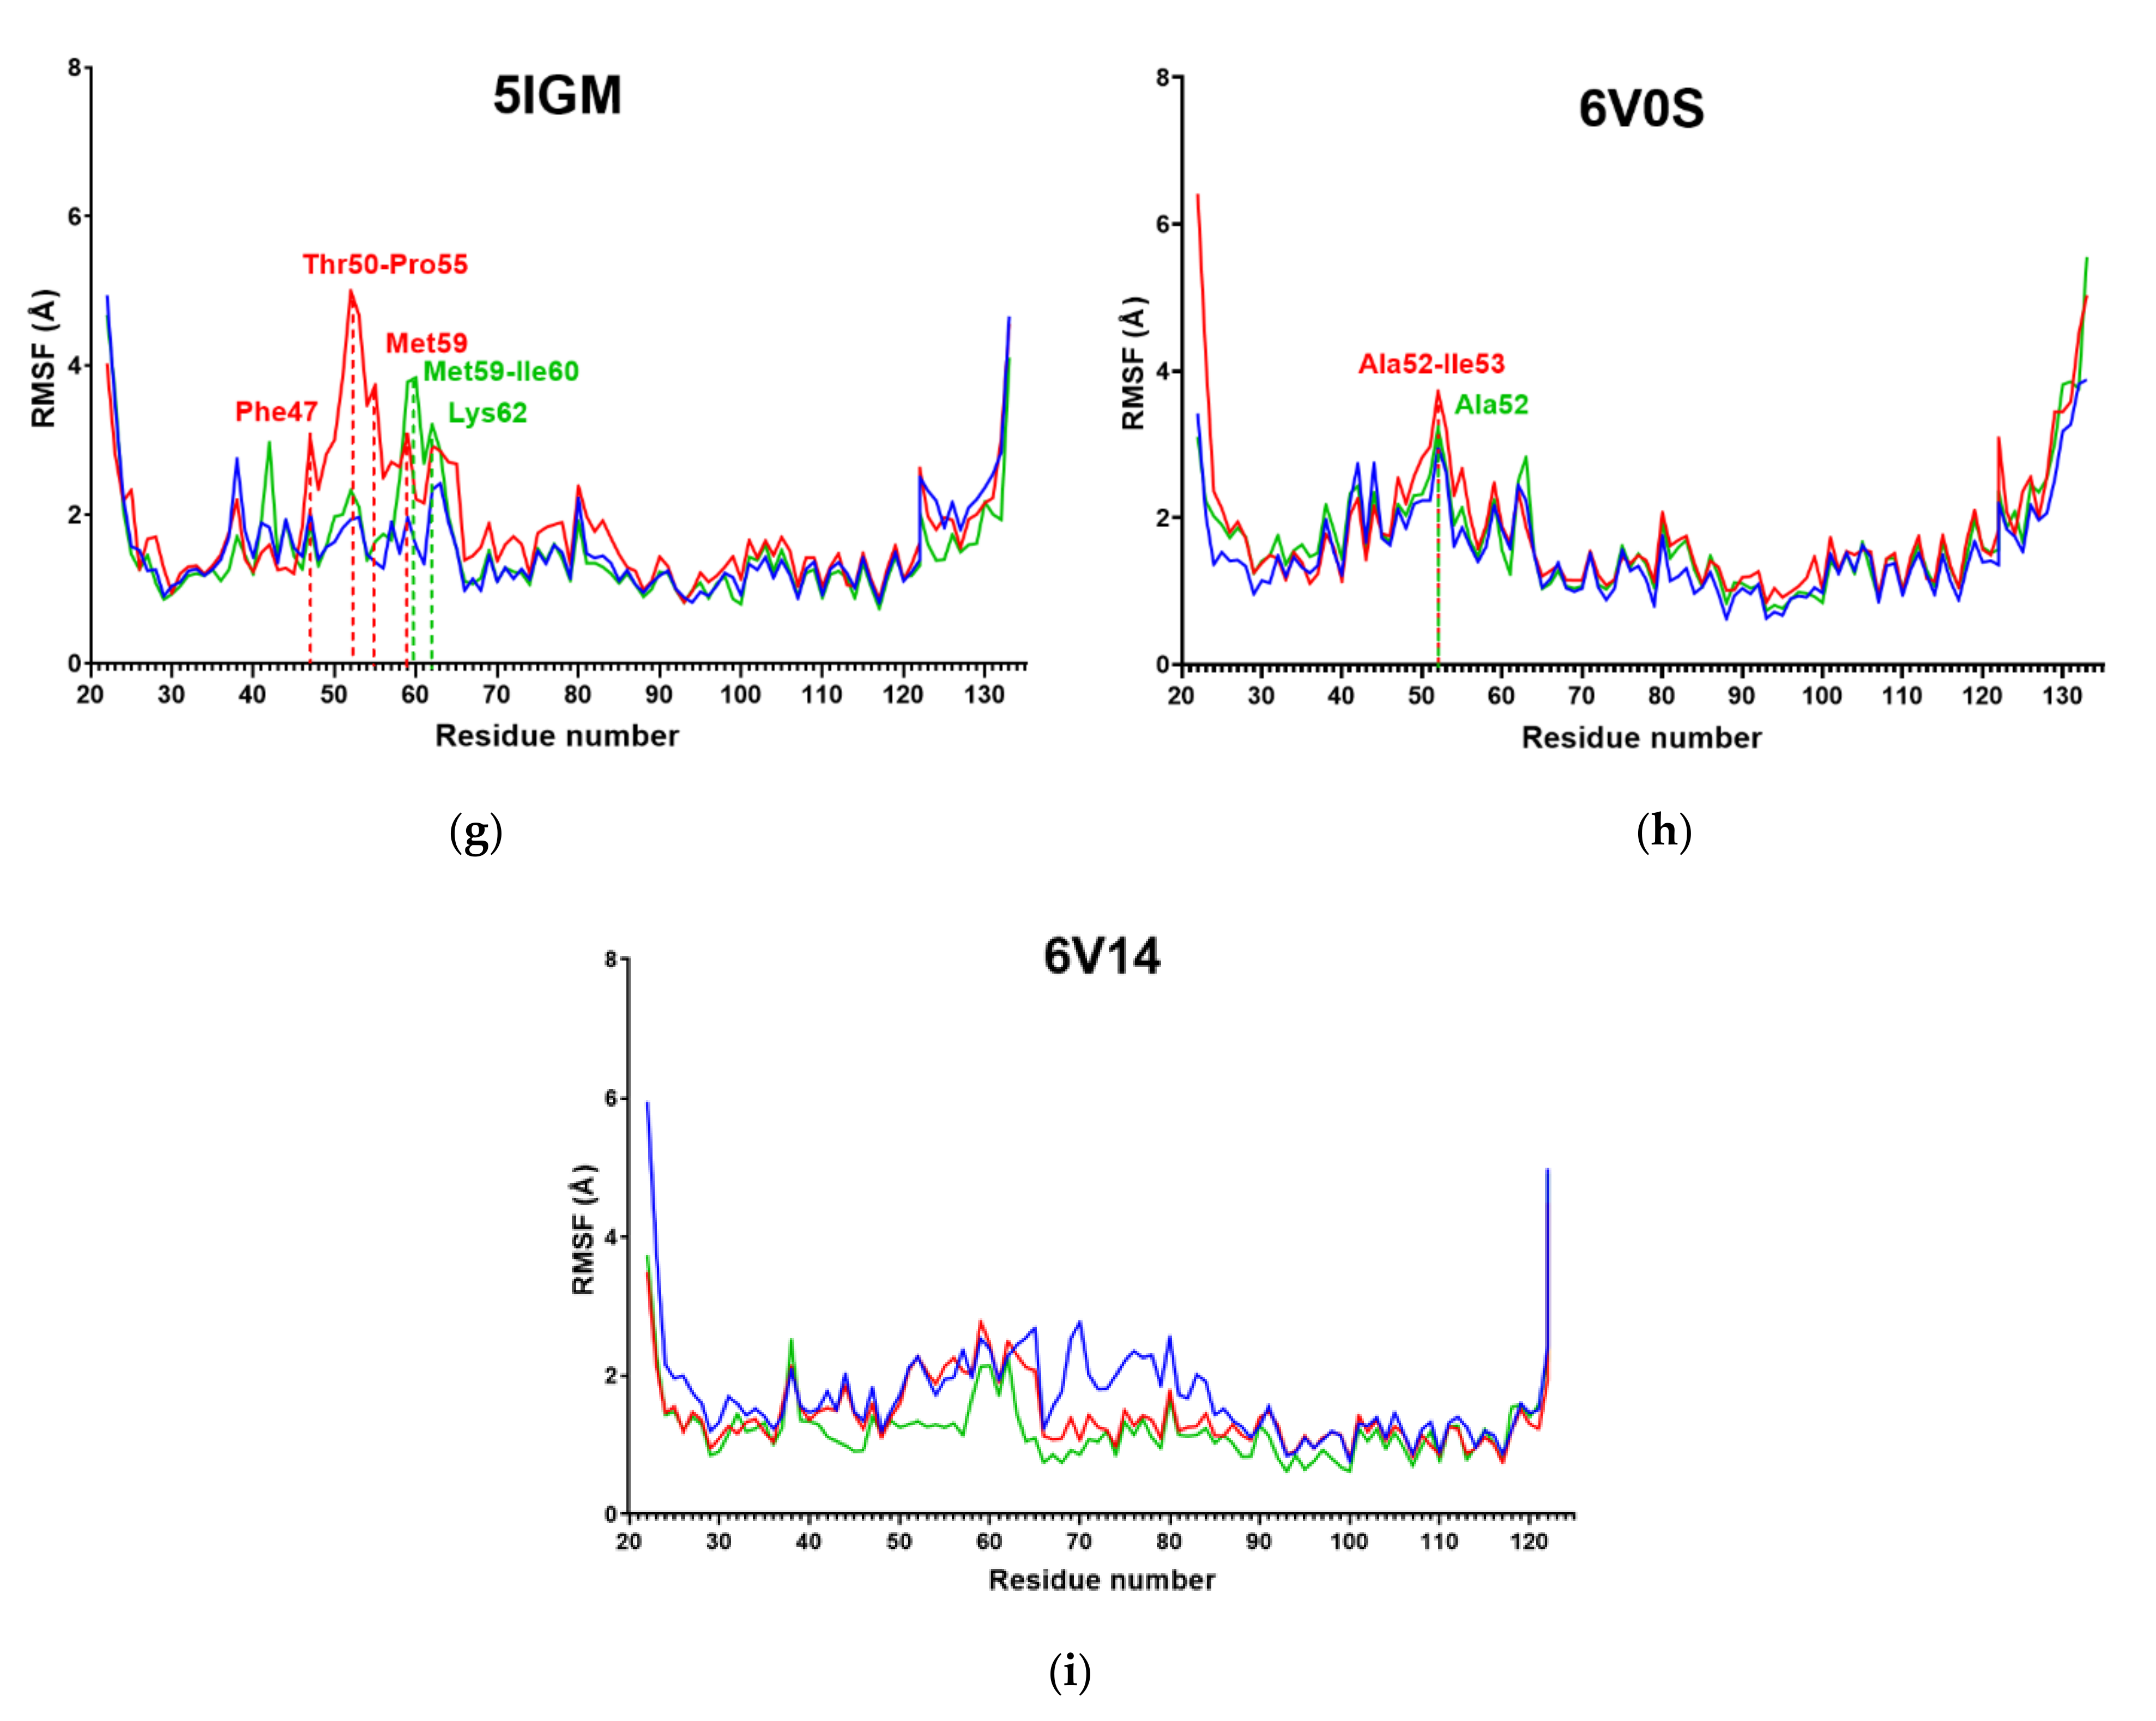
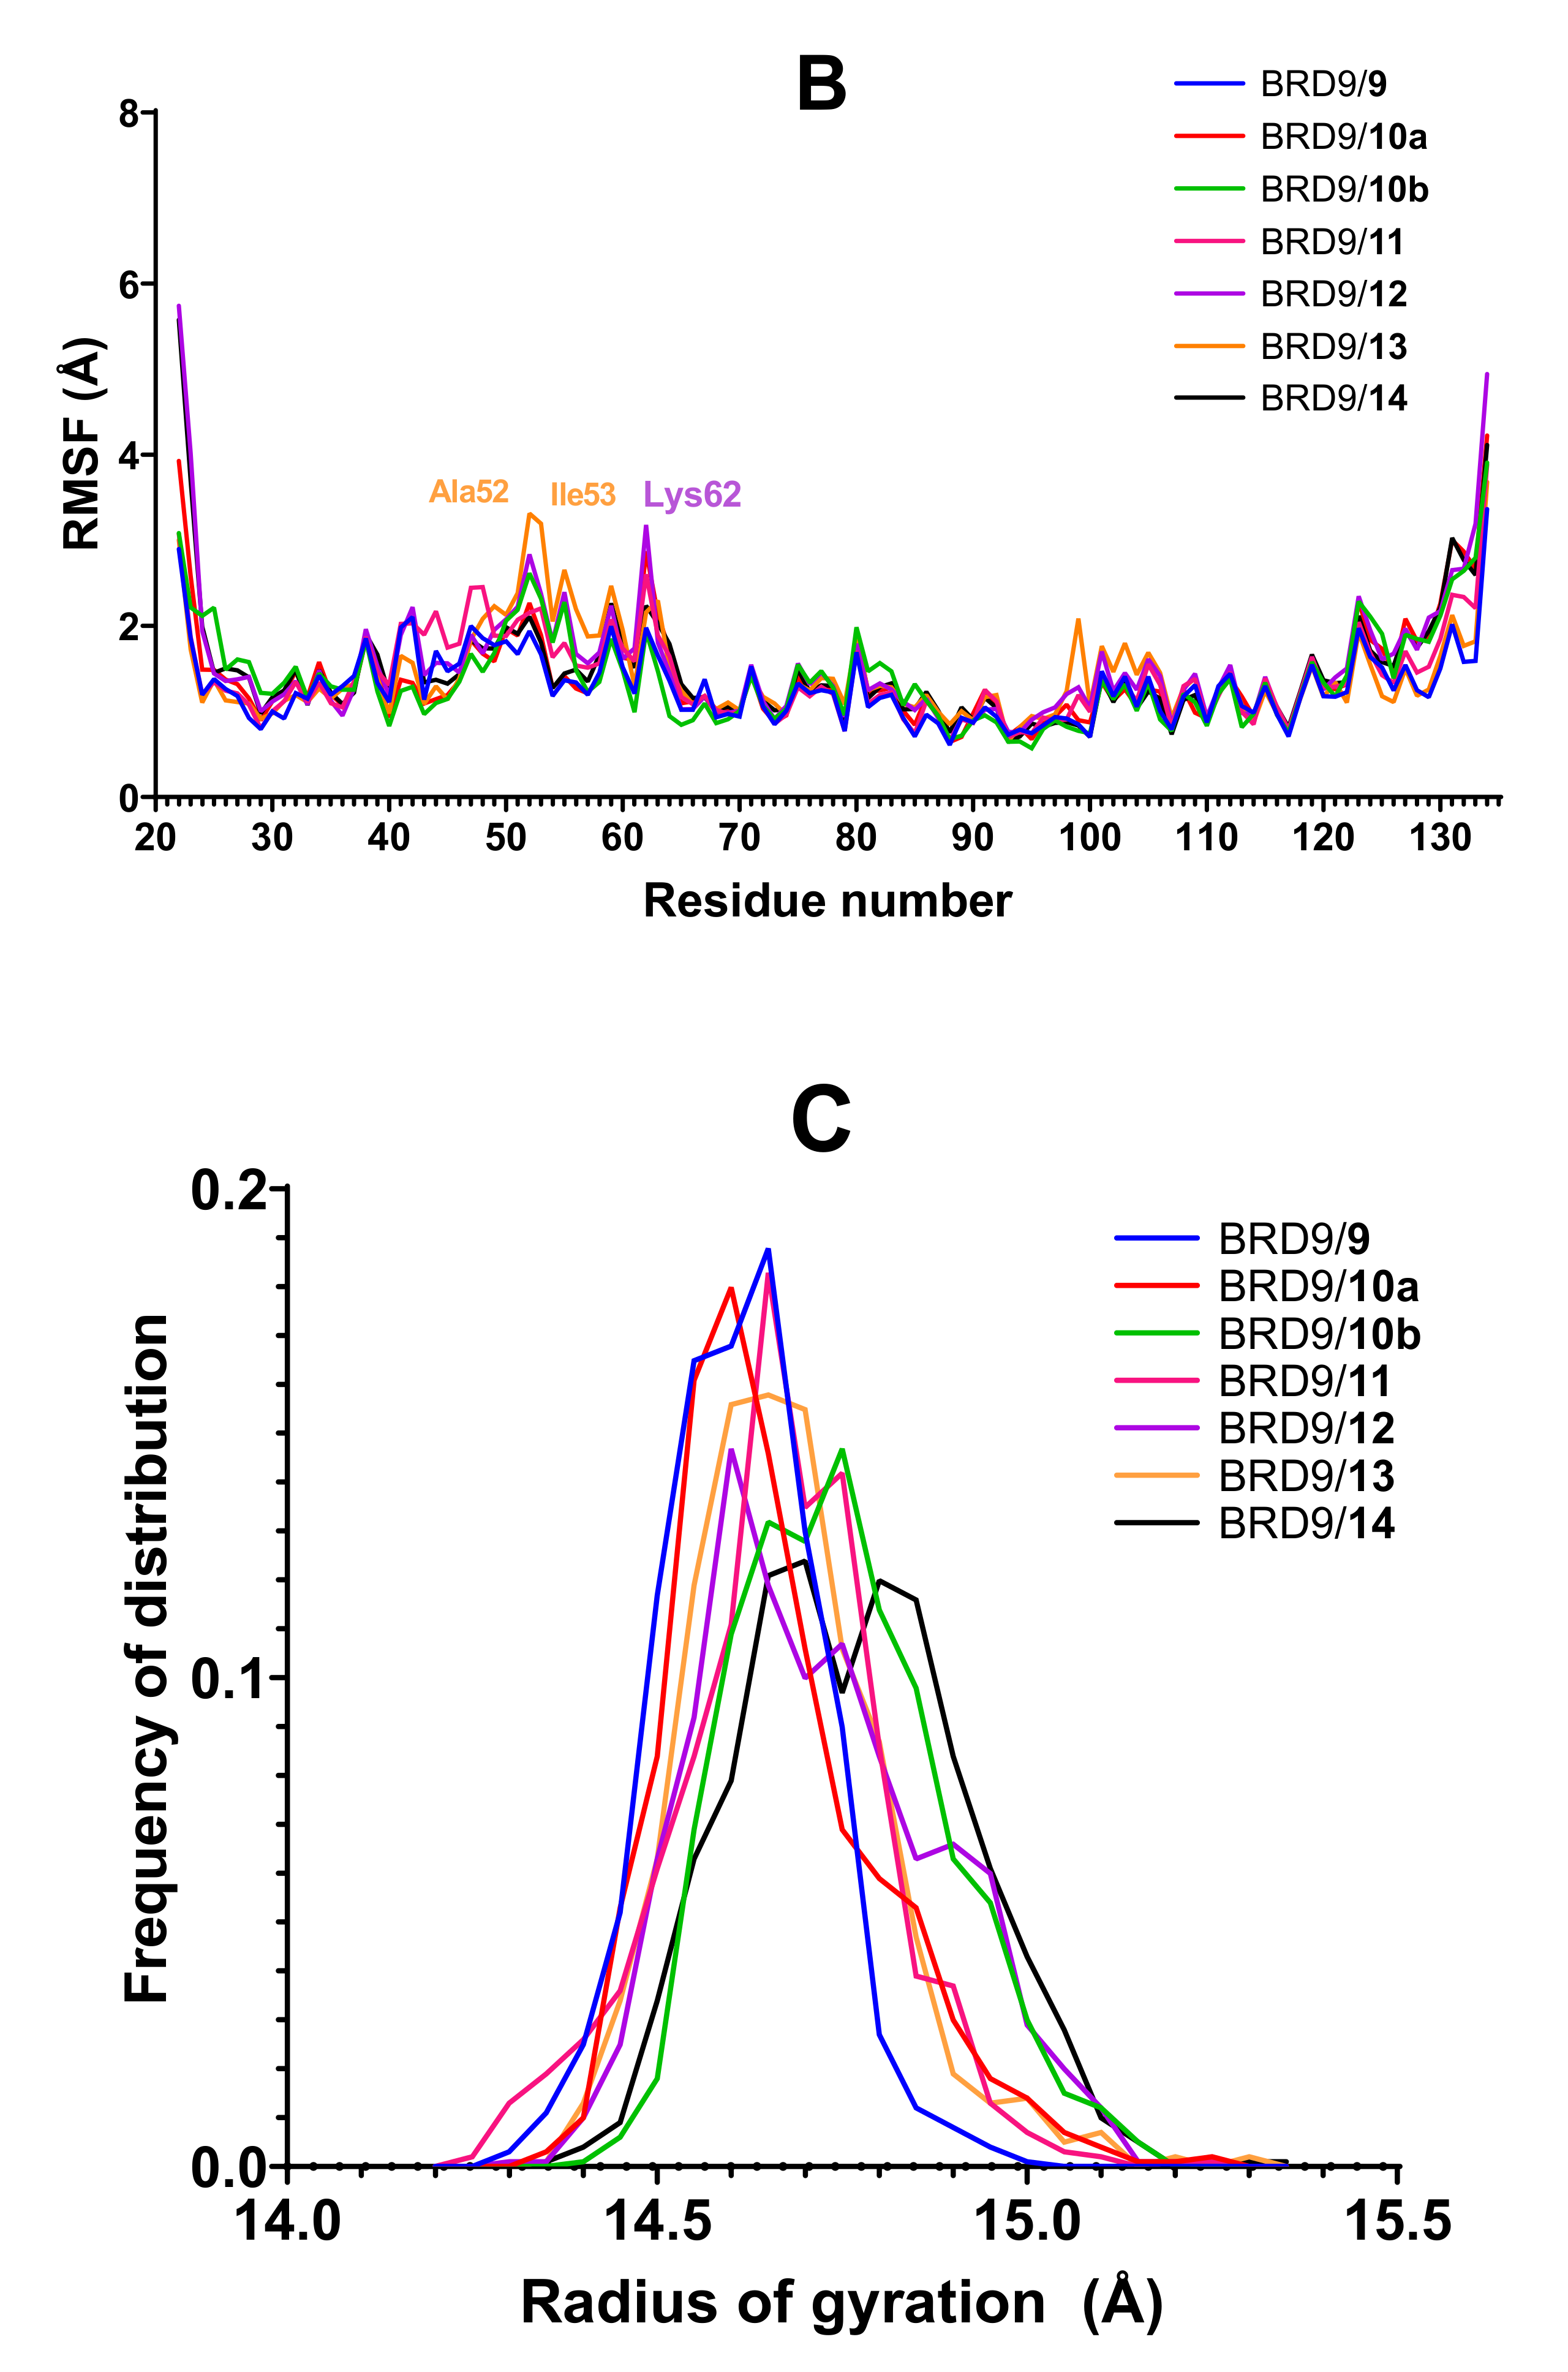
2.3. RMSF
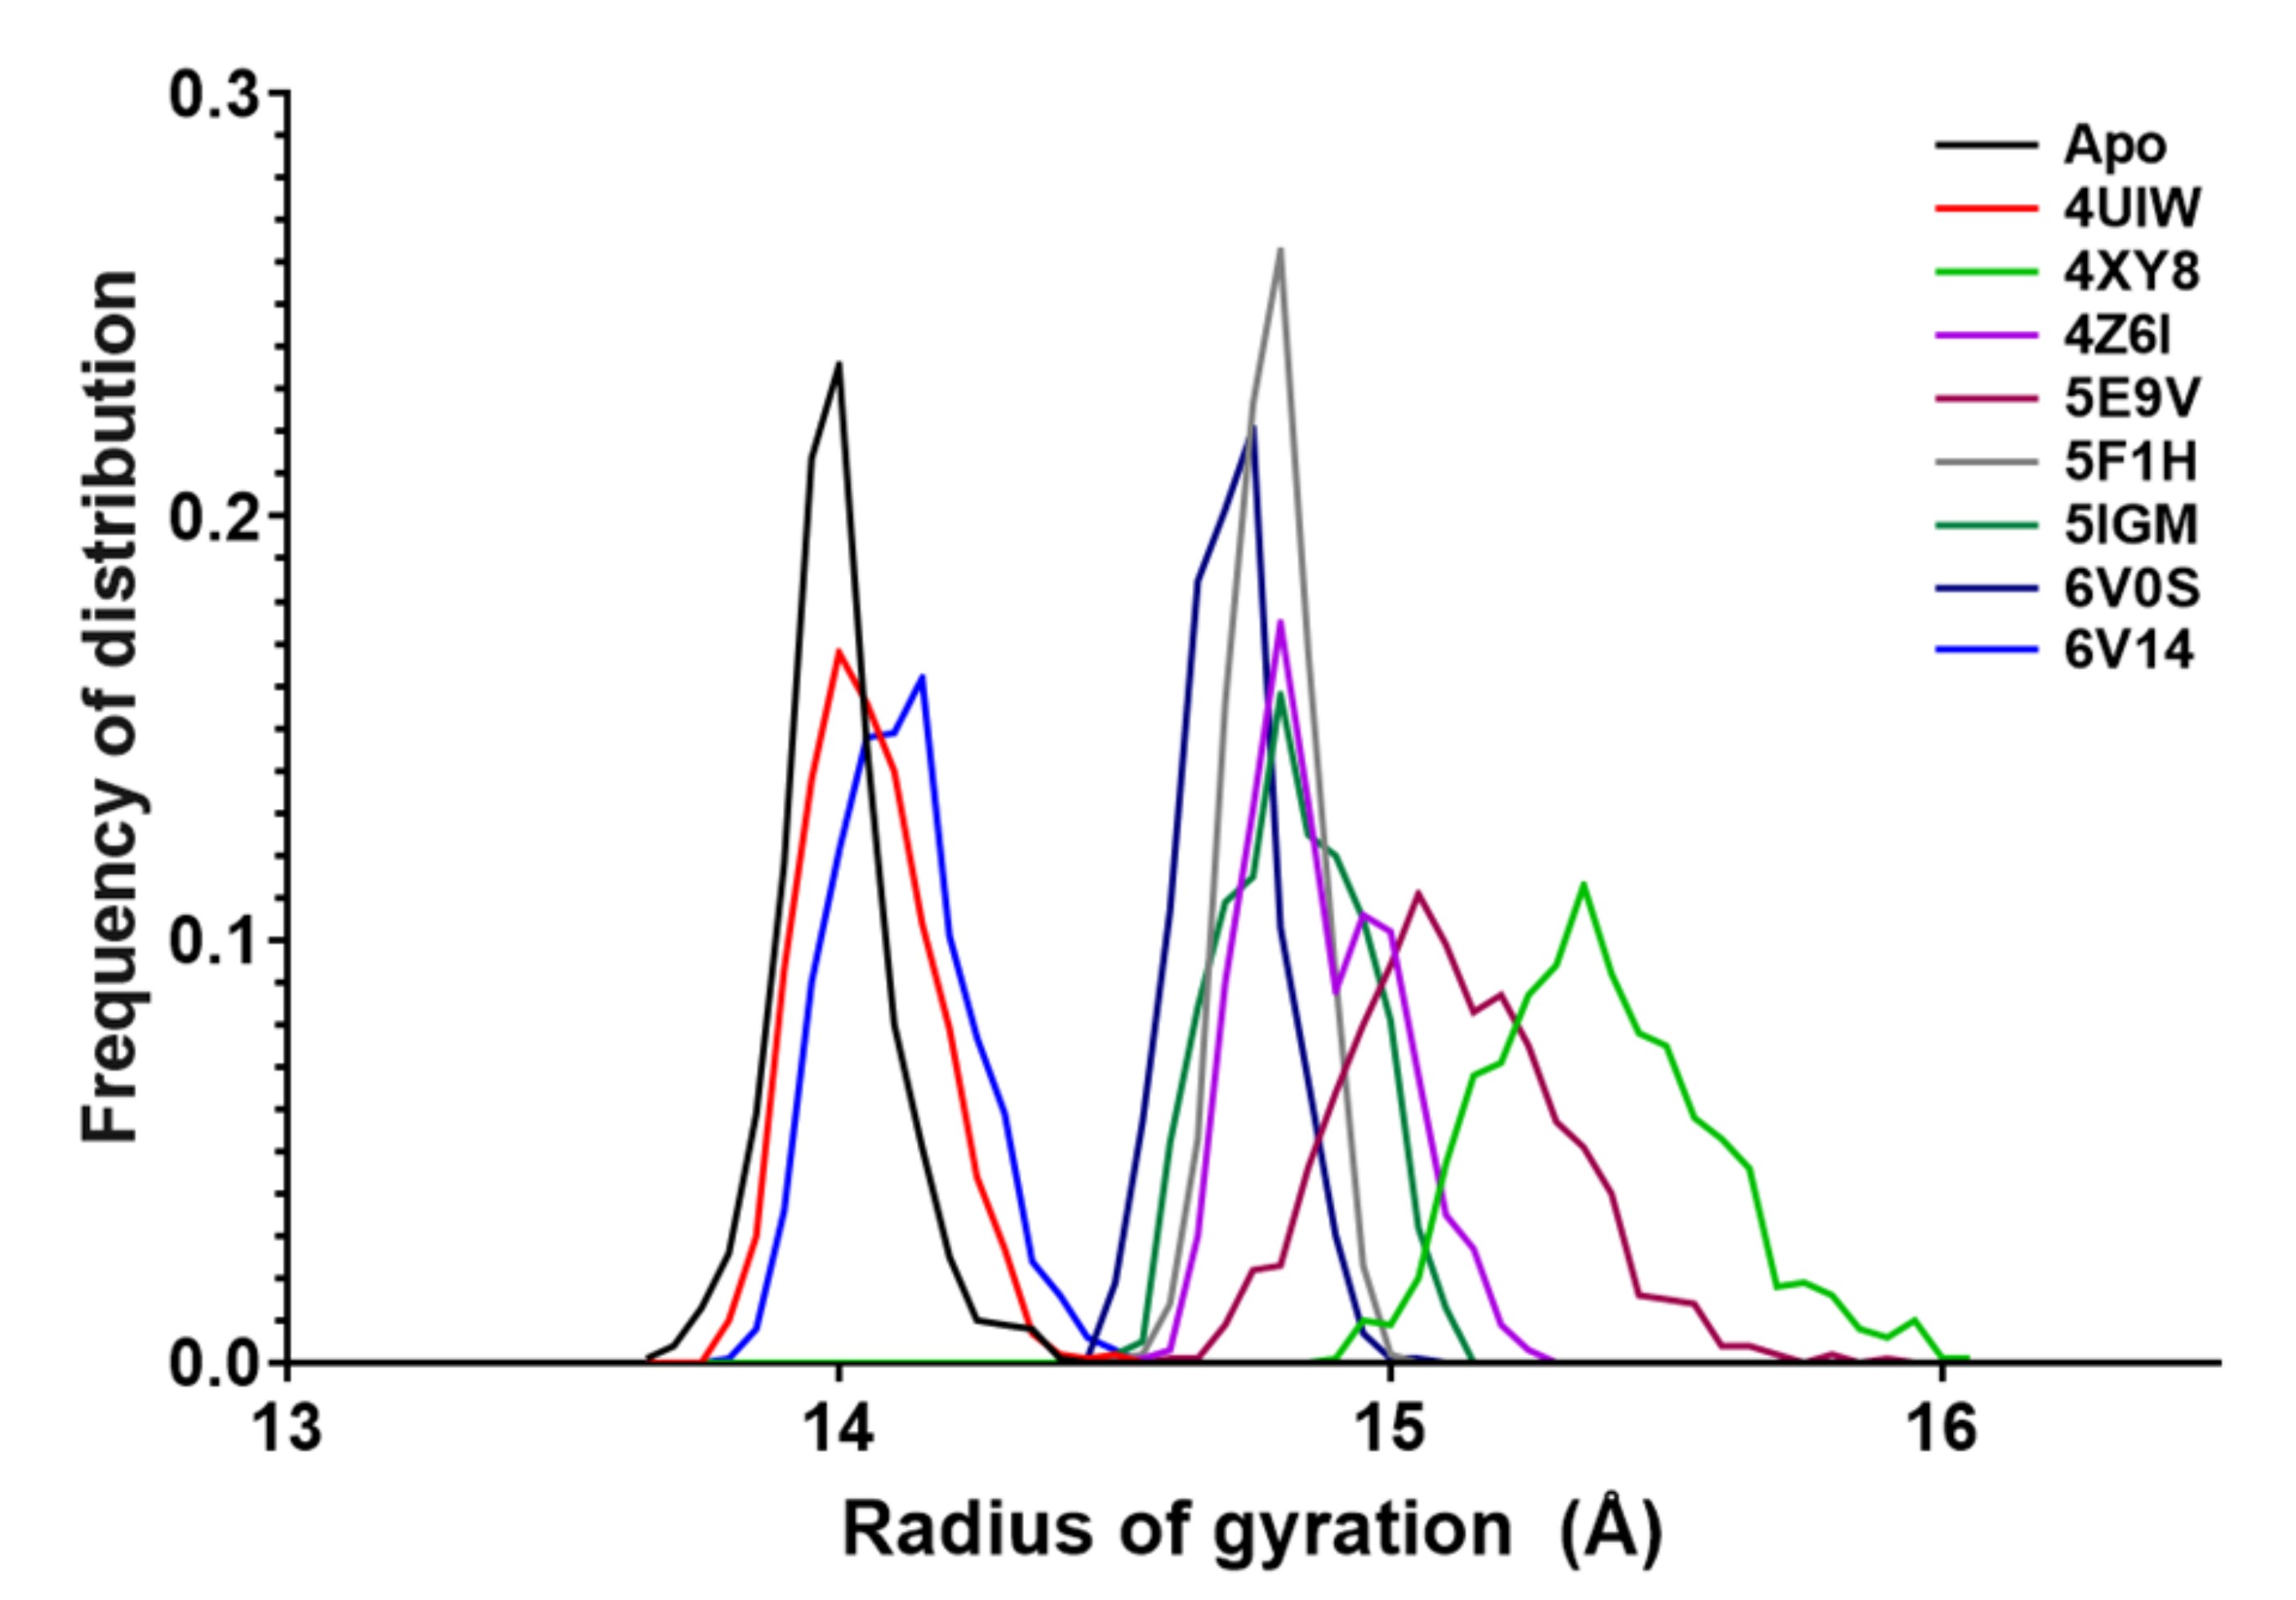
2.4. Radius of Gyration
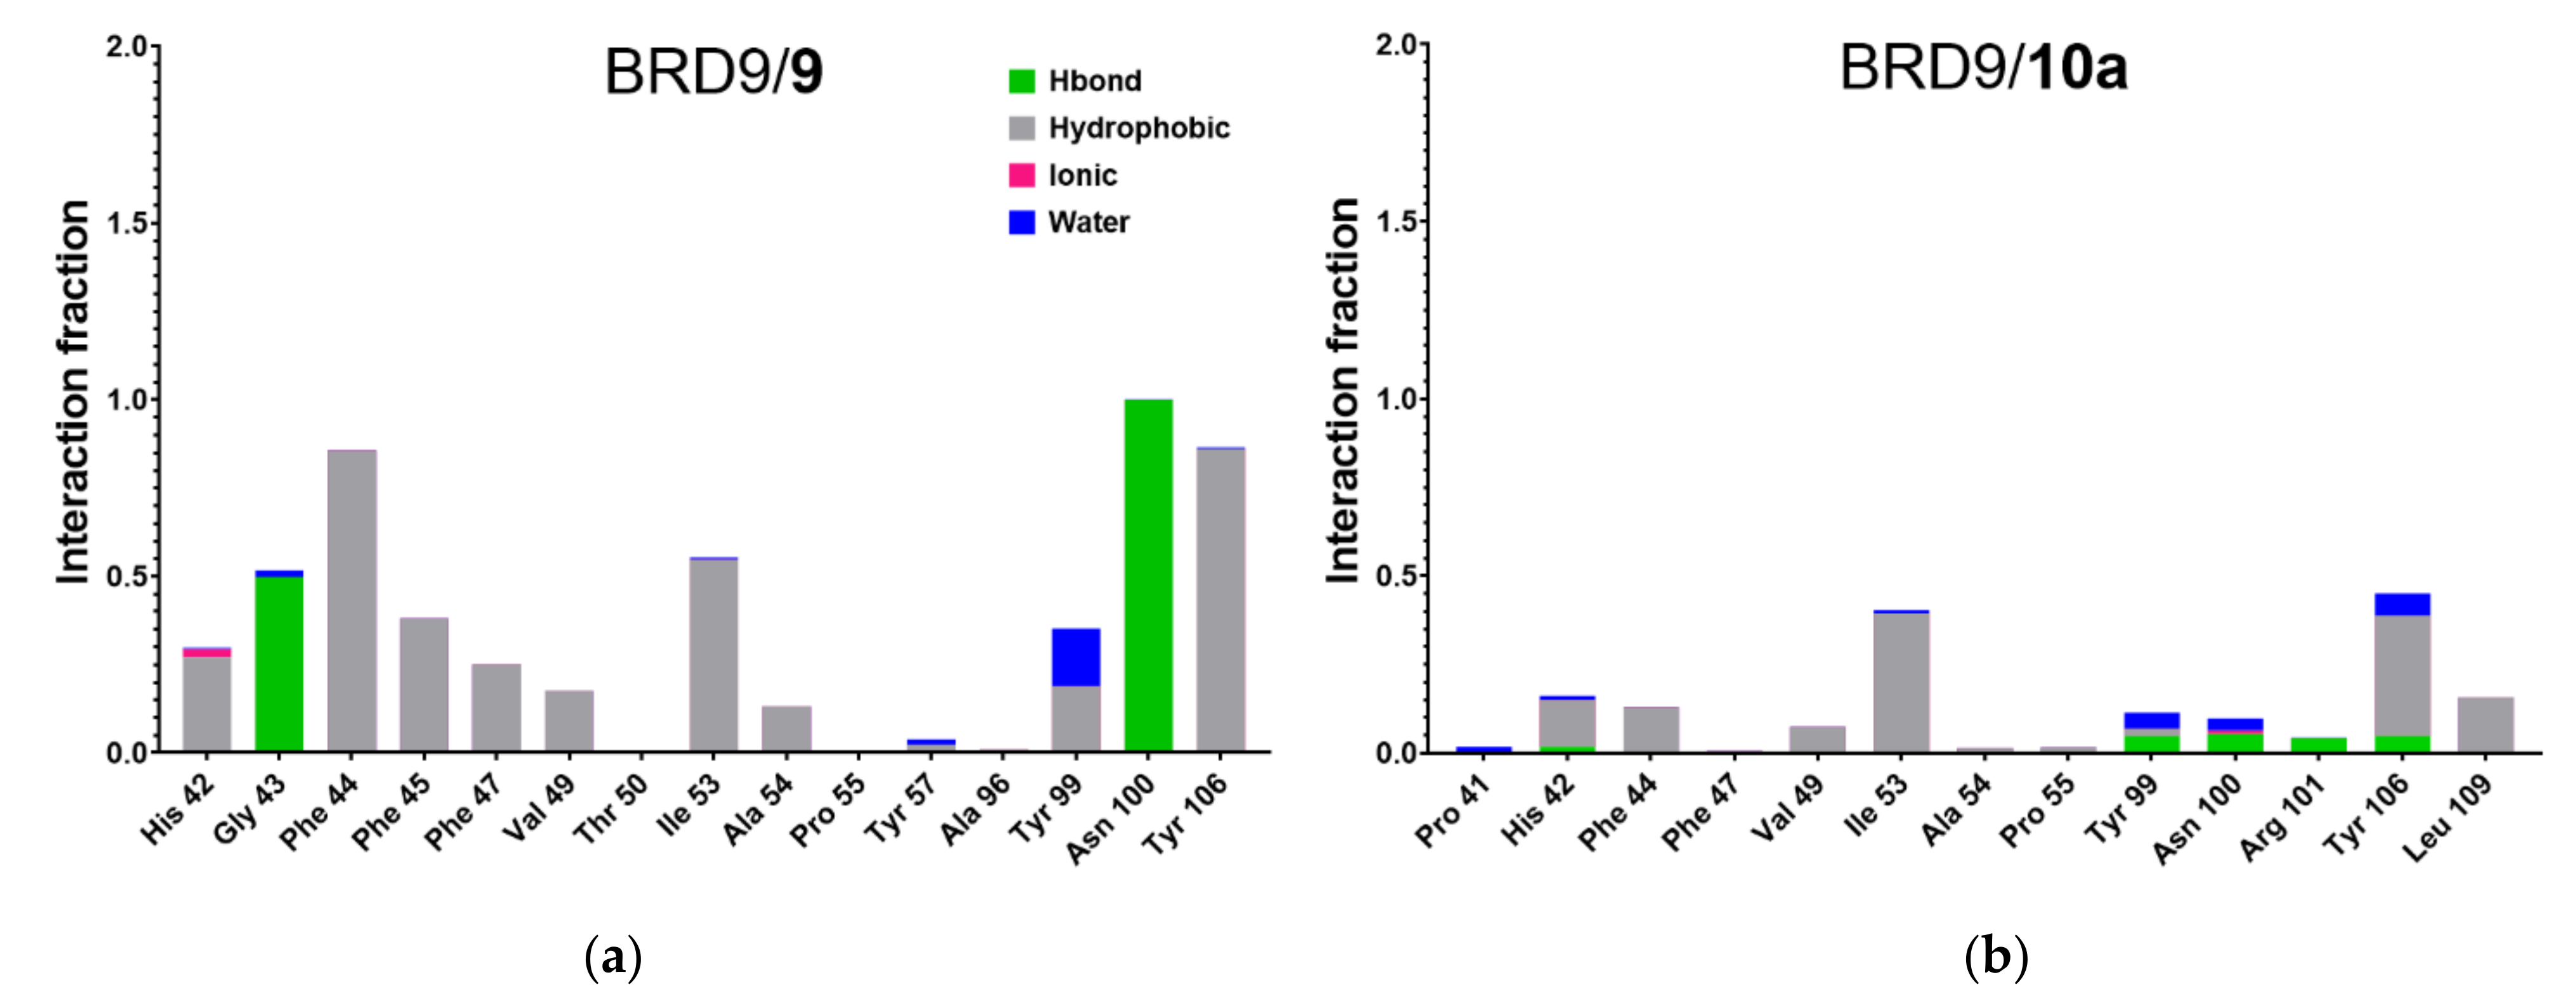
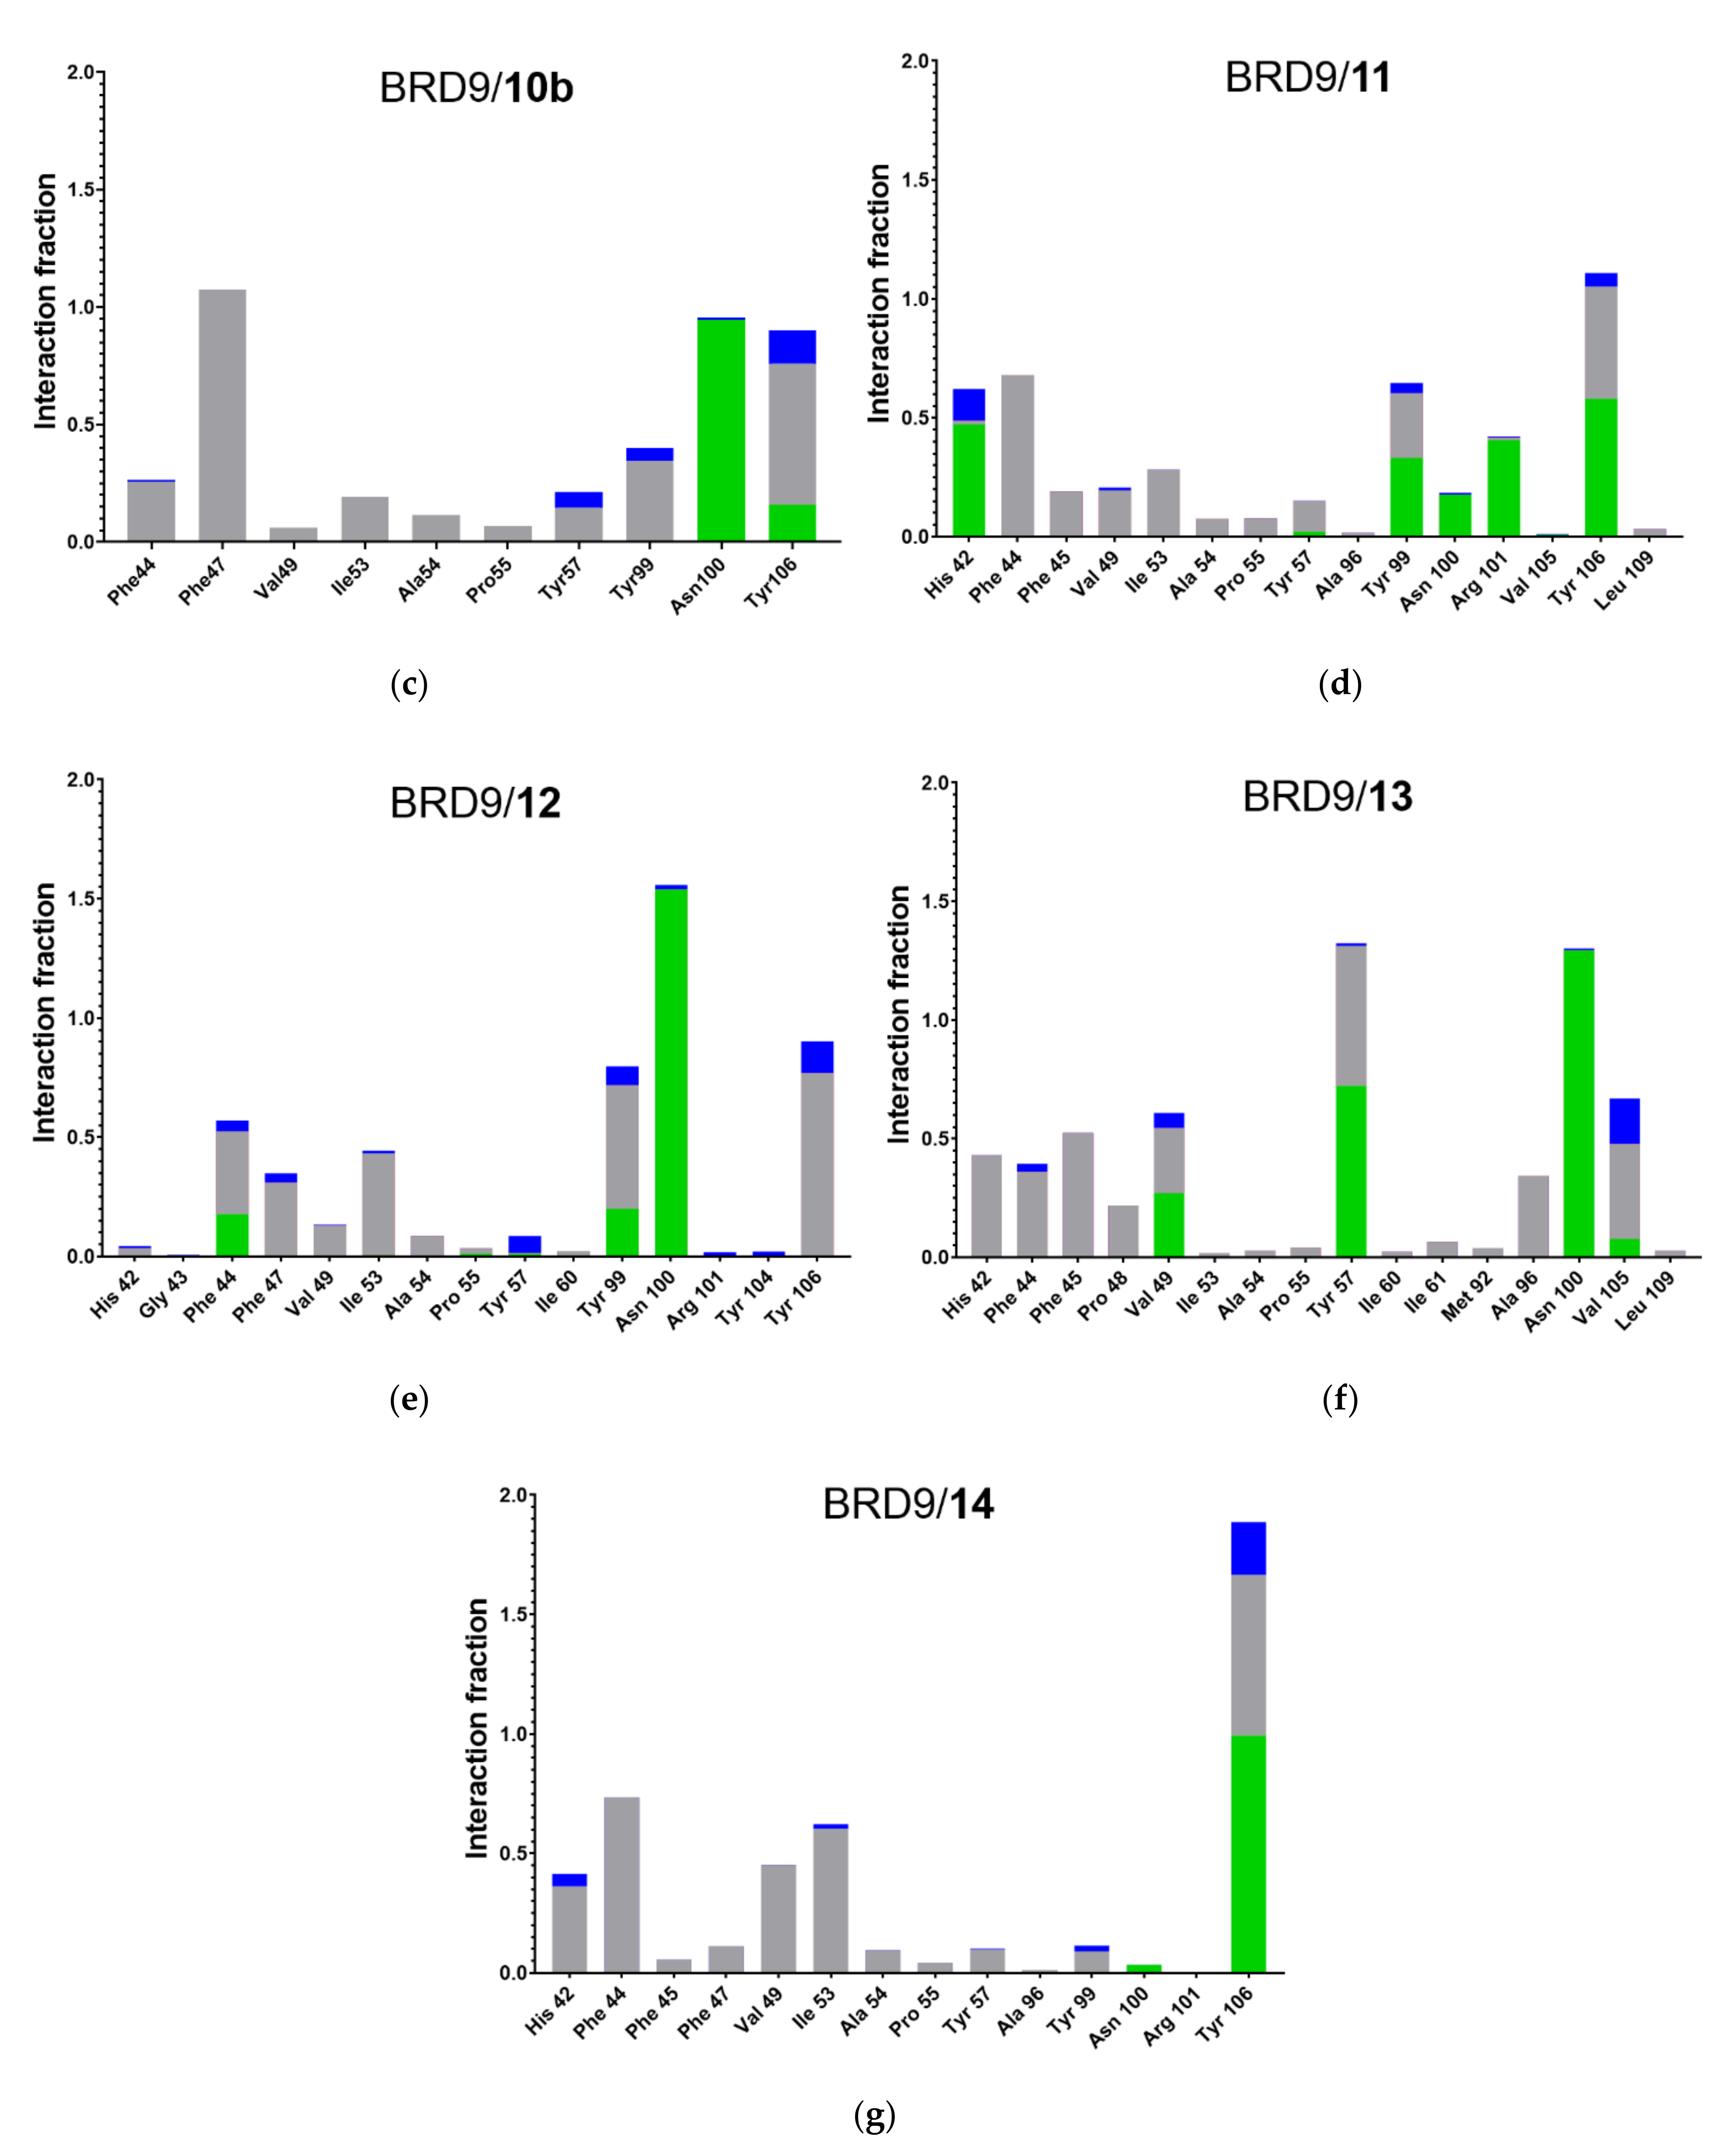
2.5. Protein-Ligand Interactions
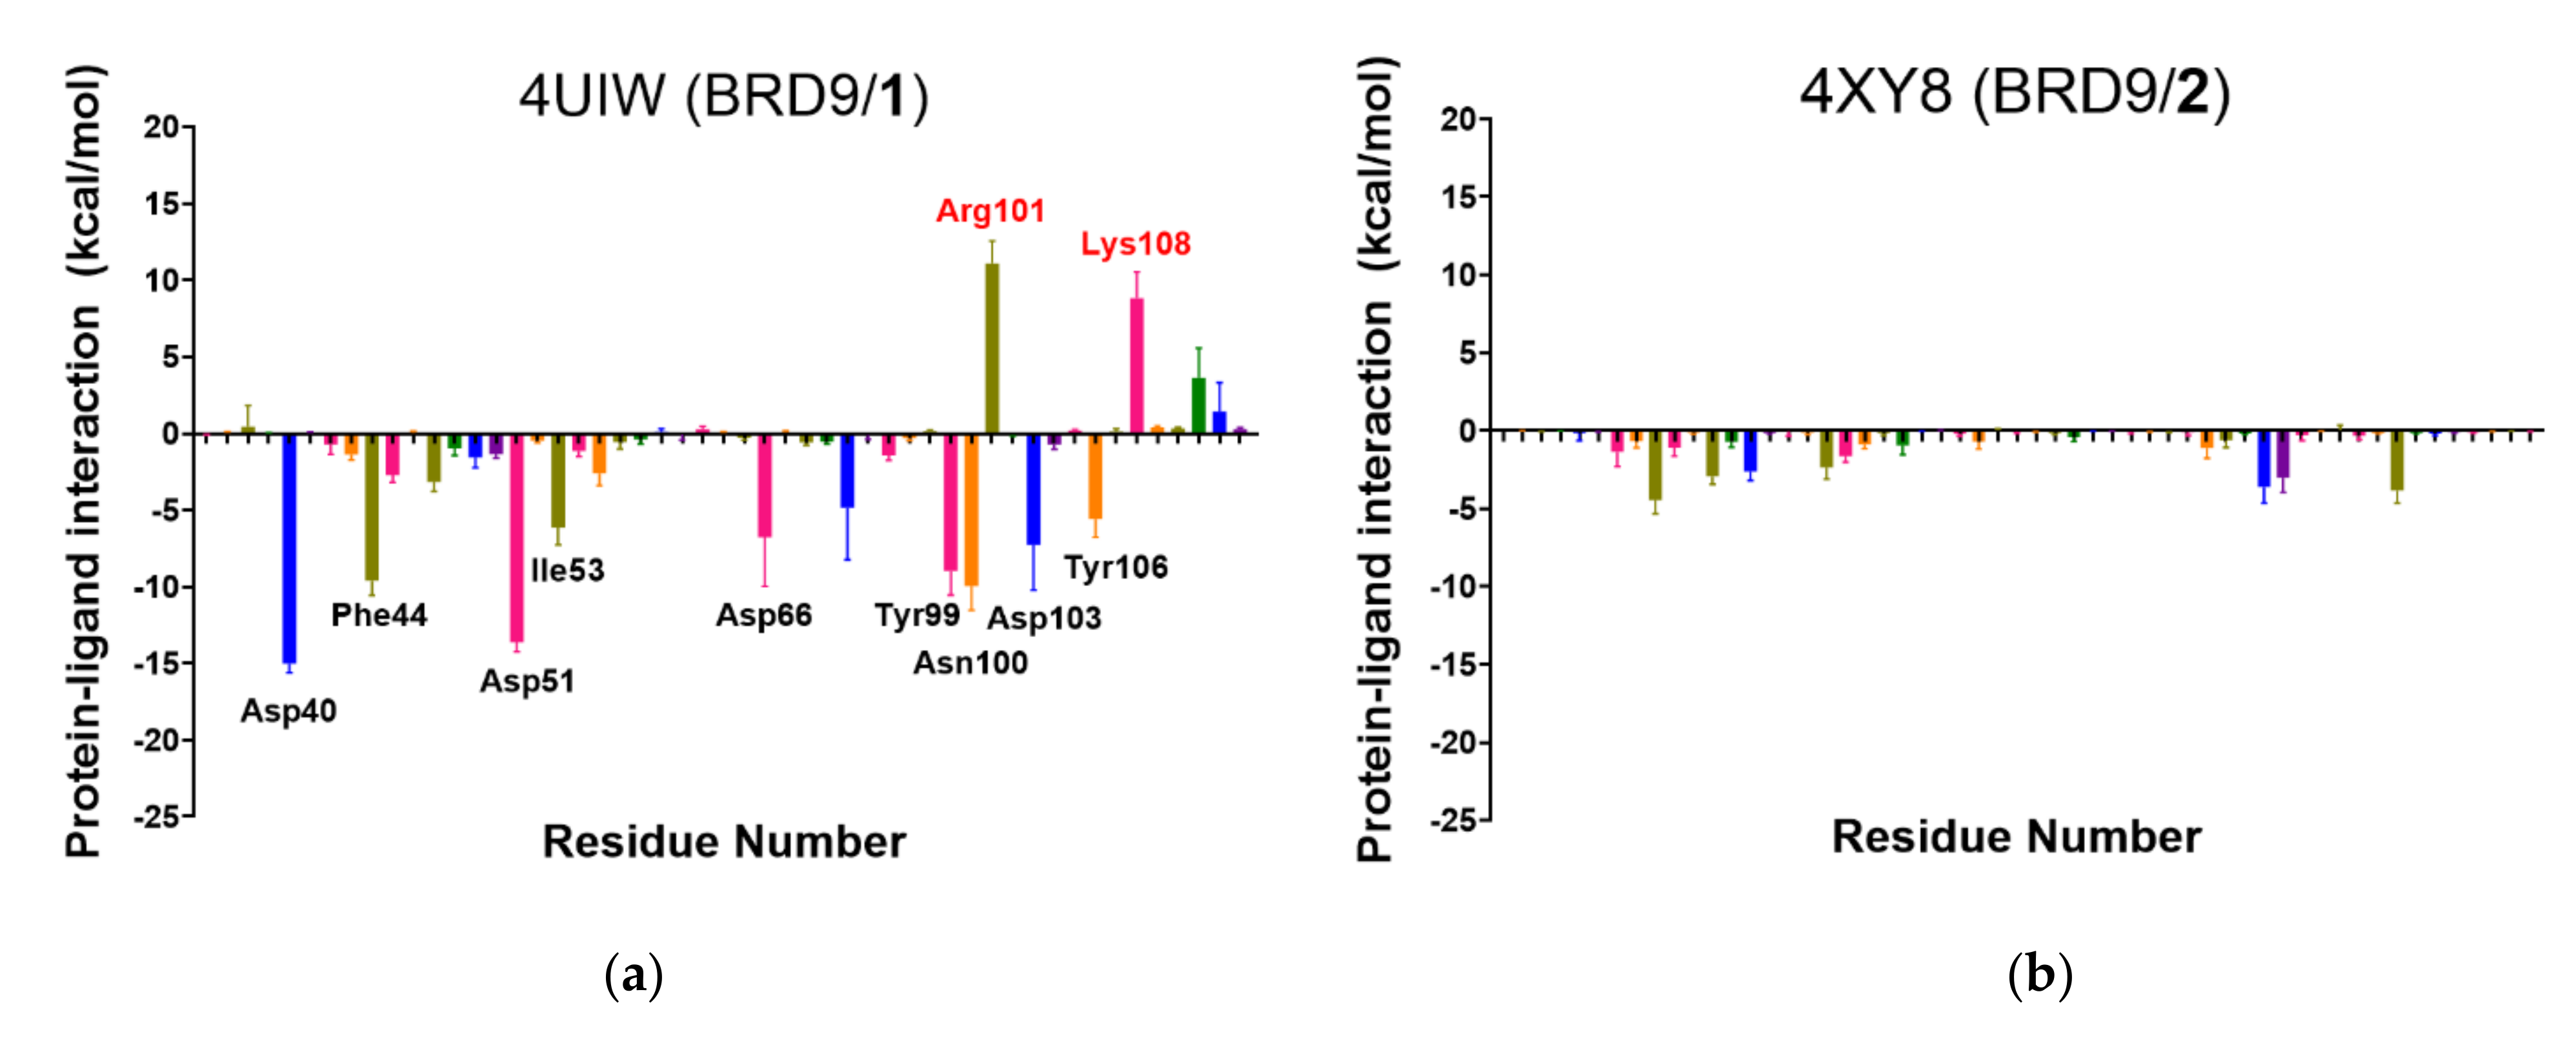
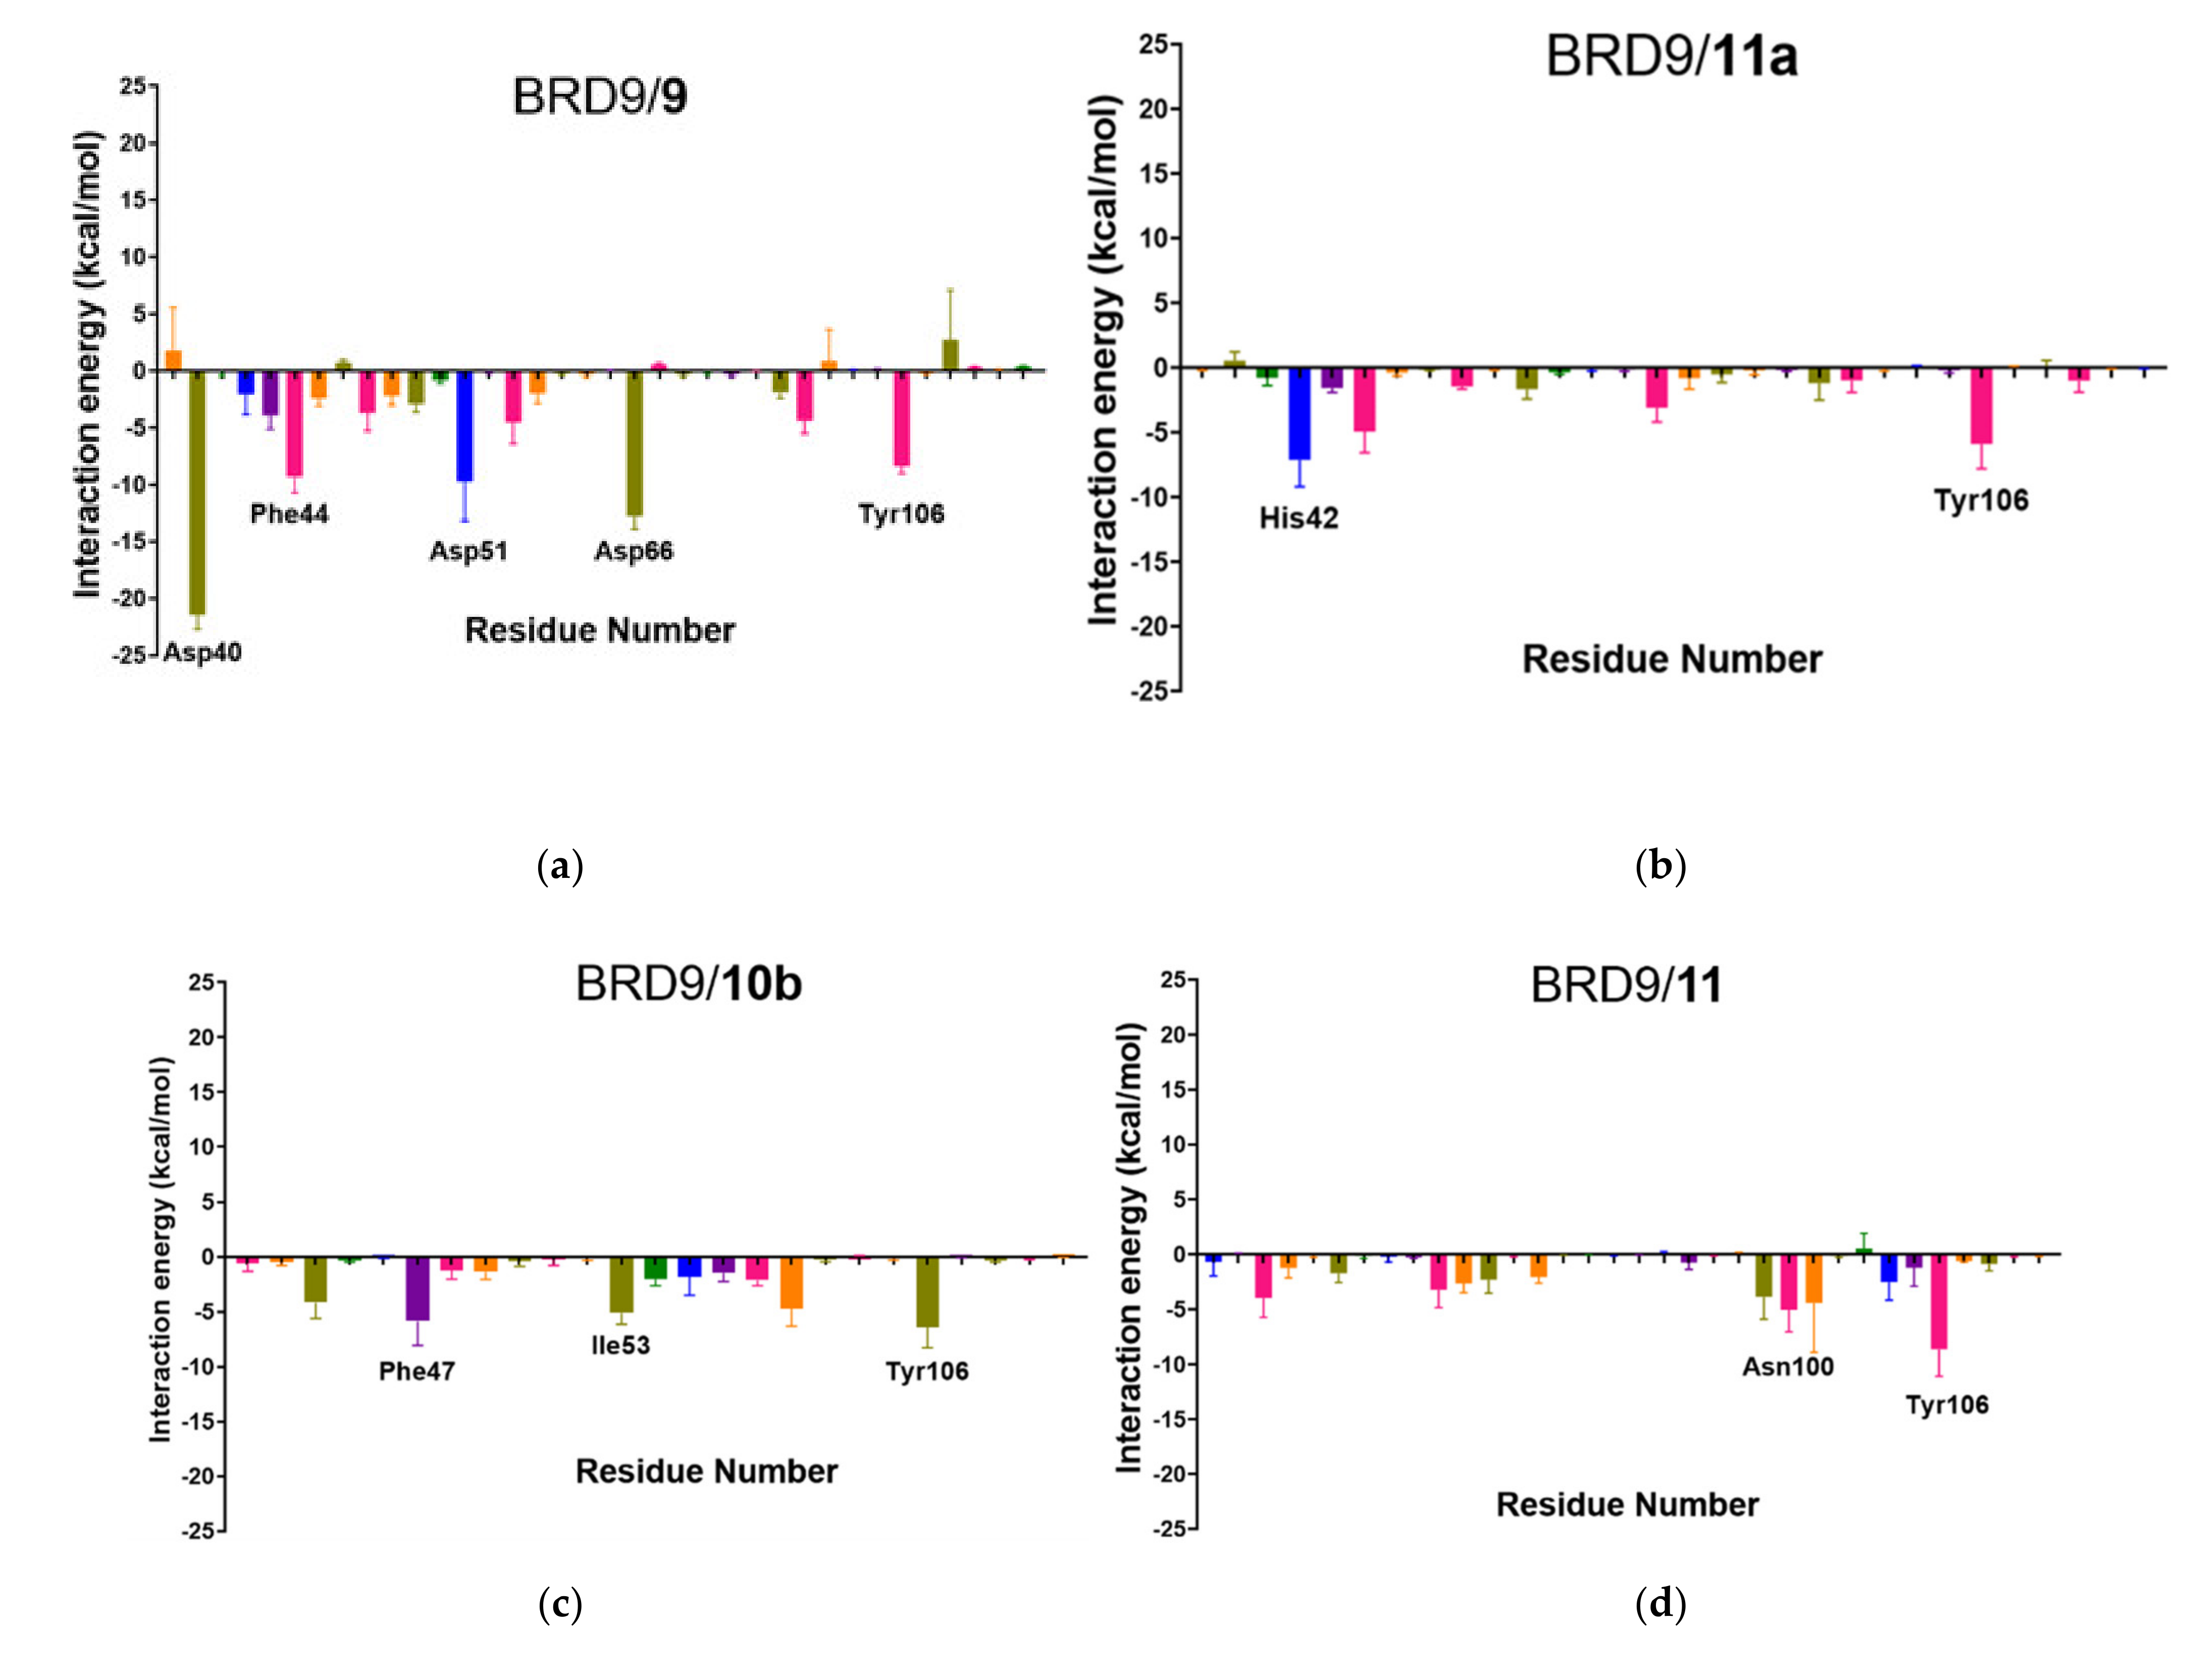
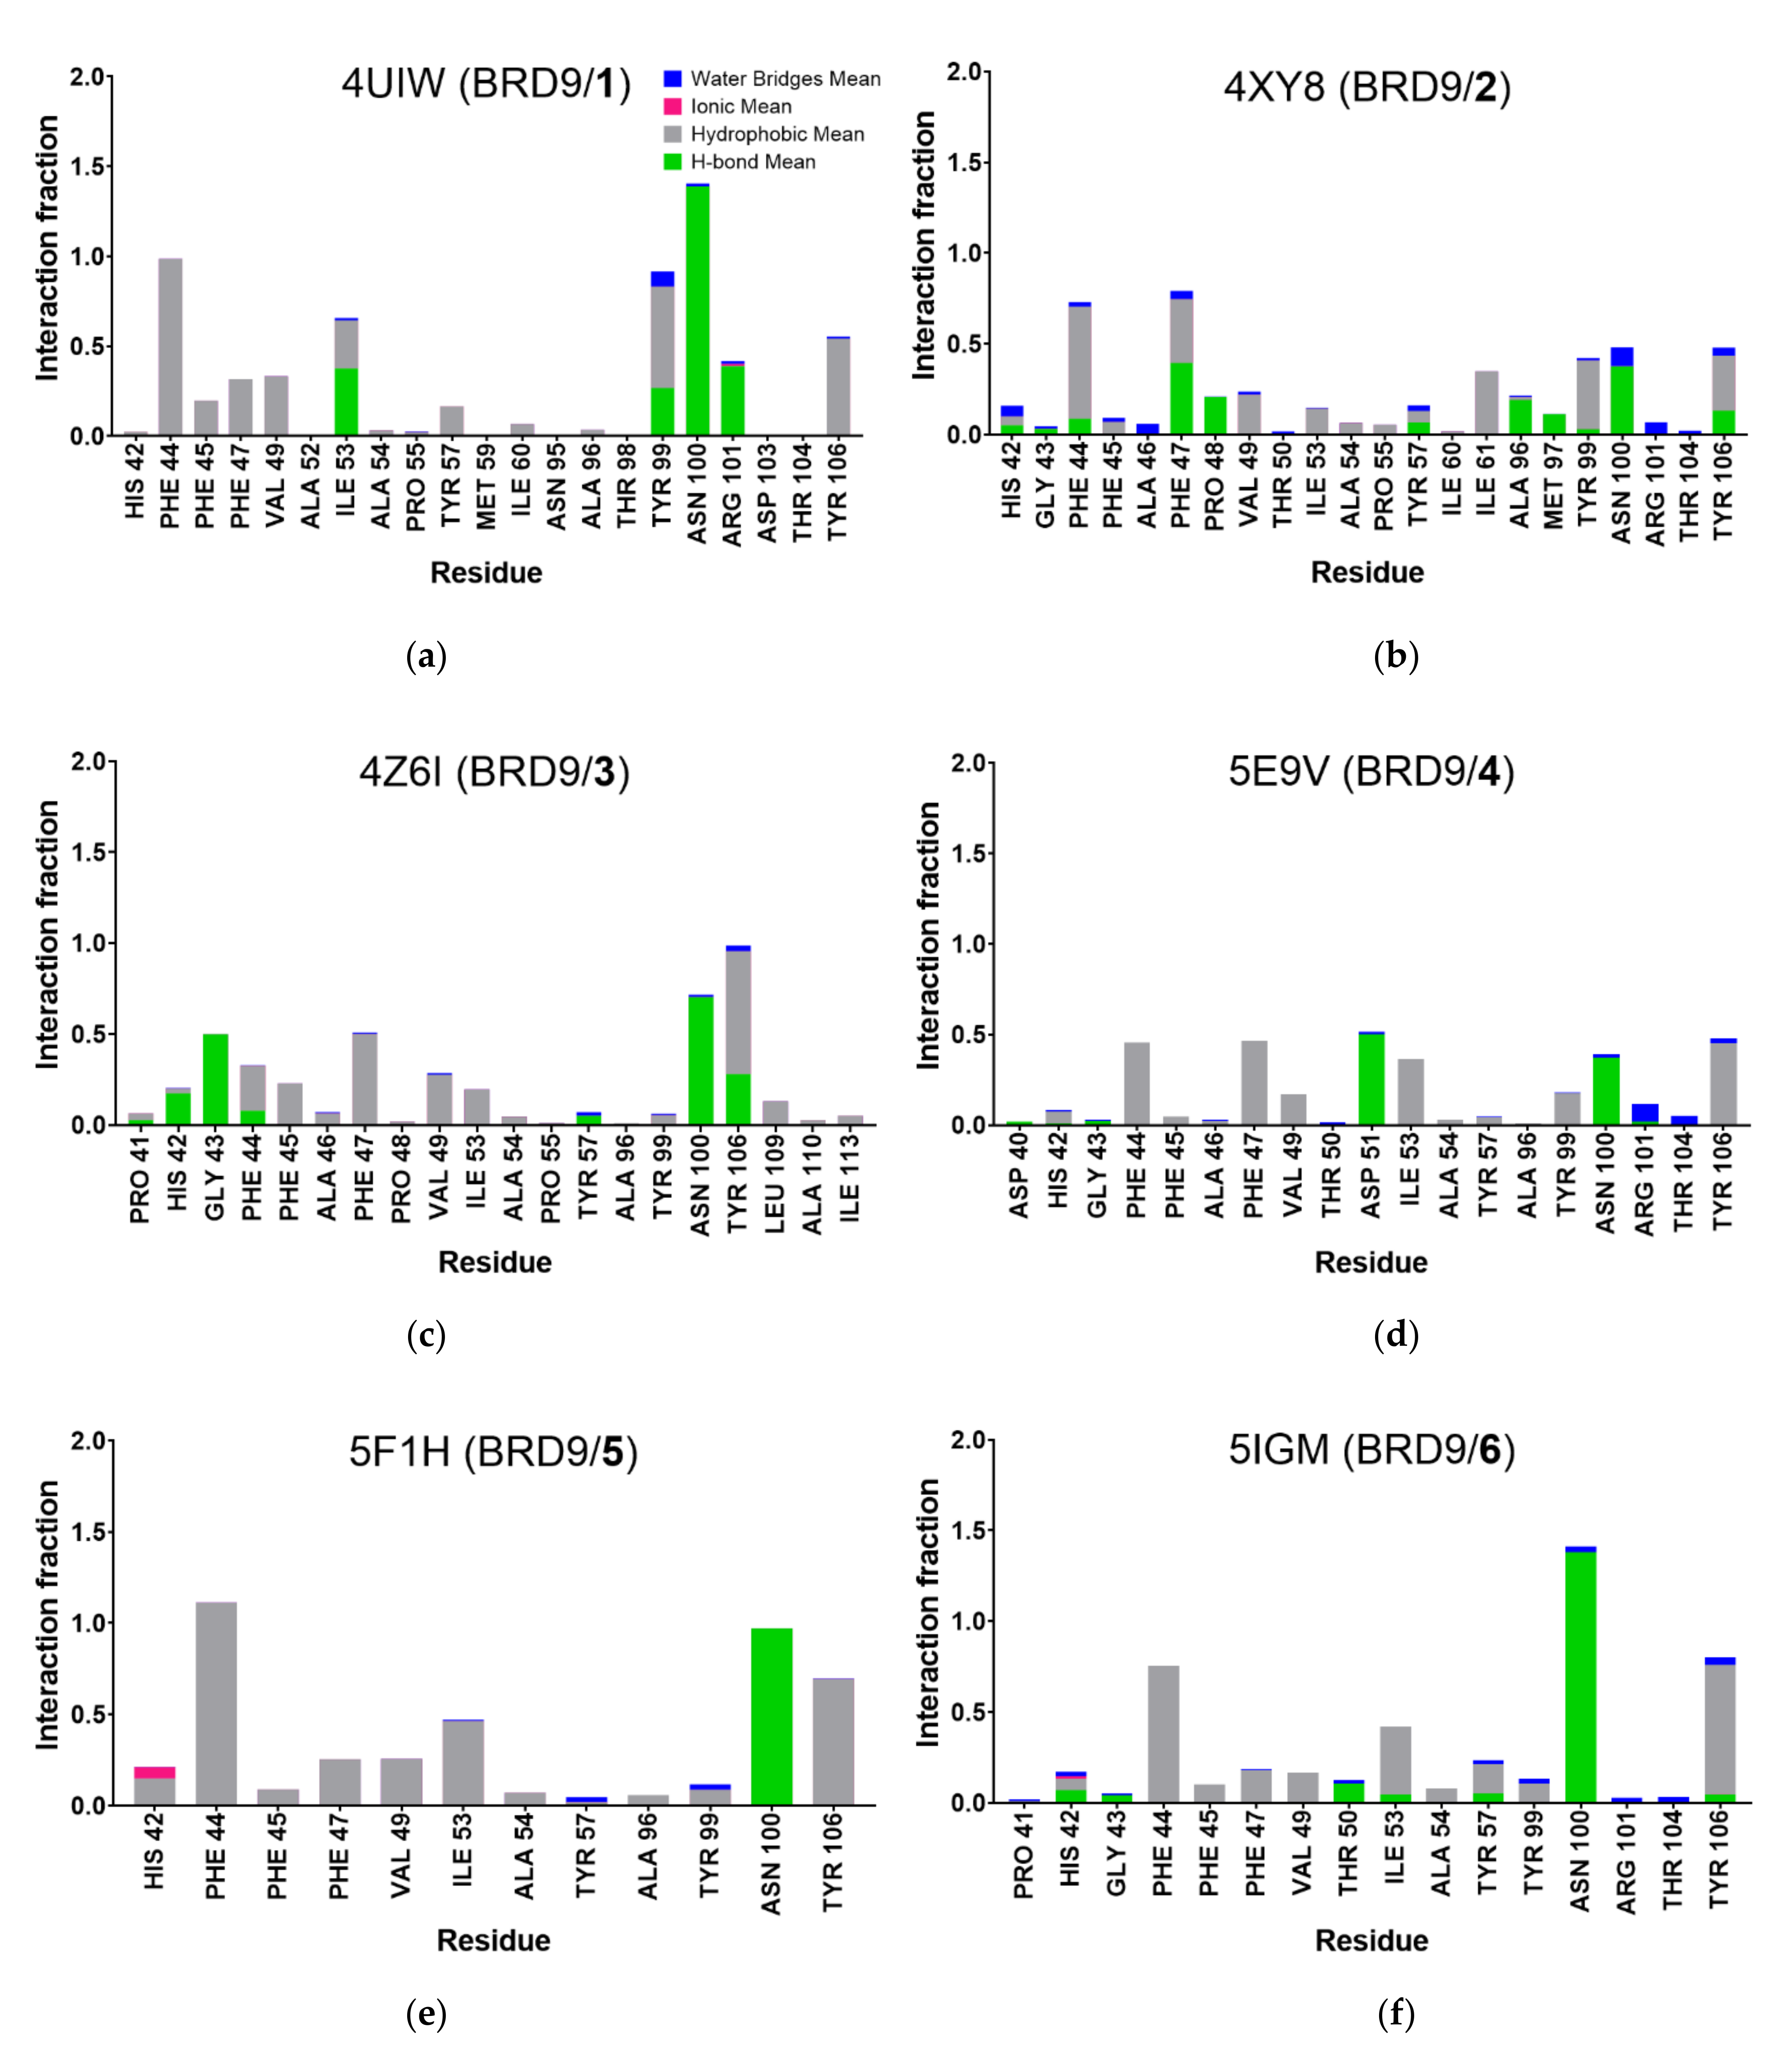
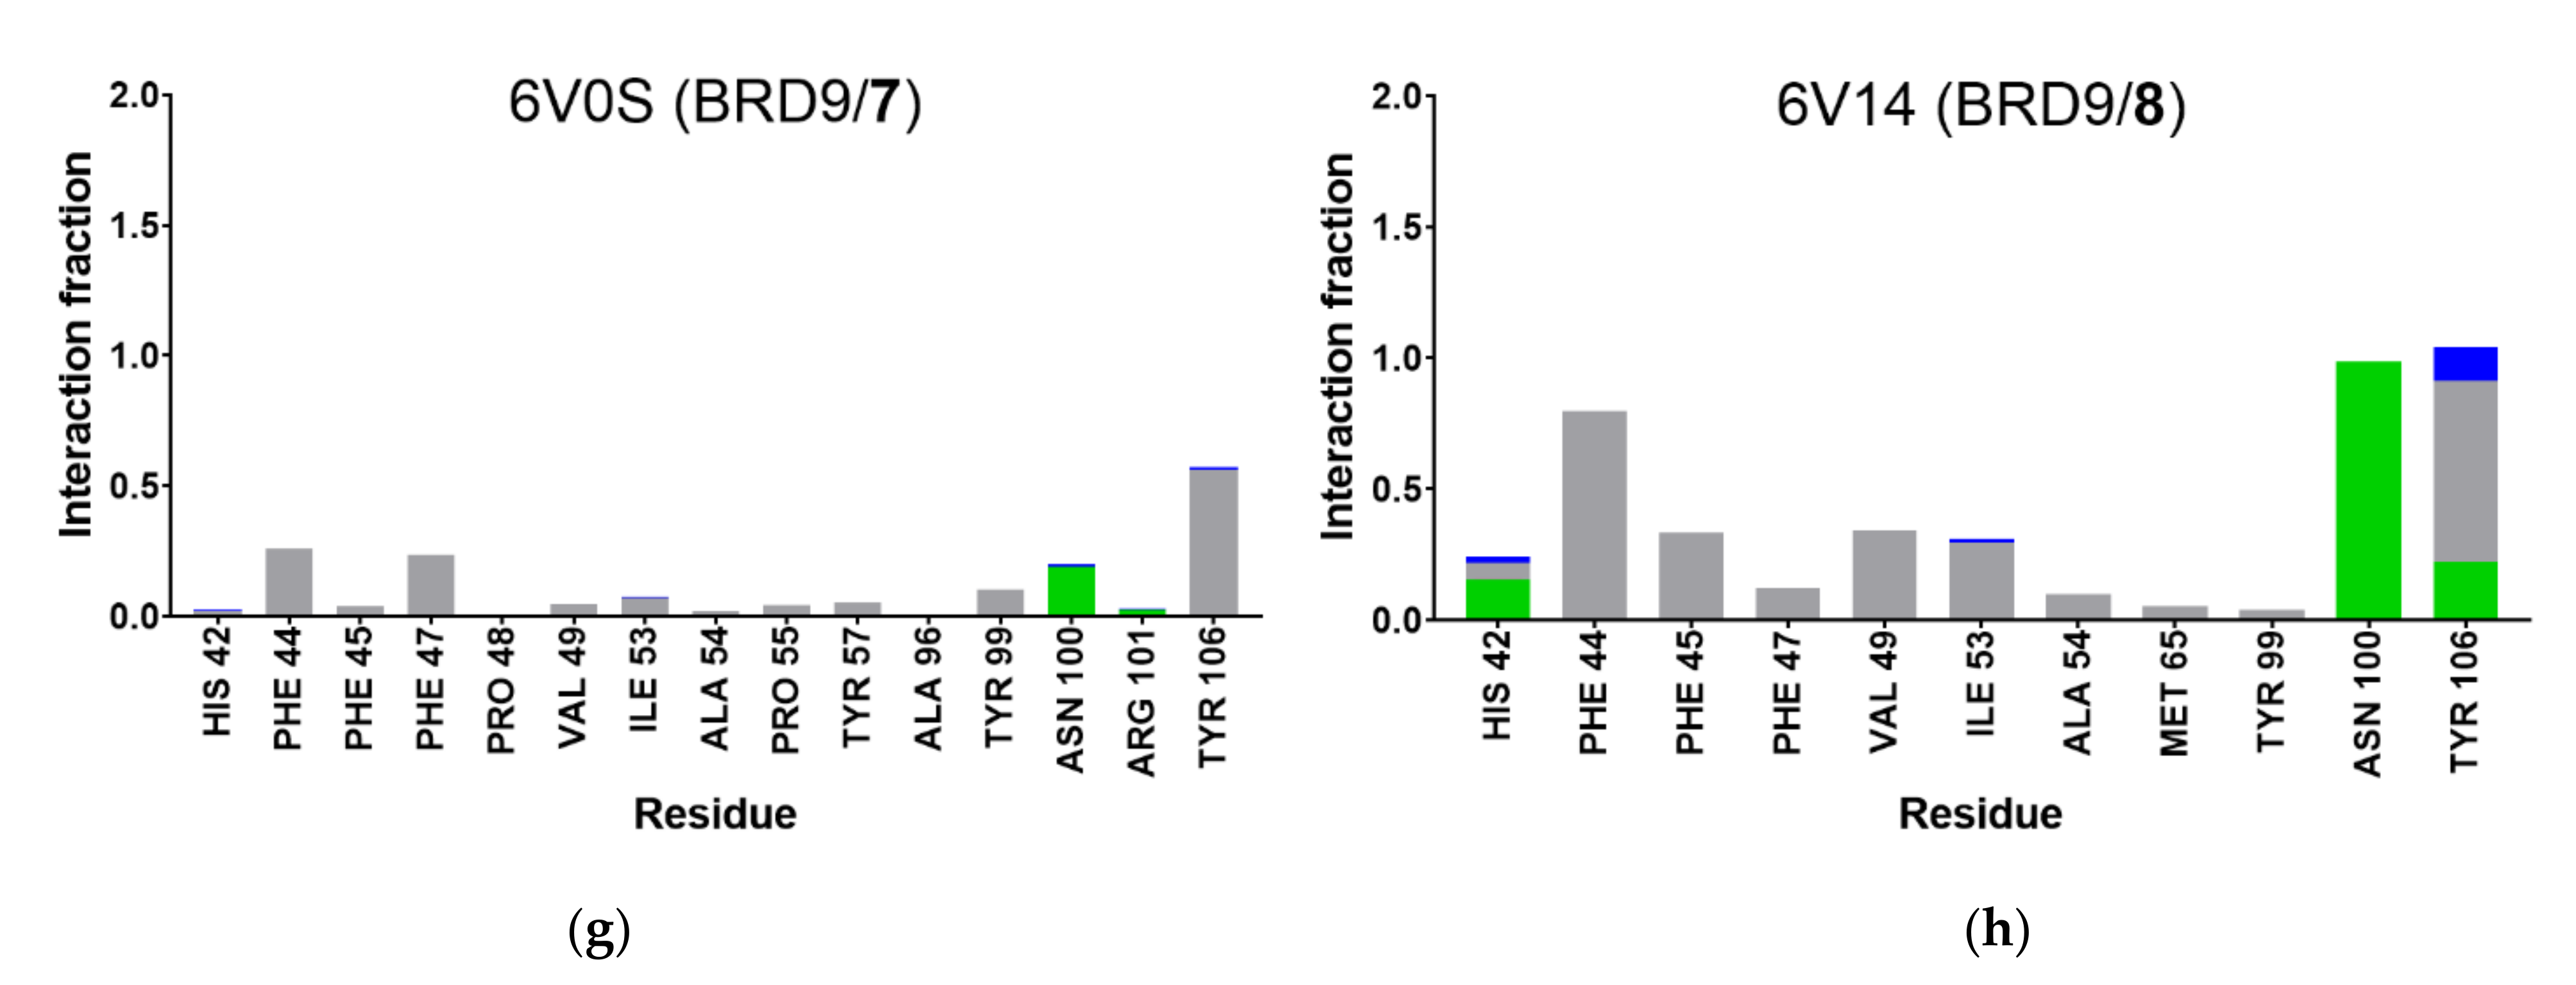
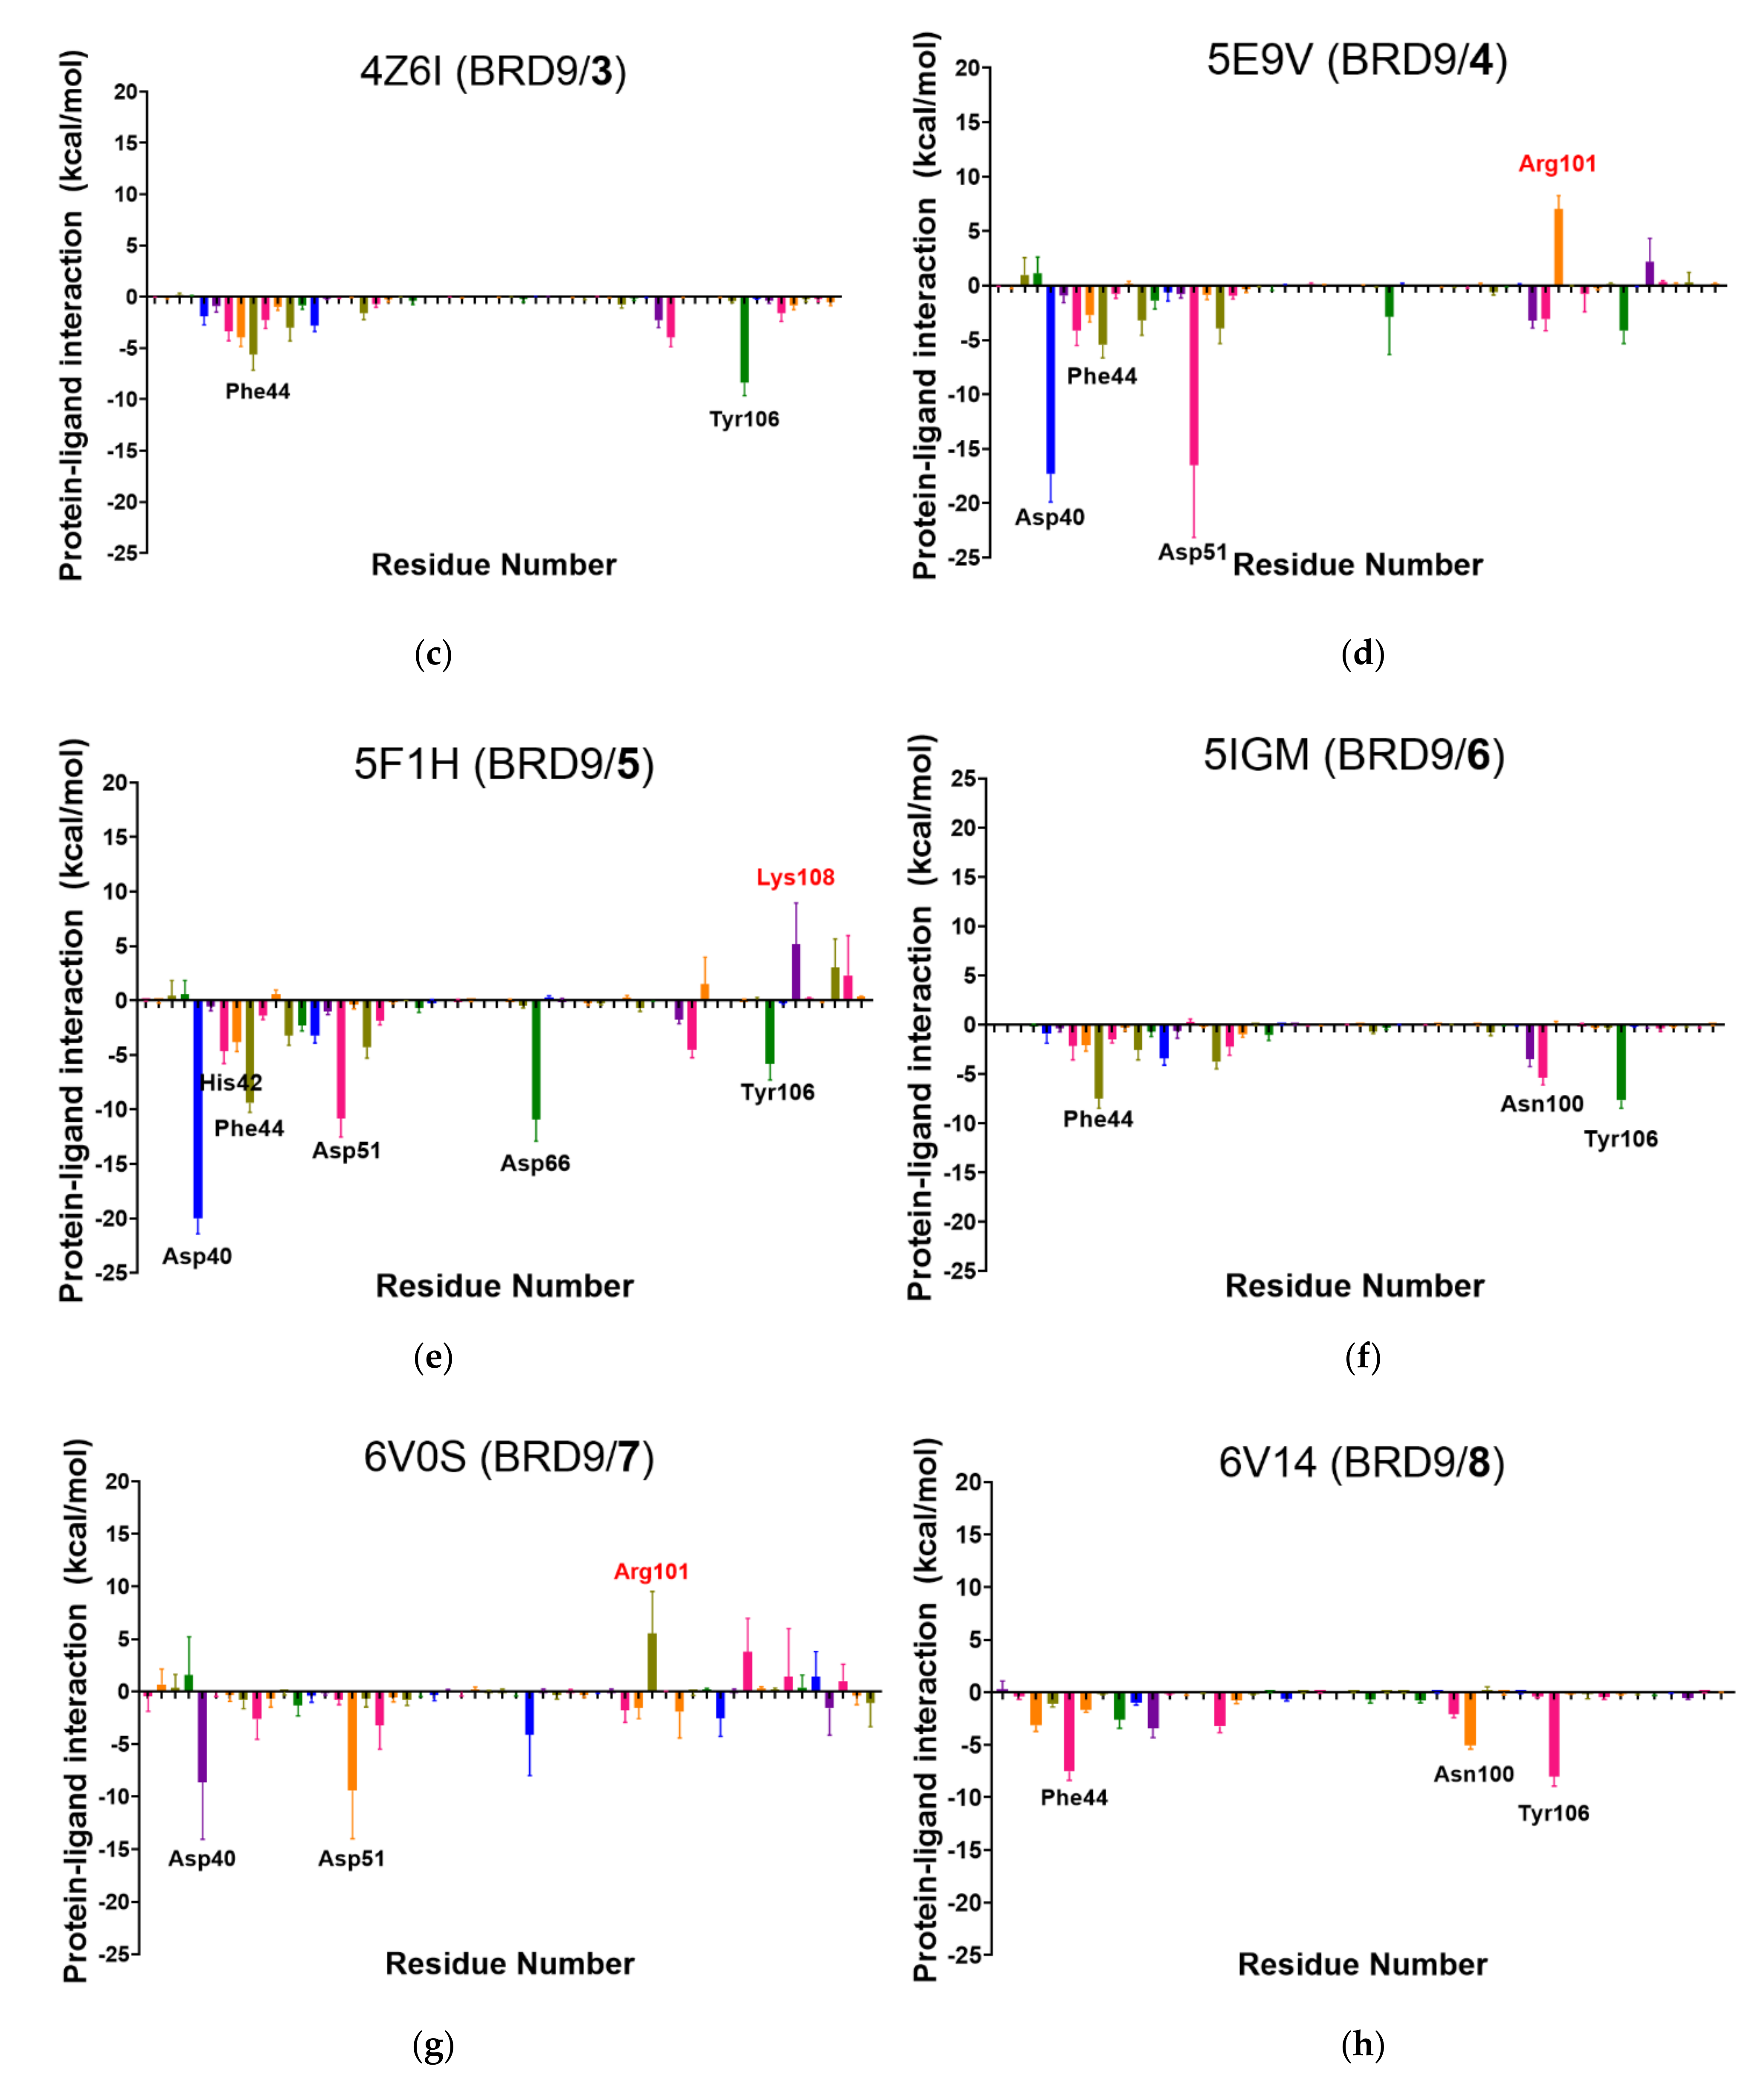
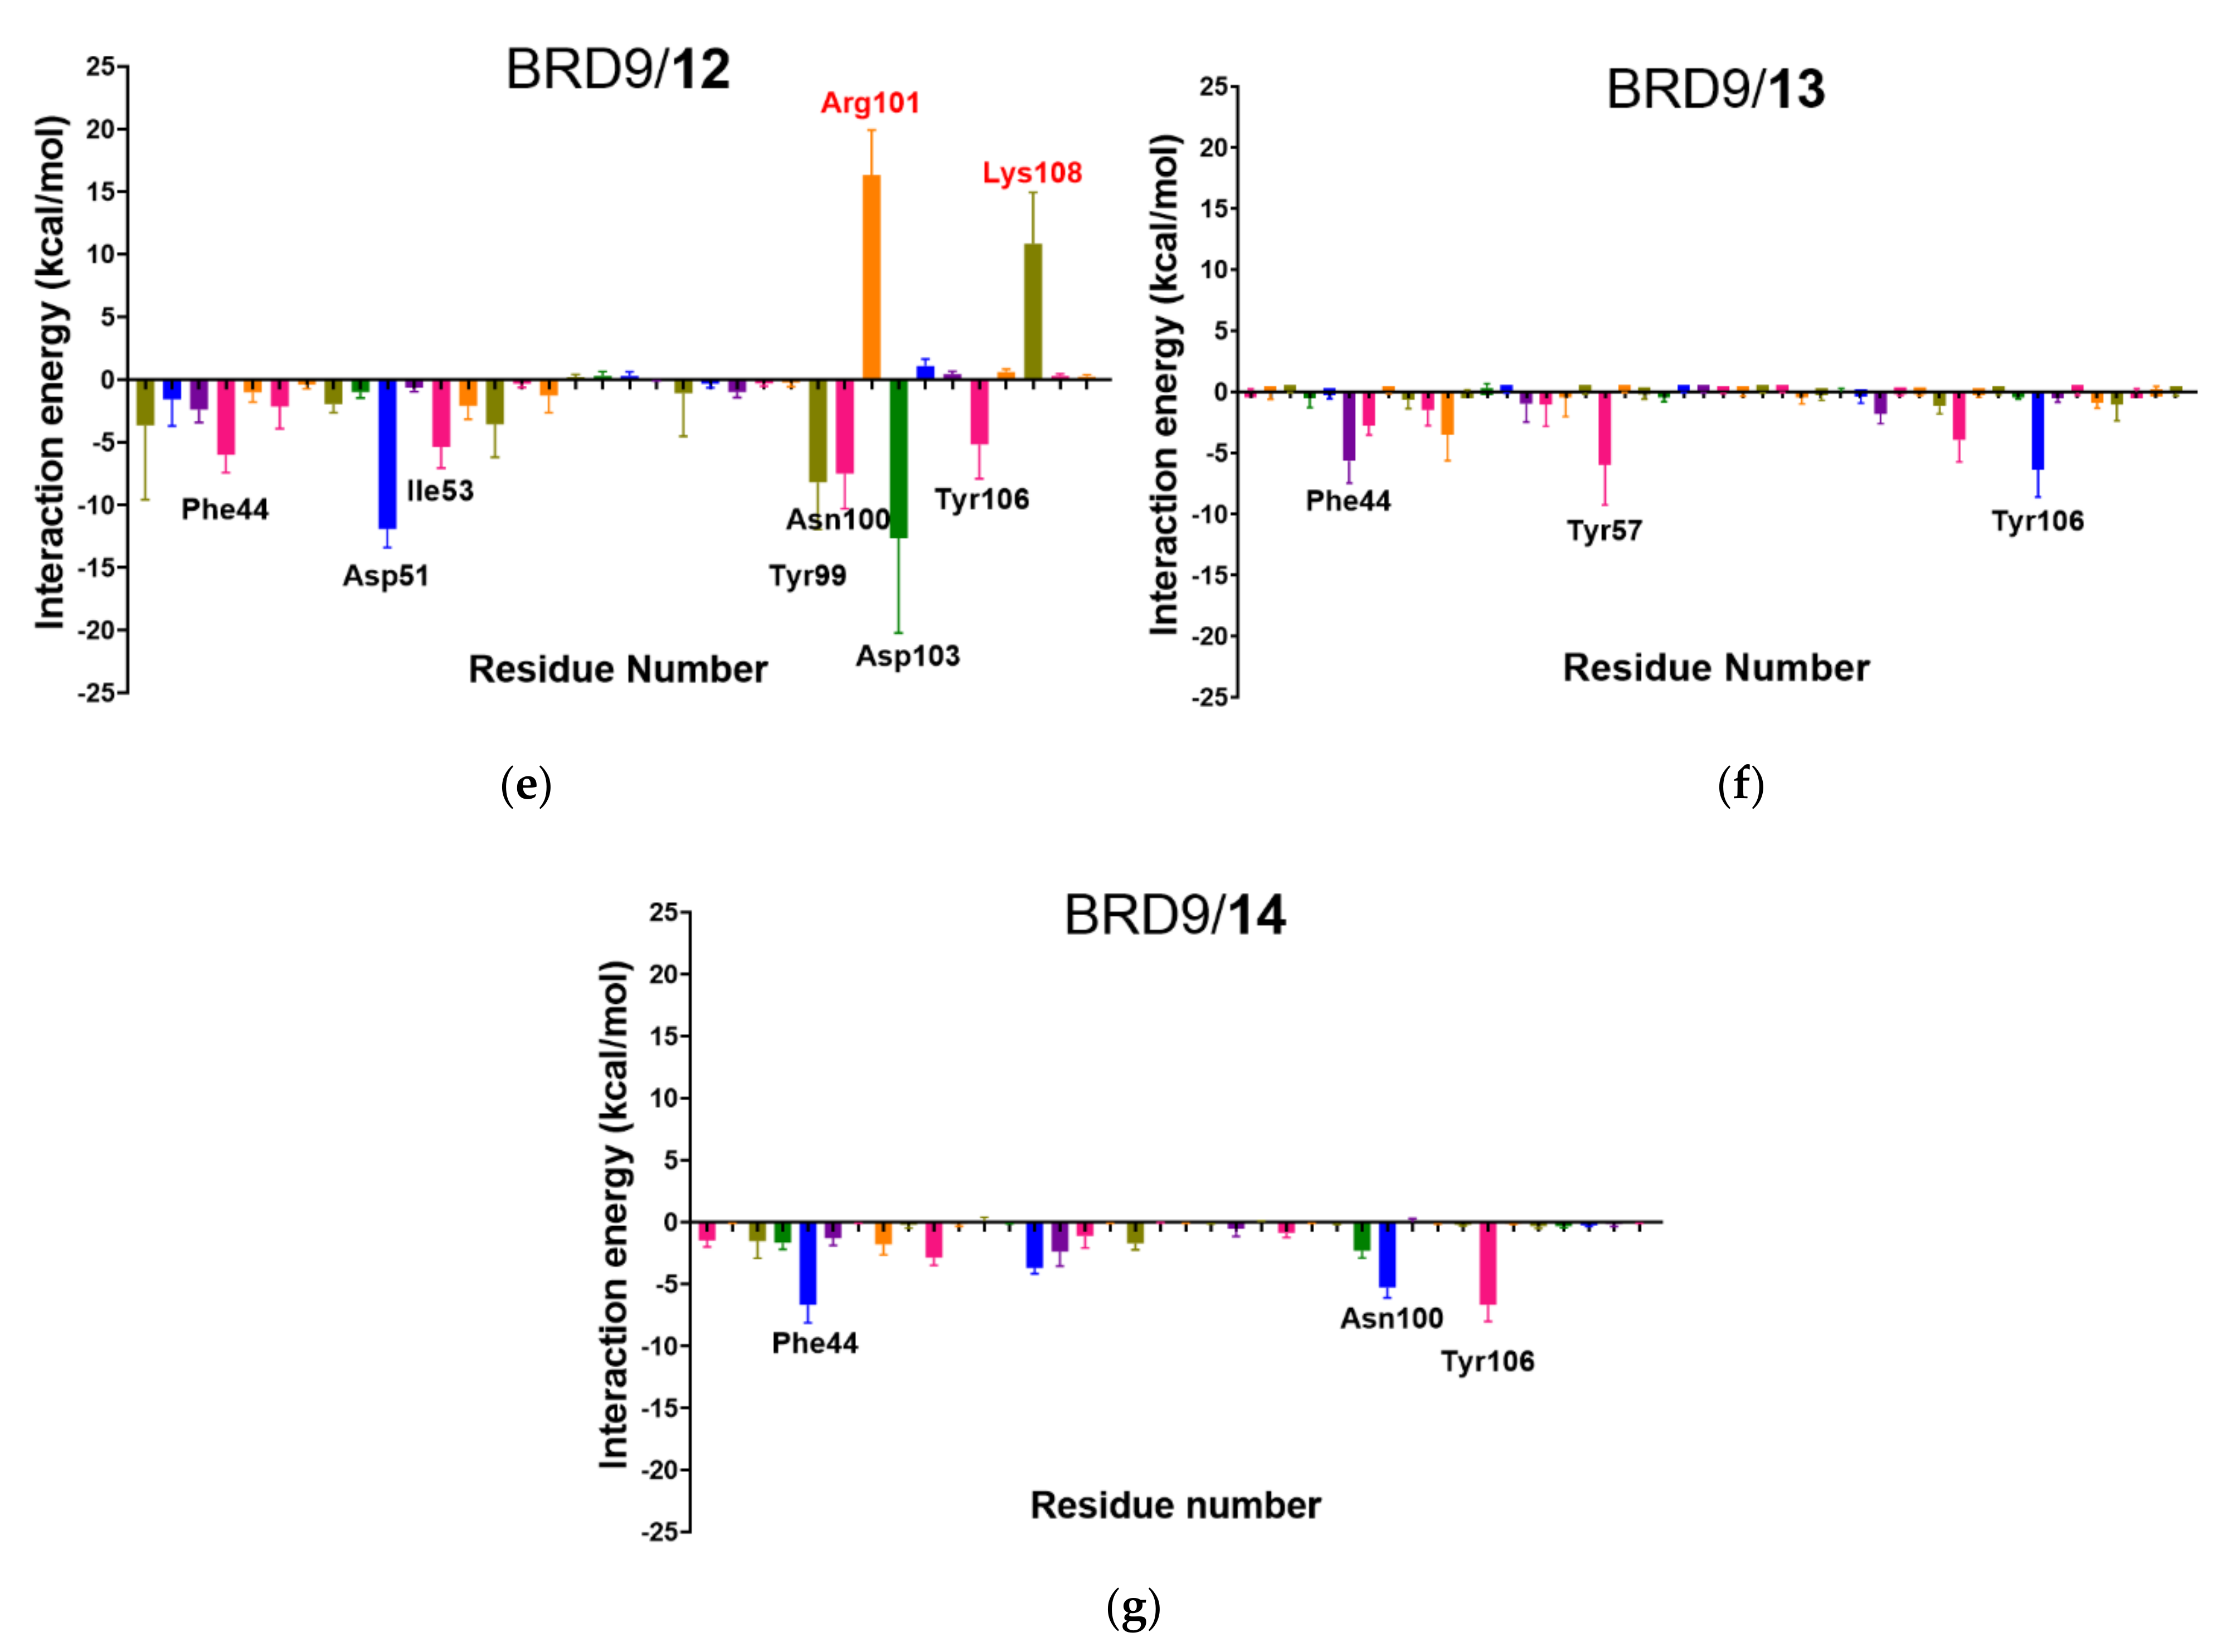
2.6. Per-Residue Interaction
2.7. Summarizing All the Data Analysis
- The docking score, the MM-GBSA energy, per-residue total energy, and per-residue binding site energy are colored according to their value, i.e., the best value in green (i.e., −9.3 kcal/mol), the worst (i.e., −4.4 kcal/mol) in red, and the others in green-to-red gradient.
- The number of interactions reported represents the amount of key binding site residues that interact with the ligand for at least 50% of the total time. Good values are above or equal to 3.
- The RMSD is classified according to the average value of the apo structure (2.79 Å). Values below 2.6 Å are considered good, values between 2.6 and 3.0 Å are considered intermediate because they resemble the unbound state of the protein, and values above 3.0 Å are classified as bad ones.
- The RMSF column reports the binding site residues with an average fluctuation value above 4.0 Å. If more than 2 residues show this behavior, the parameter is considered not favorable.
- The radius of gyration is discriminated according to the width of the apo-BRD9 curve (0.72 Å). Values below this threshold are considered positive.
- if the MM-GBSA, the per-residue contributions (both total and binding site), and the interactions are favorable, the compound considered is in the top part of the ranking (“Good” in Table 6).
- If the per-residue contributions are not satisfactory, but the overall interactions are encouraging, the compound is likely to belong to the middle part of the ranking (“Intermediate” in Table 6).
- Despite the MM-GBSA value, if both the per-residue contributions and the interactions made are not sufficient, the compound is placed among the worst in the final ranking (“Bad” in Table 6).
2.8. Test Set
3. Discussion
4. Materials and Methods
4.1. Structure Selection and Preparation
4.2. Redocking, Molecular Docking Experiments, and Ensemble Docking
4.3. Systems Setup
4.4. Molecular Dynamics
4.5. Per-Residue Interaction Analysis
4.6. MM-GBSA
5. Conclusions
Supplementary Materials
Author Contributions
Funding
Institutional Review Board Statement
Informed Consent Statement
Data Availability Statement
Conflicts of Interest
Sample Availability
References
- Hui, M.; Jian, Z.; Peiyuan, Z.; Zhenwei, W.; Huibin, Z. Research progress of selective small molecule bromodomain-containing protein 9 inhibitors. Future Med. Chem. 2018, 10, 895–906. [Google Scholar] [CrossRef]
- Kouzarides, T. Acetylation: A regulatory modification to rival phosphorylation? EMBO J. 2000, 19, 1176–1179. [Google Scholar] [CrossRef]
- Prabakaran, S.; Lippens, G.; Steen, H.; Gunawardena, J. Post-translational modification: Nature’s escape from genetic imprisonment and the basis for dynamic information encoding. WIREs Sys. Biol. Med. 2012, 4, 565–583. [Google Scholar] [CrossRef] [Green Version]
- Drazic, A.; Myklebust, L.M.; Ree, R.; Arnesen, T. The world of protein acetylation. Biochim. Biophys. Acta 2016, 1864, 1372–1401. [Google Scholar] [CrossRef] [Green Version]
- Tamkun, J.W.; Deuring, R.; Scott, M.P.; Kissinger, M.; Pattatucci, A.M.; Kaufman, T.C.; Kennison, J.A. Brahma: A regulator of Drosophila homeotic genes structurally related to the yeast transcriptional activator SNF2SWI2. Cell 1992, 68, 561–572. [Google Scholar] [CrossRef]
- Mohrmann, L.; Verrijzer, C.P. Composition and functional specificity of SWI2/SNF2 class chromatin remodeling complexes. Biochim. Biophys. Acta 2005, 1681, 59–73. [Google Scholar] [CrossRef]
- Corona, D.F.V.; Tamkun, J.W. Multiple roles for ISWI in transcription, chromosome organization and DNA replication. Biochim. Biophys. Acta 2004, 1677, 113–119. [Google Scholar] [CrossRef] [PubMed]
- Marfella, C.G.A.; Imbalzano, A.N. The Chd family of chromatin remodelers. Mutat. Res. 2007, 618, 30–40. [Google Scholar] [CrossRef] [PubMed] [Green Version]
- Bao, Y.; Shen, X. INO80 subfamily of chromatin remodeling complexes. Mutat. Res. 2007, 618, 18–29. [Google Scholar] [CrossRef] [Green Version]
- Clapier, C.R.; Cairns, B.R. The biology of chromatin remodeling complexes. Annu. Rev. Biochem. 2009, 78, 273–304. [Google Scholar] [CrossRef]
- Karim, R.M.; Chan, A.; Zhu, J.-Y.; Schönbrunn, E. Structural basis of inhibitor selectivity in the BRD7/9 subfamily of bromodomains. J. Med. Chem. 2020, 63, 3227–3237. [Google Scholar] [CrossRef] [PubMed]
- Kadoch, C.; Hargreaves, D.C.; Hodges, C.; Elias, L.; Ho, L.; Ranish, J.; Crabtree, G.R. Proteomic and bioinformatic analysis of mammalian SWI/SNF complexes identifies extensive roles in human malignancy. Nat. Genet. 2013, 45, 592–601. [Google Scholar] [CrossRef] [PubMed]
- Wang, Y.; Wang, L.F.; Zhang, L.L.; Sun, H.B.; Zhao, J. Molecular mechanism of inhibitor bindings to bromodomain-containing protein 9 explored based on molecular dynamics simulations and calculations of binding free energies. SAR QSAR Environ. Res. 2020, 31, 149–170. [Google Scholar] [CrossRef] [PubMed]
- Su, J.; Liu, X.; Zhang, S.; Yan, F.; Zhang, Q.; Chen, J. Insight into selective mechanism of class of I-BRD9 inhibitors toward BRD9 based on molecular dynamics simulations. Chem. Biol. Drug Des. 2019, 93, 163–176. [Google Scholar] [CrossRef] [PubMed]
- Martin, L.J.; Koegl, M.; Bader, G.; Cockcroft, X.-L.; Fedorov, O.; Fiegen, D.; Gerstberger, T.; Hofmann, M.H.; Hohmann, A.F.; Kessler, D.; et al. Structure-based design of an in vivo active selective BRD9 inhibitor. J. Med. Chem. 2016, 59, 4462–4475. [Google Scholar] [CrossRef]
- Picaud, S.; Strocchia, M.; Terracciano, S.; Lauro, G.; Mendez, J.; Daniels, D.L.; Riccio, R.; Bifulco, G.; Bruno, I.; Filippakopoulos, P. 9H-purine scaffold reveals induced-fit pocket plasticity of the BRD9 bromodomain. J. Med. Chem. 2015, 58, 2718–2736. [Google Scholar] [CrossRef]
- Hay, D.A.; Rogers, C.M.; Fedorov, O.; Tallant, C.; Martin, S.; Monteiro, O.P.; Müller, S.; Knapp, S.; Schofield, C.J.; Brennan, P.E. Design and synthesis of potent and selective inhibitors of BRD7 and BRD9 bromodomains. MedChemComm 2015, 6, 1381–1386. [Google Scholar] [CrossRef] [Green Version]
- Theodoulou, N.H.; Bamborough, P.; Bannister, A.J.; Becher, I.; Bit, R.A.; Che, K.H.; Chung, C.-w.; Dittmann, A.; Drewes, G.; Drewry, D.H.; et al. Discovery of I-BRD9, a selective cell active chemical probe for bromodomain containing protein 9 inhibition. J. Med. Chem. 2016, 59, 1425–1439. [Google Scholar] [CrossRef] [PubMed] [Green Version]
- Clark, P.G.K.; Vieira, L.C.C.; Tallant, C.; Fedorov, O.; Singleton, D.C.; Rogers, C.M.; Monteiro, O.P.; Bennett, J.M.; Baronio, R.; Müller, S.; et al. LP99: Discovery and synthesis of the first selective BRD7/9 bromodomain inhibitor. Angew. Chem. 2015, 54, 6217–6221. [Google Scholar] [CrossRef] [Green Version]
- Flynn, E.M.; Huang, O.W.; Poy, F.; Oppikofer, M.; Bellon, S.F.; Tang, Y.; Cochran, A.G. A subset of human bromodomains recognizes butyryllysine and crotonyllysine histone peptide modifications. Structure 2015, 23, 1801–1814. [Google Scholar] [CrossRef] [Green Version]
- Picaud, S.; Leonards, K.; Lambert, J.-P.; Dovey, O.; Wells, C.; Fedorov, O.; Monteiro, O.; Fujisawa, T.; Wang, C.-Y.; Lingard, H.; et al. Promiscuous targeting of bromodomains by bromosporine identifies BET proteins as master regulators of primary transcription response in leukemia. Sci. Adv. 2016, 2, e1600760. [Google Scholar] [CrossRef] [Green Version]
- Borea, P.A.; Varani, K.; Gessi, S.; Gilli, P.; Dalpiaz, A. Receptor binding thermodynamics as a tool for linking drug efficacy and affinity. Farmaco 1998, 53, 249–254. [Google Scholar] [CrossRef]
- Amaro, R.E.; Baudry, J.; Chodera, J.; Demir, Ö.; McCammon, J.A.; Miao, Y.; Smith, J.C. Ensemble docking in drug discovery. Biophys. J. 2018, 114, 2271–2278. [Google Scholar] [CrossRef] [Green Version]
- Wang, E.; Sun, H.; Wang, J.; Wang, Z.; Liu, H.; Zhang, J.Z.H.; Hou, T. End-point binding free energy calculation with MM/PBSA and MM/GBSA: Strategies and applications in drug design. Chem. Rev. 2019, 119, 9478–9508. [Google Scholar] [CrossRef] [PubMed]
- Jacobson, M.P.; Friesner, R.A.; Xiang, Z.; Honig, B. On the role of the crystal environment in determining protein side-chain conformations. J. Mol. Biol. 2002, 320, 597–608. [Google Scholar] [CrossRef]
- Jacobson, M.P.; Pincus, D.L.; Rapp, C.S.; Day, T.J.F.; Honig, B.; Shaw, D.E.; Friesner, R.A. A hierarchical approach to all-atom protein loop prediction. Proteins Struct. Funct. Bioinform. 2004, 55, 351–367. [Google Scholar] [CrossRef] [Green Version]
- Schrödinger Release 2020-1. In Prime; Schrödinger, LLC.: New York, NY, USA, 2020.
- Schrödinger Release 2020-1. In Glide; Schrödinger, LLC.: New York, NY, USA, 2020.
- Friesner, R.A.; Banks, J.L.; Murphy, R.B.; Halgren, T.A.; Klicic, J.J.; Mainz, D.T.; Repasky, M.P.; Knoll, E.H.; Shelley, M.; Perry, J.K.; et al. Glide: a new approach for rapid, accurate docking and scoring. 1. method and assessment of docking accuracy. J. Med. Chem. 2004, 47, 1739–1749. [Google Scholar] [CrossRef]
- Friesner, R.A.; Murphy, R.B.; Repasky, M.P.; Frye, L.L.; Greenwood, J.R.; Halgren, T.A.; Sanschagrin, P.C.; Mainz, D.T. Extra Precision Glide: Docking and scoring incorporating a model of hydrophobic enclosure for protein—Ligand complexes. J. Med. Chem. 2006, 49, 6177–6196. [Google Scholar] [CrossRef] [PubMed] [Green Version]
- Halgren, T.A.; Murphy, R.B.; Friesner, R.A.; Beard, H.S.; Frye, L.L.; Pollard, W.T.; Banks, J.L. Glide: A new approach for rapid, accurate docking and scoring. 2. enrichment factors in database screening. J. Med. Chem. 2004, 47, 1750–1759. [Google Scholar] [CrossRef]
- Schrödinger Release 2020-1. In Protein Preparation Wizard; Schrödinger, LLC.: New York, NY, USA, 2020.
- Schrödinger Release 2020-1. In Desmond Molecular Dynamics System, D.E. Shaw Research, New York, NY, 2020. Maestro-Desmond Interoperability Tools; Schrödinger, LLC.: New York, NY, USA, 2020.
- Bowers, K.J.; Chow, E.; Xu, H.; Dror, R.O.; Eastwood, M.P.; Gregersen, B.A.; Klepeis, J.L.; Kolossvary, I.; Moraes, M.A.; Sacerdoti, F.D.; et al. Scalable Algorithms for Molecular Dynamics Simulations on Commodity Clusters. In SC′06: Proceedings of the 2006 ACM/IEEE conference on Supercomputing, Tampa, FL, USA, 11–17 November 2006; Association for Computing Machineryl: New York, NY, USA, 2006; p. 84. [Google Scholar] [CrossRef]


| System (Ligand) | Experimental Data | Calculated Data | |||||
|---|---|---|---|---|---|---|---|
| KD (µM) | Experimental Binding Affinity (kcal/mol) | Calculated Binding Affinity (kcal/mol) | MM-GBSA (kcal/mol) | ||||
| MD1 | MD2 | MD3 | Av. | ||||
| 4UIW (1) | 0.002 | −11.9 | −9.0 | −81.7 | −85.3 | −96.4 | −87.8 |
| 5F1H (5) | 0.014 | −10.7 | −9.2 | −75.7 | −75.7 | −72.4 | −74.7 |
| 5IGM (6) | 0.042 | −10.1 | −6.7 | −71.1 | −71.1 | −71.1 | −71.1 |
| 5E9V (4) | 0.070 | −9.8 | −4.8 | −51.5 | −47.7 | −52.2 | −50.4 |
| 6V14 (8) | 0.082 | −9.7 | −8.3 | −69.1 | −64.4 | −64.0 | −65.9 |
| 4XY8 (2) | 0.397 | −8.7 | −9.3 | −43.5 | −51.3 | −39.3 | −44.7 |
| 4Z6I (3) | 0.493 | −8.6 | −7.9 | −54.2 | −78.5 | −76.9 | −69.9 |
| 6V0S (7) | 16 | −6.5 | −4.5 | −25.6 | −45.6 | −43.4 | −38.2 |
| RMSD | |||||||||
|---|---|---|---|---|---|---|---|---|---|
| Apo | 4UIW | 4XY8 | 4Z6I | 5E9V | 5F1H | 5IGM | 6V0S | 6V14 | |
| MD1 | 2.53 | 2.07 | 4.25 | 2.75 | 3.12 | 1.94 | 2.77 | 1.83 | 2.41 |
| MD2 | 3.45 | 2.56 | 3.73 | 2.63 | 2.67 | 1.82 | 2.41 | 3.02 | 1.87 |
| MD3 | 2.40 | 1.89 | 4.17 | 3.44 | 3.16 | 2.87 | 2.48 | 3.39 | 2.12 |
| Av. | 2.79 | 2.17 | 4.05 | 2.94 | 2.98 | 2.21 | 2.55 | 2.74 | 2.13 |
| System | Frames of the Apo Form that Resemble the Crystal Structure | ||
|---|---|---|---|
| N° Apo Frames | Percentage on 192 Frames | Percentage on 3000 Frames | |
| 4UIW | 3 | 2% | 0.001% |
| 4XY8 | 8 | 4% | 0.003% |
| 4Z6I | 7 | 4% | 0.002% |
| 5E9V | 26 | 14% | 0.009% |
| 5F1H | 20 | 10% | 0.007% |
| 5IGM | 15 | 8% | 0.005% |
| 6V0S | 53 | 28% | 0.018% |
| 6V14 | 8 | 4% | 0.003% |
| System | Amino Acids with Mean RMSF above 4 Å |
|---|---|
| Apo | Phe47, Thr50, Asp51, Ala52, Ile53, Ala54, Pro55, Met59, Ile60, Lys62 |
| 4UIW | / |
| 4XY8 | Asp51, Ala52, Ile53 |
| 4Z6I | Ala52, Ile53, Pro55, Lys62 |
| 5E9V | Met59 |
| 5F1H | / |
| 5IGM | Ala52 |
| 6V0S | Ala52 |
| 6V14 | / |
| Rg Statistics | |||||||||
|---|---|---|---|---|---|---|---|---|---|
| Apo | 4UIW | 4XY8 | 4Z6I | 5E9V | 5F1H | 5IGM | 6V0S | 6V14 | |
| Minimum | 13.7 | 13.8 | 14.9 | 14.6 | 14.6 | 14.5 | 14.5 | 14.5 | 13.8 |
| Maximum | 14.4 | 14.5 | 16.0 | 15.2 | 15.9 | 15.0 | 15.1 | 15.1 | 14.5 |
| Range | 0.72 | 0.70 | 1.15 | 0.66 | 1.27 | 0.47 | 0.63 | 0.58 | 0.72 |
| Mean | 14.0 | 14.1 | 15.4 | 14.9 | 15.1 | 14.8 | 14.8 | 14.7 | 14.1 |
| Std. Dev. | 0.105 | 0.116 | 0.203 | 0.130 | 0.196 | 0.074 | 0.125 | 0.092 | 0.122 |
| System (Ligand) | Molecular Docking Parameters | Molecular Dynamics Parameters | Prediction | |||||||
|---|---|---|---|---|---|---|---|---|---|---|
| Docking Score | Interactions a | MM-GBSA | Per-Residue Binding Site b | Per-Residue Totalc | Interactions d | RMSD e | RMSF f | Rg g | ||
| 4UIW (1) | −7.6 | 8 | −87.80 | −29.13 | −62.96 | 5 | 2.17 | 0 | 0.7 | Excellent |
| 5F1H (5) | −9.2 | 7 | −74.73 | −15.20 | −56.43 | 3 | 2.21 | 0 | 0.47 | Good |
| 5IGM (6) | −6.7 | 7 | −71.09 | −20.48 | −20.48 | 3 | 2.55 | 0 | 0.63 | Good |
| 5E9V (4) | −4.8 | 7 | −50.44 | 1.61 | −32.19 | 0 | 2.98 | 0 | 1.27 | Intermediate |
| 6V14 (9) | −8.3 | 7 | −65.86 | −20.57 | −20.57 | 2 | 2.13 | 0 | 0.72 | Intermediate |
| 4XY8 (2) | −9.3 | 7 | −44.67 | 0.00 | 0.00 | 1 | 4.05 | 1 | 1.15 | Bad |
| 4Z6I (3) | −7.9 | 8 | −69.85 | −13.99 | −13.99 | 2 | 2.94 | 2 | 0.66 | Intermediate |
| 6V0S (7) | −4.5 | 7 | −38.17 | 5.55 | −12.45 | 1 | 2.74 | 0 | 0.58 | Bad |
| Complex | Experimental Data | Calculated Data | ||
|---|---|---|---|---|
| KD (µM) | Experimental Binding Affinity (kcal/mol) | Calculated Binding Affinity (kcal/mol) | MM-GBSA ΔGbind | |
| 9 | 0.0094 | −10.9 | −9.4 | −78.88 |
| 10a | 0.099 | −9.6 | −5.3 | −52.01 |
| 10b | −5.2 | −70.70 | ||
| 11 | 1.01 | −8.2 | −7.4 | −70.41 |
| 12 | 17.0 | −6.5 | −5.9 | −76.08 |
| 13 | / | / | −5.7 | −58.69 |
| 14 | / | / | −7.9 | −64.27 |
| System (Ligand) | Molecular Docking Parameters | Molecular Dynamics Parameters | Prediction | |||||||
|---|---|---|---|---|---|---|---|---|---|---|
| Docking Score | Interactions a | MM-GBSA | Per-Residue Binding Site b | Per-Residue Total c | Interactions d | RMSD e | RMSF f | Rg g | ||
| 9 | −9.4 | 8 | −78.88 | −17.67 | −61.60 | 4 | 2.97 | 0 | 0.69 | Excellent |
| 10a | −5.3 | 7 | −52.01 | −5.88 | −13.00 | 0 | 3.25 | 0 | 0.90 | Bad |
| 10b | −3.8 | 6 | −70.70 | −17.36 | −17.36 | 3 | 2.19 | 0 | 0.75 | Good |
| 11 | −7.4 | 7 | −70.41 | −13.66 | −13.66 | 3 | 3.35 | 0 | 1.00 | Intermediate |
| 12 | −5.9 | 9 | −76.08 | −15.37 | −29.07 | 4 | 3.23 | 1 | 0.86 | Good |
| 13 | −5.7 | 8 | −58.69 | −12.03 | −17.96 | 2 | 3.32 | 0 | 0.94 | Bad |
| 14 | −7.9 | 8 | −64.27 | −18.56 | −18.56 | 3 | 3.15 | 2 | 1.01 | Bad |
Publisher’s Note: MDPI stays neutral with regard to jurisdictional claims in published maps and institutional affiliations. |
© 2021 by the authors. Licensee MDPI, Basel, Switzerland. This article is an open access article distributed under the terms and conditions of the Creative Commons Attribution (CC BY) license (https://creativecommons.org/licenses/by/4.0/).
Share and Cite
De Vita, S.; Chini, M.G.; Bifulco, G.; Lauro, G. Insights into the Ligand Binding to Bromodomain-Containing Protein 9 (BRD9): A Guide to the Selection of Potential Binders by Computational Methods. Molecules 2021, 26, 7192. https://doi.org/10.3390/molecules26237192
De Vita S, Chini MG, Bifulco G, Lauro G. Insights into the Ligand Binding to Bromodomain-Containing Protein 9 (BRD9): A Guide to the Selection of Potential Binders by Computational Methods. Molecules. 2021; 26(23):7192. https://doi.org/10.3390/molecules26237192
Chicago/Turabian StyleDe Vita, Simona, Maria Giovanna Chini, Giuseppe Bifulco, and Gianluigi Lauro. 2021. "Insights into the Ligand Binding to Bromodomain-Containing Protein 9 (BRD9): A Guide to the Selection of Potential Binders by Computational Methods" Molecules 26, no. 23: 7192. https://doi.org/10.3390/molecules26237192
APA StyleDe Vita, S., Chini, M. G., Bifulco, G., & Lauro, G. (2021). Insights into the Ligand Binding to Bromodomain-Containing Protein 9 (BRD9): A Guide to the Selection of Potential Binders by Computational Methods. Molecules, 26(23), 7192. https://doi.org/10.3390/molecules26237192