
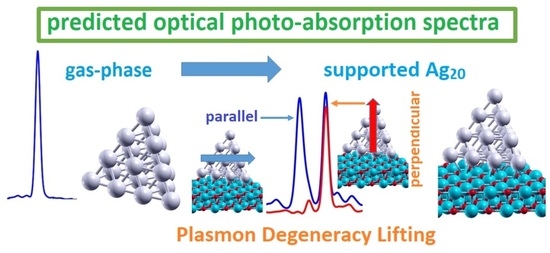
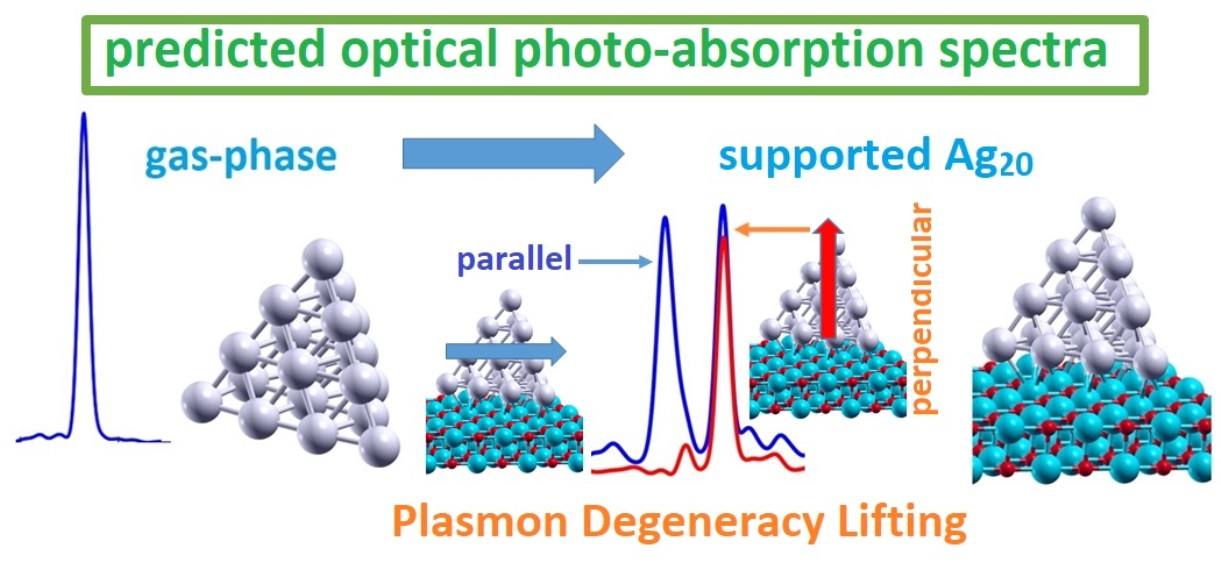
Optical Activity of Metal Nanoclusters Deposited on Regular and Doped Oxide Supports from First-Principles Simulations


Abstract
:
1. Introduction
2. Results and Discussion
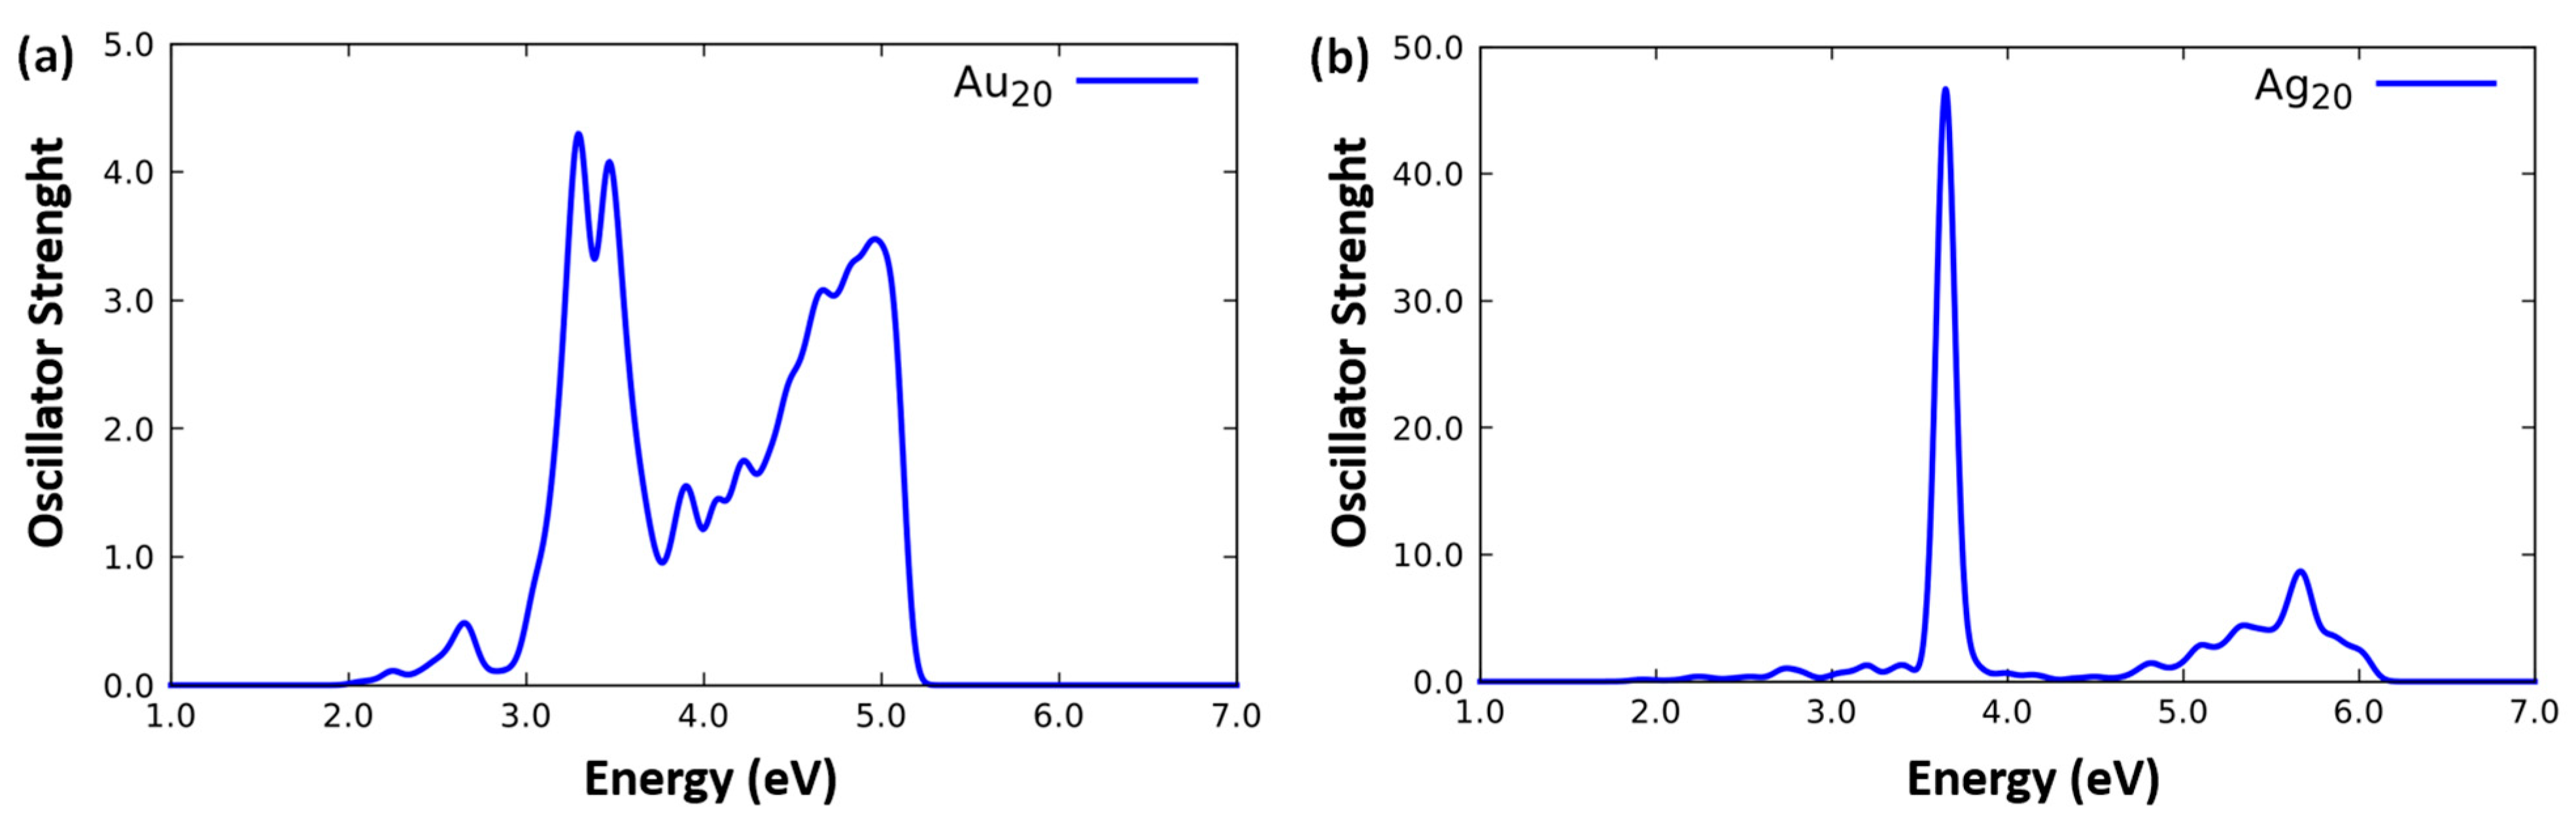
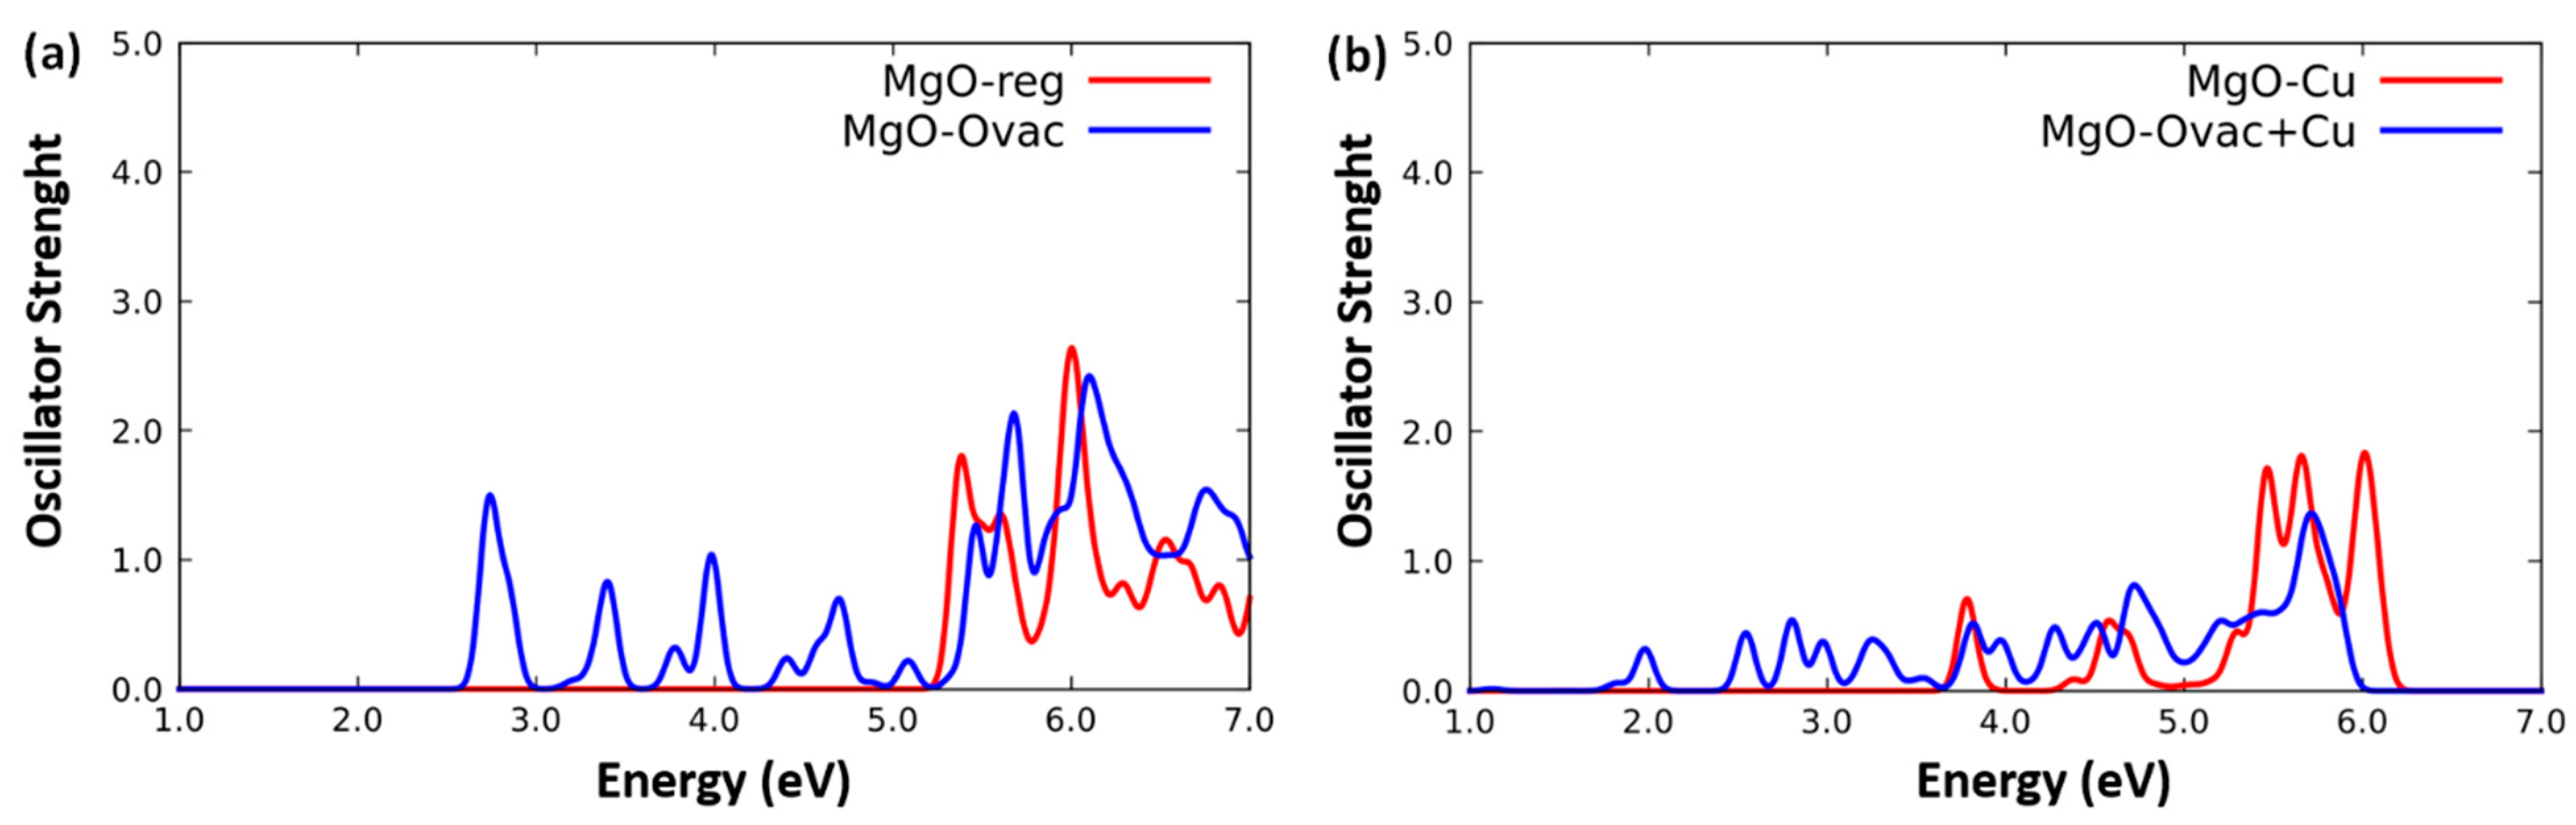
2.1. Optical Response of the Fragment Systems
- Ag20,
- Au20,
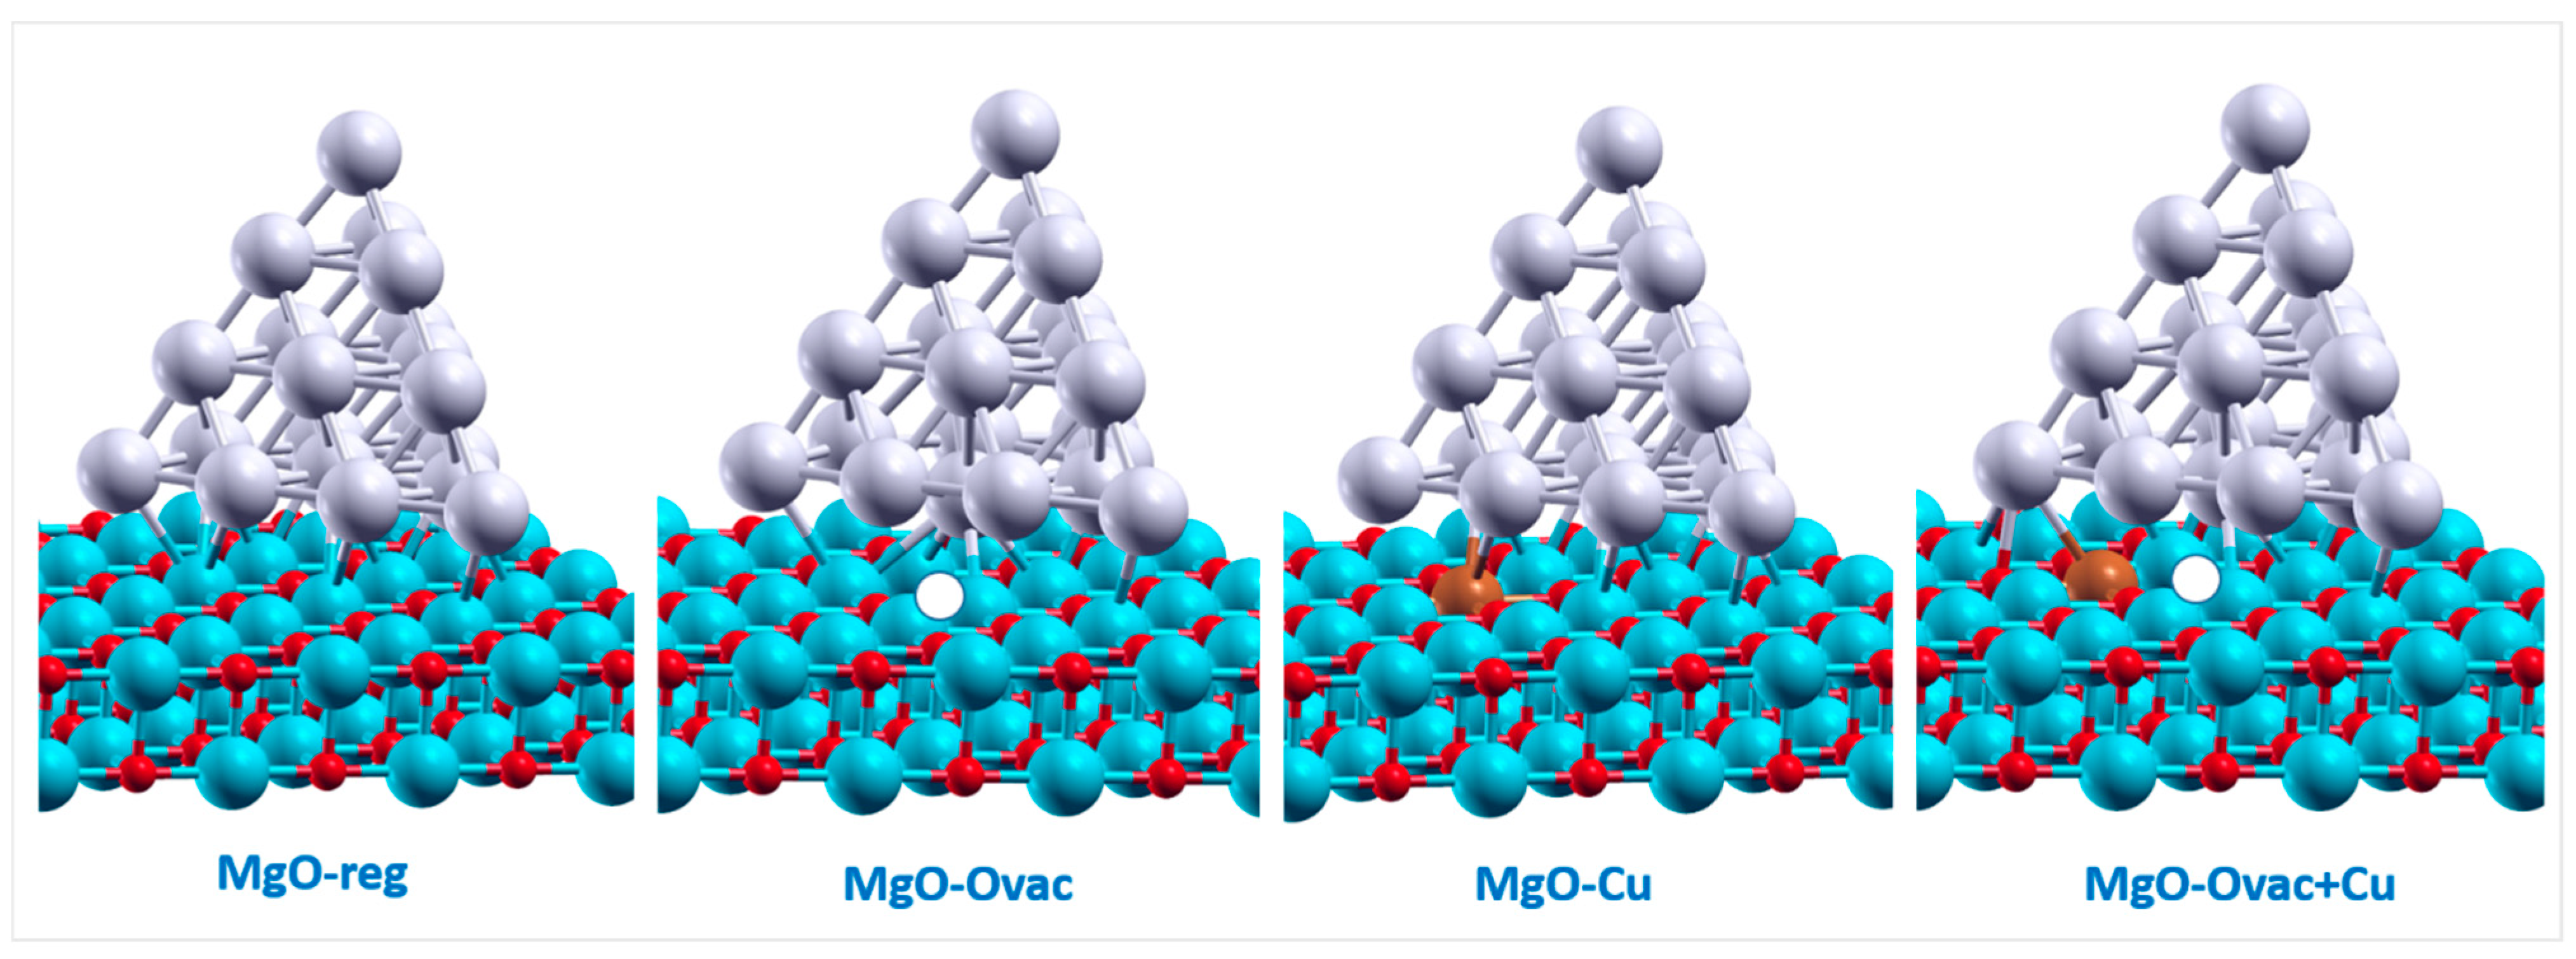
- MgO(100)-reg, i.e., the non-defected MgO(100) surface,
- MgO(100)-Ovac, i.e., MgO(100) exhibiting an oxygen vacancy at the surface,
- MgO(100)-Cu, i.e., MgO(100) with one Mg2+ cation replaced by one Cu2+ cation,
- MgO(100)-Ovac+Cu, i.e., MgO(100) with an O-vacancy next to a Cu2+ substitution,
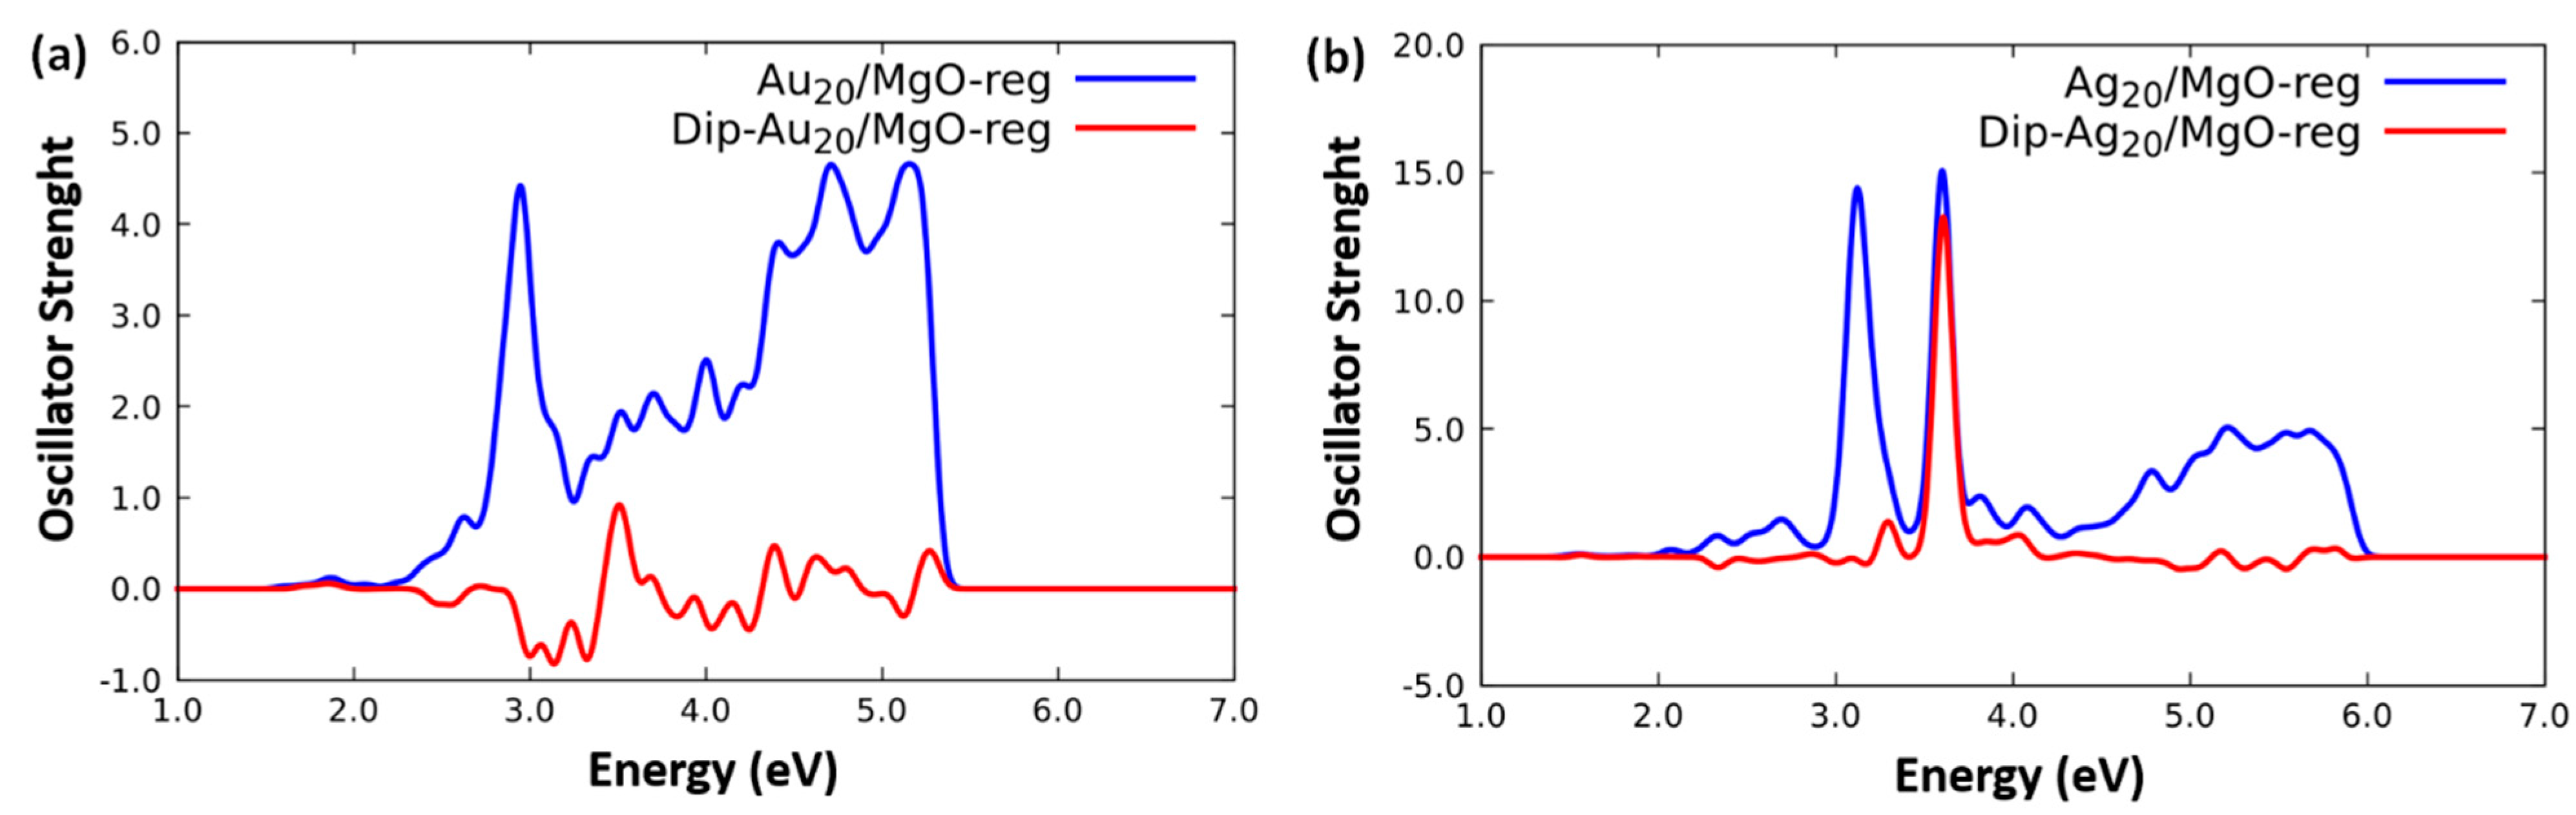
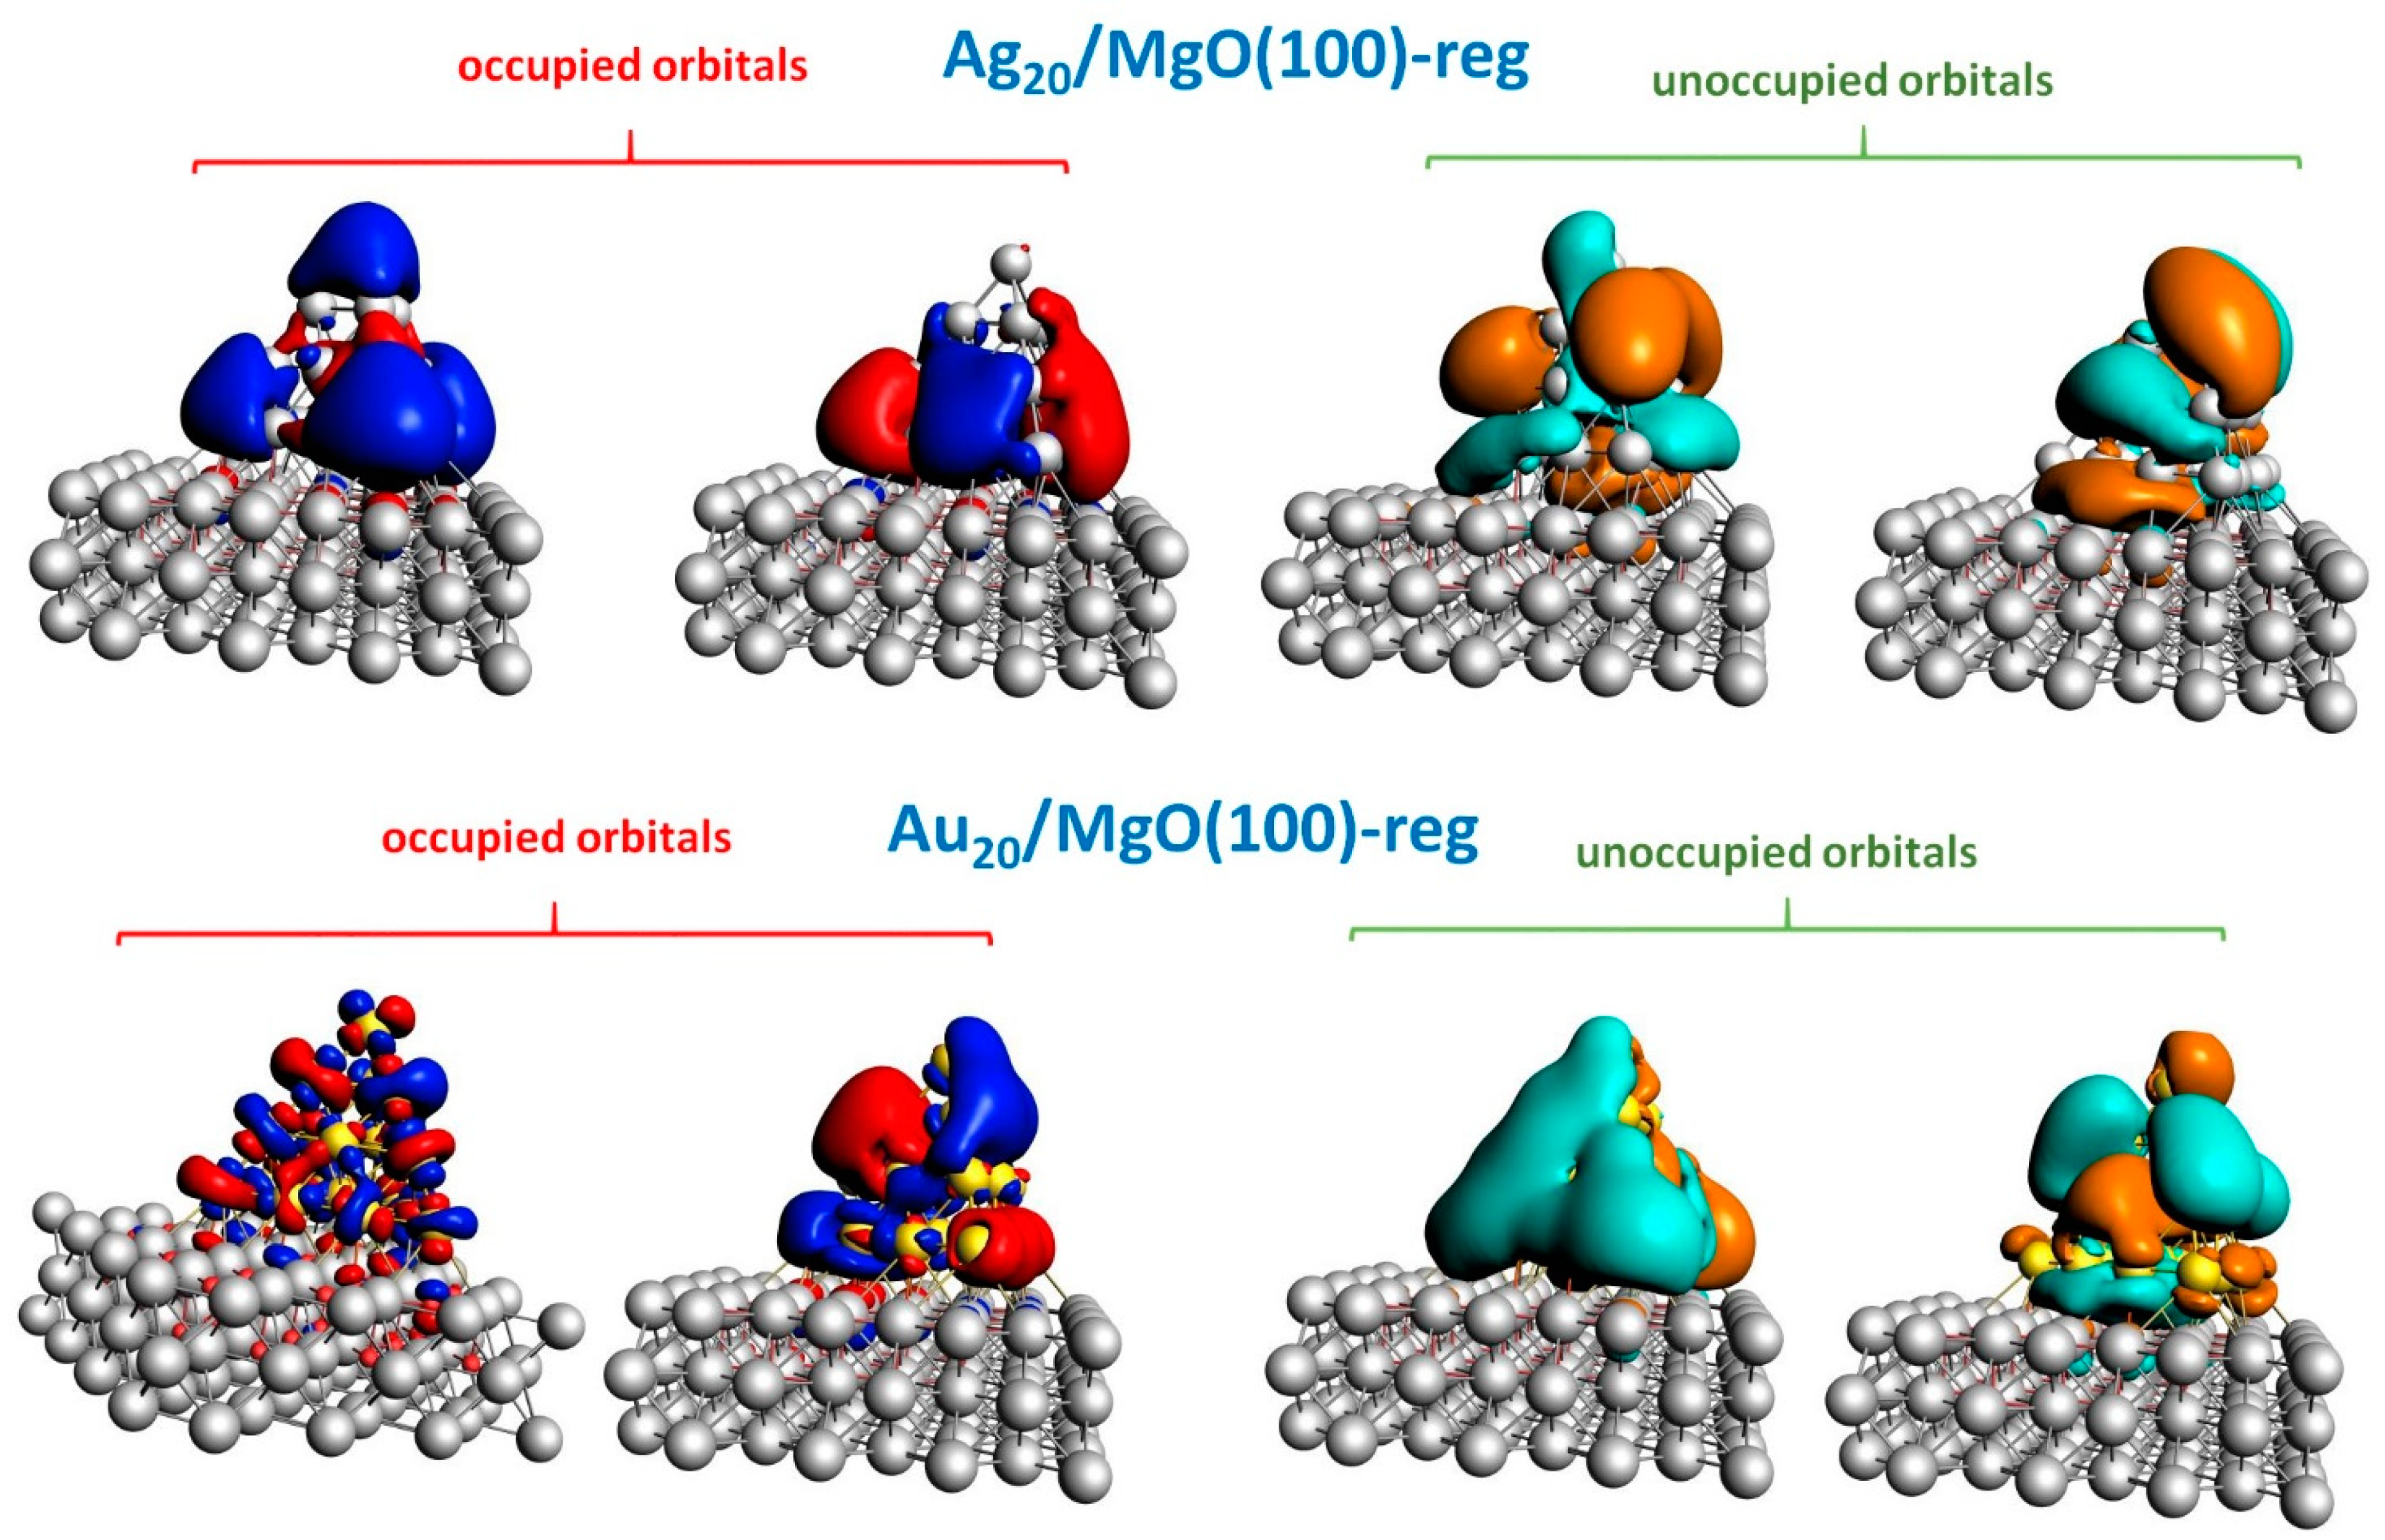
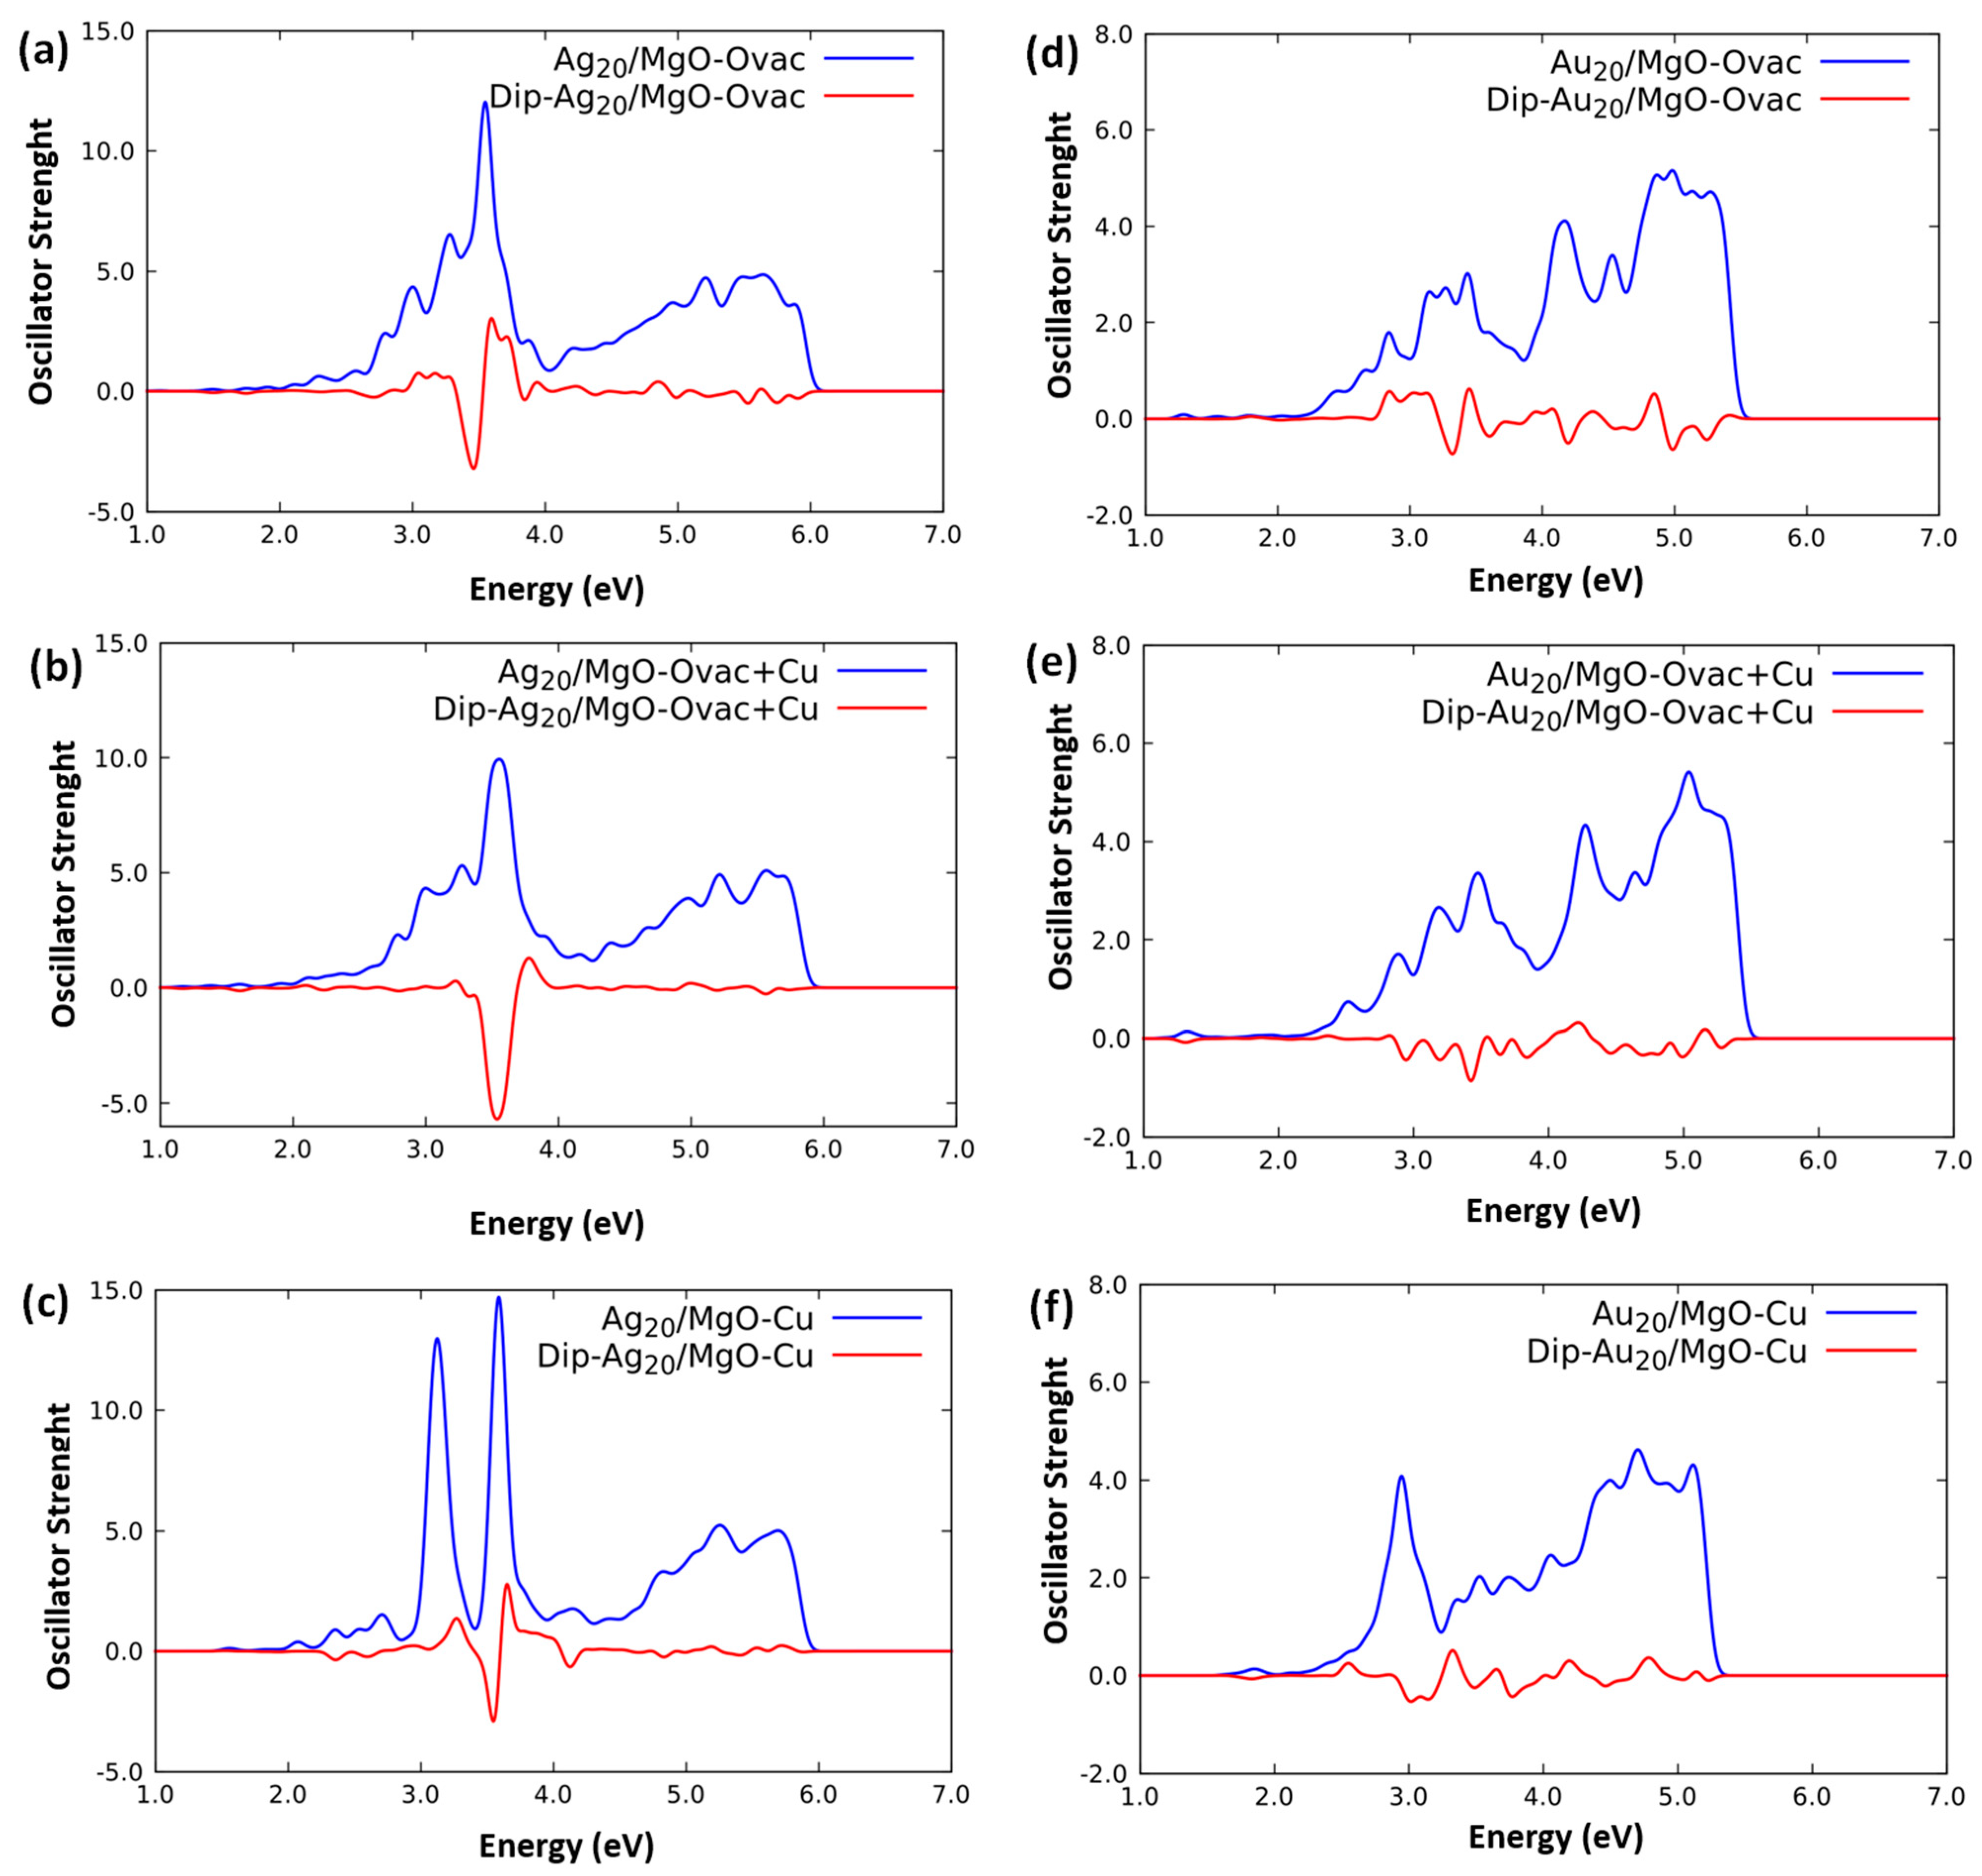
2.2. Optical Response of Cluster/Substrate Systems
- Ag20/MgO(100)-reg,
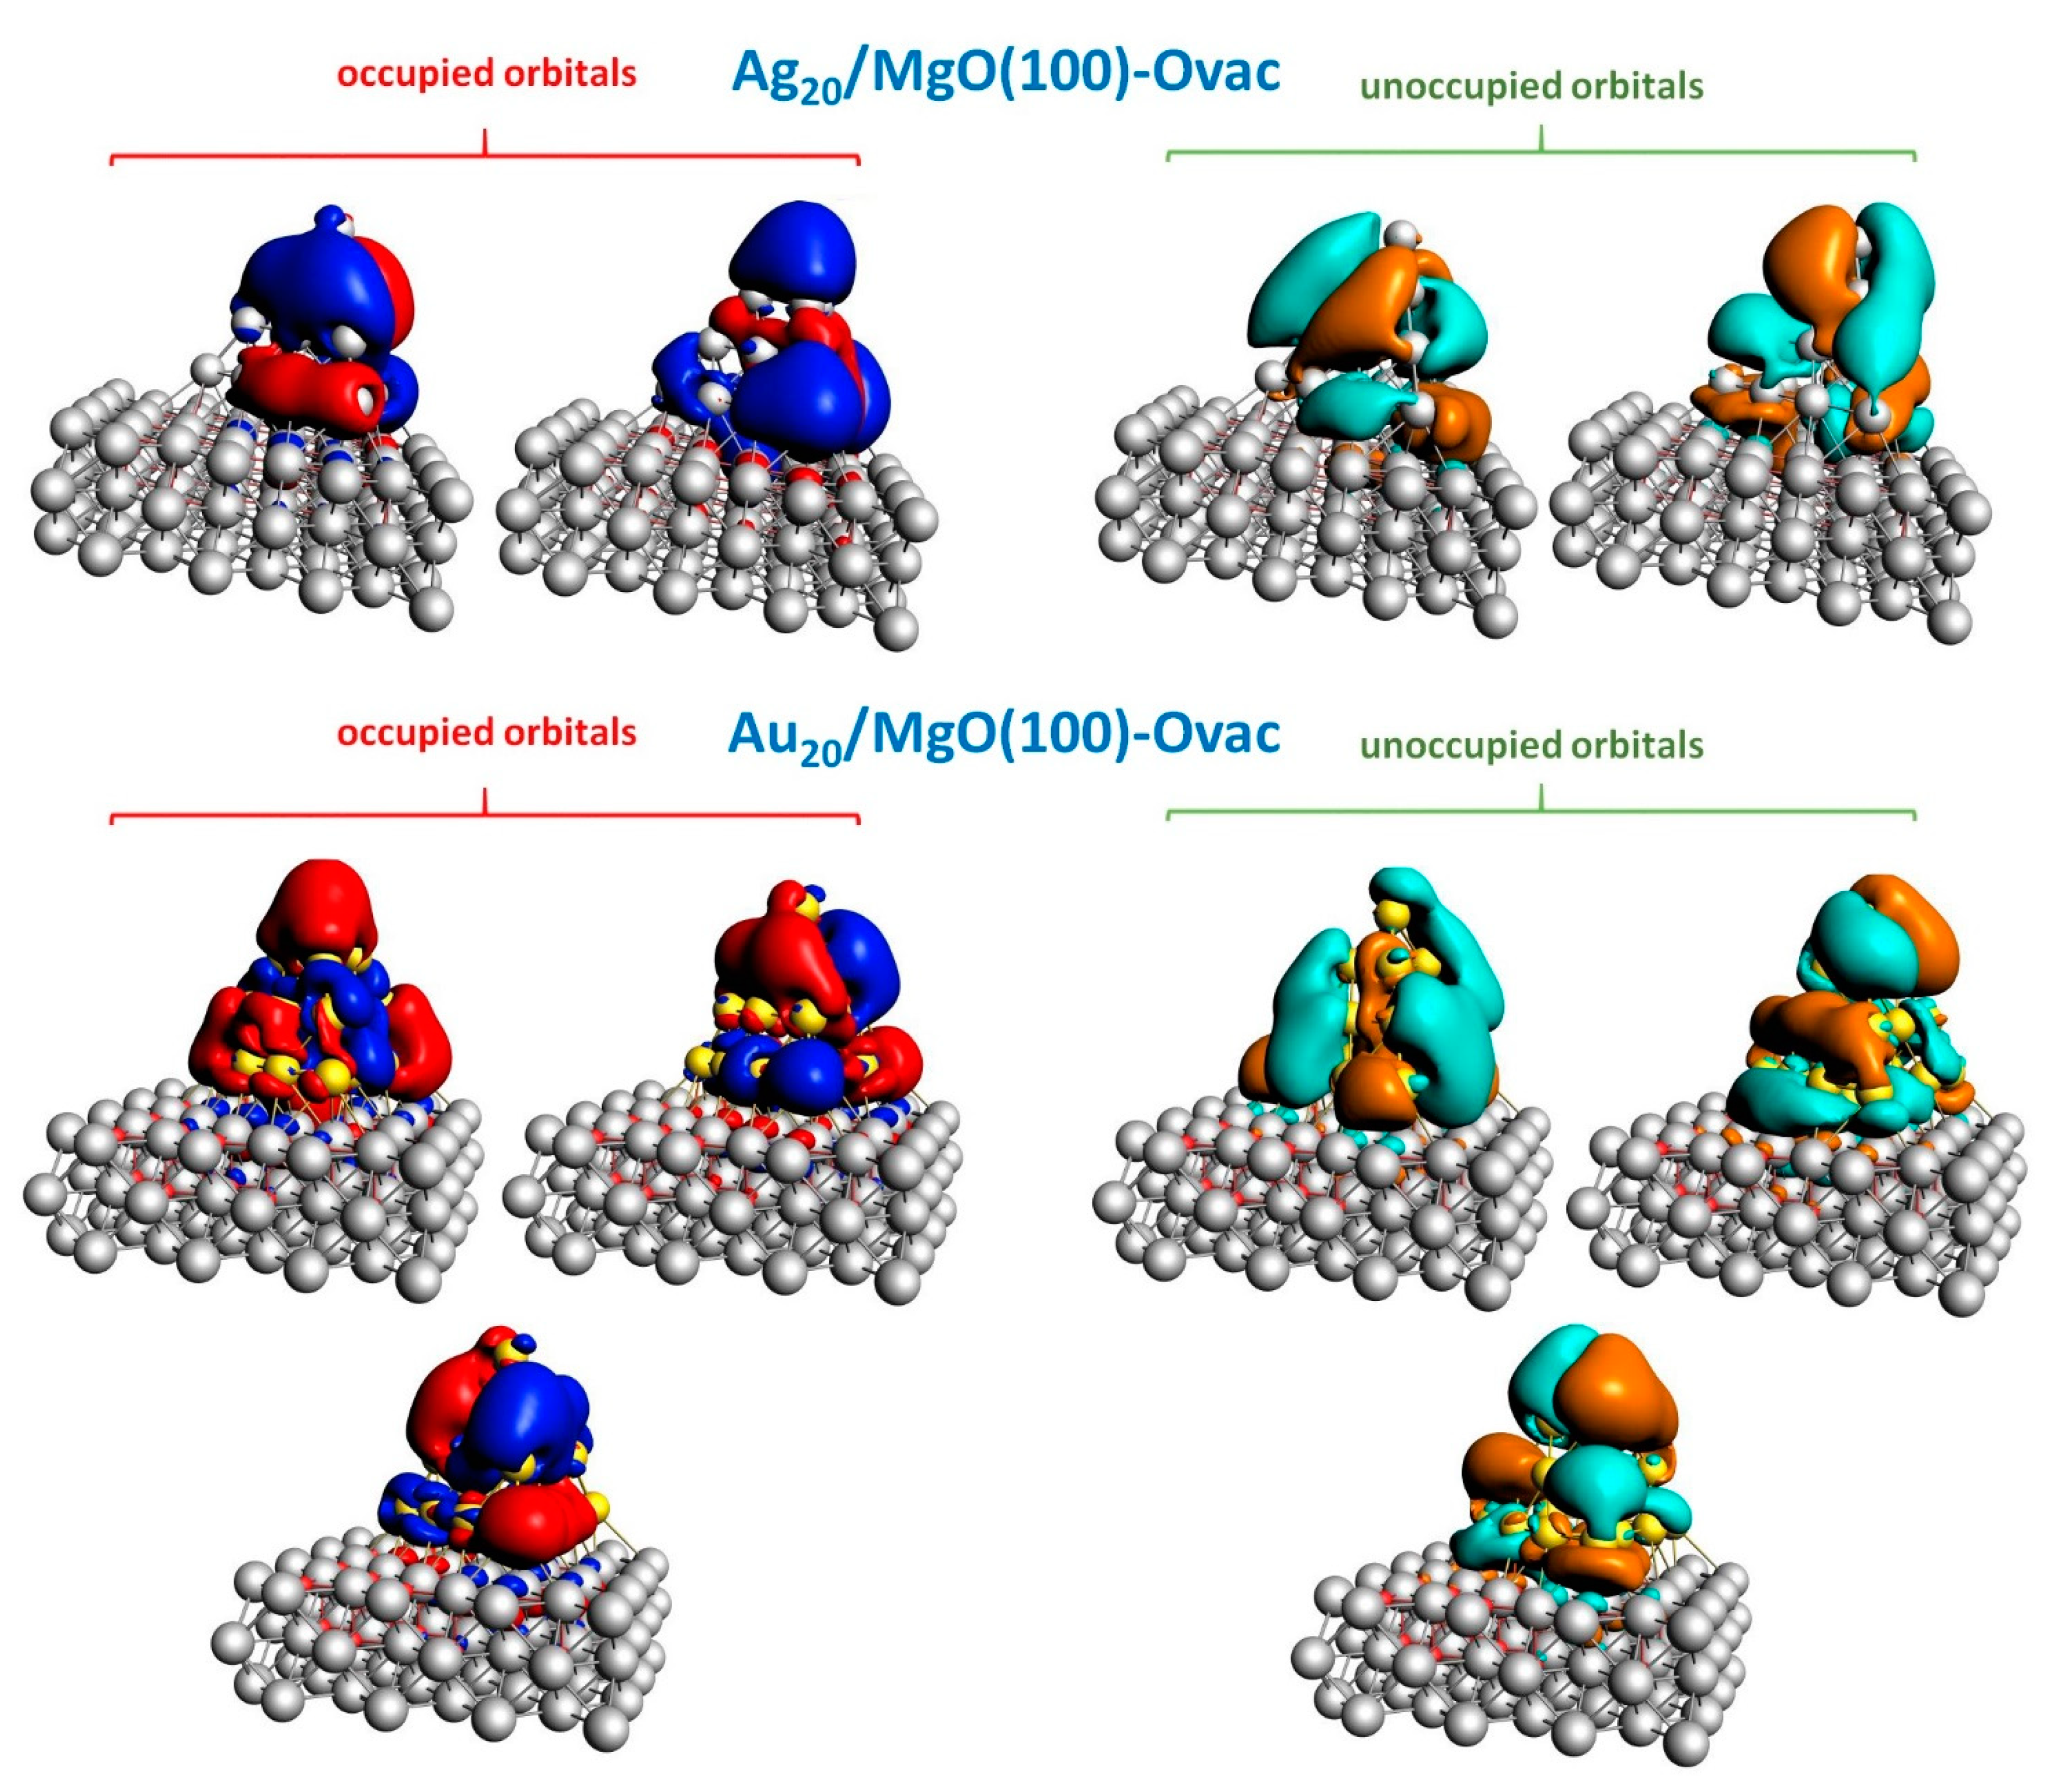
- Ag20/MgO(100)-Ovac,
- Ag20/MgO(100)-Cu,
- Ag20/MgO(100)-Ovac+Cu,
- Au20/MgO(100)-reg,
- Au20/MgO(100)-Ovac,
- Ag20/MgO(100)-Cu,
- Ag20/MgO(100)-Ovac+Cu.
3. Materials and Methods
4. Conclusions
Supplementary Materials
Author Contributions
Funding
Institutional Review Board Statement
Informed Consent Statement
Data Availability Statement
Acknowledgments
Conflicts of Interest
Sample Availability
References
- GEA. Global Energy Assessment-Toward a Sustainable Future; Cambridge University Press: Cambridge, UK, 2012; ISBN 9781107005198. [Google Scholar]
- Goetzberger, A.; Knobloch, J.; Voß, B. Crystalline Silicon Solar Cells; Wiley: New York, NY, USA, 2014; ISBN 9781119033769. [Google Scholar] [CrossRef]
- Watanabe, K.; Menzel, D.; Nilius, N.; Freund, H.-J. Photochemistry on Metal Nanoparticles. Chem. Rev. 2006, 106, 4301–4320. [Google Scholar] [CrossRef]
- Shimura, K.; Yoshida, H. Heterogeneous Photocatalytic Hydrogen Production from Water and Biomass Derivatives. Energy Environ. Sci. 2011, 4, 2467–2481. [Google Scholar] [CrossRef]
- Murdoch, M.; Waterhouse, G.I.N.; Nadeem, M.A.; Metson, J.B.; Keane, M.A.; Howe, R.F.; Llorca, J.; Idriss, H. The Effect of Gold Loading and Particle Size on Photocatalytic Hydrogen Production from Ethanol over Au/TiO2 Nanoparticles. Nat. Chem. 2011, 3, 489–492. [Google Scholar] [CrossRef] [PubMed]
- Montini, T.; Gombac, V.; Sordelli, L.; Delgado, J.J.; Chen, X.W.; Adami, G.; Fornasiero, P. Nanostructured Cu/TiO2 Photocatalysts for H2 Production from Ethanol and Glycerol Aqueous Solutions. Chem. Cat. Chem. 2011, 3, 574–577. [Google Scholar] [CrossRef]
- Letfullin, R.R.; George, T.F. Plasmonic nanomaterials for nanomedicine. In Springer Handbook: Nanomaterials; Vajtai, R., Ed.; Springer: Berlin, Germany, 2013. [Google Scholar]
- Su, R.; Tiruvalam, R.; Logsdail, A.J.; He, Q.; Downing, C.A.; Jensen, M.T.; Dimitratos, N.; Kesavan, L.; Wells, P.P.; Bechstein, R.; et al. Designer Titania-Supported Au-Pd Nanoparticles for Efficient Photocatalytic Hydrogen Production. ACS Nano 2014, 8, 3490–3497. [Google Scholar] [CrossRef] [PubMed]
- Low, J.; Yu, J.; Ho, W. Graphene-Based Photocatalysts for CO2 Reduction to Solar Fuel. J. Phys. Chem. Lett. 2015, 6, 4244–4251. [Google Scholar] [CrossRef]
- Hoffmann, N. Photochemical Reactions as Key Steps in Organic Synthesis. Chem. Rev. 2008, 108, 1052–1103. [Google Scholar] [CrossRef]
- Kreibig, K.; Vollmer, M. Optical Properties of Metal Clusters; Springer: New York, NY, USA, 1995. [Google Scholar]
- Linic, S.; Christopher, P.; Ingram, D.B. Plasmonic-metal nanostructures for efficient conversion of solar to chemical energy. Nat. Mat. 2011, 10, 911–921. [Google Scholar] [CrossRef] [PubMed]
- Berestok, T.; Guardia, P.; Portals, J.B.; Estrade, S.; Llorca, J.; Peiro, F.; Cabot, A.; Brock, S.L. Surface Chemistry and Nano-/Microstructure Engineering on Photocatalytic In2S3 Nanocrystals. Langmuir 2018, 34, 6470–6479. [Google Scholar] [CrossRef] [Green Version]
- Gratzel, M. Dye-sensitized solar cells. J. Photochem. Photobiol. C 2003, 4, 145–153. [Google Scholar] [CrossRef]
- Lünskens, T.; Heister, P.; Thämer, M.; Walenta, C.A.; Kartouzian, A.; Heiz, U. Plasmons in supported size-selected silver nanoclusters. Phys. Chem. Chem. Phys. 2015, 17, 17541–17544. [Google Scholar] [CrossRef] [PubMed] [Green Version]
- Marhaba, S.; Bachelier, G.; Bonnet, C.; Broyer, M.; Cottancin, E.; Grillet, N.; Lermé, J.; Vialle, J.-L.; Pellarin, M. Surface Plasmon Resonance of Single Gold Nanodimers near the Conductive Contact Limit. J. Phys. Chem. C 2009, 113, 4349–4356. [Google Scholar] [CrossRef]
- Logsdail, A.J.; Cookson, N.J.; Johnston, R.L. Theoretical and Experimental Studies of the Optical Properties of Conjoined Gold-Palladium Nanospheres. J. Phys. Chem. C 2010, 114, 21247–21251. [Google Scholar] [CrossRef]
- Fortunelli, A.; Stener, M. Optical Properties of Metal Nanoclusters—Theory. In Encyclopedia of Interfacial Chemistry: Surface Science and Electrochemistry; Elsevier: New York, NY, USA, 2018. [Google Scholar] [CrossRef]
- López-Caballero, P.; Ramallo-López, J.M.; Giovanetti, L.J.; Buceta, D.; Miret-Artés, S.; López-Quintela, M.A.; Requejo, F.G.; de Lara-Castells, M.P. Exploring the properties of Ag5-TiO2 interfaces: Stable surface polaron formation, UV-Vis optical response, and CO2 photoactivation. J. Mater. Chem. A 2020, 8, 6842–6853. [Google Scholar] [CrossRef] [Green Version]
- Luque-Ceballos, J.C.; Sementa, L.; Aprà, E.; Fortunelli, A.; Posada-Amarillas, A. TDDFT Study of the Optical Spectra of Free and Supported Binary Coinage Metal Hexamers: Effect of Doping and Support. J. Phys. Chem. C 2018, 122, 23143–23152. [Google Scholar] [CrossRef]
- Wendt, S.; Kim, Y.D.; Goodman, D.W. Identification of defect sites on oxide surfaces by metastable impact electron spectroscopy. Progr. Surf. Sci. 2003, 74, 141–159. [Google Scholar] [CrossRef]
- Zhao, L.J.; Schatz, G.C. Pyridine-Ag20 Cluster: A Model System for Studying Surface-Enhanced Raman Scattering. J. Am. Chem. Soc. 2006, 128, 2911–2919. [Google Scholar] [CrossRef] [PubMed]
- Giannone, G.; Śmiga, S.; D’Agostino, S.; Fabiano, E.; Della Sala, F. Plasmon Couplings from Subsystem Time-Dependent Density Functional Theory. J. Phys. Chem. A 2021, 125, 7246–7259. [Google Scholar] [CrossRef]
- Yu, C.Q.; Harbich, W.; Sementa, L.; Ghiringhelli, L.; Apra, E.; Stener, M.; Fortunelli, A.; Brune, H. Intense Fluorescence of Au20. J. Chem. Phys. 2017, 147, 099901. [Google Scholar] [CrossRef] [Green Version]
- Harb, M.; Rabilloud, F.; Simon, D.; Rydlo, A.; Lecoultre, S.; Conus, F.; Rodrigues, V.; Felix, C. Optical absorption of small silver clusters: Ag(n), (n = 4–22). J. Chem. Phys. 2008, 129, 194108. [Google Scholar] [CrossRef]
- Heo, S.; Cho, E.; Lee, H.-I.; Park, G.S.; Kang, H.J.; Nagatomi, T.; Choi, P.; Choi, B.D. Band gap and defect states of MgO thin films investigated using reflection electron energy loss spectroscopy. AIP Adv. 2015, 5, 077167. [Google Scholar] [CrossRef]
- Medves, M.; Sementa, L.; Toffoli, D.; Fronzoni, G.; Fortunelli, A.; Stener, M. An efficient hybrid scheme for time dependent density functional theory. J. Chem. Phys. 2020, 152, 184104. [Google Scholar] [CrossRef]
- Rinke, P.; Schleife, A.; Kioupakis, E.; Anderson Janotti, A.; Rödl, C.; Bechstedt, F.; Scheffler, M.; Van de Walle, C.G. First-Principles Optical Spectra for F-Centers in MgO. Phys. Rev. Lett. 2012, 108, 126404. [Google Scholar] [CrossRef] [Green Version]
- Barcaro, G.; Fortunelli, A. The Interaction of Coinage Metal Clusters with the MgO(100) Surface. J. Chem. Theory Comput. 2005, 1, 972–985. [Google Scholar] [CrossRef]
- Casida, M.E. Recent Advances in Density-Functional Methods; Chong, D.P., Ed.; World Scientific: Singapore, 1995; p. 155. [Google Scholar]
- Jacquemin, D.; Wathelet, V.; Perpète, E.A.; Adamo, C. Extensive TD-DFT Benchmark: Singlet-Excited States of Organic Molecules. J. Chem. Theory Comput. 2009, 5, 2420. [Google Scholar] [CrossRef] [PubMed]
- Onida, G.; Reining, L.; Rubio, A. Electronic excitations:Density-functional versus many-body Green’s-function approaches. Rev. Mod. Phys. 2002, 74, 601. [Google Scholar] [CrossRef] [Green Version]
- Adamo, C.; Barone, V. Toward reliable density functional methods without adjustable parameters: The PBE0 model. J. Chem. Phys. 1999, 110, 6158. [Google Scholar] [CrossRef]
- Barcaro, G.; Edoardo Aprà, E.; Fortunelli, A. Structure of Ag Clusters Grown on Fs-Defect Sites of an MgO(100) Surface. Chem. Eur. J. 2007, 13, 6408–6418. [Google Scholar] [CrossRef]
- Sementa, L.; Monti, M.; Toffoli, D.; Posada-Amarillas, A.; Stener, M.; Fortunelli, A. Theoretical Investigation of Photoinduced Processes in Subnanometer Oxide-Supported Metal Catalysts. J. Phys. Chem. C 2021, 125, 2022–2032. [Google Scholar] [CrossRef]
- Saunders, V.R.; Freyria-Fava, C.; Dovesi, R.; Salasco, L.; Roetti, C. On the electrostatic potential in crystalline systems where the charge density is expanded in Gaussian functions. Mol. Phys. 1992, 77, 629–665. [Google Scholar] [CrossRef]
- Sementa, L.; Barcaro, G.; Fortunelli, A. Analogy between homogeneous and heterogeneous catalysis by subnanometer metal clusters: Ethylene oxidation on Ag trimers supported on MgO(100). Inorg. Chim. Acta 2015, 431, 150–155. [Google Scholar] [CrossRef] [Green Version]
- Neese, F. The Orca Program System. Wiley Interdiscip. Rev. Comput. Mol. Sci. 2011, 2, 73–78. [Google Scholar] [CrossRef]
- Neese, F. Software update: The ORCA program system, version 4.0. Wiley Interdiscip. Rev. Comput. Mol. Sci. 2011, 8, e1327. [Google Scholar] [CrossRef]
- Baerends, E.J.; Ellis, D.E.; Ros, P. Self-consistent molecular Hartree—Fock—Slater calculations I. The computational procedure. Chem. Phys. 1973, 2, 41–51. [Google Scholar] [CrossRef]
- Fonseca Guerra, C.; Snijders, J.G.; te Velde, G.; Baerends, E.J. Towards an order-N DFT method. Theor. Chem. Acc. 1998, 99, 391–403. [Google Scholar] [CrossRef]
- Valiev, M.; Bylaska, E.J.; Govind, N.; Kowalski, K.; Straatsma, T.P.; van Dam, H.J.J.; Wang, D.; Nieplocha, J.; Aprà, E.; Windus, T.L.; et al. NWChem: A Comprehensive and Scalable Open-Source Solution for Large Scale Molecular Simulations. Comput. Phys. Commun. 2010, 181, 1477–1489. [Google Scholar] [CrossRef] [Green Version]
- Weigend, F.; Ahlrichs, R. Balanced basis sets of split valence, triple zeta valence and quadruple zeta valence quality for H to Rn: Design and assessment of accuracy. Phys. Chem. Chem. Phys. 2005, 7, 3297–3305. [Google Scholar] [CrossRef]
- Eichkorn, K.; Treutler, O.; Öhm, H.; Häser, M.; Ahlrichs, R. Auxiliary basis sets to approximate Coulomb potentials. Chem. Phys. Lett. 1995, 240, 283–290. [Google Scholar] [CrossRef]
- Izsák, R.; Neese, F. An overlap fitted chain of spheres exchange method. J. Chem. Phys. 2011, 135, 144105. [Google Scholar] [CrossRef]
- Hutter, J.; Iannuzzi, M.; Schiffmann, F.; VandeVondele, J. Cp2k: Atomistic Simulations of Condensed Matter Systems. Comput. Mol. Sci. 2014, 4, 15–25. [Google Scholar] [CrossRef] [Green Version]
- Perdew, J.P.; Burke, K.; Ernzerhof, M. Generalized Gradient Approximation Made Simple. Phys. Rev. Lett. 1996, 77, 3865–3868. [Google Scholar] [CrossRef] [Green Version]
- Grimme, S.; Antony, J.; Ehrlich, S.; Krieg, H. A Consistent and Accurate Ab Initio Parametrization of Density Functional Dispersion Correction (DFT-D) for the 94 Elements, H-Pu. J. Chem. Phys. 2010, 132, 154104. [Google Scholar] [CrossRef] [Green Version]
- VandeVondele, J.; Hutter, J. Gaussian Basis Sets for Accurate Calculations on Molecular Systems in Gas and Condensed Phases. J. Chem. Phys. 2007, 127, 114105. [Google Scholar] [CrossRef] [Green Version]
- Goedecker, S.; Teter, M.; Hutter, J. Separable Dual-Space Gaussian Pseudopotentials. Phys. Rev. B Condens. Matter Mater. Phys. 1996, 54, 1703–1710. [Google Scholar] [CrossRef] [Green Version]
- Paz-Borbón, L.O.; Barcaro, G.; Fortunelli, A.; Levchenko, S.V. AuN clusters (N = 1–6) supported on MgO(100) surfaces: Effect of exact exchange and dispersion interactions on adhesion energies. Phys. Rev. B 2012, 85, 155409. [Google Scholar] [CrossRef] [Green Version]
- Medves, M.; Sementa, L.; Toffoli, D.; Fronzoni, G.; Krishnadas, K.R.; Bürgi, T.; Bonacchi, S.; Dainese, T.; Maran, F.; Fortunelli, A.; et al. Predictive optical photoabsorption of Ag24Au(DMBT)18– via efficient TDDFT simulations. J. Chem. Phys. 2021, 155, 084103. [Google Scholar] [CrossRef] [PubMed]
- Theivendran, S.; Chang, L.; Mukherjee, A.; Sementa, L.; Stener, M.; Fortunelli, A.; Dass, A. Principles of optical spectroscopy of aromatic alloy nanomolecules: Au36–xAgx(SPhtBu)24. J. Phys. Chem. C 2018, 122, 4524–4531. [Google Scholar] [CrossRef]
- Chang, L.; Baseggio, O.; Sementa, L.; Cheng, D.; Fronzoni, G.; Toffoli, D.; Aprà, E.; Stener, M.; Fortunelli, A. Individual Component Map of Rotatory Strength and Rotatory Strength Density Plots As Analysis Tools of Circular Dichroism Spectra of Complex Systems. J. Chem. Theory Comput. 2018, 14, 3703–3714. [Google Scholar] [CrossRef] [PubMed]


Publisher’s Note: MDPI stays neutral with regard to jurisdictional claims in published maps and institutional affiliations. |
© 2021 by the authors. Licensee MDPI, Basel, Switzerland. This article is an open access article distributed under the terms and conditions of the Creative Commons Attribution (CC BY) license (https://creativecommons.org/licenses/by/4.0/).
Share and Cite
Sementa, L.; Stener, M.; Fortunelli, A. Optical Activity of Metal Nanoclusters Deposited on Regular and Doped Oxide Supports from First-Principles Simulations. Molecules 2021, 26, 6961. https://doi.org/10.3390/molecules26226961
Sementa L, Stener M, Fortunelli A. Optical Activity of Metal Nanoclusters Deposited on Regular and Doped Oxide Supports from First-Principles Simulations. Molecules. 2021; 26(22):6961. https://doi.org/10.3390/molecules26226961
Chicago/Turabian StyleSementa, Luca, Mauro Stener, and Alessandro Fortunelli. 2021. "Optical Activity of Metal Nanoclusters Deposited on Regular and Doped Oxide Supports from First-Principles Simulations" Molecules 26, no. 22: 6961. https://doi.org/10.3390/molecules26226961
APA StyleSementa, L., Stener, M., & Fortunelli, A. (2021). Optical Activity of Metal Nanoclusters Deposited on Regular and Doped Oxide Supports from First-Principles Simulations. Molecules, 26(22), 6961. https://doi.org/10.3390/molecules26226961