
The Occurrence and Contamination Level of Ochratoxin A in Plant and Animal-Derived Food Commodities


Abstract
: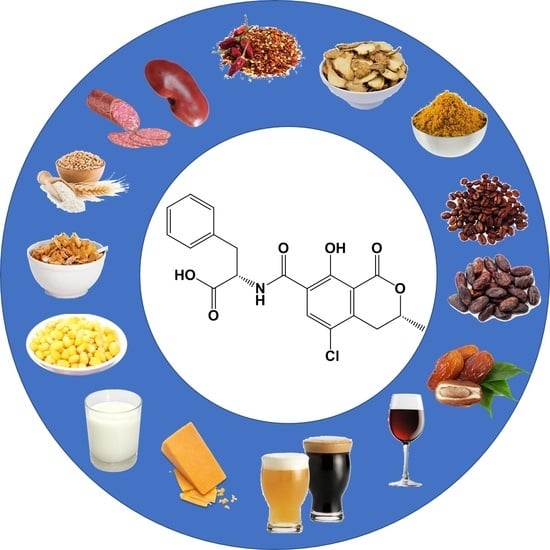
1. Introduction
2. Occurrence of OTA in Plant-Derived Food Commodities
2.1. OTA in Cereals
2.2. OTA in Wine
2.3. OTA in Coffee
2.4. OTA in Beer
2.5. OTA in Cocoa
2.6. OTA in Fruits and Nuts
2.7. OTA in Spices
3. Occurrence of OTA in Animal-Derived Food Commodities
3.1. OTA in Meat and Meat Products
3.2. OTA in Milk and Milk Products
4. Conclusions
Author Contributions
Funding
Institutional Review Board Statement
Informed Consent Statement
Conflicts of Interest
Abbreviations
| EC | European Commission |
| MRL | Maximum residue limit |
| OTA | Ochratoxin A |
References
- Li, X.; Li, H.; Li, X.; Zhang, Q. Determination of trace patulin in apple-based food matrices. Food Chem. 2017, 233, 290–301. [Google Scholar] [CrossRef] [PubMed]
- Silva, L.J.G.; Pereira, A.M.P.T.; Pena, A.; Lino, C.M. Citrinin in Foods and Supplements: A Review of Occurrence and Analytical Methodologies. Foods 2021, 10, 14. [Google Scholar] [CrossRef]
- Vanderme, K.J.; Steyn, P.S.; Fourie, L.; Scott, D.B.; Theron, J.J. Ochratoxin A, a Toxic Metabolite produced by Aspergillus ochraceus Wilh. Nature 1965, 205, 1112–1113. [Google Scholar] [CrossRef]
- Amézqueta, S.; González-Peñas, E.; Murillo-Arbizu, M.; López de Cerain, A. Ochratoxin A decontamination: A review. Food Control 2009, 20, 326–333. [Google Scholar] [CrossRef]
- European Food Safety Authority, Panel on Contaminants in the Food Chain; Schrenk, D.; Bodin, L.; Chipman, J.K.; del Mazo, J.; Grasl-Kraupp, B.; Hogstrand, C.; Hoogenboom, L.; Leblanc, J.-C.; Nebbia, C.S.; et al. Risk assessment of ochratoxin A in food. EFSA J. 2020, 18, e06113. [Google Scholar] [CrossRef]
- Pfohl-Leszkowicz, A.; Manderville, R.A. Ochratoxin A: An overview on toxicity and carcinogenicity in animals and humans. Mol. Nutr. Food Res. 2007, 51, 61–99. [Google Scholar] [CrossRef]
- Krogh, P.; Hald, B.; Pedersen, E.J. Occurrence of ochratoxin A and citrinin in cereals associated with mycotoxic porcine nephropathy. Acta Pathol. Microbiol. Scand. B Microbiol. Immunol. 1973, 81, 689–695. [Google Scholar] [CrossRef]
- Klingelhöfer, D.; Braun, M.; Schöffel, N.; Oremek, G.M.; Brüggmann, D.; Groneberg, D.A. Ochratoxin–Characteristics, influences and challenges of global research. Food Control 2020, 114, 107230. [Google Scholar] [CrossRef]
- Duarte, S.C.; Lino, C.M.; Pena, A. Food safety implications of ochratoxin A in animal-derived food products. Vet. J. 2012, 192, 286–292. [Google Scholar] [CrossRef]
- Soto, J.B.; Ruiz, M.-J.; Manyes, L.; Juan-Garcia, A. Blood, breast milk and urine: Potential biomarkers of exposure and estimated daily intake of ochratoxin A: A review. Food Addit. Contam. A 2016, 33, 313–328. [Google Scholar] [CrossRef]
- Li, X.; Ma, W.; Ma, Z.; Zhang, Q.; Li, H. Recent progress in determination of ochratoxin A in foods by chromatographic and mass spectrometry methods. Crit. Rev. Food Sci. 2021, in press. [Google Scholar] [CrossRef]
- Ye, J.; Xuan, Z.; Zhang, B.; Wu, Y.; Li, L.; Wang, S.; Xie, G.; Wang, S. Automated analysis of ochratoxin A in cereals and oil by immunoaffinity magnetic beads coupled to UPLC-FLD. Food Control 2019, 104, 57–62. [Google Scholar] [CrossRef]
- Li, X.; Li, H.; Ma, W.; Guo, Z.; Li, X.; Li, X.; Zhang, Q. Determination of patulin in apple juice by single-drop liquid-liquid-liquid microextraction coupled with liquid chromatography-mass spectrometry. Food Chem. 2018, 257, 1–6. [Google Scholar] [CrossRef]
- Li, X.; Ma, W.; Zhang, Q.; Li, H.; Liu, H. Determination of patulin in apple juice by amine-functionalized solid-phase extraction coupled with isotope dilution liquid chromatography tandem mass spectrometry. J. Sci. Food Agric. 2021, 101, 1767–1771. [Google Scholar] [CrossRef]
- Marechal, A.; Jarrosson, F.; Randon, J.; Dugas, V.; Demesmay, C. In-line coupling of an aptamer based miniaturized monolithic affinity preconcentration unit with capillary electrophoresis and Laser Induced Fluorescence detection. J. Chromatogr. A 2015, 1406, 109–117. [Google Scholar] [CrossRef]
- Geleta, G.S.; Zhao, Z.; Wang, Z. Electrochemical Biosensors for Detecting Microbial Toxins by Graphene-Based Nanocomposites. J. Anal. Test. 2018, 2, 20–25. [Google Scholar] [CrossRef]
- Samiee, F.; Kharazi, A.; Elaridi, J.; Taravati Javad, M.; Leili, M. An assessment of the occurrence and nutritional factors associated with aflatoxin M1, ochratoxin A, and zearalenone in the breast milk of nursing mothers in Hamadan, Iran. Toxicon 2020, 187, 209–213. [Google Scholar] [CrossRef]
- Duarte, S.C.; Pena, A.; Lino, C.M. A review on ochratoxin A occurrence and effects of processing of cereal and cereal derived food products. Food Microbiol. 2010, 27, 187–198. [Google Scholar] [CrossRef]
- Piacentini, K.C.; Ferranti, L.S.; Pinheiro, M.; Bertozzi, B.G.; Rocha, L.O. Mycotoxin contamination in cereal-based baby foods. Curr. Opin. Food Sci. 2019, 30, 73–78. [Google Scholar] [CrossRef]
- Gil-Serna, J.; Vázquez, C.; González-Jaén, M.T.; Patiño, B. Wine Contamination with Ochratoxins: A Review. Beverages 2018, 4, 6. [Google Scholar] [CrossRef] [Green Version]
- Mateo, R.; Medina, Á.; Mateo, E.M.; Mateo, F.; Jiménez, M. An overview of ochratoxin A in beer and wine. Int. J. Food Microbiol. 2007, 119, 79–83. [Google Scholar] [CrossRef]
- Joint FAO/WHO Expert Committee on Food Additives. Evaluation of Certain Food Additives and Contaminants. Food and Agriculture Organization of the United Nations, World Health Organization. Available online: http://apps.who.int/iris/bitstream/handle/10665/43870/9789241209472_eng.pdf;sequence=1 (accessed on 10 October 2021).
- Gruber-Dorninger, C.; Jenkins, T.; Schatzmayr, G. Global Mycotoxin Occurrence in Feed: A Ten-Year Survey. Toxins 2019, 11, 375. [Google Scholar] [CrossRef] [PubMed] [Green Version]
- Lai, X.; Liu, R.; Ruan, C.; Zhang, H.; Liu, C. Occurrence of aflatoxins and ochratoxin A in rice samples from six provinces in China. Food Control 2015, 50, 401–404. [Google Scholar] [CrossRef]
- Majeed, M.; Khaneghah, A.M.; Kadmic, Y.; Khan, M.U. Assessment of Ochratoxin A in Commercial Corn and Wheat Products. Curr. Nutr. Food Sci. 2017, 13, 1–5. [Google Scholar] [CrossRef]
- Hassan, S.W.u.; Sadef, Y.; Hussain, S.; Asi, M.R.; Ashraf, M.Y.; Anwar, S.; Malik, A. Unusual pattern of aflatoxins and ochratoxin in commercially grown maize varieties of Pakistan. Toxicon 2020, 182, 66–71. [Google Scholar] [CrossRef] [PubMed]
- Majeed, S.; Iqbal, M.; Asi, M.R.; Iqbal, S.Z. Aflatoxins and ochratoxin A contamination in rice, corn and corn products from Punjab, Pakistan. J. Ceral Sci. 2013, 58, 446–450. [Google Scholar] [CrossRef]
- Iqbal, S.Z.; Asi, M.R.; Hanif, U.; Zuber, M.; Jinap, S. The presence of aflatoxins and ochratoxin A in rice and rice products; and evaluation of dietary intake. Food Chem. 2016, 210, 135–140. [Google Scholar] [CrossRef] [PubMed]
- Khoshnamvand, Z.; Nazari, F.; Mehrasebi, M.R.; Hosseini, M.-J. Occurrence and Safety Evaluation of Ochratoxin A in Cereal-based Baby Foods Collected from Iranian Retail Market. J. Food Sci. 2019, 84, 695–700. [Google Scholar] [CrossRef] [PubMed]
- Taghizadeh, S.F.; Rezaee, R.; Badiebostan, H.; Giesy, J.P.; Karimi, G. Occurrence of mycotoxins in rice consumed by Iranians: A probabilistic assessment of risk to health. Food Addit. Contam. A 2020, 37, 342–354. [Google Scholar] [CrossRef] [PubMed]
- Kuruc, J.A.; Schwarz, P.; Wolf-Hall, C. Ochratoxin A in Stored U.S. Barley and Wheat. J. Food Protect. 2015, 78, 597–601. [Google Scholar] [CrossRef]
- Nguyen, K.T.N.; Ryu, D. Concentration of ochratoxin A in breakfast cereals and snacks consumed in the United States. Food Control 2014, 40, 140–144. [Google Scholar] [CrossRef]
- Cappozzo, J.; Jackson, L.; Lee, H.J.; Zhou, W.; Al-Taher, F.; Zweigenbaum, J.; Ryu, D. Occurrence of Ochratoxin A in Infant Foods in the United States. J. Food Protect. 2017, 80, 251–256. [Google Scholar] [CrossRef] [PubMed]
- Lee, H.J.; Ryu, D. Significance of Ochratoxin A in Breakfast Cereals from the United States. J. Agric. Food. Chem. 2015, 63, 9404–9409. [Google Scholar] [CrossRef]
- Limay-Rios, V.; Miller, J.D.; Schaafsma, A.W. Occurrence of Penicillium verrucosum, ochratoxin A, ochratoxin B and citrinin in on-farm stored winter wheat from the Canadian Great Lakes Region. PLoS ONE 2017, 12, e0181239. [Google Scholar] [CrossRef] [PubMed]
- Zebiri, S.; Mokrane, S.; Verheecke-Vaessen, C.; Choque, E.; Reghioui, H.; Sabaou, N.; Mathieu, F.; Riba, A. Occurrence of ochratoxin A in Algerian wheat and its milling derivatives. Toxin Rev. 2019, 38, 206–211. [Google Scholar] [CrossRef] [Green Version]
- Assunção, R.; Martins, C.; Dupont, D.; Alvito, P. Patulin and ochratoxin A co-occurrence and their bioaccessibility in processed cereal-based foods: A contribution for Portuguese children risk assessment. Food Chem. Toxicol. 2016, 96, 205–214. [Google Scholar] [CrossRef] [PubMed]
- Torovic, L. Aflatoxins and ochratoxin A in flour: A survey of the Serbian retail market. Food Addit. Contam. B 2018, 11, 26–32. [Google Scholar] [CrossRef] [PubMed]
- Kosicki, R.; Twarużek, M.; Dopierała, P.; Rudzki, B.; Grajewski, J. Occurrence of Mycotoxins in Winter Rye Varieties Cultivated in Poland (2017–2019). Toxins 2020, 12, 423. [Google Scholar] [CrossRef] [PubMed]
- European Food Safety Authority. Opinion of the Scientific Panel on contaminants in the food chain on a request from the commission related to ochratoxin A in food. EFSA J. 2006, 4, 365. [Google Scholar] [CrossRef]
- European Commission. Commission Regulation (EC) No 1881/2006 of 19 December 2006 Setting Maximum Levels for Certain Contaminants in Foodstuffs. Off. J. Eur. Union L 2006, l364. [Google Scholar]
- Di Stefano, V.; Pitonzo, R.; Avellone, G.; Di Fiore, A.; Monte, L.; Ogorka, A.Z.T. Determination of Aflatoxins and Ochratoxins in Sicilian Sweet Wines by High-Performance Liquid Chromatography with Fluorometric Detection and Immunoaffinity Cleanup. Food Anal. Methods 2015, 8, 569–577. [Google Scholar] [CrossRef]
- Gentile, F.; La Torre, G.L.; Potorti, A.G.; Saitta, M.; Alfa, M.; Dugo, G. Organic wine safety: UPLC-FLD determination of Ochratoxin A in Southern Italy wines from organic, farming and winemaking. Food Control 2016, 59, 20–26. [Google Scholar] [CrossRef]
- Vella, A.; Graci, G.; Olibrio, F.; Cumbo, V.; Cicero, A.; Di Salvo, D.; Caracappa, G.; Ferrantelli, V. Presence of Ocratoxin (OTA) in wine produced in Sicily (Italy). Biodivers. J. 2019, 10, 479–480. [Google Scholar] [CrossRef]
- Quintela, S.; Villarán, M.C.; Armentia, I.L.d.; Elejalde, E. Occurrence of ochratoxin A in Rioja Alavesa wines. Food Chem. 2011, 126, 302–305. [Google Scholar] [CrossRef]
- Pena, A.; Cerejo, F.; Silva, L.J.G.; Lino, C.M. Ochratoxin A survey in Portuguese wine by LC–FD with direct injection. Talanta 2010, 82, 1556–1561. [Google Scholar] [CrossRef] [PubMed]
- Silva, L.J.G.; Rodrigues, A.P.; Pereira, A.M.P.T.; Lino, C.M.; Pena, A. Ochratoxin A in the Portuguese Wine Market, Occurrence and Risk Assessment. Food Addit. Contam. B 2019, 12, 145–149. [Google Scholar] [CrossRef] [PubMed]
- Fernandes, P.J.; Barros, N.; Camara, J.S. A survey of the occurrence of ochratoxin A in Madeira wines based on a modified QuEChERS extraction procedure combined with liquid chromatography-triple quadrupole tandem mass spectrometry. Food Res. Int. 2013, 54, 293–301. [Google Scholar] [CrossRef]
- Labrinea, E.P.; Natskoulis, P.I.; Spiropoulos, A.E.; Magan, N.; Tassou, C.C. A survey of ochratoxin A occurence in Greek wines. Food Addit. Contam. B 2011, 4, 61–66. [Google Scholar] [CrossRef]
- Zurga, P.; Vahcic, N.; Paskovic, I.; Banovic, M.; Staver, M.M. Occurence of Ochratoxin A and Biogenic Amines in Croatian Commercial Red Wines. Foods 2019, 8, 348. [Google Scholar] [CrossRef] [PubMed] [Green Version]
- Torovic, L.; Lakatos, I.; Majkic, T.; Beara, I. Risk to public health related to the presence of ochratoxin A in wines from Fruska Gora. Lwt-Food Sci. Technol. 2020, 129, 109537. [Google Scholar] [CrossRef]
- Carballo, D.; Fernández-Franzón, M.; Ferrer, E.; Pallarés, N.; Berrada, H. Dietary Exposure to Mycotoxins through Alcoholic and Non-Alcoholic Beverages in Valencia, Spain. Toxins 2021, 13, 438. [Google Scholar] [CrossRef] [PubMed]
- Kholová, A.; Lhotská, I.; Uhrová, A.; Špánik, I.; Machyňáková, A.; Solich, P.; Švec, F.; Šatínský, D. Determination of Ochratoxin A and Ochratoxin B in Archived Tokaj Wines (Vintage 1959–2017) Using On-Line Solid Phase Extraction Coupled to Liquid Chromatography. Toxins 2020, 12, 739. [Google Scholar] [CrossRef] [PubMed]
- De Jesus, C.L.; Bartley, A.; Welch, A.Z.; Berry, J.P. High Incidence and Levels of Ochratoxin A in Wines Sourced from the United States. Toxins 2018, 10, 1. [Google Scholar] [CrossRef] [PubMed] [Green Version]
- Vega, M.; Ríos, G.; von Baer, D.; Mardones, C.; Tessini, C.; Herlitz, E.; Saelzer, R.; Ruiz, M.A. Ochratoxin A occurrence in wines produced in Chile. Food Control 2012, 28, 147–150. [Google Scholar] [CrossRef]
- Zhong, Q.D.; Li, G.H.; Wang, D.B.; Shao, Y.; Li, J.G.; Xiong, Z.H.; Wu, Y.N. Exposure Assessment to Ochratoxin A in Chinese Wine. J. Agric. Food. Chem. 2014, 62, 8908–8913. [Google Scholar] [CrossRef]
- Sun, X.; Niu, Y.; Ma, T.; Xu, P.; Huang, W.; Zhan, J. Determination, content analysis and removal efficiency of fining agents on ochratoxin A in Chinese wines. Food Control 2017, 73, 382–392. [Google Scholar] [CrossRef]
- Zhang, B.; Chen, X.; Han, S.-Y.; Li, M.; Ma, T.-Z.; Sheng, W.-J.; Zhu, X. Simultaneous Analysis of 20 Mycotoxins in Grapes and Wines from Hexi Corridor Region (China): Based on a QuEChERS–UHPLC–MS/MS Method. Molecules 2018, 23, 1926. [Google Scholar] [CrossRef] [Green Version]
- Miraglia, M.; Brera, C. Assessment of Dietary Intake of Ochratoxin A by the Population of EU Member States; Directorate-General Health and Consumer Protection, European Commission: Rome, Italy, 2002. [Google Scholar]
- Casal, S.; Vieira, T.; Cruz, R.; Cunha, S.C. Ochratoxin A in commercial soluble coffee and coffee substitutes. Food Res. Int. 2014, 61, 56–60. [Google Scholar] [CrossRef]
- Benites, A.J.; Fernandes, M.; Boleto, A.R.; Azevedo, S.; Silva, S.; Leitão, A.L. Occurrence of ochratoxin A in roasted coffee samples commercialized in Portugal. Food Control 2017, 73, 1223–1228. [Google Scholar] [CrossRef]
- Coronel, M.B.; Marin, S.; Cano, G.; Ramos, A.J.; Sanchis, V. Ochratoxin A in Spanish retail ground roasted coffee: Occurrence and assessment of the exposure in Catalonia. Food Control 2011, 22, 414–419. [Google Scholar] [CrossRef]
- Tozlovanu, M.; Pfohl-Leszkowicz, A. Ochratoxin A in Roasted Coffee from French Supermarkets and Transfer in Coffee Beverages: Comparison of Analysis Methods. Toxins 2010, 2, 1928–1942. [Google Scholar] [CrossRef] [Green Version]
- Vecchio, A.; Mineo, V.; Planeta, D. Ochratoxin A in instant coffee in Italy. Food Control 2012, 28, 220–223. [Google Scholar] [CrossRef]
- Jonatova, P.; Dzuman, Z.; Prusova, N.; Hajslova, J.; Stranska-Zachariasova, M. Occurrence of ochratoxin A and its stereoisomeric degradation product in various types of coffee available in the Czech market. World Mycotoxin J. 2020, 13, 97–107. [Google Scholar] [CrossRef]
- Vanesa, D.; Ana, P. Occurrence of Ochratoxin A in coffee beans, ground roasted coffee and soluble coffee and method validation. Food Control 2013, 30, 675–678. [Google Scholar] [CrossRef]
- Galarce-Bustos, O.; Alvarado, M.; Vega, M.; Aranda, M. Occurrence of ochratoxin A in roasted and instant coffees in Chilean market. Food Control 2014, 46, 102–107. [Google Scholar] [CrossRef]
- Costa da Silva, M.; da Silva, G.; de Castro, E.; Barreto, J.d.N.; Vitor de Oliveira Martins, P.; Lopes da Silva, G.; Ferreira da Silva, R.; Gomes dos Santo, D.; Freitas-Silva, O.; Batista Pavesi Simao, J.; et al. Ochratoxin a levels in fermented specialty coffees from Caparao, Brazil: Is it a cause of concern for coffee drinkers? Food Addit. Contam. A 2021, 38, 1948–1957. [Google Scholar] [CrossRef] [PubMed]
- Bessaire, T.; Perrin, I.; Tarres, A.; Bebius, A.; Reding, F.; Theurillat, V. Mycotoxins in green coffee: Occurrence and risk assessment. Food Control 2019, 96, 59–67. [Google Scholar] [CrossRef]
- Prelle, A.; Spadaro, D.; Denca, A.; Garibaldi, A.; Gullino, M.L. Comparison of Clean-Up Methods for Ochratoxin A on Wine, Beer, Roasted Coffee and Chili Commercialized in Italy. Toxins 2013, 5, 1827–1844. [Google Scholar] [CrossRef] [PubMed] [Green Version]
- Lhotska, I.; Satinsky, D.; Havlikova, L.; Solich, P. A fully automated and fast method using direct sample injection combined with fused-core column on-line SPE-HPLC for determination of ochratoxin A and citrinin in lager beers. Anal. Bioanal. Chem. 2016, 408, 3319–3329. [Google Scholar] [CrossRef] [PubMed]
- Silva, L.J.G.; Teixeira, A.C.; Pereira, A.M.P.T.; Pena, A.; Lino, C.M. Ochratoxin A in Beers Marketed in Portugal: Occurrence and Human Risk Assessment. Toxins 2020, 12, 249. [Google Scholar] [CrossRef] [PubMed]
- Wu, J.; Tan, Y.; Wang, Y.; Xu, R. Occurrence of ochratoxin A in wine and beer samples from China. Food Addit. Contam. B 2011, 4, 52–56. [Google Scholar] [CrossRef]
- Dongo, L.; Bandyopadhyay, R.; Kumar, M.; Ojiambo, P.S. Occurrence of Ochratoxin A in Nigeria ready for sale cocoa beans. Agric. J. 2008, 3, 4–9. [Google Scholar]
- de Magalhães, J.T.; Sodré, G.A.; Viscogliosi, H.; Grenier-Loustalot, M.-F. Occurrence of Ochratoxin A in Brazilian cocoa beans. Food Control 2011, 22, 744–748. [Google Scholar] [CrossRef]
- Pires, P.N.; Vargas, E.A.; Gomes, M.B.; Vieira, C.B.M.; Santos, E.A.d.; Bicalho, A.A.C.; Silva, S.d.C.; Rezende, R.P.; Oliveira, I.S.D.; Luz, E.D.M.N.; et al. Aflatoxins and ochratoxin A: Occurrence and contamination levels in cocoa beans from Brazil. Food Addit. Contam. A 2019, 36, 815–824. [Google Scholar] [CrossRef] [PubMed]
- Brera, C.; Debegnach, F.; De Santis, B.; Iafrate, E.; Pannunzi, E.; Berdini, C.; Prantera, E.; Gregori, E.; Miraglia, M. Ochratoxin A in cocoa and chocolate products from the Italian market: Occurrence and exposure assessment. Food Control 2011, 22, 1663–1667. [Google Scholar] [CrossRef]
- Kabak, B. Aflatoxins and ochratoxin A in chocolate products in Turkey. Food Addit. Contam. B 2019, 12, 225–230. [Google Scholar] [CrossRef] [PubMed]
- Turcotte, A.M.; Scott, P.M. Ochratoxin A in cocoa and chocolate sampled in Canada. Food Addit. Contam. A 2011, 28, 762–766. [Google Scholar] [CrossRef] [PubMed] [Green Version]
- Turcotte, A.-M.; Scott, P.M.; Tague, B. Analysis of cocoa products for ochratoxin A and aflatoxins. Mycotoxin Res. 2013, 29, 193–201. [Google Scholar] [CrossRef] [PubMed] [Green Version]
- Covarelli, L.; Beccari, G.; Marini, A.; Tosi, L. A review on the occurrence and control of ochratoxigenic fungal species and ochratoxin A in dehydrated grapes, non-fortified dessert wines and dried vine fruit in the Mediterranean area. Food Control 2012, 26, 347–356. [Google Scholar] [CrossRef]
- Heshmati, A.; Mozaffari Nejad, A.S. Ochratoxin A in dried grapes in Hamadan province, Iran. Food Addit. Contam. B 2015, 8, 255–259. [Google Scholar] [CrossRef]
- Iqbal, S.Z.; Mehmood, Z.; Asi, M.R.; Shahid, M.; Sehar, M.; Malik, N. Co-occurrence of aflatoxins and ochratoxin A in nuts, dry fruits, and nuty products. J. Food Saf. 2018, 38, e12462. [Google Scholar] [CrossRef]
- Abdallah, M.F.; Krska, R.; Sulyok, M. Occurrence of Ochratoxins, Fumonisin B-2, Aflatoxins (B-1 and B-2), and Other Secondary Fungal Metabolites in Dried Date Palm Fruits from Egypt: A Mini-Survey. J. Food Sci. 2018, 83, 559–564. [Google Scholar] [CrossRef]
- Nikolchina, I.; Rodrigues, P. A preliminary study on mycobiota and ochratoxin a contamination in commercial palm dates (Phoenix dactylifera). Mycotoxin Res. 2021, 37, 215–220. [Google Scholar] [CrossRef] [PubMed]
- Palumbo, J.D.; O’Keeffe, T.L.; Vasquez, S.J.; Mahoney, N.E. Isolation and identification of ochratoxin A-producing Aspergillus section Nigri strains from California raisins. Lett. Appl. Microbiol. 2011, 52, 330–336. [Google Scholar] [CrossRef] [PubMed]
- Wang, Y.; Nie, J.; Yan, Z.; Li, Z.; Cheng, Y.; Chang, W. Occurrence and co-occurrence of mycotoxins in nuts and dried fruits from China. Food Control 2018, 88, 181–189. [Google Scholar] [CrossRef]
- Wei, D.; Wu, X.; Xu, J.; Dong, F.; Liu, X.; Zheng, Y.; Ji, M. Determination of Ochratoxin A contamination in grapes, processed grape products and animal-derived products using ultra-performance liquid chromatography-tandem mass spectroscopy system. Sci. Rep. 2018, 8, 2051. [Google Scholar] [CrossRef]
- Zhang, X.; Ou, X.; Zhou, Z.; Ma, L. Ochratoxin A in Chinese dried jujube: Method development and survey. Food Addit. Contam. A 2015, 32, 512–517. [Google Scholar] [CrossRef] [PubMed]
- Iqbal, S.Z.; Asi, M.R.; Zuber, M.; Akhtar, J.; Jawwad Saif, M. Natural occurrence of aflatoxins and ochratoxin A in commercial chilli and chilli sauce samples. Food Control 2013, 30, 621–625. [Google Scholar] [CrossRef]
- Iqbal, S.Z.; Mumtaz, A.; Mahmood, Z.; Waqas, M.; Ghaffar, A.; Ismail, A.; Pervaiz, W. Assessment of aflatoxins and ochratoxin a in chili sauce samples and estimation of dietary intake. Food Control 2021, 121, 107621. [Google Scholar] [CrossRef]
- Jalili, M.; Jinap, S. Natural occurrence of aflatoxins and ochratoxin A in commercial dried chili. Food Control 2012, 24, 160–164. [Google Scholar] [CrossRef]
- Prelle, A.; Spadaro, D.; Garibaldi, A.; Gullino, M.L. Co-occurrence of aflatoxins and ochratoxin A in spices commercialized in Italy. Food Control 2014, 39, 192–197. [Google Scholar] [CrossRef]
- El Darra, N.; Gambacorta, L.; Solfrizzo, M. Multimycotoxins occurrence in spices and herbs commercialized in Lebanon. Food Control 2019, 95, 63–70. [Google Scholar] [CrossRef]
- Ozbey, F.; Kabak, B. Natural co-occurrence of aflatoxins and ochratoxin A in spices. Food Control 2012, 28, 354–361. [Google Scholar] [CrossRef]
- Tosun, A.; Ozden, S. Ochratoxin A in red pepper flakes commercialised in Turkey. Food Addit. Contam. B 2016, 9, 46–50. [Google Scholar] [CrossRef] [PubMed]
- Zhao, X.; Yuan, Y.; Zhang, X.; Yue, T. Identification of ochratoxin A in Chinese spices using HPLC fluorescent detectors with immunoaffinity column cleanup. Food Control 2014, 46, 332–337. [Google Scholar] [CrossRef]
- Lippolis, V.; Irurhe, O.; Porricelli, A.C.R.; Cortese, M.; Schena, R.; Imafidon, T.; Oluwadun, A.; Pascale, M. Natural co-occurrence of aflatoxins and ochratoxin A in ginger (Zingiber officinale) from Nigeria. Food Control 2017, 73, 1061–1067. [Google Scholar] [CrossRef] [Green Version]
- Toman, J.; Ostry, V.; Grosse, Y.; Roubal, T.; Malir, F. Occurrence of ochratoxin A in Astragalus propinquus root and its transfer to decoction. Mycotoxin Res. 2018, 34, 223–227. [Google Scholar] [CrossRef] [PubMed]
- Altafini, A.; Armorini, S.; Zaghini, A.; Sardi, L.; Roncada, P. Tissue distribution of ochratoxin A in pigs after administration of two-levels contaminated diets. World Mycotoxin J. 2017, 10, 263–272. [Google Scholar] [CrossRef]
- Pietruszka, K.; Piatkowska, M.; Jedziniak, P. Occurrence of ochratoxin A in animal tissues and feeds in Poland in 2014–2016. J. Vet. Res. 2017, 61, 483–487. [Google Scholar] [CrossRef] [Green Version]
- Hort, V.; Nicolas, M.; Minvielle, B.; Maleix, C.; Desbourdes, C.; Hommet, F.; Dragacci, S.; Dervilly-Pinel, G.; Engel, E.; Guérin, T. Ochratoxin A determination in swine muscle and liver from French conventional or organic farming production systems. J. Chromatogr. B 2018, 1092, 131–137. [Google Scholar] [CrossRef]
- Luci, G.; Intorre, L.; Ferruzzi, G.; Mani, D.; Giuliotti, L.; Pretti, C.; Tognetti, R.; Bertini, S.; Meucci, V. Determination of ochratoxin A in tissues of wild boar (Sus scrofa L.) by enzymatic digestion (ED) coupled to high-performance liquid chromatography with a fluorescence detector (HPLC-FLD). Mycotoxin Res. 2018, 34, 1–8. [Google Scholar] [CrossRef]
- Dall’Asta, C.; Galaverna, G.; Bertuzzi, T.; Moseriti, A.; Pietri, A.; Dossena, A.; Marchelli, R. Occurrence of ochratoxin A in raw ham muscle, salami and dry-cured ham from pigs fed with contaminated diet. Food Chem. 2010, 120, 978–983. [Google Scholar] [CrossRef]
- Armorini, S.; Altafini, A.; Zaghini, A.; Roncada, P. Ochratoxin A in artisan salami produced in Veneto (Italy). Food Addit. Contam. B 2016, 9, 9–14. [Google Scholar] [CrossRef]
- Altafini, A.; Fedrizzi, G.; Roncada, P. Occurrence of ochratoxin A in typical salami produced in different regions of Italy. Mycotoxin Res. 2019, 35, 141–148. [Google Scholar] [CrossRef]
- Pattono, D.; Gallo, P.F.; Civera, T. Detection and quantification of Ochratoxin A in milk produced in organic farms. Food Chem. 2011, 127, 374–377. [Google Scholar] [CrossRef]
- Lippolis, V.; Asif, S.; Pascale, M.; Cervellieri, S.; Mancini, E.; Peli, A.; De Amicis, I.; Robbe, D.; Minervini, F. Natural Occurrence of Ochratoxin A in Blood and Milk Samples from Jennies and Their Foals after Delivery. Toxins 2020, 12, 758. [Google Scholar] [CrossRef] [PubMed]
- Biancardi, A.; Piro, R.; Galaverna, G.; Dall’Asta, C. A simple and reliable liquid chromatography-tandem mass spectrometry method for determination of ochratoxin A in hard cheese. Int. J. Food Sci. Nutr. 2013, 64, 632–640. [Google Scholar] [CrossRef] [PubMed]
- Biasucci, G.; Calabrese, G.; Di Giuseppe, R.; Carrara, G.; Colombo, F.; Mandelli, B.; Maj, M.; Bertuzzi, T.; Pietri, A.; Rossi, F. The presence of ochratoxin A in cord serum and in human milk and its correspondence with maternal dietary habits. Eur. J. Nutr. 2011, 50, 211–218. [Google Scholar] [CrossRef] [PubMed]
- Muñoz, K.; Blaszkewicz, M.; Campos, V.; Vega, M.; Degen, G.H. Exposure of infants to ochratoxin A with breast milk. Arch. Toxicol. 2014, 88, 837–846. [Google Scholar] [CrossRef] [PubMed]
- Cherkani-Hassani, A.; Ghanname, I.; Zinedine, A.; Sefrioui, H.; Qmichou, Z.; Mouane, N. Ochratoxin a in breast milk in Morocco: The affecting dietary habits of the lactating mothers and the degree of exposure of newborns “CONTAMILK study”. Drug Chem. Toxicol. 2020, in press. [Google Scholar] [CrossRef] [PubMed]

| Matrix | Nation | Year of Production | No. of Samples | Occurrence (%) | Maximum (μg/kg) | Mean (μg/kg) | Reference |
|---|---|---|---|---|---|---|---|
| Wheat | 100 nations | 2008–2017 | 74,821 | 15 | 2000 | / | [23] |
| Rice | China | 2009–2011 | 370 | 4.9 | 3.2 | 0.85 | [24] |
| Corn, wheat | Pakistan | 2015 | 40 | 27.5 | 360 | / | [25] |
| Maize | Pakistan | 2016–2017 | 46 | 71 | 218.25 | / | [26] |
| Rice, corn, and corn product | Pakistan | 2011–2012 | 275 | 32 | / | / | [27] |
| Rice | Pakistan | / | 208 | 19 | 24.9 | / | [28] |
| Cereal based baby foods | Iran | 2017–2018 | 64 | 41 | 1.1 | 0.42 | [29] |
| Rice | Iran | / | 308 | 9.4 | 11.4 | / | [30] |
| Barley and wheat | USA | 2011–2012 | 262 | 12.2 | 185.24 | / | [31] |
| Corn, oat, wheat, and rice | USA | 2012–2013 | 144 | 53 | 7.43 | 0.61 | [32] |
| Infant cereal | USA | 2012–2014 | 155 | 30 | 22.1 | / | [33] |
| Corn-, rice-, wheat-, and oat-based breakfast cereal | USA | 2012–2014 | 489 | 41 | 9.3 | / | [34] |
| Wheat | Canada | 2011–2014 | 232 | 2.2 | / | 14.7 | [35] |
| Wheat and derived samples | Algeria | 2012–2013 | 81 | 76.65 | 34.75 | / | [36] |
| Cereal based foods | Portugal | 2015 | 20 | 50 | 0.263 | 0.061 | [37] |
| Flour | Serbia | 2012–2016 | 114 | 29 | 23.04 | 0.46 | [38] |
| Rye | Poland | 2017–2019 | 60 | 3 | 2.75 | / | [39] |
| Matrix | Nation | Year of Production | No. of Sample | Occurrence (%) | Maximum (μg/L) | Mean (μg/L) | Reference |
|---|---|---|---|---|---|---|---|
| Sweet wine | Italy | 2007–2011 | 30 | 96.6 | 1.56 | 0.246 | [42] |
| Red and white wine | Italy | 2012–2013 | 100 | 72.7 | 0.711 | 0.255 | [43] |
| Wine | Italy | / | 470 | 0.2 | / | / | [44] |
| Red wine | Spain | 1995–2008 | 100 | 57 | 0.179 | 0.035 | [45] |
| Red and white wine | Portugal | / | 60 | 20 | 2.4 | / | [46] |
| Red and white wine | Portugal | 1984–2017 | 92 | 3.2 | / | / | [47] |
| Wine | Portugal | 2010 | 30 | 6.7 | 0.45 | 0.42 | [48] |
| Red, rosé, and white wine must | Greece | 1999–2006 | 150 | 69.4 | 2 | 0.26 | [49] |
| Red wine | Croatia | 2011–2015 | 110 | 98.2 | 0.163 | 0.040 | [50] |
| Red, rosé, and white wine | Serbia | 2011–2016 | 113 | 52.2 | 0.134 | 0.026 | [51] |
| Wine | Spain | 2017–2018 | 40 | 47 | 2.28 | 1.13 | [52] |
| Tokaj wines | Slovak | 1959–2017 | 59 | 6.8 | 1.2 | / | [53] |
| Red and white wine | USA | 2010–2015 | 41 | 85.4 | 8.6 | 1.3 | [54] |
| Red and white wine | Chile | 2007–2009 | 1188 | 2.9 | 0.35 | / | [55] |
| Red, rosé, and white wine | China | / | 223 | 45.2 | 0.98 | 0.15 | [56] |
| Red and white wine | China | / | 70 | 62.8 | / | 0.61 | [57] |
| Wine | China | 2007–2016 | 42 | 4.8 | 1.27 | 1.27 | [58] |
| Matrix | Nation | Year of Production | No. of Sample | Occurrence (%) | Maximum (μg/kg) * | Mean (μg/kg) * | Reference |
|---|---|---|---|---|---|---|---|
| Soluble coffee and coffee substitutes | Portugal | 2012 | 40 | 87.5 | 11.8 | / | [60] |
| Roasted coffee | Portugal | / | 11 | 27.3 | 10.31 | 1.13 | [61] |
| Roasted coffee | Spain | 2008 | 72 | 48.6 | 4.21 | 2.17 | [62] |
| Roasted coffee | France | / | 30 | 100 | 11.9 | / | [63] |
| Coffee and coffee products | Italy | 2011 | 50 | 96 | 6.4 | / | [64] |
| Roasted and instant coffee | Czech | 2016–2018 | 103 | 80.6 | 12.8 | / | [65] |
| Coffee bean roasted coffee and soluble coffee | Argentina | / | 51 | 69 | 20.3 | / | [66] |
| Roasted and instant coffee | Chile | / | 63 | 33 | 7.25 | 1.3 | [67] |
| Fermented coffees | Brazil | 2017 | 14 | 21.4 | 0.87 | 0.18 | [68] |
| Green coffee | 9 countries | 2015–2016 | 71 | 28 | 12.2 | 1.3 | [69] |
| Beer | Italy | / | 30 | 16.6 | / | 0.35 | [70] |
| Lager beer | Czech | / | 49 | 90 | 1.2 μg/L | 0.06 μg/L | [71] |
| Lager and ale beer | Portugal | 2018 | 84 | 10.6 | 11.25 | 3.14 | [72] |
| Beer | China | 2008–2009 | 20 | 0 | 0 | 0 | [73] |
| Beer | Spain | 2017–2018 | 40 | 20 | 3.38 | 1.83 | [52] |
| Cocoa bean | Nigeria | / | 59 | 90 | 0.28 | / | [74] |
| Cocoa bean | Brazil | 2006 | 54 | 92.5 | 4 | 0.45 | [75] |
| Cocoa bean | Brazil | 2015–2017 | 123 | 22.8 | 7.2 | 1.2 | [76] |
| Cocoa and chocolate | Italy | / | 300 | 59.7 | 1.82 | / | [77] |
| Chocolate products | Turkey | 2017 | 130 | 24.6 | 0.75 | / | [78] |
| Cocoa and chocolate | Canada | / | 60 | 100 | 7.8 | 0.95 | [79] |
| Cocoa products | Canada | 2011–2012 | 85 | 89.4 | 4.72 | 0.66 | [80] |
| Dried grapes | Iran | 2012–2013 | 66 | 40.9 | 8.4 | 2.98 | [81] |
| Fruit and dried fruit | Pakistan | 2016–2017 | 72 | 18 | 18.5 | 3.58 | [82] |
| Palm dates | Egypt | 2016 | 28 | 11 | 6070 | / | [83] |
| Palm dates | Tunisia and Algeria | 2018 | 19 | 5.3 | 0.75 | 0.75 | [84] |
| Raisin | USA | / | 40 | 93 | 11.4 | 0.7 | [85] |
| Dried fruit and nuts | China | / | 253 | 1.6 | 9.39 | 6.23 | [86] |
| Grapes, juice, and raisin | China | 2016 | 556 | 8.4 | 10.14 | / | [87] |
| Dried jujube | China | 2013 | 20 | 100 | 0.18 | 0.14 | [88] |
| Chili | Pakistan | / | 170 | 34.7 | 64.5 | / | [89] |
| Chili sauce | Pakistan | 2018 | 252 | 71 | 114 | / | [90] |
| Dried chili | Malaysia | 2009 | 80 | 81.25 | 101.2 | 7.15 | [91] |
| Chili and pepper | Italy | 2011–2012 | 130 | 23.8 | 19.06 | 6.18 | [92] |
| Allspice, pepper, chili, cinnamon, ginger, and mixture | Italy | / | 94 | 30 | 34 | 7.1 | [93] |
| Chili flake, chili powder, black pepper powder, cumin, and cinnamon | Turkey | 2010–2011 | 105 | 24.7 | 98.2 | 5.7 | [94] |
| Red pepper flakes | Turkey | 2012–2013 | 75 | 94.6 | 31.7 | 3.5 | [95] |
| Pepper, chili, prickly ash, cinnamon, aniseed, fennel, curry powder, and cumin | China | 2009 | 480 | 9.6 | 30.73 | / | [96] |
| Ginger | Nigeria | 2014 | 120 | 47.5 | 12.02 | 1.77 | [97] |
| Astragalus propinquus | Czech | 2015–2016 | 40 | 100 | 1700 | 451 | [98] |
| Matrix | Nation | Year of Production | No. of Sample | Occurrence (%) | Maximum (μg/kg) * | Mean (μg/kg) * | Reference |
|---|---|---|---|---|---|---|---|
| Swine kidney liver and muscle | Poland | 2014–2016 | 430 | 23.5 | / | 2 | [101] |
| Swine liver and muscle | France | 2014 | 70 | 64.3 | 3.65 | 0.15 | [102] |
| Wild boars | Italy | 2014–2015 | 48 | / | 3.23 | / | [103] |
| Dry-cured hams | Italy | / | 110 | 76.4 | 5.64 | / | [104] |
| Salami | Italy | 2013 | 50 | 10 | 103.69 | / | [105] |
| Salami | Italy | 2015–2016 | 172 | 12.8 | 5.66 | 0.51 | [106] |
| Bovine, goat, and sheep milk | Italy | / | 83 | 3.6 | 0.11 | / | [107] |
| Jenny milk | Italy | 2020 | 33 | 36.4 | 82 ng/L | / | [108] |
| Hard cheese | Italy | 2011 | 40 | 15 | 54.07 | 14.94 | [109] |
| Breast milk | Italy | 2007 | 57 | 78.8 | 75.1 ng/L | 10 ng/L | [110] |
| Breast milk | Iran | 2019 | 90 | 0 | 0 | 0 | [17] |
| Breast milk | Chile | 2008–2010 | 50 | 79 | 186 ng/L | 52 ng/L | [111] |
| Breast milk | Morocco | 2017 | 82 | 55 | 10.04 μg/L | 2.17 | [112] |
Publisher’s Note: MDPI stays neutral with regard to jurisdictional claims in published maps and institutional affiliations. |
© 2021 by the authors. Licensee MDPI, Basel, Switzerland. This article is an open access article distributed under the terms and conditions of the Creative Commons Attribution (CC BY) license (https://creativecommons.org/licenses/by/4.0/).
Share and Cite
Li, X.; Ma, W.; Ma, Z.; Zhang, Q.; Li, H. The Occurrence and Contamination Level of Ochratoxin A in Plant and Animal-Derived Food Commodities. Molecules 2021, 26, 6928. https://doi.org/10.3390/molecules26226928
Li X, Ma W, Ma Z, Zhang Q, Li H. The Occurrence and Contamination Level of Ochratoxin A in Plant and Animal-Derived Food Commodities. Molecules. 2021; 26(22):6928. https://doi.org/10.3390/molecules26226928
Chicago/Turabian StyleLi, Xianjiang, Wen Ma, Zhiyong Ma, Qinghe Zhang, and Hongmei Li. 2021. "The Occurrence and Contamination Level of Ochratoxin A in Plant and Animal-Derived Food Commodities" Molecules 26, no. 22: 6928. https://doi.org/10.3390/molecules26226928
APA StyleLi, X., Ma, W., Ma, Z., Zhang, Q., & Li, H. (2021). The Occurrence and Contamination Level of Ochratoxin A in Plant and Animal-Derived Food Commodities. Molecules, 26(22), 6928. https://doi.org/10.3390/molecules26226928