Article

In Situ Synthesis of β-Na1.5Y1.5F6: Er3+ Crystals in Oxyfluoride Silicate Glass for Temperature Sensors and Their Spectral Conversion and Optical Thermometry Analysis

by
Rajesh Dagupati
1,*,
Robert Klement
1,*,
Ramaraghavulu Rajavaram
2,
José J. Velázquez
1 and
Dušan Galusek
1,3
1
FunGlass, Alexander Dubček University of Trenčín, Študentská 2, SK-911 50 Trenčín, Slovakia
2
Department of Physics, Annamacharya Institute of Technology & Sciences, Rajampet A.P-516115, India
3
Joint Glass Centre of the IIC SAS, TnUAD and FChPT STU, Trenčín, Študentská 2, SK-911 50 Trenčín, Slovakia
*
Authors to whom correspondence should be addressed.
Molecules 2021, 26(22), 6901; https://doi.org/10.3390/molecules26226901
Submission received: 15 October 2021 / Revised: 8 November 2021 / Accepted: 13 November 2021 / Published: 16 November 2021
(This article belongs to the Special Issue Glass-Ceramic Functional Materials: Synthesis and Applications)

Abstract

:
Transparent oxyfluoride glass-ceramics (GCs) with embedded β-Na1.5Y1.5F6 crystals doped with Er3+ ions were fabricated by a melt-quenching method with subsequent heat-treatment. The structural characterizations and spectroscopic techniques were performed to verify the precipitation of β-Na1.5Y1.5F6 crystals and partition of the Er3+ dopant into the crystals. Bright green up-conversion (UC) emission was achieved in Er3+-doped glass-ceramic (Er-GC). Furthermore, the temperature-dependent visible UC behavior based on thermally coupled energy levels (TCLs) and non-thermally coupled energy levels (NTCLs) was also examined in the temperature range 298 k to 823 K with maximum relative sensitivity (Sr) of 1.1% K−1 at 298 K for TCLs in Er-G and Er-GC samples.

1. Introduction

Temperature (T) is a fundamental parameter that must be measured precisely in many scientific and engineering fields [1,2,3]. Traditional temperature measuring devices, such as contact temperature sensors based on electrical changes in materials, have limitations in a variety of situations, such as nano- and micro-scale regimes, fast moving objects, corrosive environments, and inside cells, [4,5,6]. It is, therefore, essential to develop low-cost, portable, dependable, and safe temperature sensors for a wide range of applications.
Among the various temperature measurement methods, which include the use of thermocouples, thermistors, and temperature resistance detectors (RTDs), the optical thermometry based on fluorescence intensity ratio (FIR) has received a lot of attention in the last decades because of its quick response, electromagnetic passivity, self-reference, and high sensitivity [4,7,8,9]. It also reduces the impact of the experimental conditions, such as fluorescence loss and fluctuation of the pumping power [10,11]. Kusama et al. [12] proposed FIR for the first time in 1976, and Shinn et al. [13] later provided the theoretical expression to its measurement in 1983. This technique advanced significantly in the twenty-first century [14,15,16].
The intensity ratio of two emission bands from thermally coupled levels (TCLs) of rare earth (RE3+) ions have been used to develop the FIR technique: it has been improved gradually in the past few decades. However, some inherent limitations of this method cannot be overcome [17,18]. Firstly, due to the limitation of rapid electrons exchange between the two monitoring energy levels (TCLs), the energy gap difference (ΔE) between them should be set at 200–2000 cm−1. This restriction in the energy gap can determine the thermometer’s upper limit of relative sensitivity (Sr = ΔE/kBT2), which may be 1% or even lower [19,20]. Second, a narrow ΔE between TCLs would result in spectral overlap of the two monitoring peaks, which would be detrimental to signal recognition. These inherent limitations are unfavorable for further improvement of thermometer sensitivity [21]. A new strategy has been therefore proposed, based on the intensity ratio of non-coupled thermally (NTCLs) energy levels in the same and/or different luminescent centers to overcome the disadvantages of the TCLs route [22,23,24].
Among RE3+ ions, praseodymium [25], neodymium [3,9,16], europium [26], dysprosium [5], holmium [27], and erbium [11,20,22,24] have been used for optical temperature sensing due to the presence of thermally coupled levels. Among them, erbium (Er3+) is the most studied ion in glasses and glass-ceramics for optical thermometry due to its up-conversion (UC) fluorescence emissions upon excitation by infrared (IR) radiation at 980 nm. This IR excitation source shows some advantages with respect to ultraviolet (UV) excitation sources, i.e., it is commercially less expensive, more portable, and more suitable for biological applications. On the other hand, the efficiency of this system significantly depends on the environment in which the RE3+ ions are located, i.e., either in the regular crystal lattice or in disordered structure of glass with distorted coordination polyhedra around RE3+. In this regard, the radiative probabilities of emitting levels within RE3+ ions embedded in a crystalline phase of glass-ceramics, especially with low phonon energy (e.g., fluorides), are higher compared to glasses. Moreover, the advantage of glass-ceramics is that combines the properties of both glass and ceramics. Due to the promising luminescent properties of fluoride crystalline phases, RE3+-doped fluorides in glass-ceramics have attracted a lot of attention [28,29]. Among them, sodium yttrium fluoride phase in glass-ceramic became one of the most efficient host materials for UC among investigated fluoride glass-ceramics, with the incorporation of Er3+ for green emission [30,31].
Li et al. [32] studied up-conversion emission in transparent GCs containing β-NaYF4:Yb3+, Er3+ nanocrystals for optical thermometry in the range of 300–773 K. At 300 K, it has a maximum relative sensitivity of about 1.24% K−1. León-Luis et al. [11] studied the role of the host matrix, oxyfluoride glass and a fluoride-type nanocrystalline (α-NaYF4) GCs, on the thermal sensitivity of Er3+ luminescence in the temperature range from room temperature to 720 K. The best result was obtained with the glass, which produced a sensitivity of about 66 × 10−4 K−1 at 570 K due to the presence of highly distorted local symmetry environments of Er3+ ions and strong crystal-field strengths. However, to the best of our knowledge, there is no report on the synthesis of β-Na1.5Y1.5F6 crystals in 65.5SiO2-5Al2O3-3Y2O3-4Na2O-22NaF-0.5ErF3 glass with similar composition and optical thermometry analysis from thermally and non-thermally coupled energy levels for temperature sensing.

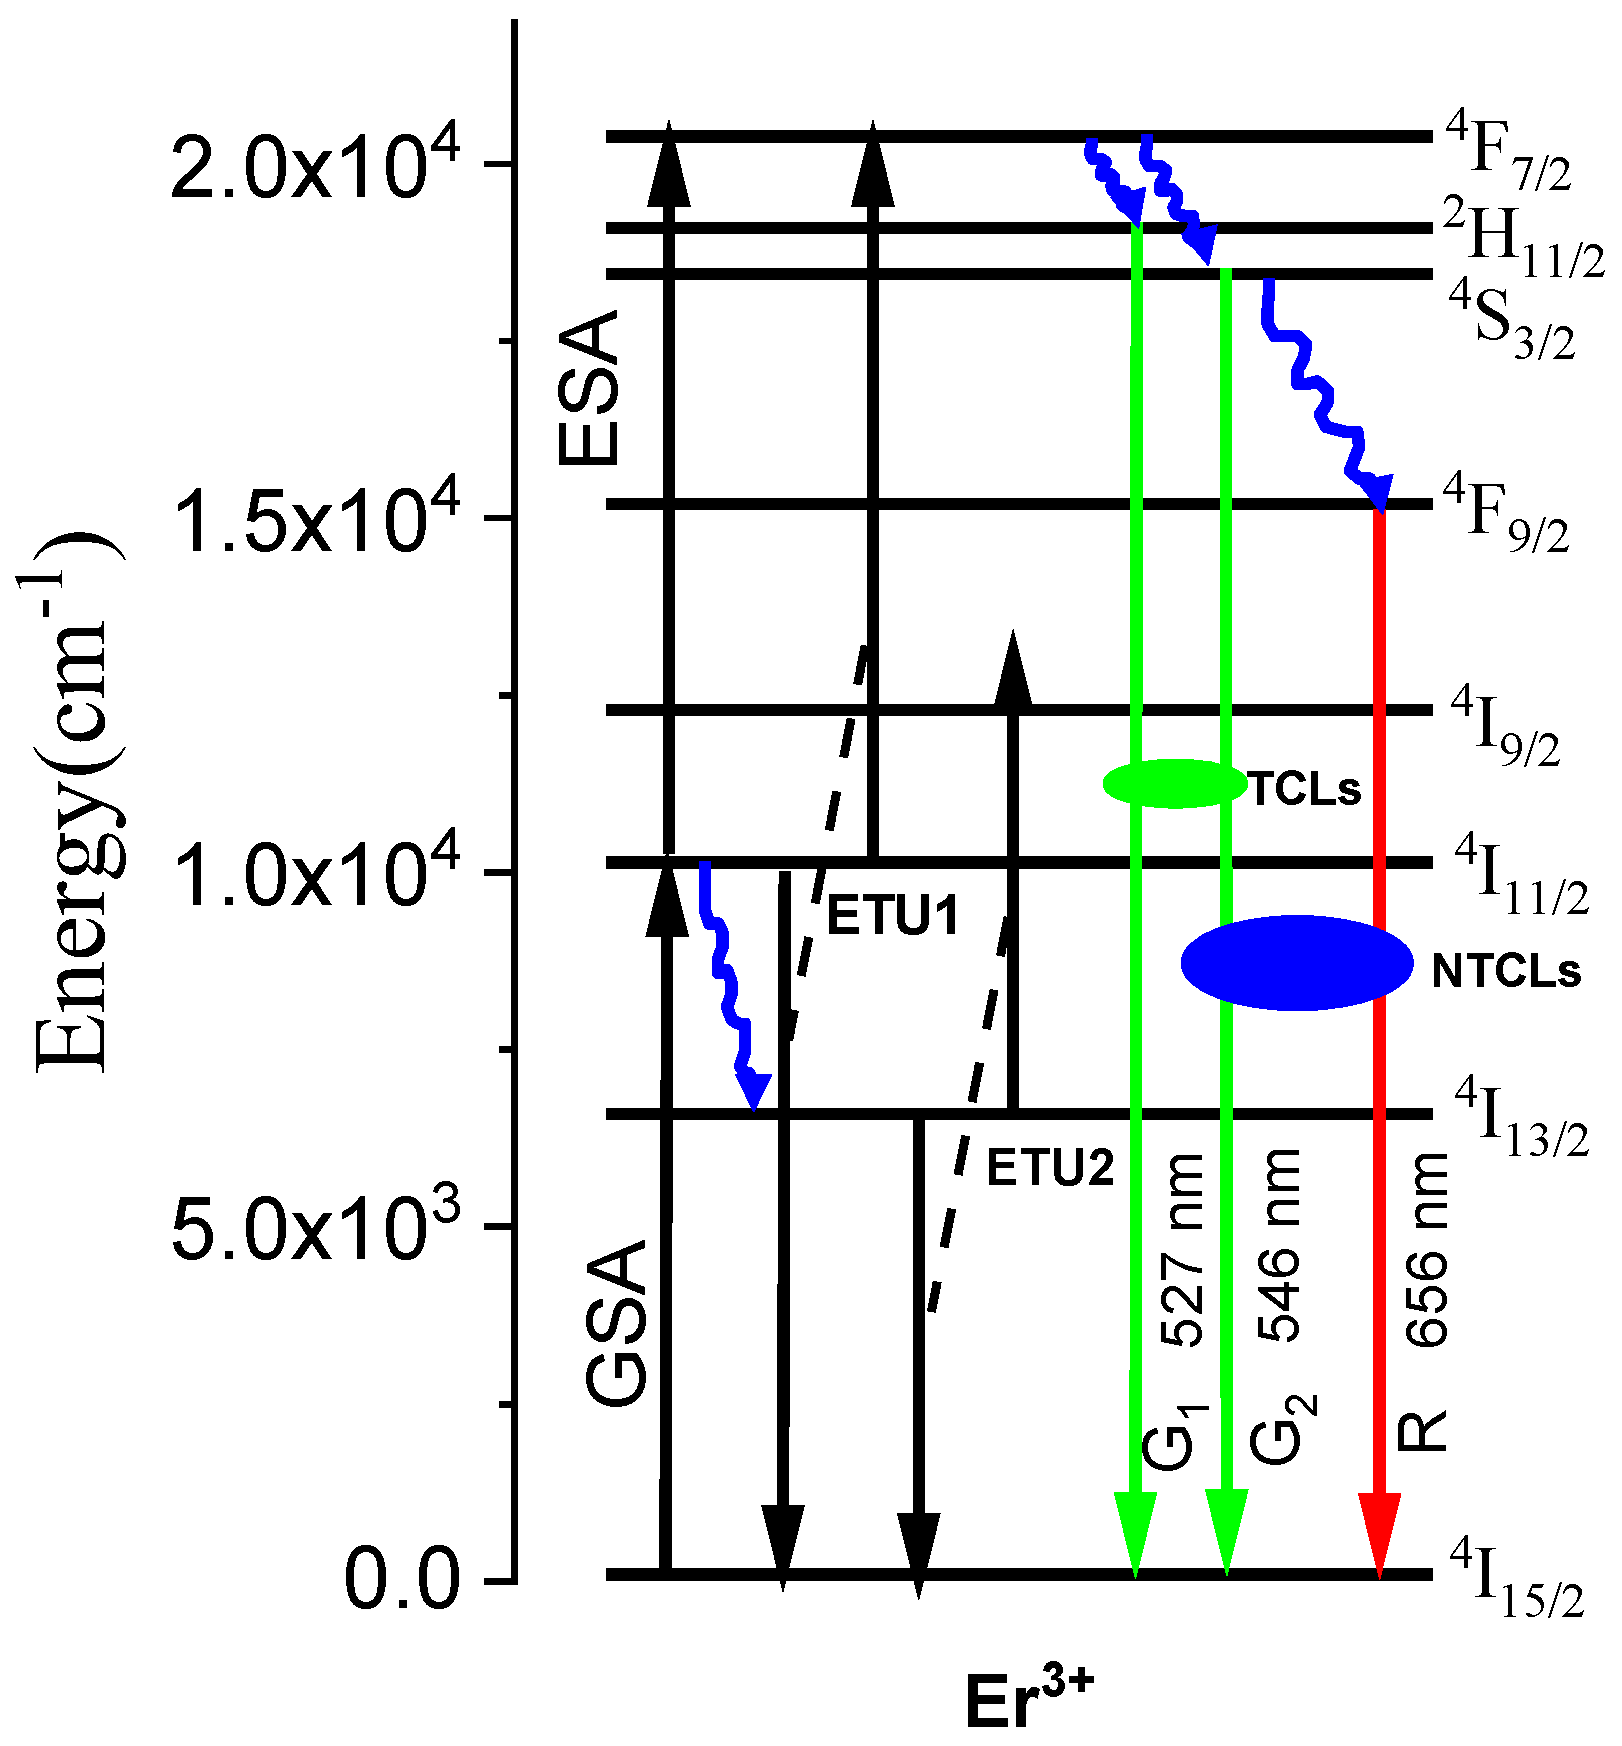
1.1. Fundamental Principle of FIR Sensing Thermometry Based on TCLs and NTCLs of Er3+ Ion

1.1.1. Thermally Coupled Levels (TCLs)

As illustrated in the Figure 1, under 980 nm laser excitation, two processes such as excited state absorption (ESA) and energy transfer UC (ETU1) are involved in green luminescence. In the ESA process, the electrons in 4I15/2 ground state of Er3+ are promoted to 4F7/2 excited state via successive two-step absorption process, i.e., (1) ground state absorption (GSA), and (2) excited state absorption (ESA) [13]. However, in ETU1 process, one of the Er3+ ions previously excited to 4I11/2 deexcited to the ground state, 4I15/2, while another ion was promoted to the 4F7/2 state because of mutual interaction. Finally, nonradiative transition from 4F7/2 state populates 2H11/2, 4S3/2 states.
The most common mechanism for red UC is a nonradiative transition from the 2H11/2 and 4S3/2 states to the 4F9/2 state. Although NaYF4 phonon energy (360 cm−1) is taken into account, the energy gap between 4S3/2 and 4F9/2 states must be bridged by 7–8 phonons for this transition to be efficient [14]. Because of this, it is unlikely to have an impact on population of 4F9/2. On the other hand, GSA-populated Er3+ ions in the 4I11/2 state relax to the 4I13/2 state first and then populate the 4F9/2 emitting state through ETU2, as shown in Figure 1, producing red UC emission. The ETU2 is most likely a dominant mechanism in the present case.
When the system is in a state of thermal equilibrium, electron populations in 2H11/2 and 4S3/2 two thermally coupled states follow Boltzmann distribution law, and the corresponding FIR can be expressed by the following equation [13]:
FIR = I 524 I 546 = g H σ H ω H g S σ S ω S exp ( Δ E k B T ) = C   exp [ Δ E k B T ] ,  
where I524 and I546 are integrated intensities corresponding to fluorescence transitions from the 2H11/2 and 4S3/2 levels to the 4I15/2 level, of Er3+ ion, respectively; g, σ, and ω, are the degeneracy, the emission cross-section, and the angular frequency of each level, respectively; C is a constant; ΔE is the energy gap between the 2H11/2 and 4S3/2 levels; kB is Boltzmann constant, and T is absolute temperature.
The energy gap ΔE between the 2H11/2 and 4S3/2 levels and the pre-exponential constant C can usually be calculated using one of two approaches: (1) intensity ratio of 2H11/2 and 4S3/2 levels (FIR) can be plotted against absolute temperature (T) and fitted by exponential function; and (2) the linear fit of the graph plotted ln (FIR) vs. 1/T. The ΔE values obtained from these two approaches identical [33,34]. The first approach has been adapted in the present case. The ΔE and C parameters are vital factors for the absolute sensor sensitivity (Sa) as well as the relative sensitivity (Sr) of temperature detection, as defined by the following equations [11]:
S a = d ( FIR ) dT = FIR ( Δ E k B T 2 ) ,  
S r = 1 FIR d ( FIR ) dT = Δ E k B T 2 .

1.1.2. Non-Thermally Coupled Levels (NTCLs)

The FIR sensing thermometry is based on NTCLs, which involve two independent luminescent excited levels, in the present case 4S3/2 and 4F9/2 levels in Er3+ ion, each with its own photoluminescence temperature dependence. Because these two luminescent excited levels are electronically independent in terms of kinetics, there is no energy transfer (ET) between them on the time scale of their luminescence (1/τ ≫ kET) [16].
To further demonstrate the temperature sensing mechanism of NTCLs by FIR temperature sensing method, the temperature properties of 4S3/2 and 4F9/2 levels are analysed using the polynomial function below.
FIR = I 658 I 546 = A + B × T + C × T 2 ,
where, A, B, and C are the fitting parameters of polynomial. The sensitivities Sa and Sr based on NTLC could then be calculated by taking the first derivative of the FIR function (Equation (4)) and Equations (2) and (3).
In the current study, we used melt quenching followed by controlled heat treatment to create β-Na1.5Y1.45F6 Er0.05 crystals in oxyfluoride silicate glasses. The dynamics of excited states of Er3+ ions, as well as high-temperature sensing properties, have been investigated in a temperature range of 298–823 K using TCLs and NTCLs energy levels transition of Er3+ ions in glass and GCs based on FIR technique. The phase composition of the as prepared GC has been examined using Rietveld refinement of diffraction patterns obtained from X-ray powder diffraction (XRD) measurements. The thermal stability of both species has been investigated using differential scanning calorimetry (DSC). Er3+-doped oxyfluoride silicate GC has been shown to have excellent spectral/thermal stability and high-temperature sensing performance in the investigated temperature range.

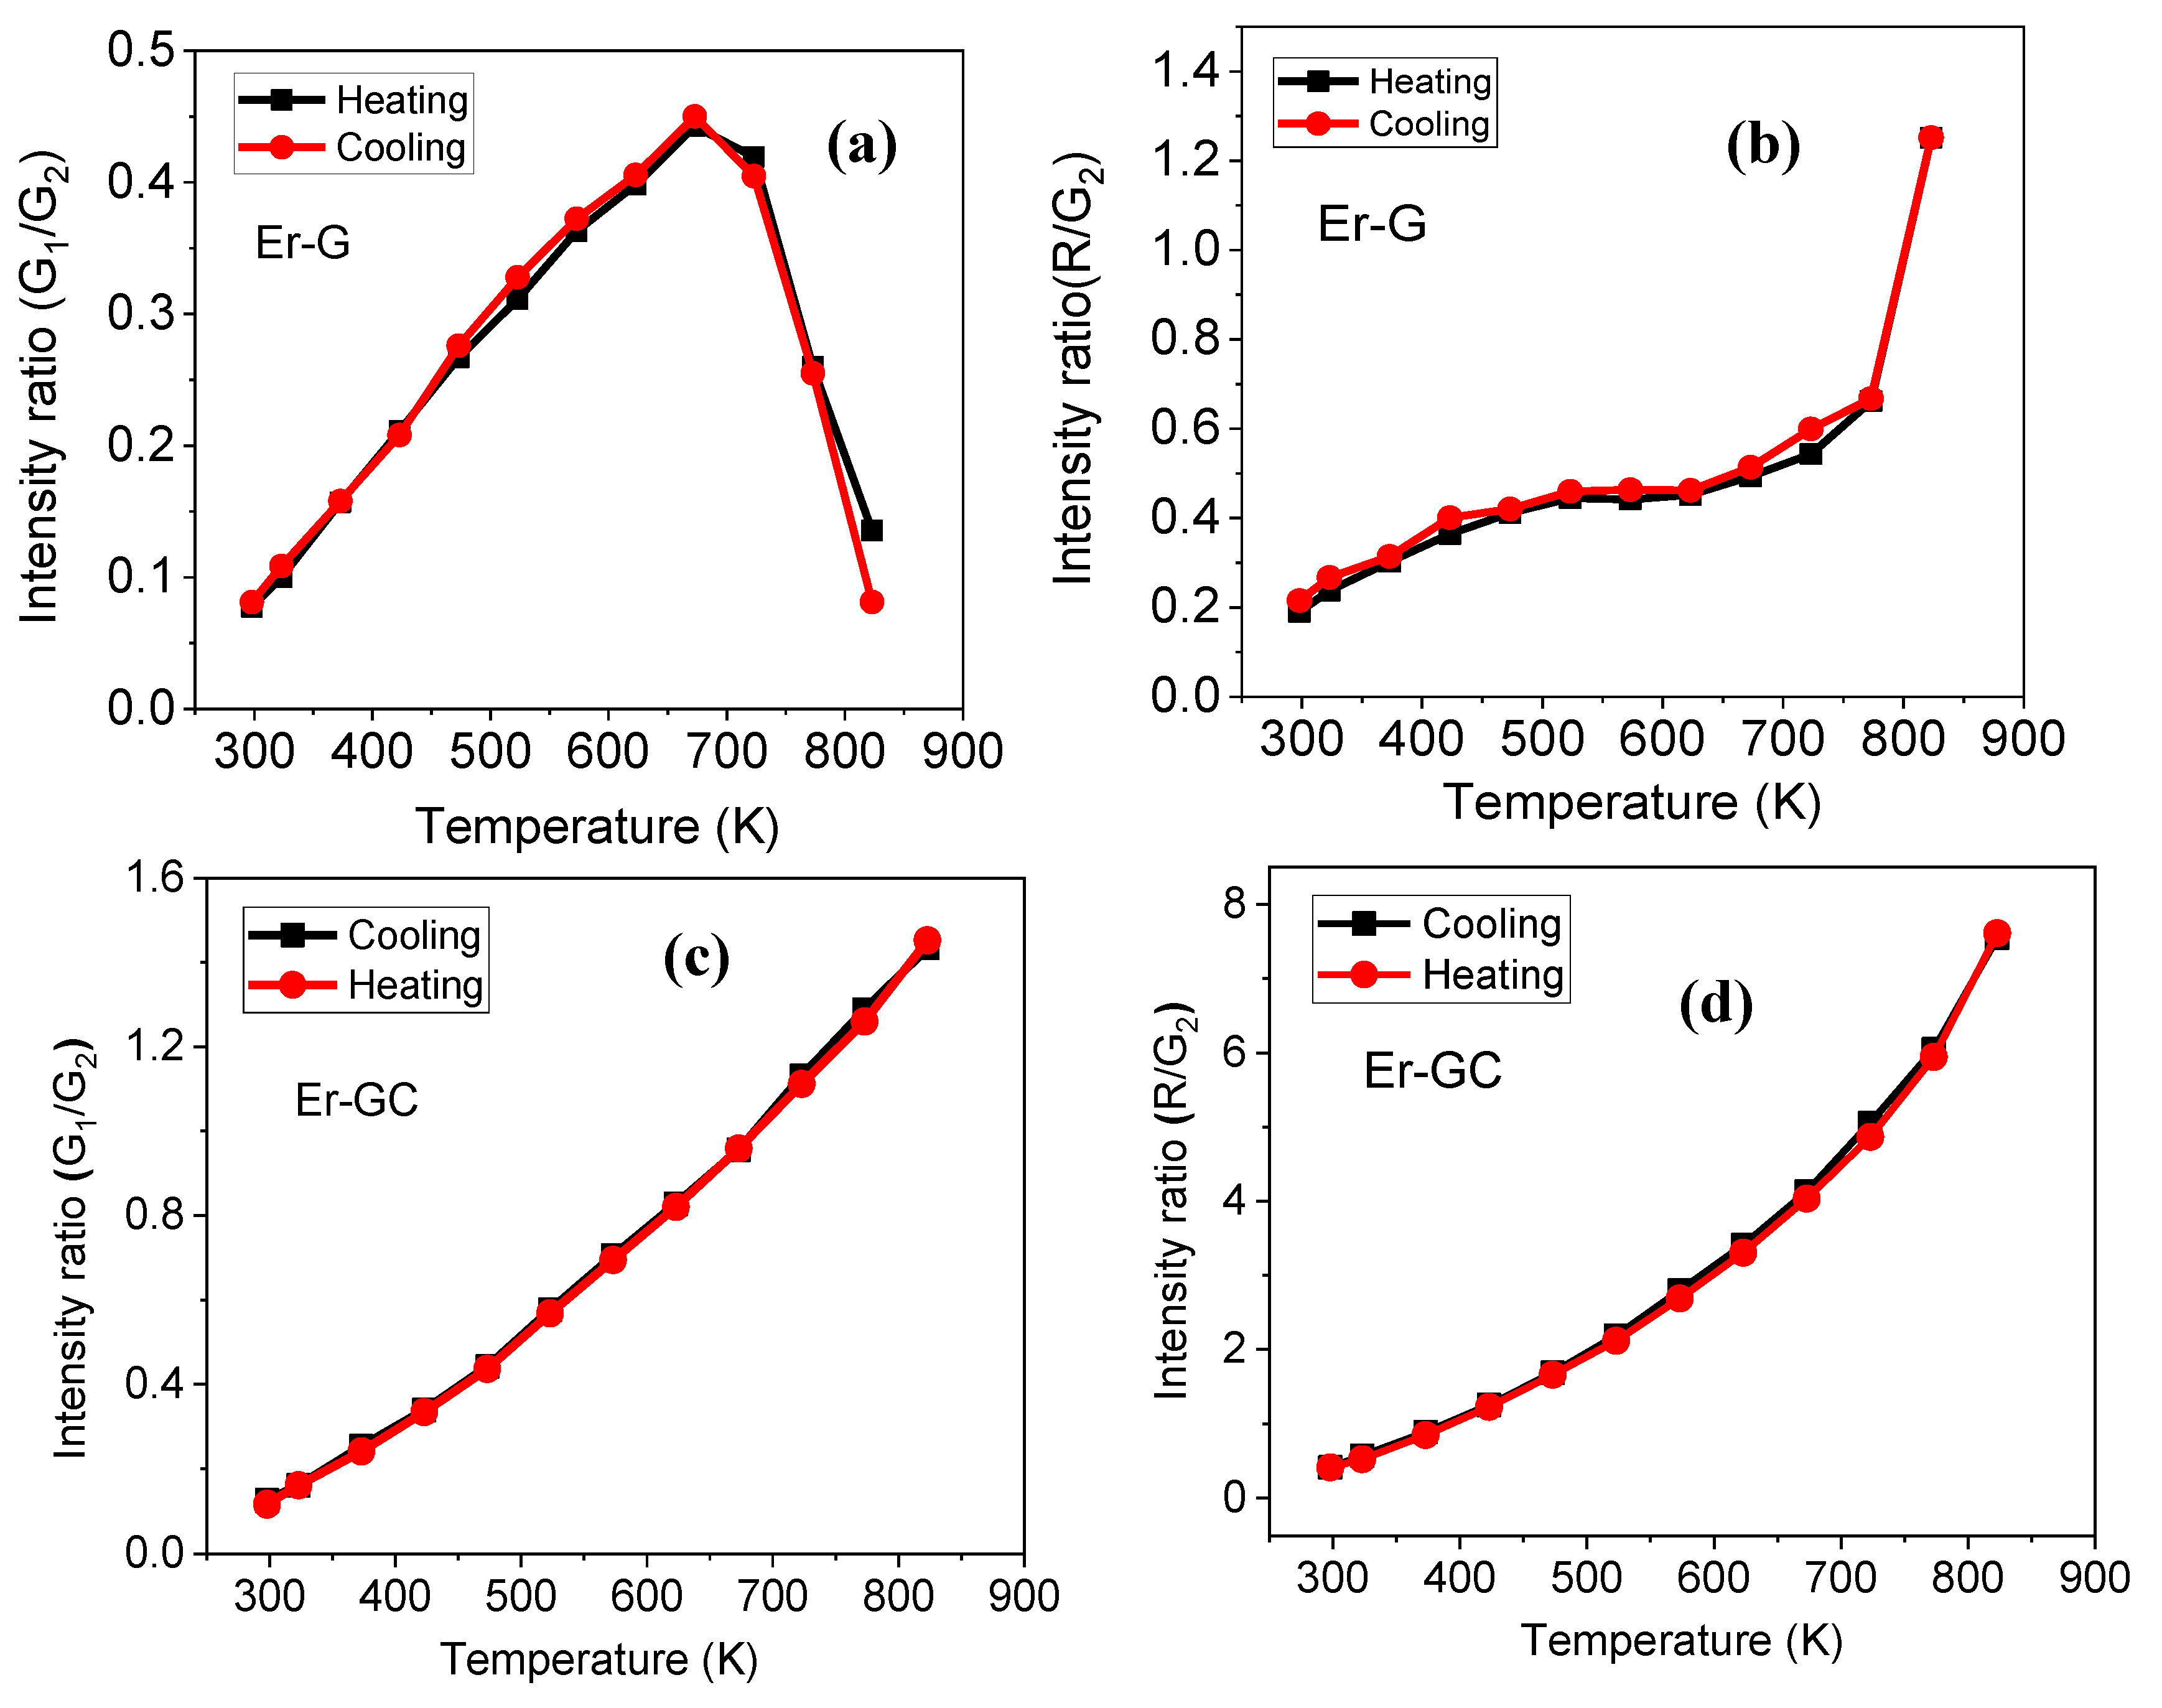
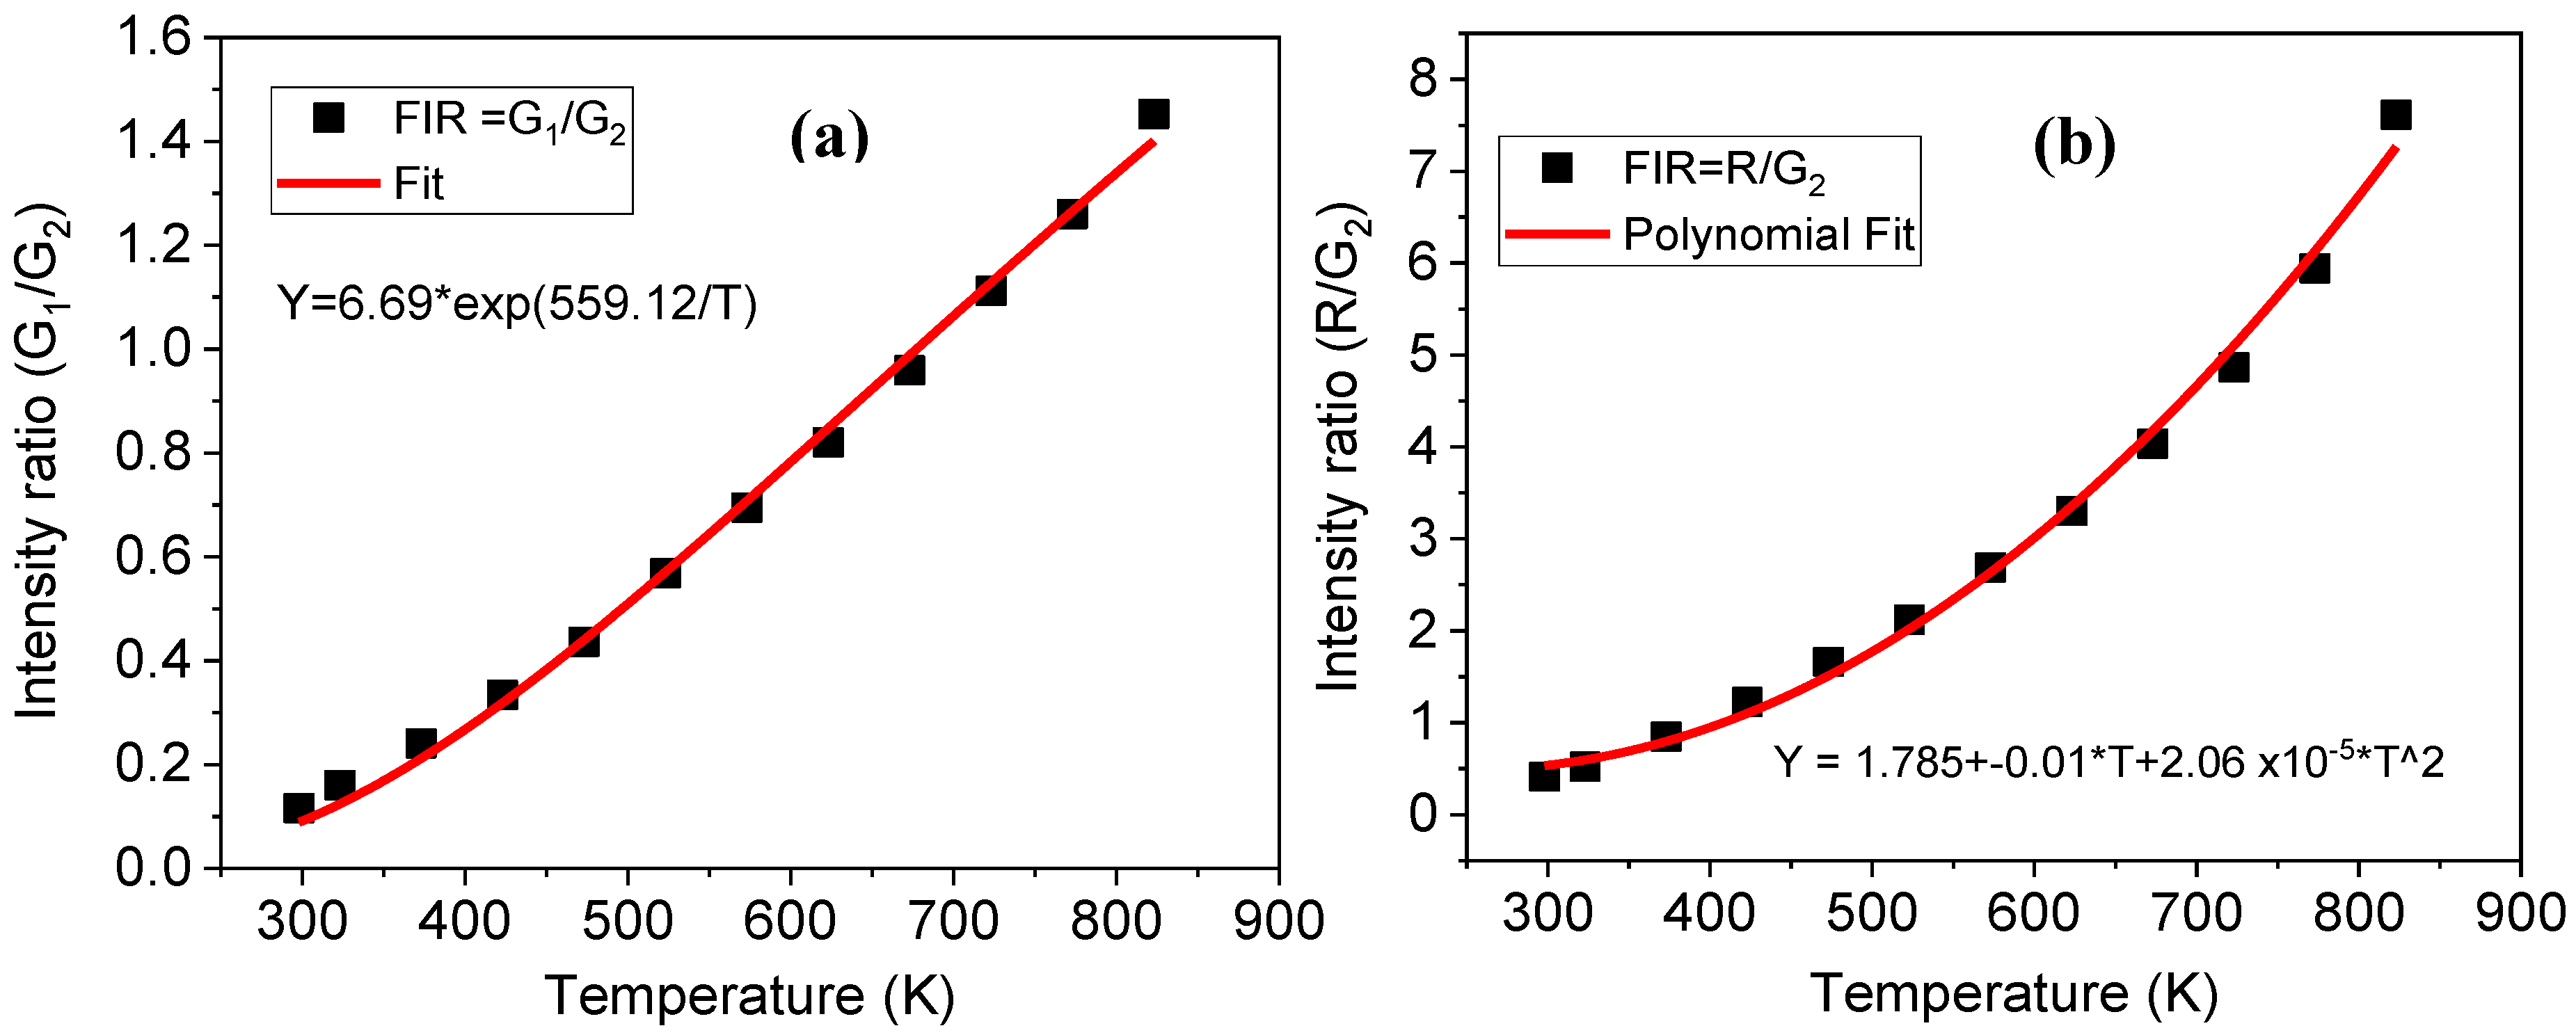
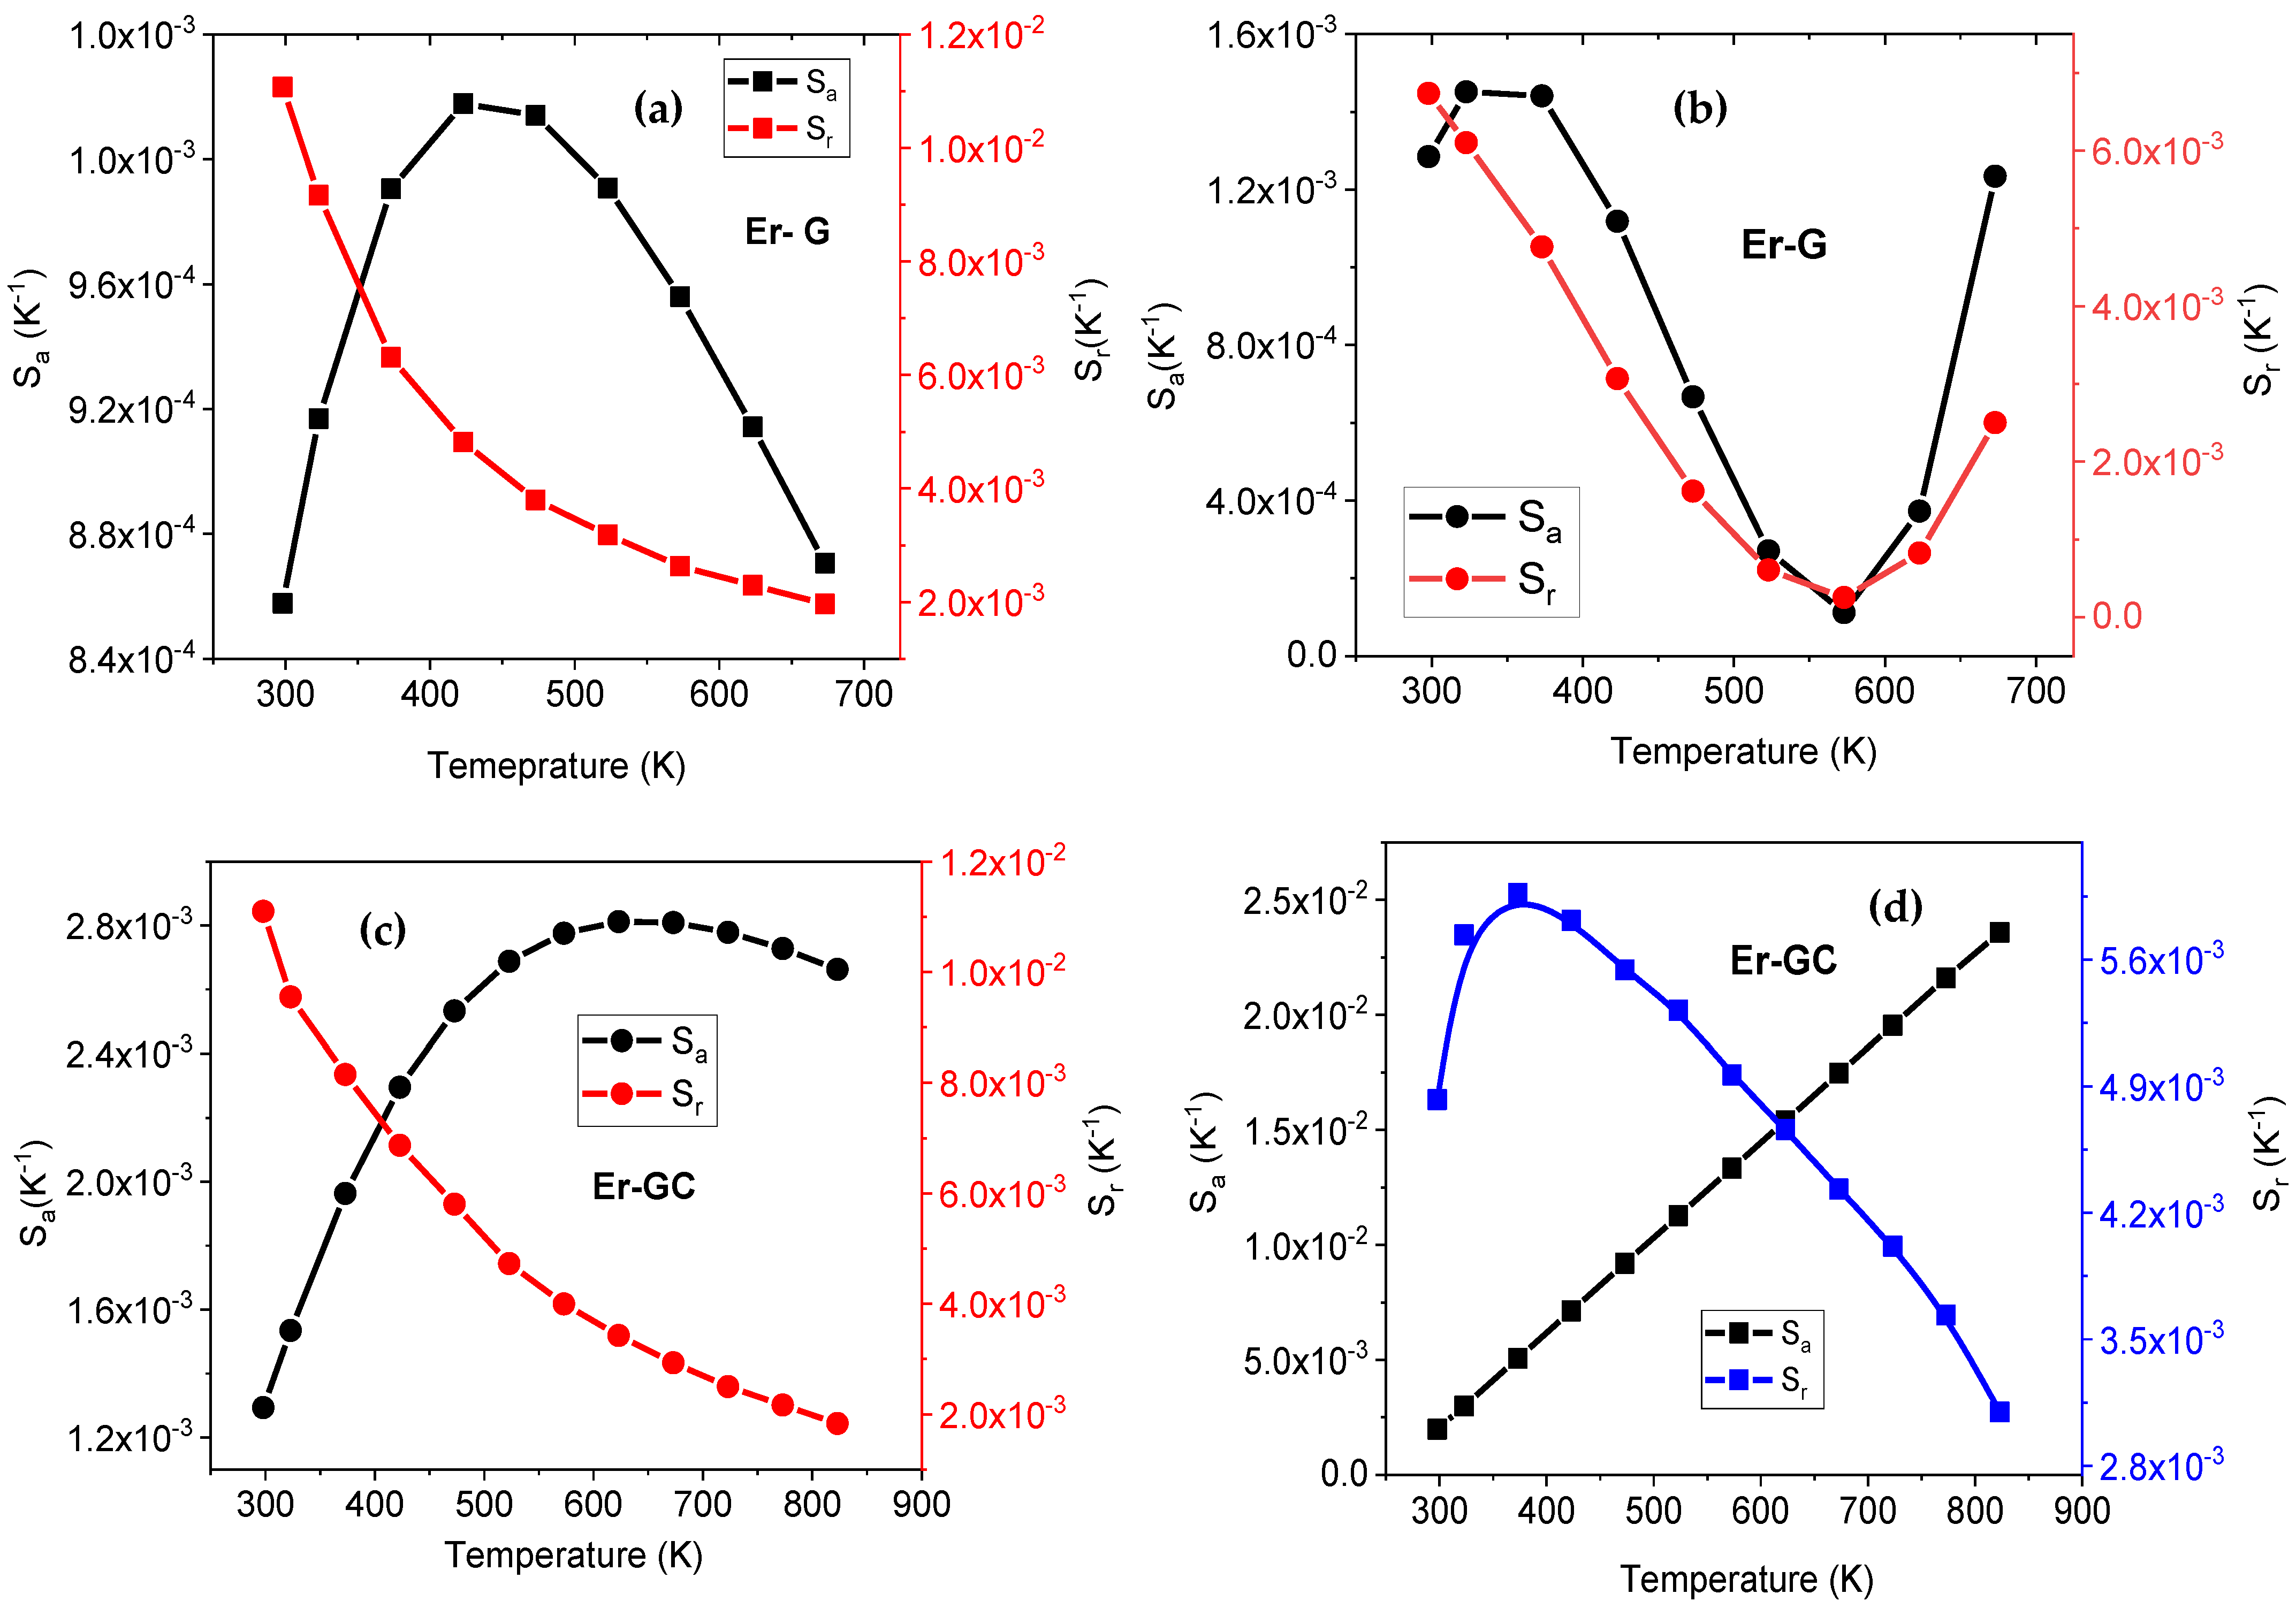
2. Results and Discussion

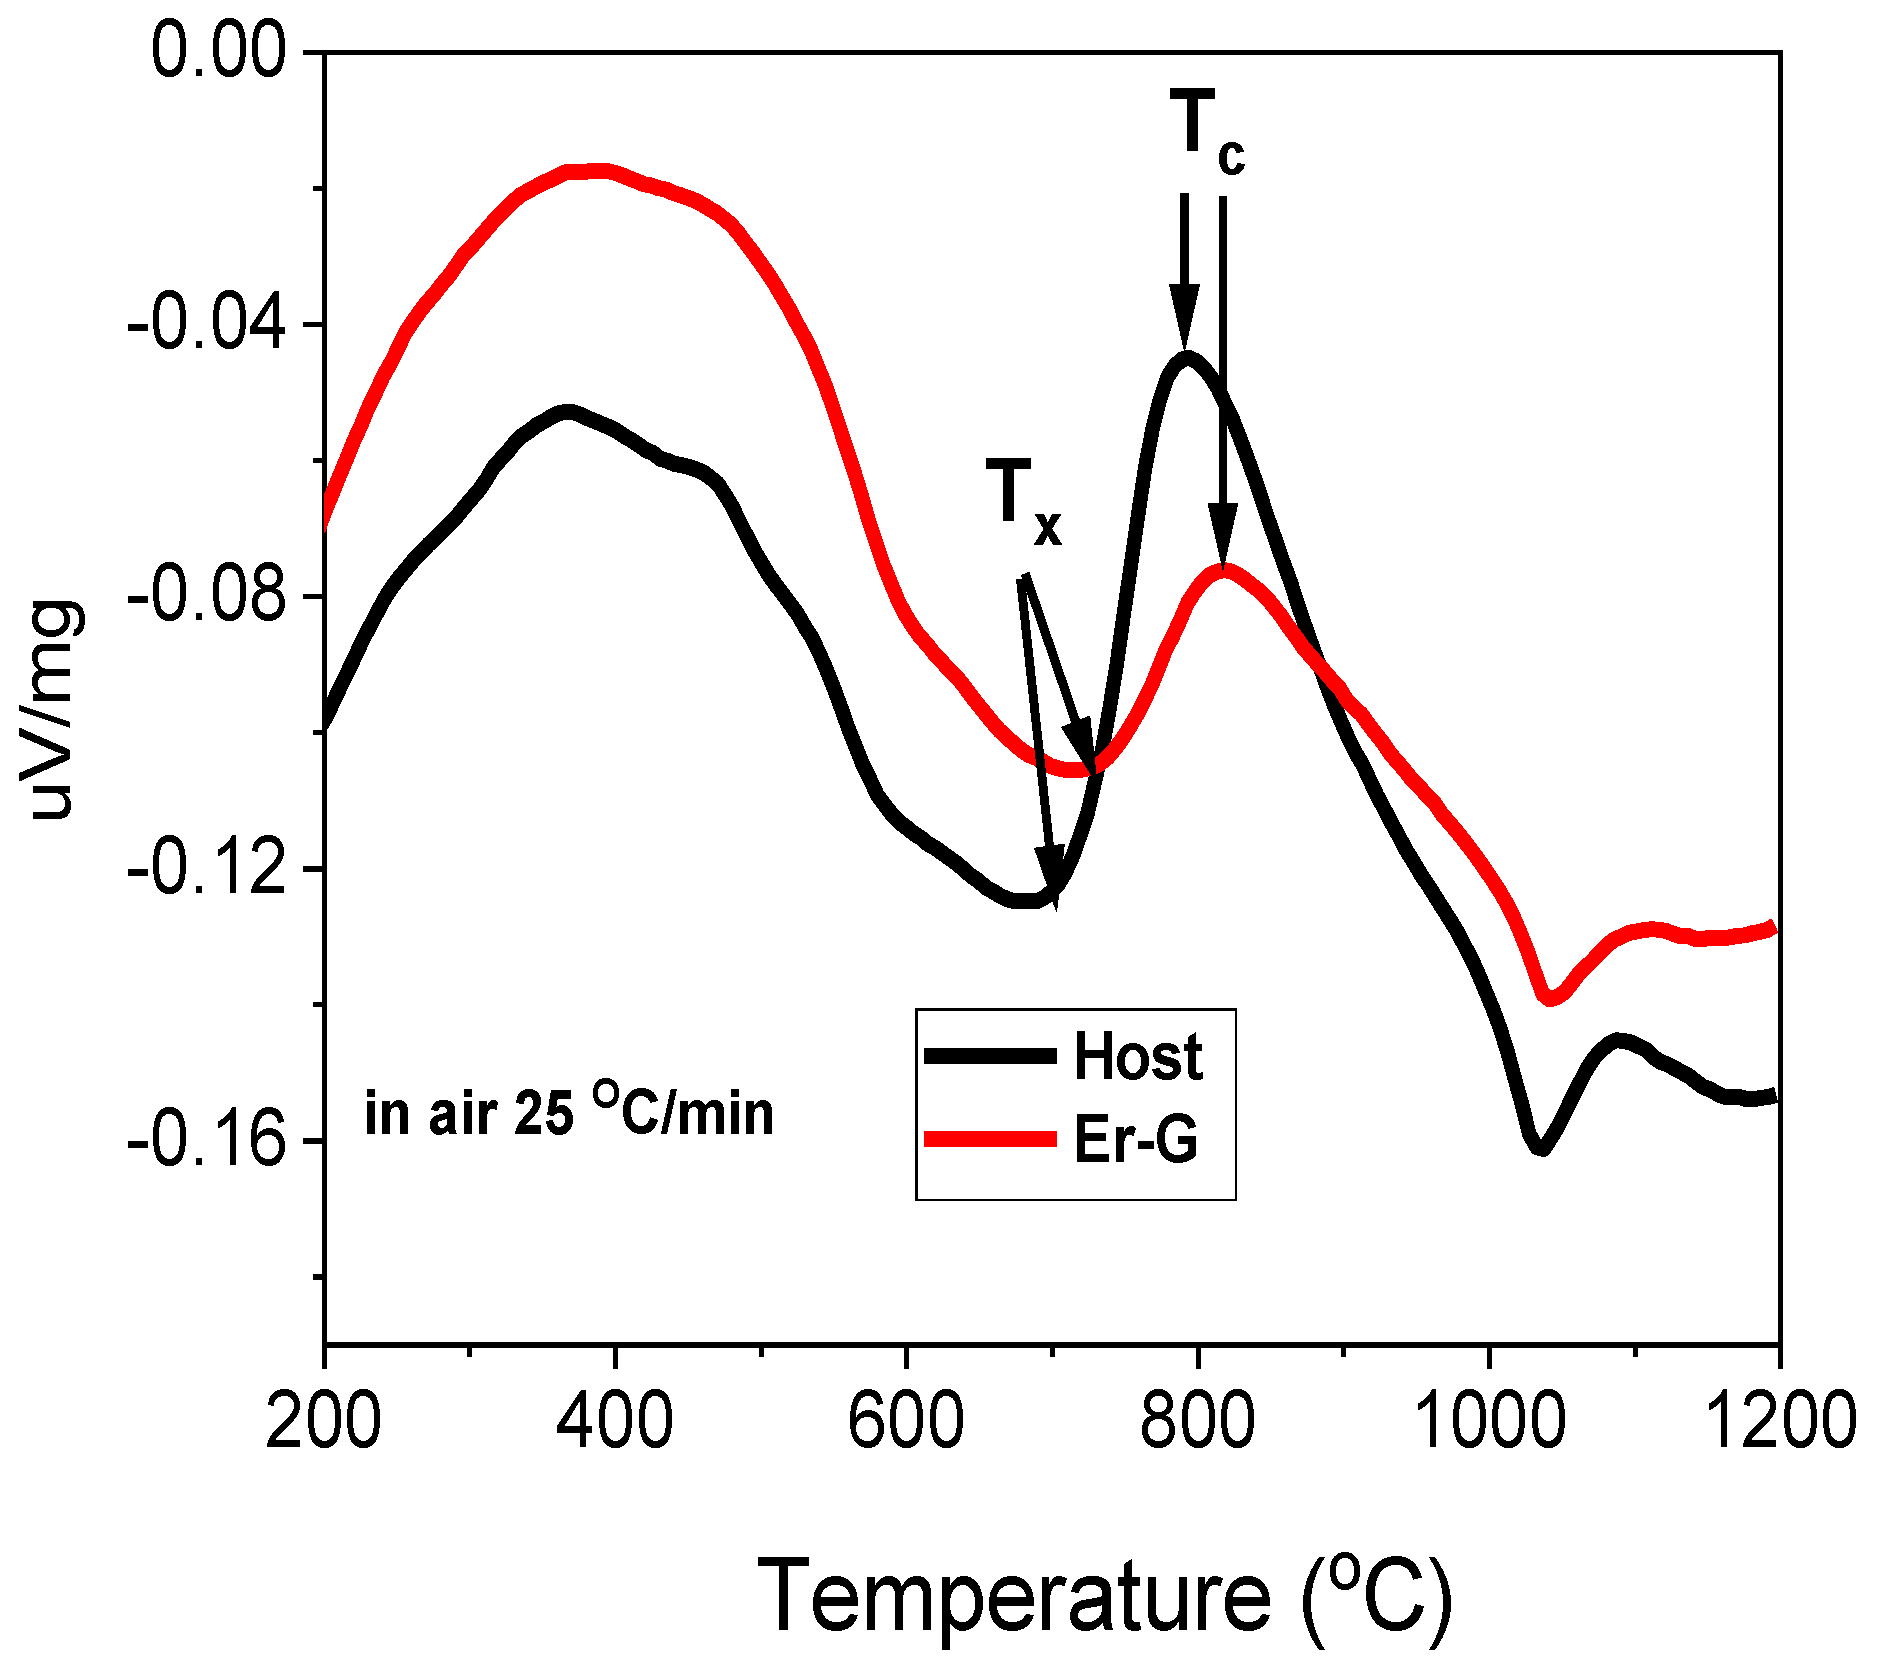
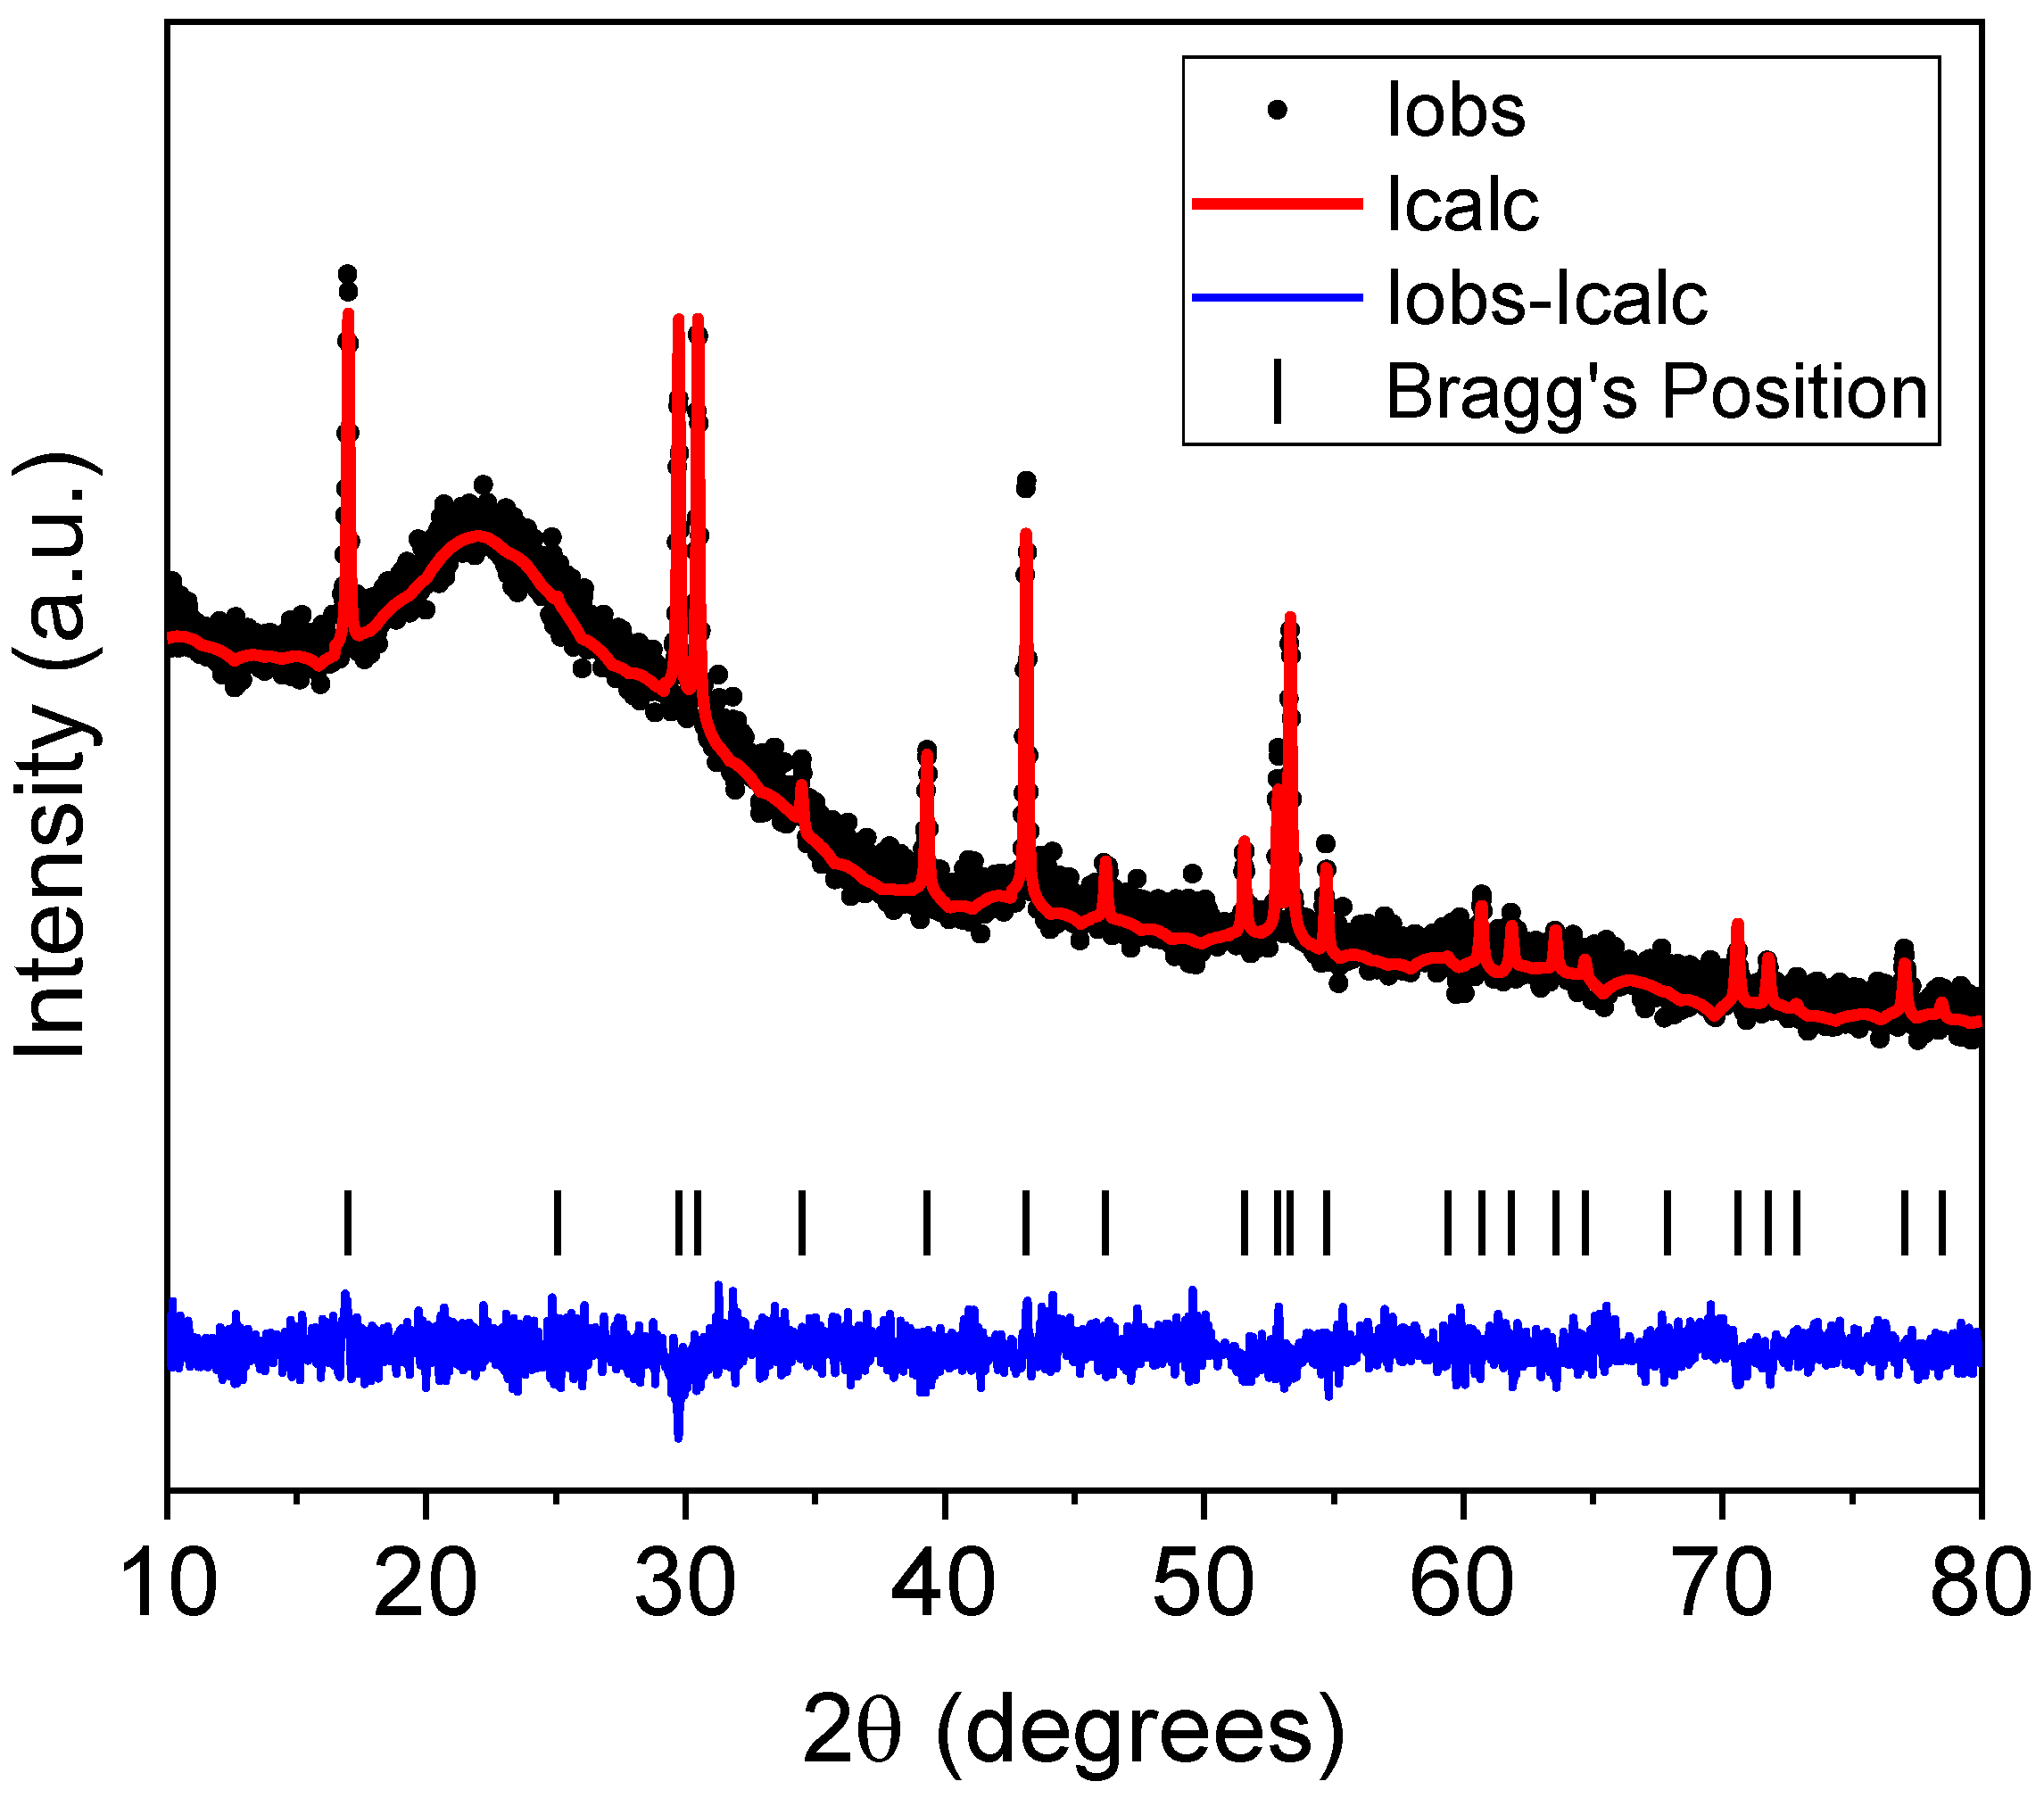
2.1. Thermal and Structural Characterization

Figure 2 depicts the DTA curves of the host and Er-G. Based on the profiles, the onset crystallization temperature (Tx) is around 695 °C and 728 °C and the bulk crystallization temperature (Tc) is around 795 °C and 820 °C for host and Er-G, respectively. The glass transition temperature (Tg) could not be discerned from the DSC curves. Therefore, dilatometry analysis for both host and Er-G was carried out at a heating rate of 5 °C/min (not shown) and Tg was determined to be identical (~510 °C) for both compositions.
The XRD patterns of Er-G and Er-GC after the heat treatment (40 h) are shown in Figure 3. The Er-G diffraction pattern showed only a broad halo, indicating its non-crystalline nature. When Er-G was heat-treated for 40 h at 650 °C, diffraction maxima were observed, that were in a good agreement with the JCPDS card # 00-016-0334, indicating the presence of a pure hexagonal sodium yttrium fluoride phase in the GCs. Based on the XRD data, the Rietveld method was used to refine the crystal structure of the Er-GC materials, as shown in Figure 4. The results are presented in Table 1.
The Figure 4 shows that the fitting has good convergence, as indicated by the low R factors and a close match between the calculated and experimental patterns. The Rietveld refinement confirmed that the Er-GC contains hexagonal sodium yttrium rare-earth fluoride phase, Na1.5Y1.45Er0.05F6. The data are in good agreement with the works of Krämer et al. [35] and Grzechnik et al. [36] who thoroughly investigated the crystal structure of Na1.5Y1.5F6. No traces of cubic phase or other impurity phase was detected.

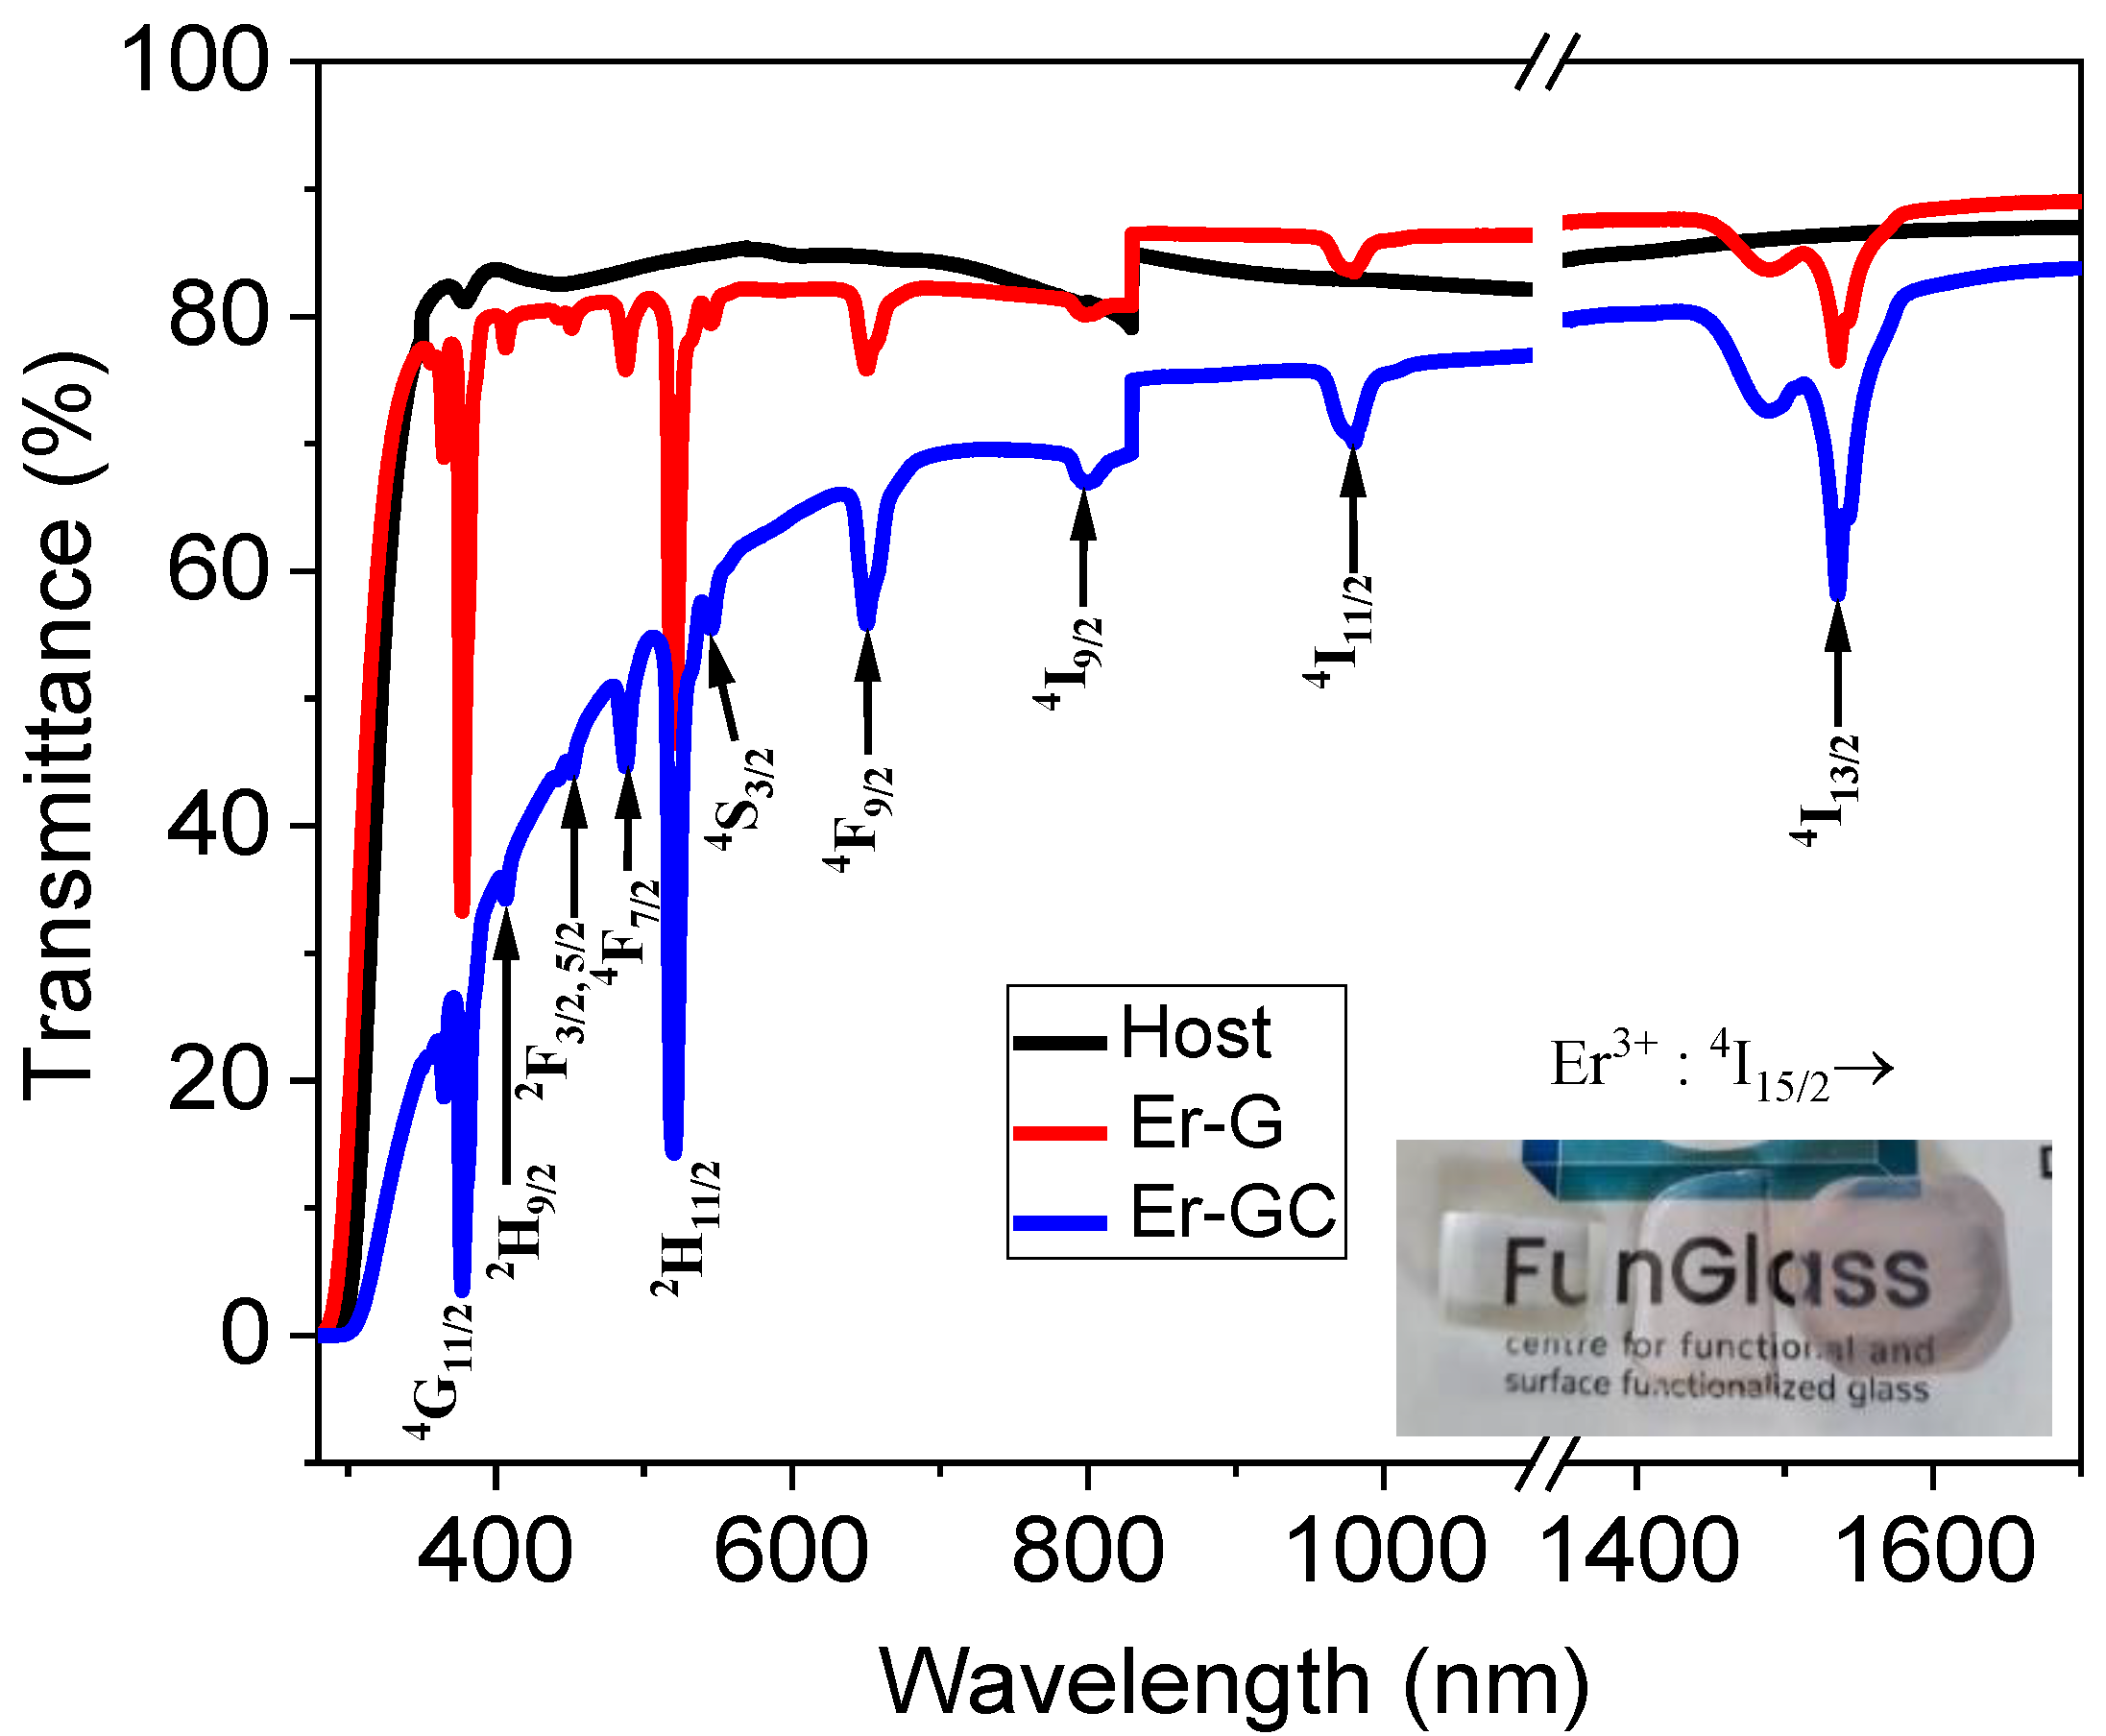
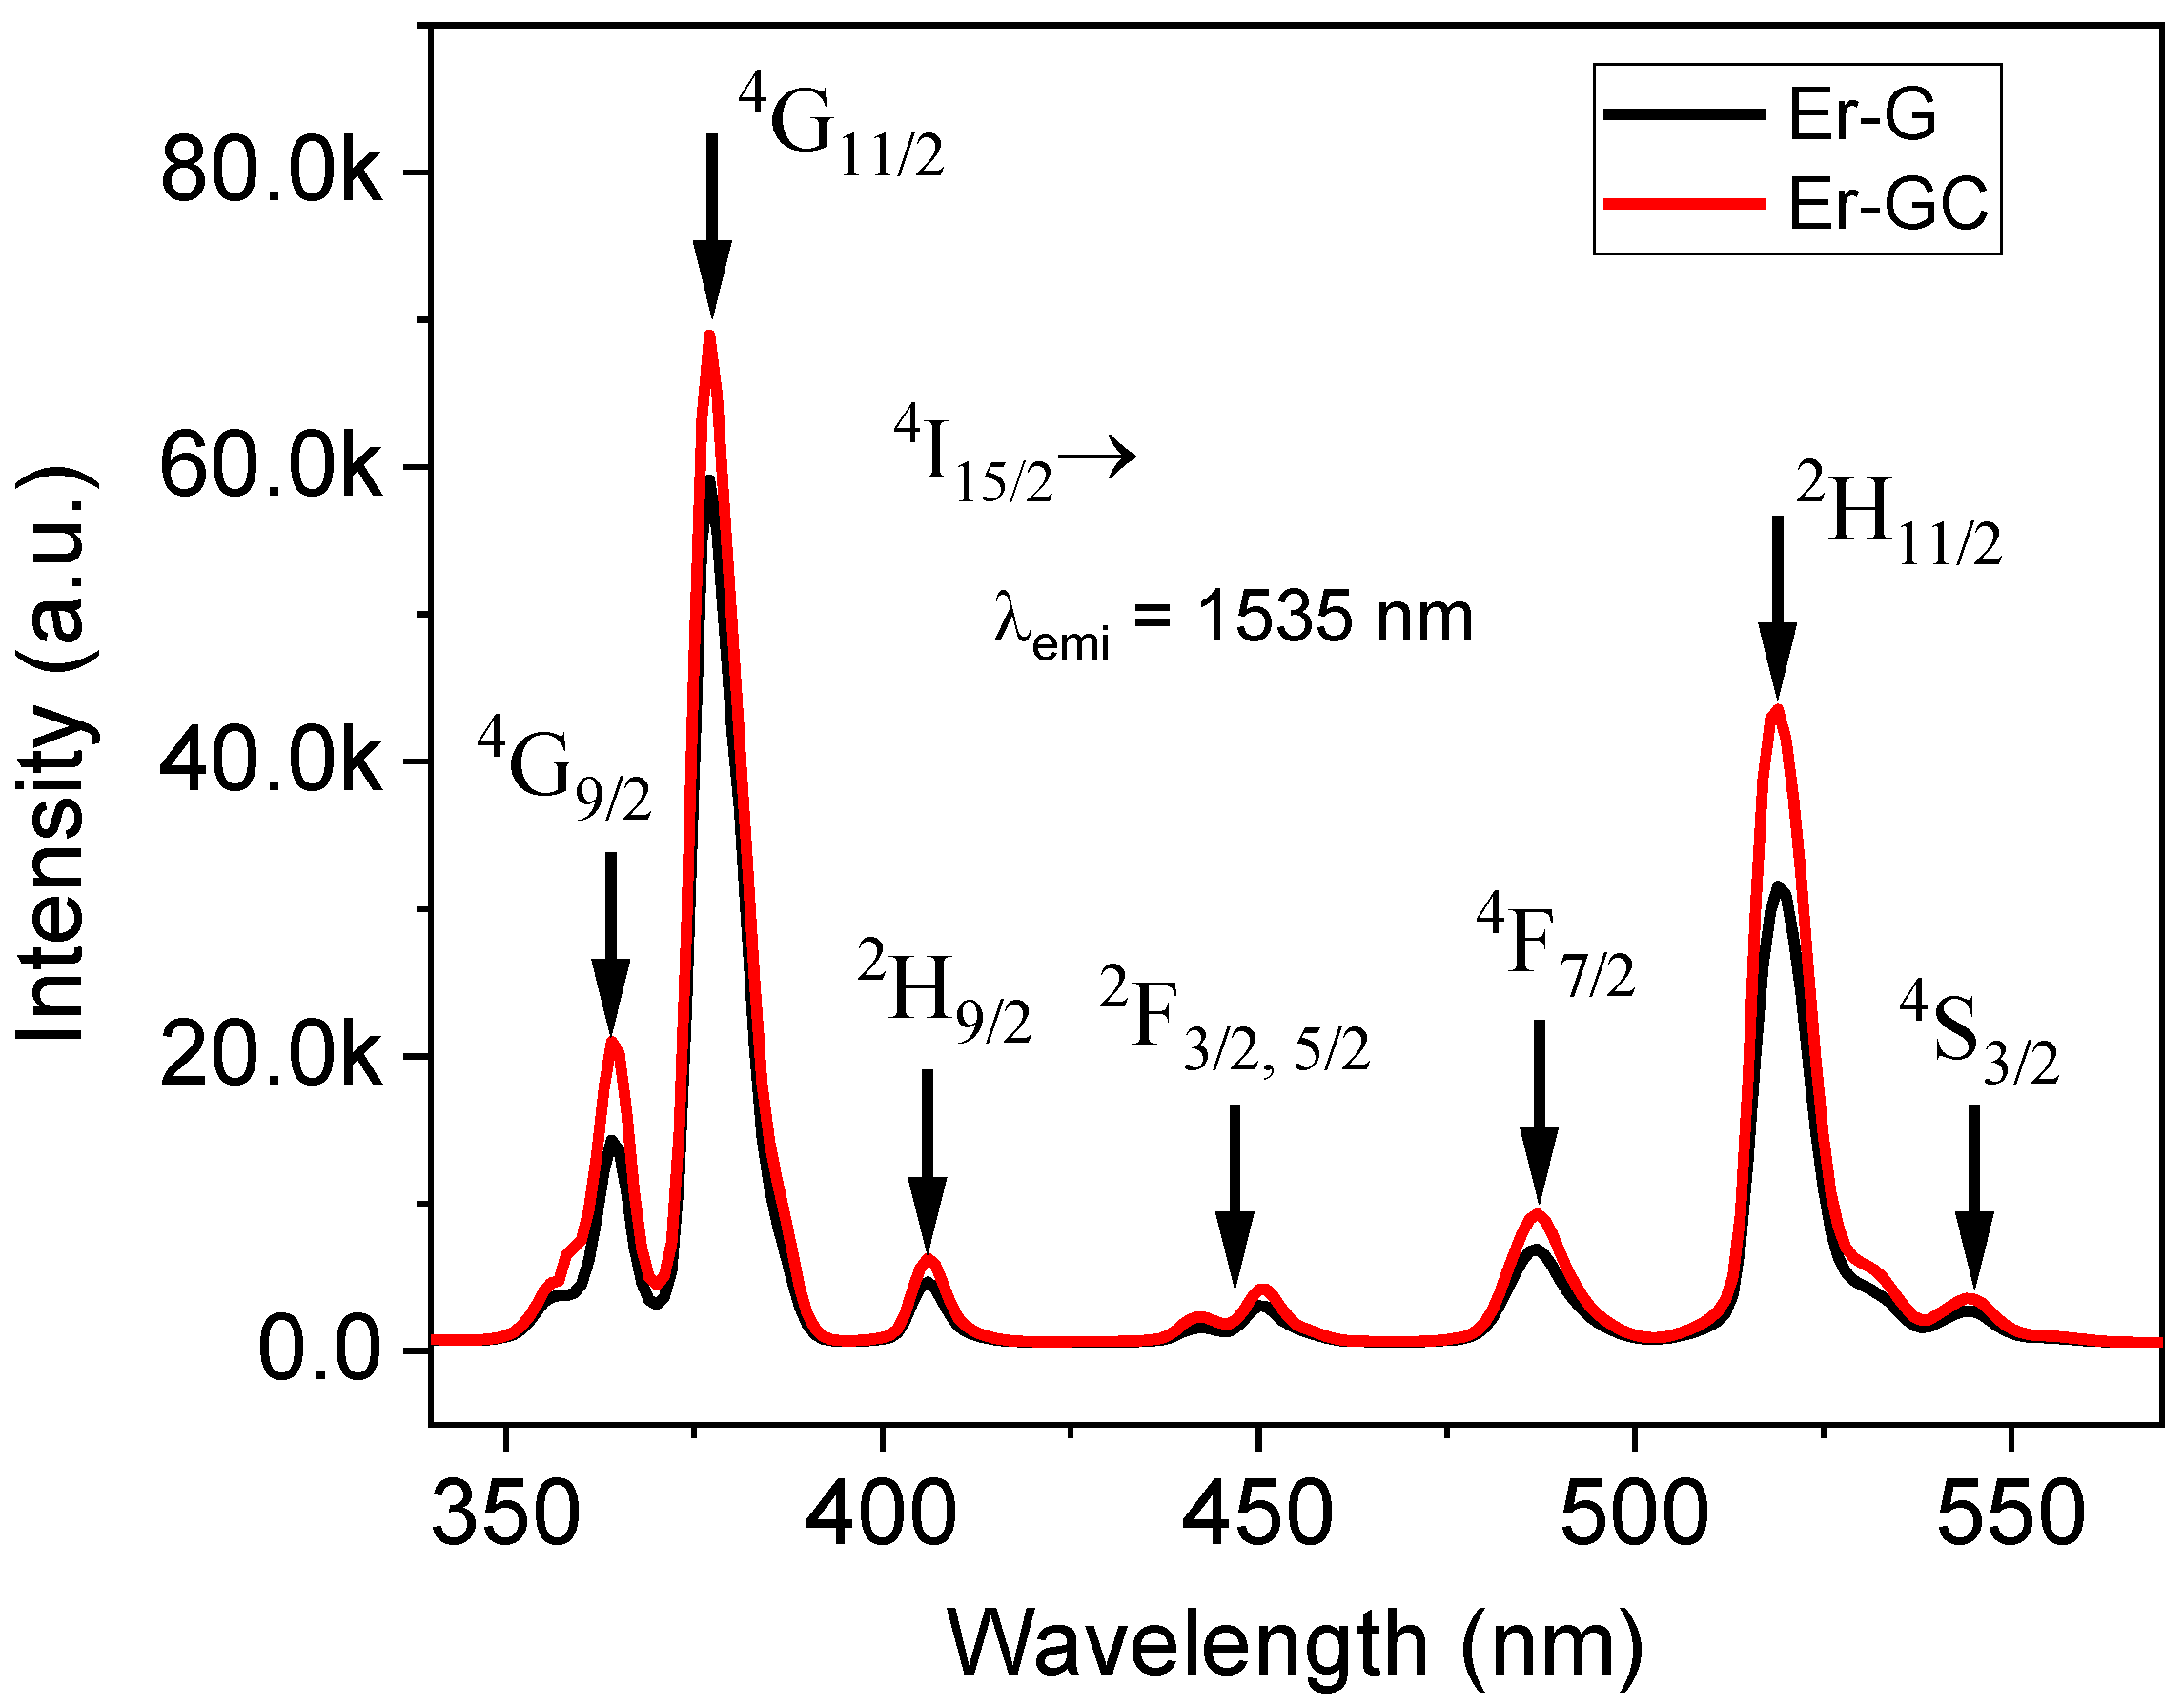
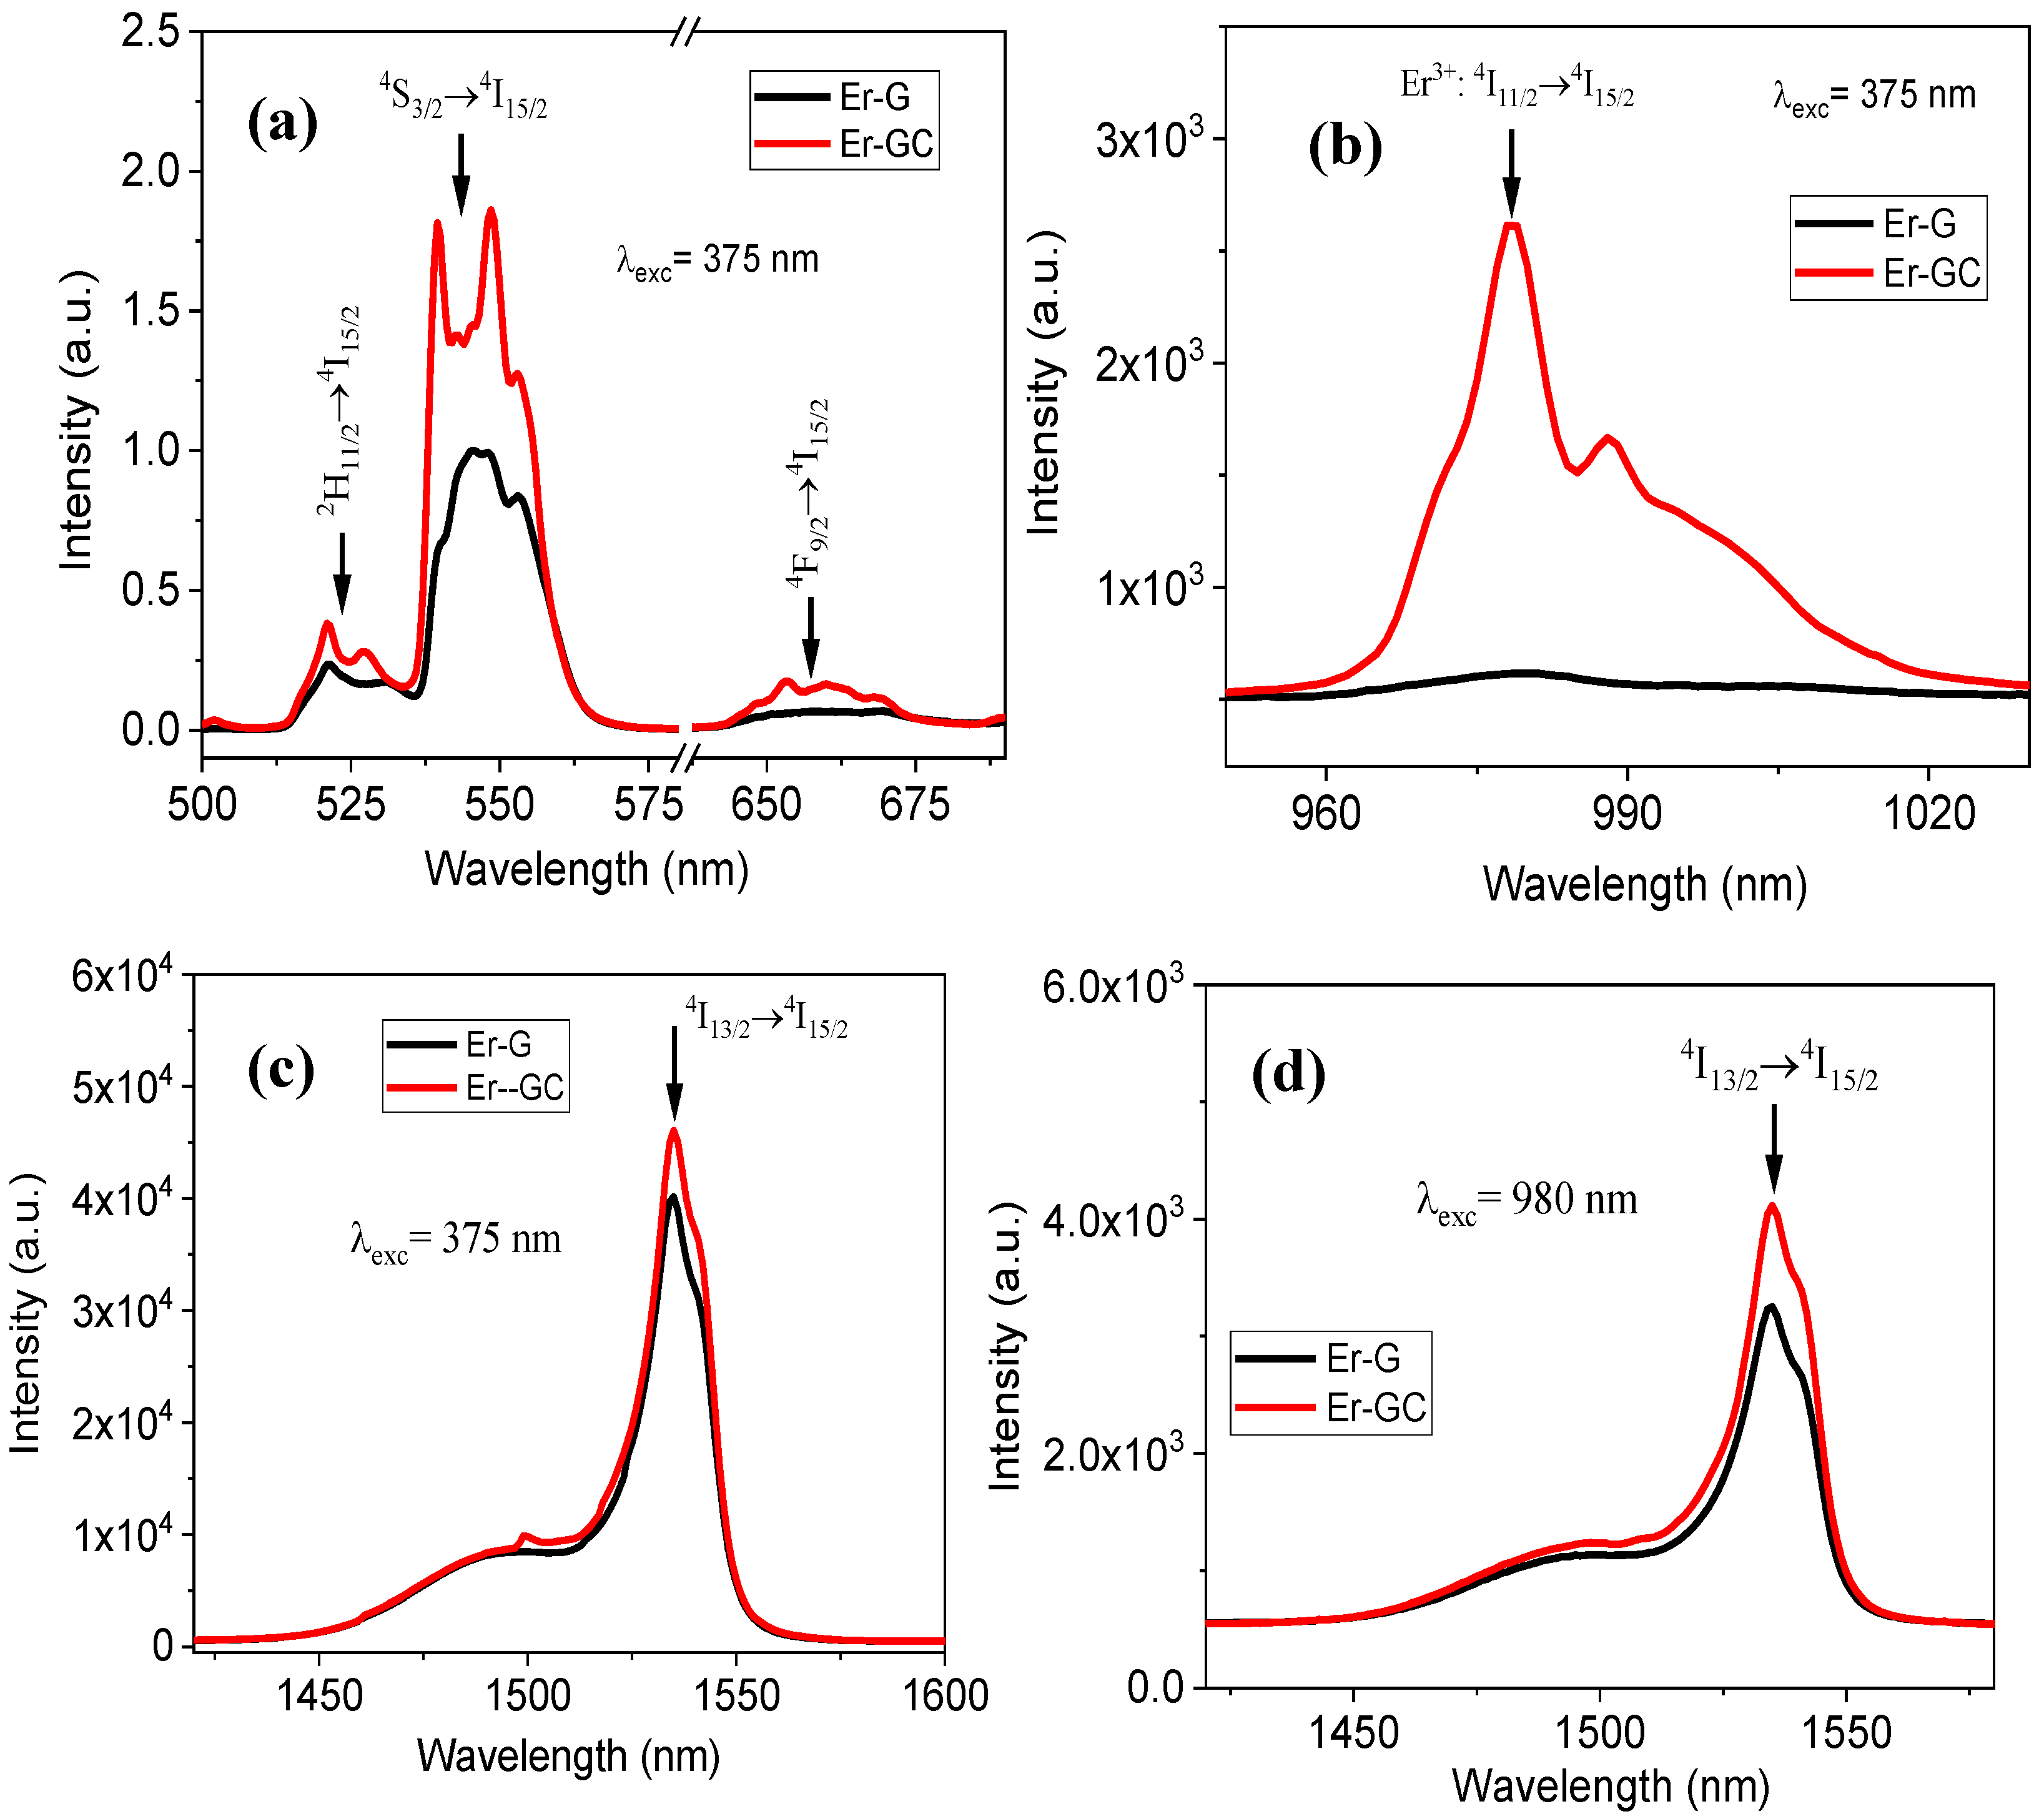
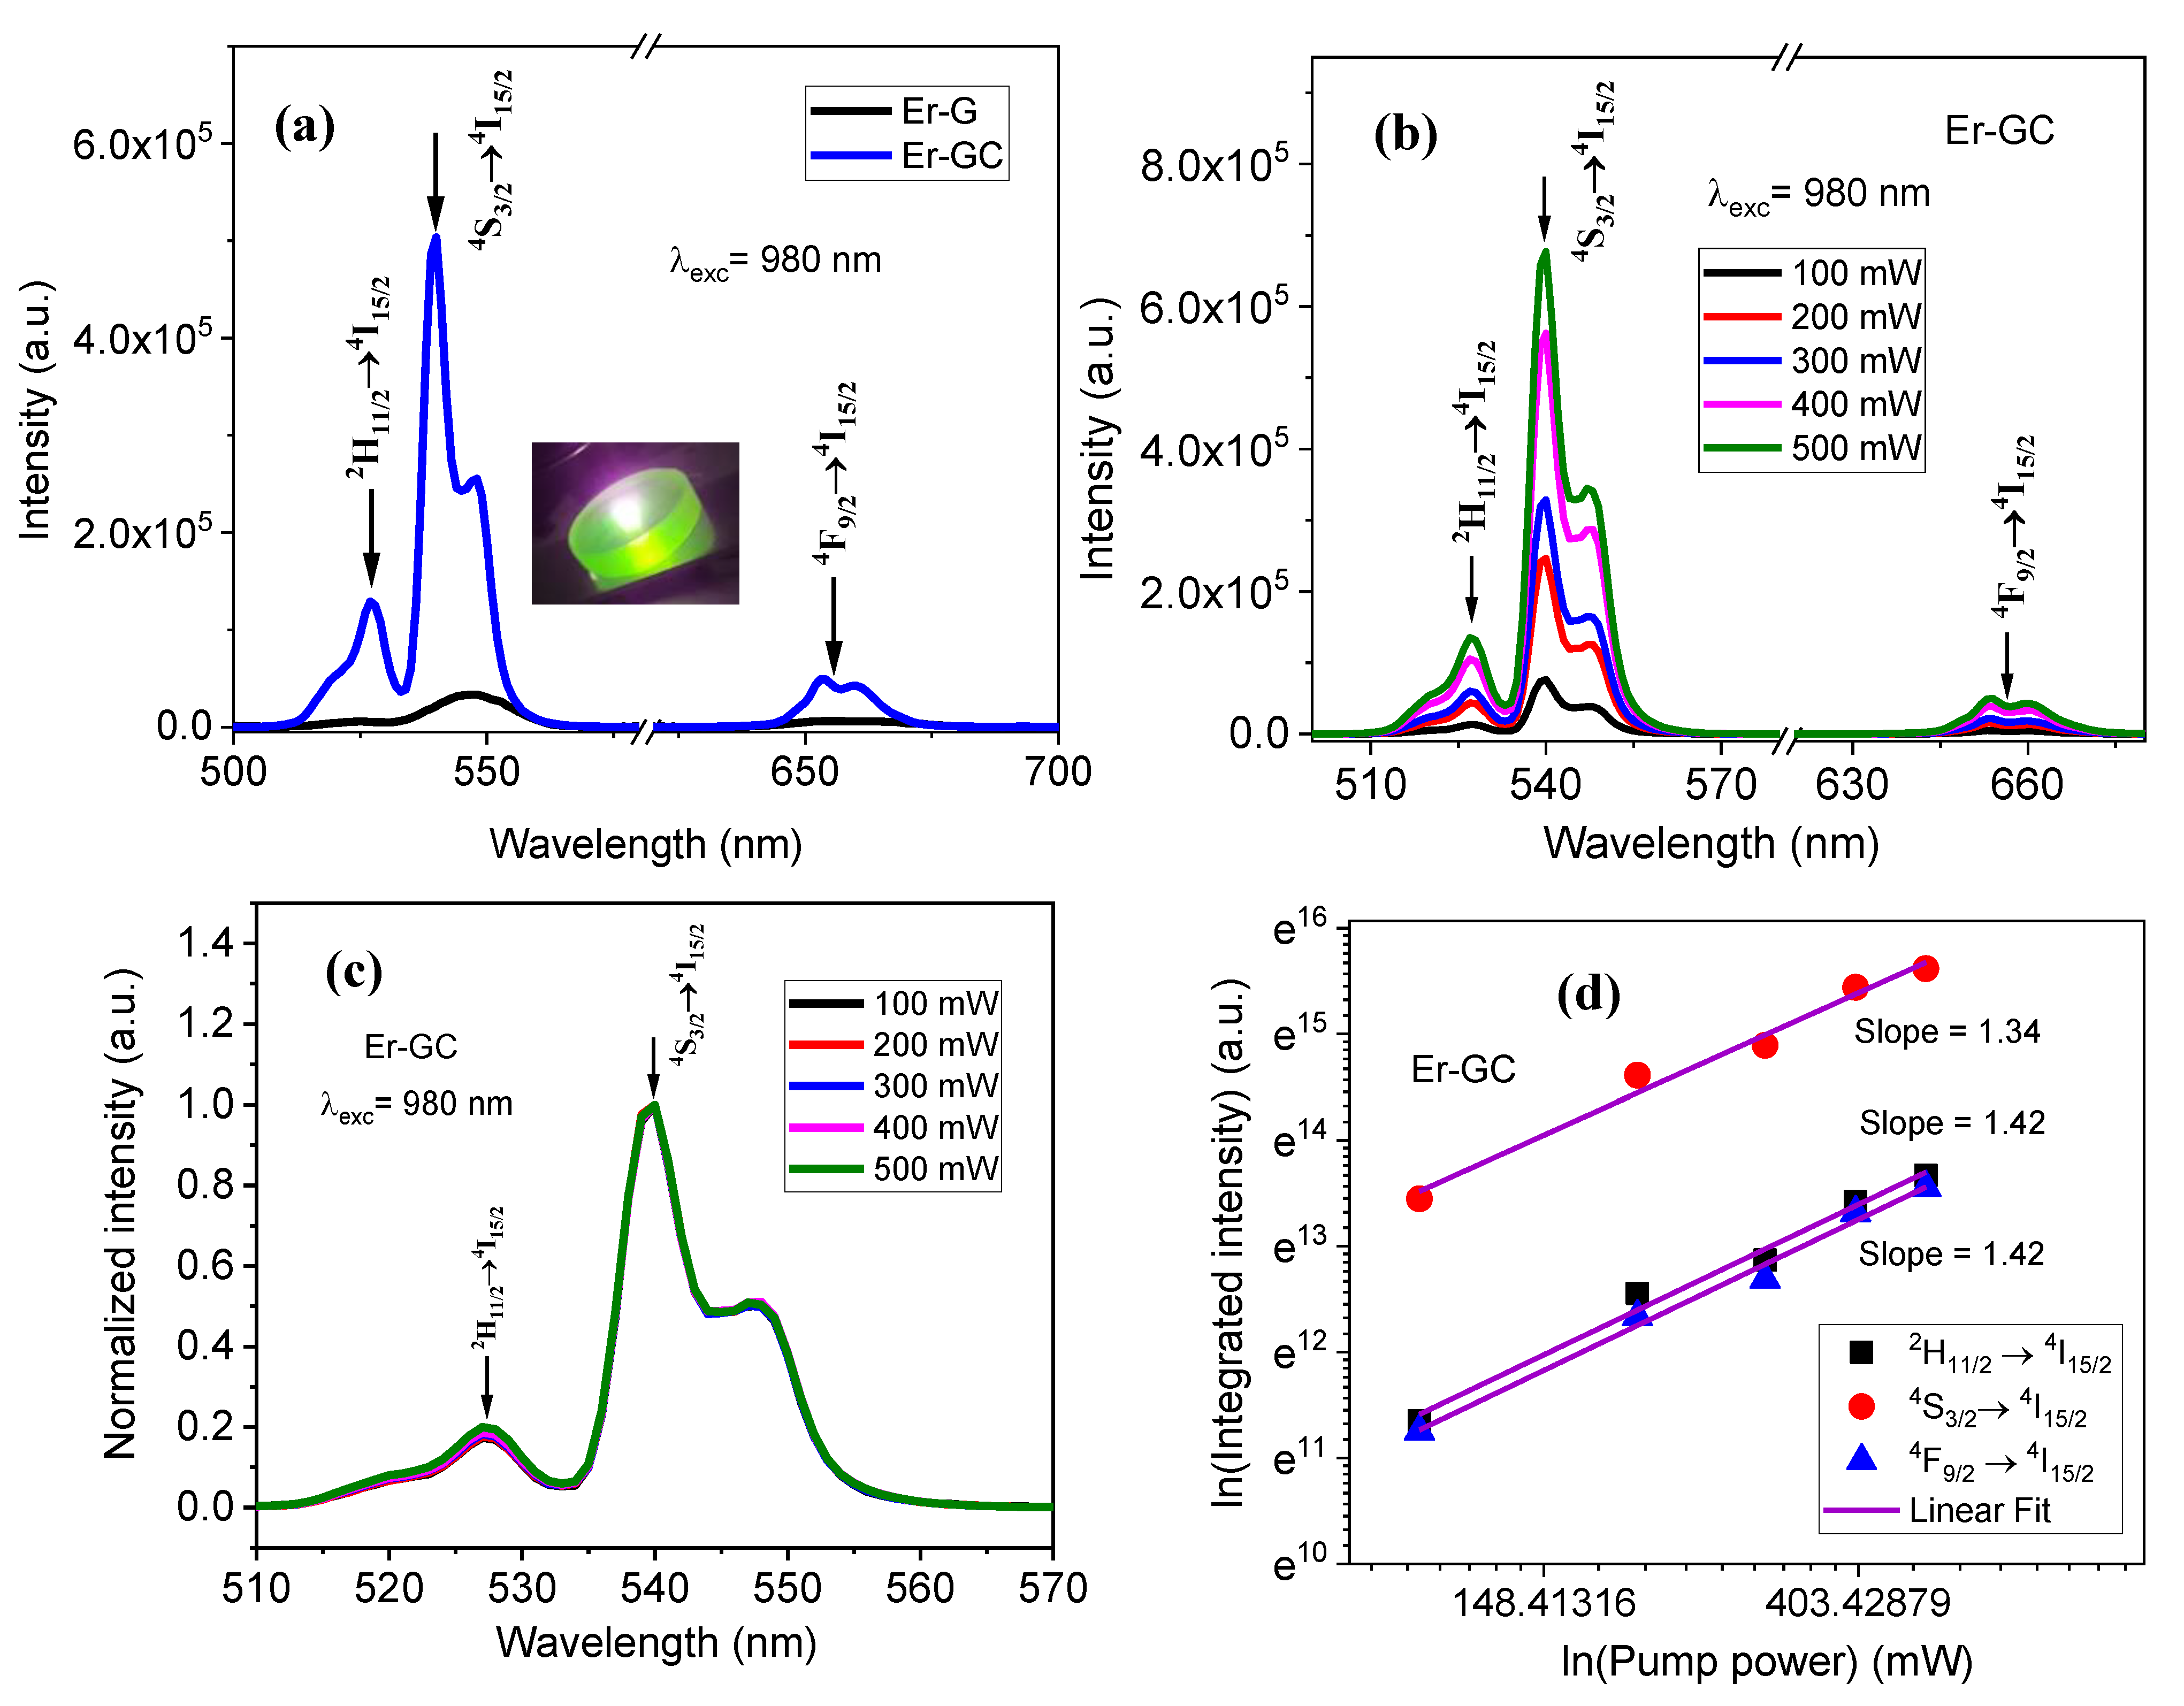
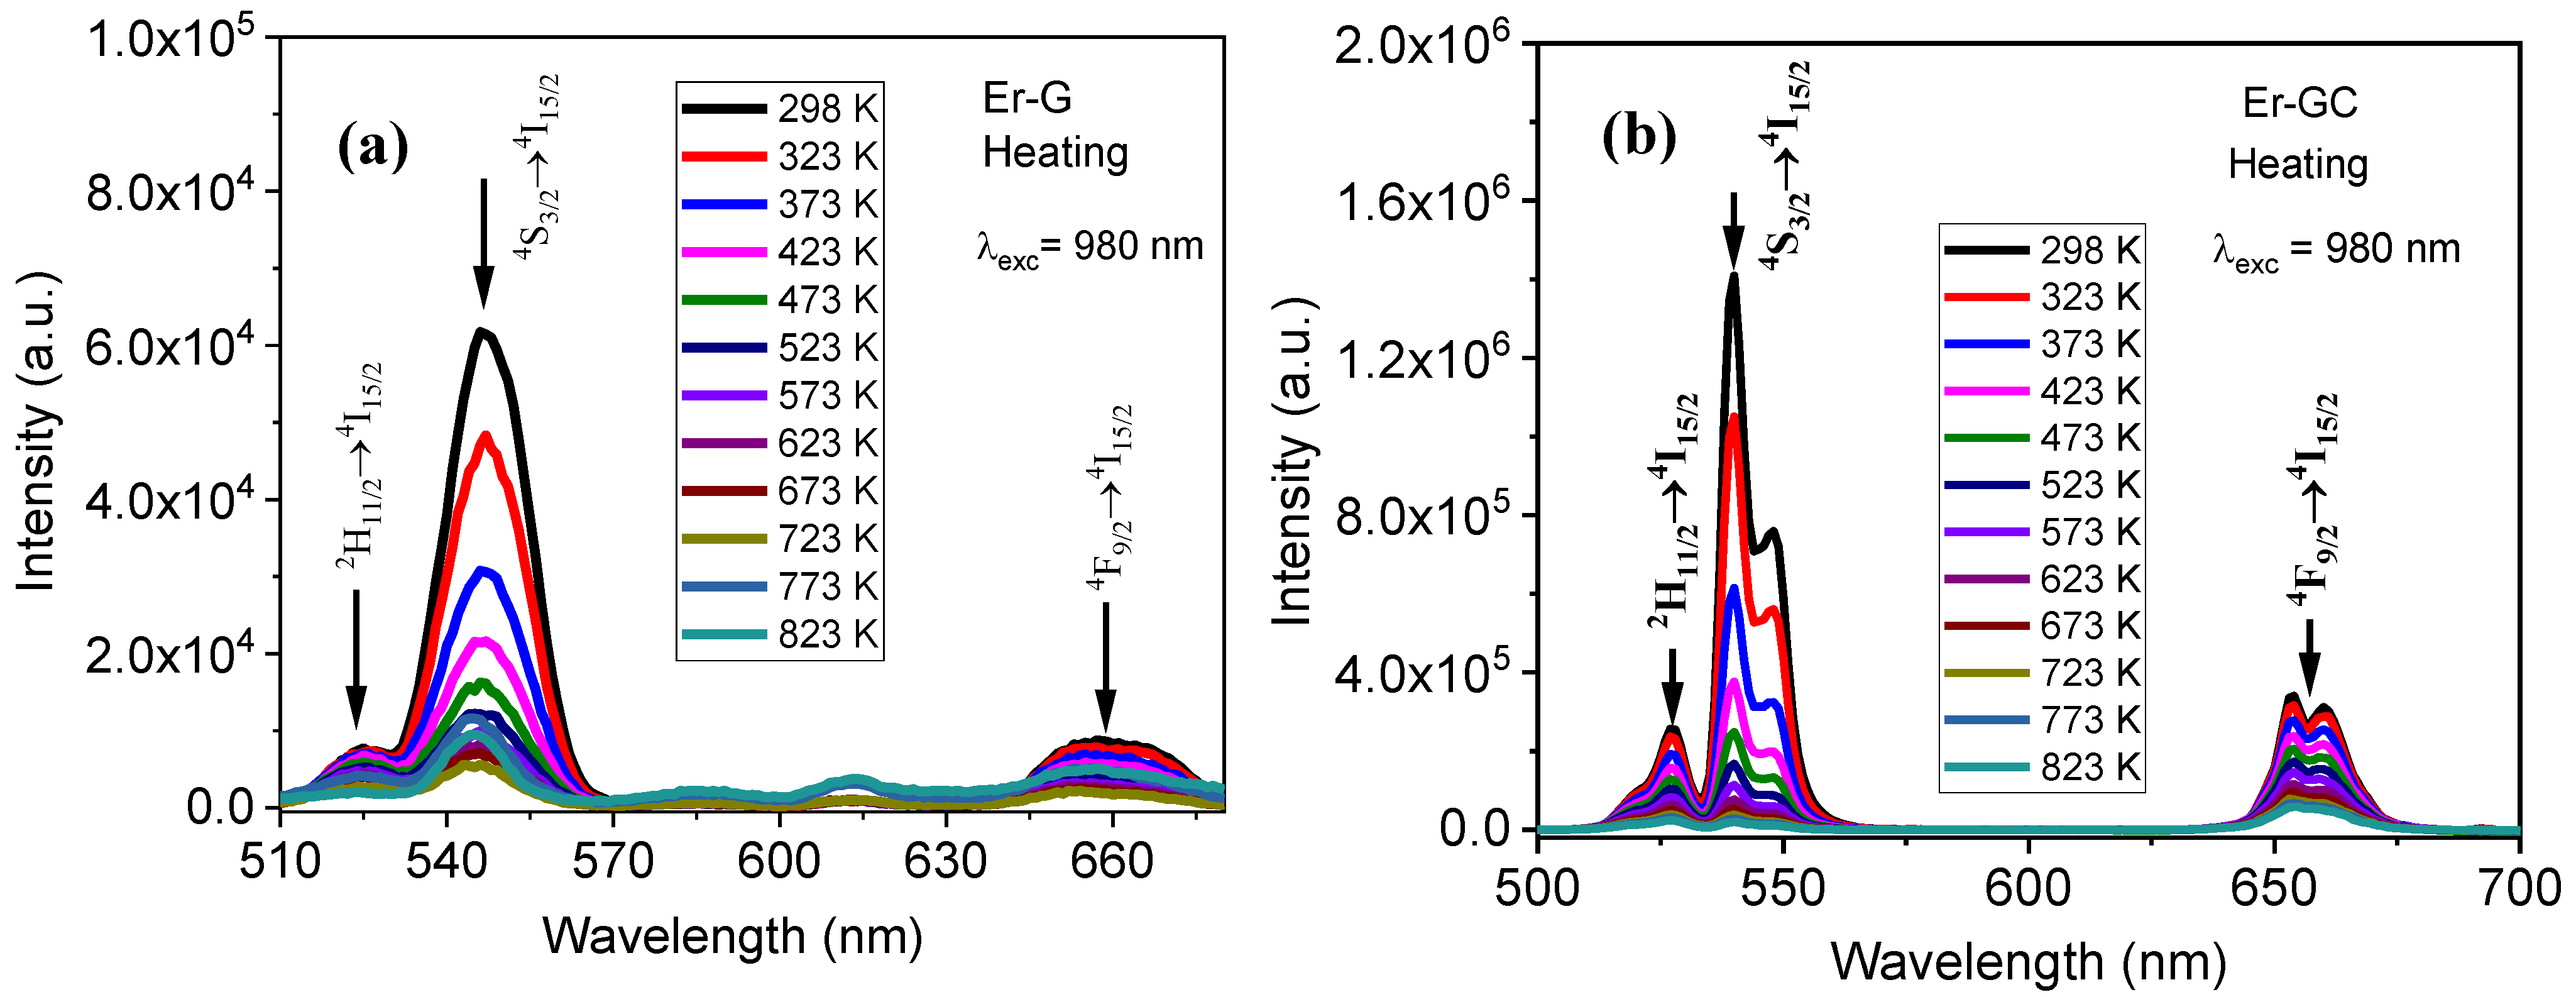
2.2. Optical Characterization

The transmittance spectra of the host, Er-G, and Er-GC samples in the wavelength range from 280 to 1700 nm are shown in Figure 5. Er3+ transmission bands at 1537, 980, 799, 650, 545, 522, 489, 451, 406, and 375 nm were assigned to transitions from the ground state, 4I15/2, to excited states, 4I13/2, 4I11/2, 4I9/2, 4F9/2, 4S3/2, 2H11/2, 4F7/2, 2F5/2, 3/2, 2H9/2, and 4G11/2, respectively. No change in band position has been observed, but the transmittance of Er-GC decreased in comparison to host glass. The daylight picture of the host, Er-G, and Er-GC are shown in the bottom inset in Figure 5 (from left to right).
The photoluminescence excitation spectra (PLE) in the visible region and near-infrared region (NIR) for Er-G and Er-GC were measured at the emission wavelength of 1535 nm, as shown in Figure 6. The intensity of all excitation bands in glass-ceramic (Er-GC) increased when compared to that of the glass due to a change of local environment of the Er3+ ions during crystal precipitation. The band at 375 nm (4I15/24G11/2) was selected from among all excitation bands to record the emission spectra.
Figure 7 depicts photoluminescence (PL) spectra recorded at the excitation wavelength 375 nm for the visible and near-infrared (NIR) spectral regions and at the excitation wavelength 980 nm for the NIR region. The intensities of the emission bands in glass-ceramic (Er-GC) are higher than those observed in the glass (Er-G). Furthermore, crystal filed splitting in Stark components has been observed in Er-GC at emission transitions, 4S3/24I15/2 and 4I11/24I15/2. The intensity and crystal field splitting in emission transitions changed as a result of the phase transition induced by thermal treatment, which changed the immediate environment of the Er3+ ions from an oxyfluoride environment in Er-G to a pure fluoride environment in Er-GC, and serves as an indicator of incorporation of the Er3+ ions into the NCs [11,28].
The UC emission spectra of Er-G and Er-GC upon 980 nm laser diode excitation with a fixed laser power of 500 mW (8.33 W/cm2) in the wavelength region between 500 and 700 nm are shown in Figure 8a. The picture of the Er-GC excited with a 980 nm laser diode is shown as inset in Figure 8a and observed by naked eye as strong green. There are three UC emission bands in the visible region centered at 527, 546, and 656 nm, corresponding the 2H11/24I15/2, 4S3/24I15/2 and 4F9/24I15/2 transitions, respectively, which are labelled as G1, G2 and R, respectively, and are schematically represented in Figure 1. It is worth mentioning that the intensity of all UC emission bands is higher in Er-GC than in Er-G. This improvement is attributed to a decrease in the multi phonon relaxation rates of 2H11/2, 4S3/2, and 4F9/2 levels when environment of Er3+ ions was changed from an oxyfluoride environment in Er-G to a pure fluoride environment in Er-GC. Furthermore, each emission transition in Er-GC shows more than one component due to Stark splitting of Er3+:2H11/2, 4S3/2, and 4F9/2 levels [37].
The pump-power dependent UC emission spectra for Er-GC after 980 nm excitation, shown in Figure 8b, help to determine the number of pump photons responsible for various UC emission processes. It is worthy to mention that the emission spectra of Er-GC exhibited the same features for all laser powers ranging from 100 mW (1.67 W/cm2) to 500 mW (8.33 W/cm2), except for an increase in their intensities. This increase in intensity across all emission bands is due to an enrichment in the population of excited states at high power [38]. To investigate the heating effect caused by a 980 nm laser excitation source, we normalized the green up-conversion emission under different pump powers and examined the spectral profiles. The spectral profiles remain constant, as shown in Figure 8c. This is possible if the heating effect is negligible.
The following expression has been used to calculate the number of photons contributed during the UC process:
I = k (P)n,
where ‘k’ is the constant and ‘n’ is the number of photon involved in the UC process. According to the above expression, the linear fit of the data points in the plot relating logarithmic values of pump powers ln (P) to corresponding UC emission intensity ln (I) of emission bands (Figure 8d) yields the slope value, which is equivalent to the number of photons involved in the up-conversion process. The slope values for green UC transitions, G1 and G2, are 1.42 and 1.34, respectively, whereas the slope for red UC emission transition, R, is 1.42. The slope value less than 2 is commonly observed at high pump power density, when the depopulation of the excited levels by up-conversion processes is comparable to the radiative decay rate. In these conditions the observed can be fitted by considering powers lower than n [39]. On the other hand, as discussed in Section 1.1.1, the states 2H11/2, 4S3/2, and 4F9/2 are populated not only by excited state absorption (ESA), but also by energy transfer up-conversion (ETU). As a result, the slopes are less than 2. The obtained slope values indicate that two photons are involved in the green and red up-conversion emission.
The UC emission spectra were recorded by heating and cooling the samples in the temperature range 298 K and 823 K upon excitation 980 nm to investigate the temperature sensing ability of Er-G and Er-GC samples based on FIR of TCLs and NTCLs. The results are shown in Figure 9.
The FIR of transitions, G1/G2 (attributed from TCLs) increased with increasing temperature from 298 K to 673 K, then decreased in the Er-G sample (Figure 10a). On the other hand, the FIR of the same transitions in the Er-GC sample increased with increasing temperature (Figure 10c). In Er-G and Er-GC samples, FIR of transitions, R/G2 (attributed from NTCLs) increased (Figure 10b,d) with increasing temperature from 298 K to 823 K. Above 700 K, the FIR of transitions, G1/G2, and R/G2 rapidly changes in Er-G. This could be attributed to the fcat that the intensity ratio of G1/G2 lines no longer follows the Boltzmann distribution due to thermal saturation, and the kinetics of green and red emission may differ at high and low temperatures. Furthermore, when Er-G and Er-GC samples were cooled, the FIR of TCLs and NTCLs levels are the same as in heated samples (except at 823 K in Er-G).
The FIR of transitions attributed to TCLs (Figure 10a,b) and NTCLs (Figure 10b,d) against temperature (for Er-G sample taken into account up to 673 K) was fitted by exponential equation, Equation (1), and polynomial equation, Equation (4), respectively, shown in Figure 11 for Er-GC sample and in Figure S1 in Supplementary Material for the Er-G sample.
The absolute (Sa) and relative (Sr) sensitivity of Er-G and Er-GC samples versus temperature were calculated using Equations (2) and (3). The results for Er-G and Er-GC are shown in Figure 12, respectively. In the Er-G sample, the Sa reached a maximum of about 0.00102 K1 for TCLs at 423 K and 0.00145 K1 for NTCLs at 323 K. In Er-GC sample, Sa has reached a maximum of approximately 0.00281 K1 for TCLs K at 623 K and 0.02364 K1 for NTCLs at 823 K. In contrast to Sa, the Sr decreases with increasing temperature for TCLs and its maximum approximately equals (1.1% K1) in Er-G and Er-GC at 300 K. However, the maximum Sr obtained from NTCLs of Er3+ ion is less than that obtained from TCLs in both Er-G and Er-GC, which is contrary to what was expected (>1.1% K1).
The maximum value of the absolute thermal sensitivity (Sa), the relative thermal sensitivity (Sr), the temperature range (ΔT), energy spacing (∆E), and the excitation wavelength (λexc) for different glass and GC host matrices doped with Er3+ or co-doped with Er3+/Yb3+ are presented in Table 2. The maximum Sa value of Er-GC is in agreement with the results reported for Er3+/Yb3+: SiO2-BaF2-ZnF2 glass [40], and Er3+: PbO-Ga2O3-SiO2 glass [41]. However, it is lower than the results reported for Er3+/Yb3+: NaYb2F7—GC [42] and Er3+/Yb3+: NaLu2F7—GC [43] and higher than the results reported for Er3+/Yb3+: NaYF4—GC [44] and Er3+/Yb3+: fluoro phosphates glass [45].

3. Materials and Methods

3.1. Glass and Glass-Ceramic Preparation

A glass with the chemical composition 65.5SiO2-5Al2O3-3Y2O3-4Na2O-22NaF-0.5ErF3 (in mol%) was prepared by the conventional melting and subsequent quenching of the melt. 50 g batch of analytically pure (99.9% purity or higher) raw materials, SiO2, Al2O3, Y2O3, Na2O, NaF, and ErF3 were homogenized using rotating mill for 2 h. The mixed raw materials were calcined at 1200 °C for 2 h and, subsequently melted at 1680 °C for 2 h in a covered Pt-10% Rh crucible in a high-temperature elevator furnace in ambient atmosphere. The crucible was covered with a platinum lid to prevent fluorine volatilization. The melt was poured onto an iron plate and annealed at 450 °C for 2 h to release internal stress. The obtained glass slab was cut into several pieces of circular (diameter 0.3 cm) or rectangular shape. The bulk glass pieces were nucleated at 510 °C for 4 h and subsequently heat-treated at 650 °C for 40 h, using a heating rate of 10 °C/min to prepare the corresponding GCs. Finally, as prepared glass and GCs were polished with CeO2 paste for optical measurements. For better understanding the as prepared samples are labeled as follows:
Host: Undoped glass
Er-G: Er3+-doped glass
Er-GC: Er3+-doped glass-ceramic

3.2. Structural and Optical Characterization

The X-ray diffraction (XRD) patterns of glass and GCs were recorded using an X-ray diffractometer (Panalytical Empyrean DY1098), operated at 40 kV and 45 mA with Cu Kα radiation (λ = 0.15405 nm) in steps of 0.02° in the 2θ angular range from 10° to 80°. The data was evaluated using the software High Score Plus with the crystallographic open database (COD 2018).
The differential thermal analysis (DTA) measurement for glass and GCs were performed using the Netzsch STA 449 F1 Jupiter simultaneous thermal analyzer in the temperature range between 35 and 1200 °C, at a heating rate of 25 °C min−1, in ambient atmosphere.
The UV–Vis–NIR transmittance spectra of the synthesized glass and GCs were recorded using a Cary 5000 spectrometer (Agilent Technologies, USA) in the spectral range 200–1800 nm with the step of 0.5 nm.
The photoluminescence spectra in visible (VIS) region at room temperature were recorded on the Fluorolog FL3-21 fluorescence spectrophotometer (Jobin-Yvon Horiba, France), in front face mode (backscattering geometry), with an Xe lamp (450 W) used as the excitation light source. The signals were collected using a photomultiplier tube R928 detector.
The excitation pump power and temperature-dependent UC emission spectra were recorded using the same instrument, using a diode laser operating at 978 nm as the excitation source. To avoid the heating effect caused by the laser, the UC spectra were recorded in a short time interval. For high-temperature UC luminescence spectra measurement, a circular shape sample 0.3 cm diameter was set in a Linkam heating stage (TS1500, Linkam Scientific, UK; temperature range RT to 1500 °C, temperature precision < 1 °C) coupled with an integration sphere to collect the emitted light and connected to the fluorescence spectrometer via a glass fiber.

4. Conclusions

In this work, hexagonal sodium yttrium fluoride crystalline phase in oxyfluoride silicate glass doped with Er3+ ion has been synthesized by melt quenching and subsequent heat treatment. According to Rietveld refinement of XRD spectra the main crystalline phase in Er-GC was β-Na1.5Y1.45Er0.05F6. The temperature-dependent visible UC emission was studied over a wide temperature range of 298–823 K, with the maximum absolute thermal sensitivity (Sa) of Er-G being 1.01 × 10³ K1 at 423 K for TCLs and 1.45 × 10³ K1 at 323 K for NTCLs. The Sa has reached a maximum of 2.81 × 10³ K1 at 623 K for TCLs and 23.64 × 10³ K1 at 823 K for NTCLs in the Er-GC sample. The relative thermal sensitivity (Sr) obtained from the TCLs of Er3+ ion is 1.1% K1 (at 298 K) in Er-G and Er-GC. However, the maximum Sr obtained from NTCLs in Er-G and Er-GC is lower than that obtained from TCLs. Based on these results we conclude that Er-GC is a promising candidate for up-conversion luminescence temperature sensors.

Supplementary Materials

The following are available online, Figure S1: (a) Exponential fit of FIR of G1/G2, and (b) polynomial fit of FIR of R/G2 transitions against temperature for Er-G sample.

Author Contributions

Conceptualization, R.D., R.K. and J.J.V.; methodology, R.D., R.K. and J.J.V.; software, R.R.; validation, R.D. and R.K.; formal analysis, R.D. and R.K.; investigation, R.D., R.K. and J.J.V.; resources, R.K., R.R. and D.G.; data curation, R.D., R.K. and R.R.; writing—original draft preparation, R.D.; writing—review and editing, R.D., R.K., J.J.V. and D.G.; visualization, R.D., R.K. and J.J.V.; supervision, R.D. and R.K.; and funding acquisition, R.K. and D.G. All authors have read and agreed to the published version of the manuscript.

Funding

This work is a part of the activities of the FunGlass project. This project has received funding from the European Union Horizon 2020 research and innovation program under grant agreement No 739566. This work was also supported by the Slovak Research and Development Agency under the contract No. APVV-17-0049 and by grant VEGA 1/0527/18.

Institutional Review Board Statement

Not applicable.

Informed Consent Statement

Not applicable.

Data Availability Statement

Not applicable.

Conflicts of Interest

The authors declare no conflict of interest.

Sample Availability

Samples are available from the authors on responsible request.

References

  1. Carlos, L.D.; Palacio, F. (Eds.) Thermometry at the Nanoscale: Techniques and Selected Applications; Royal Society of Chemistry: Oxfordshire, UK, 2016. [Google Scholar]
  2. Zohar, O.; Ikeda, M.; Shinagawa, H.; Inoue, H.; Nakamura, H.; Elbaum, D.; Daniel, L.; Yoshioka, T. Thermal imaging of receptor-activated heat production in single cells. Biophys. J. 1998, 74, 82–89. [Google Scholar] [CrossRef] [Green Version]
  3. Gota, C.; Okabe, K.; Funatsu, T.; Harada, Y.; Uchiyama, S. Hydrophilic fluorescent nanogel thermometer for intracellular thermometry. J. Am. Chem. Soc. 2009, 131, 2766–2767. [Google Scholar] [CrossRef] [PubMed]
  4. Benayas, A.; del Rosal, B.; Pérez-Delgado, A.; Santacruz-Gómez, K.; Jaque, D.; Alonso Hirata, G.; Vetrone, F. Nd:YAG nearinfrared luminescent nanothermometers. Adv. Opt. Mater. 2015, 3, 687–694. [Google Scholar] [CrossRef]
  5. Antić, Ž.; Dramićanin, M.D.; Prashanthi, K.; Jovanović, D.; Kuzman, S.; Thundat, T. Pulsed laser deposited dysprosium-doped gadolinium-vanadate thin films for noncontact, self-referencing luminescence thermometry. Adv. Mater. 2016, 28, 7745–7752. [Google Scholar] [CrossRef]
  6. Puddu, M.; Mikutis, G.; Stark, W.J.; Grass, R.N. Submicrometer-sized thermometer particles exploiting selective nucleic acid stability. Small 2016, 12, 452–456. [Google Scholar] [CrossRef]
  7. Okabe, K.; Inada, N.; Gota, C.; Harada, Y.; Funatsu, T.; Uchiyama, S. Intracellular temperature mapping with a fluorescent polymeric thermometer and fluorescence lifetime imaging microscopy. Nat. Commun. 2012, 3, 705. [Google Scholar] [CrossRef] [Green Version]
  8. Zhu, X.; Feng, W.; Chang, J.; Tan, Y.W.; Li, J.; Chen, M.; Sun, Y.; Li, F. Temperature-feedback up-conversion nanocomposite for accurate photothermal therapy at facile temperature. Nat. Commun. 2016, 7, 10437. [Google Scholar] [CrossRef]
  9. Rocha, U.; Da Silva, C.J.; Silva, W.F.; De Guedes, I.; Benayas, A.; Maestro, L.M.; Elias, M.A.; Bovero, E.; Van Veggel, C.J.M.; García, S.; et al. Subtissue Thermal sensing based on neodymium-doped LaF3 Nanoparticles. ACS Nano 2012, 7, 1188–1199. [Google Scholar] [CrossRef]
  10. Jaque, D.; Vetrone, F. Luminescence nanothermometry. Nanoscale 2012, 4, 4301–4326. [Google Scholar] [CrossRef]
  11. León-Luis, S.F.; Rodríguez-Mendoza, U.R.; Haro-González, P.; Martín, I.R.; Lavín, V. Role of the host matrix on the thermal sensitivity of the Er3+ luminescence in optical temperature sensors. Sens. Actuators B. 2012, 174, 176–186. [Google Scholar] [CrossRef]
  12. Kusama, H.; Sovers, O.J.; Oshioka, T.Y. Line shift method for phosphor temperature measurements. Japan J. Appl. Phys. 1976, 15, 2349–2358. [Google Scholar] [CrossRef]
  13. Shinn, M.D.; Sibley, W.A.; Drexhage, M.G.; Brown, R.N. Optical transitions of Er3+ ions in fluorozirconate glass. Phys. Rev. B 1983, 27, 6635–6648. [Google Scholar] [CrossRef]
  14. Shalav, A.; Richards, B.S.; Green, M.A. Luminescent layers for enhanced silicon solar cell performance: Up-conversion. Sol. Energy Mater. Sol. Cells 2007, 91, 829–842. [Google Scholar] [CrossRef]
  15. Vetrone, F.; Naccache, R.; Zamarro´n, A.; de la Fuente, A.J.; Sanz-Rodrıguez, F.; Maestro, L.M.; Rodriguez, E.M.; Jaque, D.; Garcia Sole, J.; Capobianco, J.A. Temperature sensing using fluorescent nanothermometers. ACS Nano 2010, 4, 3254–3258. [Google Scholar] [CrossRef]
  16. Balabhadra, S.; Debasu, M.L.; Brites, C.D.; Nunes, L.A.; Malta, O.L.; Rocha, J.; Bettinelli, M.; Carlos, L.D. Boosting the Sensitivity of Nd3+ based luminescent nanothermometers. Nanoscale 2015, 7, 17261–17267. [Google Scholar] [CrossRef]
  17. Mc Laurin, E.J.; Bradshaw, L.R.; Gamelin, D.R. Dual-emitting nanoscale temperature sensors. Chem. Mater. 2013, 25, 1283–1292. [Google Scholar] [CrossRef]
  18. Gao, Y.; Huang, F.; Lin, H.; Zhou, J.; Xu, J.; Wang, Y. A novel optical thermometry strategy based on diverse thermal response from two intervalence charge transfer States. Adv. Funct. Mater. 2016, 26, 3139–3145. [Google Scholar] [CrossRef]
  19. Carrasco, E.; del Rosal, B.; Sanz-Rodríguez, F.; de la Fuente, Á.J.; Gonzalez, P.H.; Rocha, U.; Kumar, K.U.; Jacinto, C.; Solé, J.G.; Jaque, D. Intratumoral thermal reading during photo-thermal therapy by multifunctional fluorescent nanoparticles. Adv. Funct. Mater. 2015, 25, 615–626. [Google Scholar] [CrossRef]
  20. Xu, X.; Wang, Z.; Lei, P.; Yu, Y.; Yao, S.; Song, S.; Liu, X.; Su, Y.; Dong, L.; Feng, J.; et al. α-NaYb(Mn)F4:Er3+/Tm3+@NaYF4 UCNPs as “Band-Shape” luminescent nano-thermometers over a wide temperature range. ACS Appl. Mater. Inter. 2015, 7, 20813–20819. [Google Scholar] [CrossRef]
  21. Cheng, Y.; Gao, Y.; Lin, H.; Huang, F.; Wang, Y. Strategy design for ratiometric luminescence thermometry: Circumventing the limitation of thermally coupled levels. J. Mater. Chem. C 2018, 6, 7462–7478. [Google Scholar] [CrossRef]
  22. Lu, H.; Hao, H.; Shi, G.; Gao, Y.; Wang, R.; Song, Y.; Wang, Y.; Zhang, X. Optical temperature sensing in b-NaLuF4:Yb3+/Er3+/Tm3+ based on thermal, quasi-thermal and non-thermal coupling levels. RSC Adv. 2016, 6, 55307–55311. [Google Scholar] [CrossRef]
  23. Min, Q.; Bian, W.; Qi, Y.; Lu, W.; Yu, X.; Xu, X.; Zhou, D.; Qiu, J. Temperature sensing based on the up-conversion emission of Tm3+ in a single KLuF4 microcrystal. J. Alloys Compd. 2017, 728, 1037–1042. [Google Scholar] [CrossRef]
  24. Liu, S.; Ming, H.; Cui, J.; Liu, S.; You, W.; Xinyu, Y.; Yang, Y.; Nie, H.; Wang, R. Color-tunable up-conversion luminescence and multiple temperature sensing and optical heating properties of Ba3Y4O9:Er3+/Yb3+ phosphors. J. Phys. Chem. C 2018, 122, 16289–16303. [Google Scholar] [CrossRef]
  25. Rai, V.K.; Rai, D.; Rai, S. Pr3+ doped lithium tellurite glass as a temperature sensor. Sens. Actuators A. 2006, 128, 14–17. [Google Scholar] [CrossRef]
  26. Rai, V.K.; Rai, A. Temperature sensing behaviour of Eu3+ doped tellurite and calibo glasses. Appl. Phys. B. 2007, 86, 333–335. [Google Scholar] [CrossRef]
  27. Du, P.; Luo, L.; Su Yu, J. Low-temperature thermometry based on up-conversion emission of Ho/Yb co-doped Ba0.77Ca0.23TiO3 ceramics. J. Alloys Compd. 2015, 632, 73–77. [Google Scholar] [CrossRef]
  28. Sarakovskis, A.; Krieke, G. Up-conversion luminescence in erbium doped transparent oxyfluoride glass ceramics containing hexagonal NaYF4 nanocrystals. J. Eur. Ceram. Soc. 2015, 35, 3665–3671. [Google Scholar] [CrossRef]
  29. Herrmann, A.; Tylkowski, M.; Bocker, C.; Rüssel, C. Cubic and hexagonal NaGdF4 crystals precipitated from an aluminosilicate glass: Preparation and luminescence properties. Chem. Mater. 2013, 25, 2878–2884. [Google Scholar] [CrossRef]
  30. Mai, H.X.; Zhang, Y.W.; Si, R.; Yan, Z.G.; Sun, L.D.; You, L.P.; Yan, C.H. High-quality sodium rare-earth fluoride nanocrystals:  controlled synthesis and optical properties. J. Am. Chem. Soc. 2006, 128, 6426–6436. [Google Scholar] [CrossRef]
  31. Wang, F.; Han, Y.; Lim, C.S.; Lu, Y.H.; Wang, J.; Xu, J.; Chen, H.Y.; Zhang, C.; Hong, M.H.; Liu, X.G. Simultaneous phase and size control of up-conversion nanocrystals through lanthanide doping. Nature 2010, 463, 1061–1065. [Google Scholar] [CrossRef] [PubMed]
  32. Li, X.; Yang, L.; Zhu, Y.; Zhong, J.; Chen, D. Up-conversion of transparent glass ceramics containing β-NaYF4:Yb3+, Er3+ nanocrystals for optical thermometry. RSC Adv. 2019, 9, 7948–7954. [Google Scholar] [CrossRef] [Green Version]
  33. Kochanowicz, M.; Dorosz, D.; Zmojda, J.; Dorosz, J.; Miluski, P. Influence of temperature on up-conversion luminescence in tellurite glass co-doped with Yb3+/Er3+ and Yb3+/Tm3+. J. Lumin. 2014, 151, 155–160. [Google Scholar] [CrossRef]
  34. Zhao, Z.; Li, K.; Liu, C.; Yin, Q.; Han, J.; Heo, J. Intense up-conversion emission from Er3+/Yb3+ ion co-doped transparent oxyfluoride glass ceramics containing Y5O4F7 nanorods for optical thermometry. J. Mater. Chem. C. 2019, 7, 6134–6143. [Google Scholar] [CrossRef]
  35. Krämer, K.W.; Biner, D.; Frei, G.; Güdel, H.U.; Hehlen, M.P.; Lüthi, S.R. Hexagonal Sodium Yttrium Fluoride Based Green and Blue Emitting Up-conversion Phosphors. Chem. Mater. 2004, 16, 1244–1251. [Google Scholar] [CrossRef]
  36. Grzechnik, A.; Bouvier, P.; Mezouar, M.; Mathews, M.D.; Tyagi, A.K.; Köhler, J. Hexagonal Na1.5Y1.5F6 at High Pressures. J. Solid State Chem. 2002, 165, 159–164. [Google Scholar] [CrossRef]
  37. Klier, D.T.; Kumke, M.U. Up-conversion Luminescence Properties of NaYF4:Yb:Er Nanoparticles Co-doped with Gd3+. J. Phys. Chem. C 2015, 119, 3363–3373. [Google Scholar] [CrossRef]
  38. Pandey, A.; Rai, V.K. Pr3+–Yb3+ co-doped Y2O3 phosphor for display devices. Mater. Res. Bull. 2014, 57, 156–161. [Google Scholar] [CrossRef]
  39. Pollnau, M.; Gamelin, D.R.; Lüthi, S.R.; Güdel, H.U. Power dependence of upconversion luminescence in lanthanide and transition-metal-ion systems. Phys. Rev. B Condens. Matter Mater. Phys. 2000, 61, 3337–3346. [Google Scholar] [CrossRef]
  40. Feng, L.; Lai, B.; Wang, J.; Du, G.; Su, Q. Spectroscopic properties of Er3+ in a oxyfluoride glass and upconversion and temperature sensor behaviour of Er3+/Yb3+-codoped oxyfluoride glass. J. Lumin. 2010, 130, 2418–2423. [Google Scholar] [CrossRef]
  41. Pisarski, W.A.; Pisarska, J.; Lisiecki, R.; Romanowski, W.R. Sensitive optical temperature sensor based on up-conversion luminescence spectra of Er3+ ions in PbO-Ga2O3-XO2 (X = Ge, Si) glasses. Opt Mater. 2016, 59, 87–90. [Google Scholar] [CrossRef]
  42. Hua, F.; Caob, J.; Weia, X.; Lia, X.; Caia, J.; Guob, H.; Chena, Y.; Duan, C.; Yin, M. Luminescent properties of Er3+-doped transparent NaYb2F7 glass ceramics for optical thermometry and spectral conversion. J. Mater. Chem. C 2016, 4, 9976–9985. [Google Scholar] [CrossRef]
  43. Cao, J.; Chen, W.; Xu, D.; Hu, F.; Chen, L.; Guo, H. Wide-range thermometry based on green up-conversion of Yb3+/Er3+ co-doped KLu2F7 transparent bulk oxyfluoride glass ceramics. J. Lumin. 2018, 194, 219–224. [Google Scholar] [CrossRef]
  44. Jiang, S.; Zeng, P.; Liao, L.; Tian, S.; Guo, H.; Chen, Y.; Duan, C.; Yin, M. Optical thermometry based on upconverted luminescence in transparent glass ceramics containing NaYF4:Yb3+/Er3+ nanocrystals. J. Alloys Comp. 2014, 617, 538–541. [Google Scholar] [CrossRef]
  45. Lai, B.; Feng, L.; Wang, J.; Su, Q. Optical transition and up-conversion luminescence in Er3+ doped and Er3+-Yb3+ co-doped fluorophosphates glasses. Opt Mater. 2010, 32, 1154–1160. [Google Scholar] [CrossRef]
Figure 1. Possible energy transfer (ET) UC procedure in Er3+ ion under 980 nm laser excitation.
Molecules 26 06901 g001
Figure 2. DTA curves of host and Er-doped oxyfluoride silicate glass (Er-G).
Molecules 26 06901 g002
Figure 3. X-ray diffraction patterns of Er-doped oxyfluoride silicate glass (Er-G) and glass-ceramic (Er-GC) heat-treated at 650 °C for 40 h.
Molecules 26 06901 g003
Figure 4. Rietveld-refined XRD spectrum of Er-GC (heat-treated at 650 °C for 40 h).
Molecules 26 06901 g004
Figure 5. UV–vis–NIR transmittance spectra of the host, Er-G and Er-GC.
Molecules 26 06901 g005
Figure 6. Photoluminescence excitation spectra (PLE) of Er-G and Er-GC measured under emission wavelength 1535 nm.
Molecules 26 06901 g006
Figure 7. Photoluminescence spectra (PL) in (a) visible, (b,c) NIR region measured under excitation wavelength 375 nm and (d) NIR region measured under excitation wavelength 980 nm for Er-G and Er-GC.
Molecules 26 06901 g007
Figure 8. Up-conversion (UC) PL spectra (a) at 500 mW pump power for Er-G and Er-GC, and inset is picture of Er-GC exited with laser at 980 nm (b) at different pump power for Er-GC, (c) normalized at different pump power for Er-GC, (d) ln (UC intensity) v.s. ln (pump power) for Er-GC measured under 980 nm excitation wavelength.
Molecules 26 06901 g008
Figure 9. UC PL spectra measured at different temperatures when heating the samples, (a) Er-G and (b) Er-GC.
Molecules 26 06901 g009
Figure 10. Intensity ratio of transitions (a,c) G1/G2 and (b,d) R/G2 in Er-G and Er-GC samples.
Molecules 26 06901 g010
Figure 11. (a) Exponential fit of FIR of G1/G2, and (b) polynomial fit of FIR of R/G2 transitions against temperature for Er-GC sample.
Molecules 26 06901 g011
Figure 12. Absolute and relative temperature sensitivity versus temperature: (a,c) are TCLs of Er3+ in Er-G and Er-GC and (b,d) are NTCLs of Er3+ in Er-G and Er-GC, respectively.
Molecules 26 06901 g012
Table 1. Crystal parameters of the hexagonal sodium ytrium fluoride crystals in Er-GC obtained by Rietveld analysis.
ParameterEr-GC
PhaseNa1.5Y1.45Er0.05F6
Space groupP-6 (174)
a (Å)5.9831
b (Å)5.9831
c (Å)3.5350
α (degrees)90
β (degrees)90
γ (degrees)120
V (Å3)109.6094
Re (%)3.42695
Rp (%)2.52878
Rwp (%)3.23458
Table 2. Values of the maximum absolute sensitivity, Sa, and relative sensitivity, Sr, at starting temperature, energy spacing (∆E), experimental temperature ranges of different Er3+ and Er3+/Yb3+ co-doped materials using the fluorescence intensity ratio (FIR) method based on the green emissions of the Er3+ ion.
Sensing Materialsλexc (nm)TCLsNTCLsExperimental Temperature Range (K)Ref
∆E (cm−1)Maximum of Sa (×10−3 K−1)Maximum of Sr (% K−1)Maximum of Sa (× 10−3 K−1)Maximum of Sr (% K−1)
Er3+:Na1.5Y1.5F6-GC9803882.81 @ 6231.123.64 @ 8230.6298–823Present work
Er3+/Yb3+: SiO2-BaF2-ZnF2 glass9807192.70 @ 5131.2------291–450Feng et al. [40]
Er3+: PbO-Ga2O3-SiO2 glass980---2.64 @ 590---------300–630Pisarski et al. [41]
Er3+/Yb3+: NaYb2F7-GC9808523.06 @ 600K1.3------300–773Hua et al.
[42]
Er3+/Yb3+: NaLu2F7-GC9808614.73 @ 620 K1.3------300–773Cao et al.
[43]
Er3+/Yb3+: NaYF4-GC9807742.30 @ 5731.2------298–693Jiang et al. [44]
Er3+/Yb3+:fluoro phosphate glass9803901.5 @ 279---------130–490Lai et al.
[45]
Publisher’s Note: MDPI stays neutral with regard to jurisdictional claims in published maps and institutional affiliations.

