Article

Effect of the Duty Cycle of Flower-like Silver Nanostructures Fabricated with a Lyotropic Liquid Crystal on the SERS Spectrum

1
Jiangsu Key Laboratory of Micro and Nano Heat Fluid Flow Technology and Energy Application, School of Physical Science and Technology, Suzhou University of Science and Technology, Suzhou 215009, China
2
Shanghai Institute of Satellite Engineering, China Aerospace Science and Technology Corporation, Shanghai 201109, China
3
Institute of Fundamental and Interdisciplinary Sciences, Institute of Mathematics and Physics, Beijing Union University, Beijing 100101, China
4
School of Chemistry and Life Sciences, Suzhou University of Science and Technology, Suzhou 215009, China
5
Basic Department, Jiyuan Vocational and Technical College, Jiyuan 454682, China
*
Author to whom correspondence should be addressed.
Molecules 2021, 26(21), 6522; https://doi.org/10.3390/molecules26216522
Submission received: 17 September 2021 / Revised: 16 October 2021 / Accepted: 24 October 2021 / Published: 28 October 2021

Abstract

:
Surface-enhanced Raman scattering (SERS) has been widely reported to improve the sensitivity of Raman spectra. Ordinarily, the laser is focused on the sample to measure the Raman spectrum. The size of the focused light spot is comparable with that of micro-nano structures, and the number of micro-nano structures contained in the light spot area (defined as duty cycle) will severely affect the spectrum intensity. In this study, flower-like silver nanostructures were fabricated with a soft lyotropic liquid crystal template in order to investigate the effect of duty cycle. They were observed under a scanning electron microscope, and their spectrum enhancement factor was computed with the obtained Raman spectrum. Then, their duty cycles were measured using a SERS substrate at different locations. A formula was derived to represent the relation between the duty cycle of the nanoflowers and the Raman spectral intensity. This work could promote the actual applications of SERS in high-sensitivity spectrum testing.

1. Introduction

Raman spectra have been widely used in many fields, such as analytical sciences [1,2,3,4], surface sciences [5,6,7], and biological sciences [8,9,10,11,12]. Surface-enhanced Raman scattering (SERS) has been widely explored because it can be used to improve the sensitivity of Raman spectra [13,14,15]. Different nanostructures, such as nanowires [16,17,18], nanorods [19,20,21], nanospheres [22,23], and nanoflowers [24,25,26], are fabricated to obtain a high enhancement effect of the Raman spectra. Some SERS materials are prepared with chemical methods, such as the seed-mediated-growth method [19,27,28], the wet-chemical method [29], and the hydrothermal method [30]. Although these SERS materials can be obtained easily and have low costs, their spectral enhancement effects are unstable, and repeatability is low because they are randomly distributed and even piled up [31]. SERS materials may also be fabricated through lithography, etching, and other techniques, and their nanostructures have a periodic arrangement [32,33,34]. These materials have a stable signal enhancement and a high spectrum repeatability compared with those of the randomly distributed SERS materials, but they are costly and have a complicated fabrication process.
The key problem is the fabrication of SERS materials with high stability, high repeatability, low costs, and simple processes. To solve this problem, in 2017, our group proposed a growth method assisted by a soft lyotropic liquid crystal (LC) template and successfully prepared well-distributed flower-like silver nanostructures with high sensitivity [35,36]. In 2019, Li et al. fabricated low-cost and recyclable 3D shell-core nanostructures through a chemical reduction reaction [37]. These low-cost and simple preparation methods further promote the applications of SERS materials. In this study, a silver SERS substrate is prepared through a growth method assisted by a soft lyotropic LC template.
A laser collimator lens group is typically used to emit exciting light and collect Raman scattering light in a Raman spectrometer (Figure 1a). The laser beam is focused on the surface of the SERS substrate by using the lens. As such, a valid exciting area is about tens of square microns, which is comparable with the size of a nanostructure. Regardless of the distribution of SERS substrates, some places have no nanostructure materials, as shown in Figure 1b. While the light is focused on different areas of the SERS substrate such as A, B, C and D, the different numbers of nanoparticles are contained within the illuminated area and the definition of the duty cycle of nanostructures is used to describe this situation. The enhanced effect is related to the nanostructures [38,39,40], so different enhancement effects are obtained while the exciting light is irradiated at different places. Hence, we should consider the effect of the duty cycle of nanostructures on the spectral enhancement effect.
In this study, the surface enhancement effect of a SERS substrate with different duty cycles of a nanostructure material was investigated. A flower-like silver nanostructure substrate was first fabricated and observed under a scanning electron microscope (SEM). Then, the enhancement factor (EF) was measured through Raman spectroscopy. The duty cycle of the nanomaterials was measured, and the relation between duty cycle and spectral intensity was described by obtaining its corresponding formula.

2. Materials and Methods

2.1. Materials

The following materials were used in this study: anionic surfactant sodium bis (2-ethylhexyl) sulfosuccinate (AOT; 98 wt%), oil-phase p-xylene (99 wt%), and AgNO3 (99 wt%; Sigma-Aldrich, St. Louis, MO, USA); silver foil (2.0 mm, 99%; Alfa Aesar, Alpha New Jersey, NJ, USA); rhodamine 6G (R6G; Aladdin Company, Shanghai, China); and indium tin oxide (ITO) glass (Gulo Glass Company, Luoyang, China). Deionized water and analytical-reagent ethanol were used in the experiment to clean the SERS substrate.

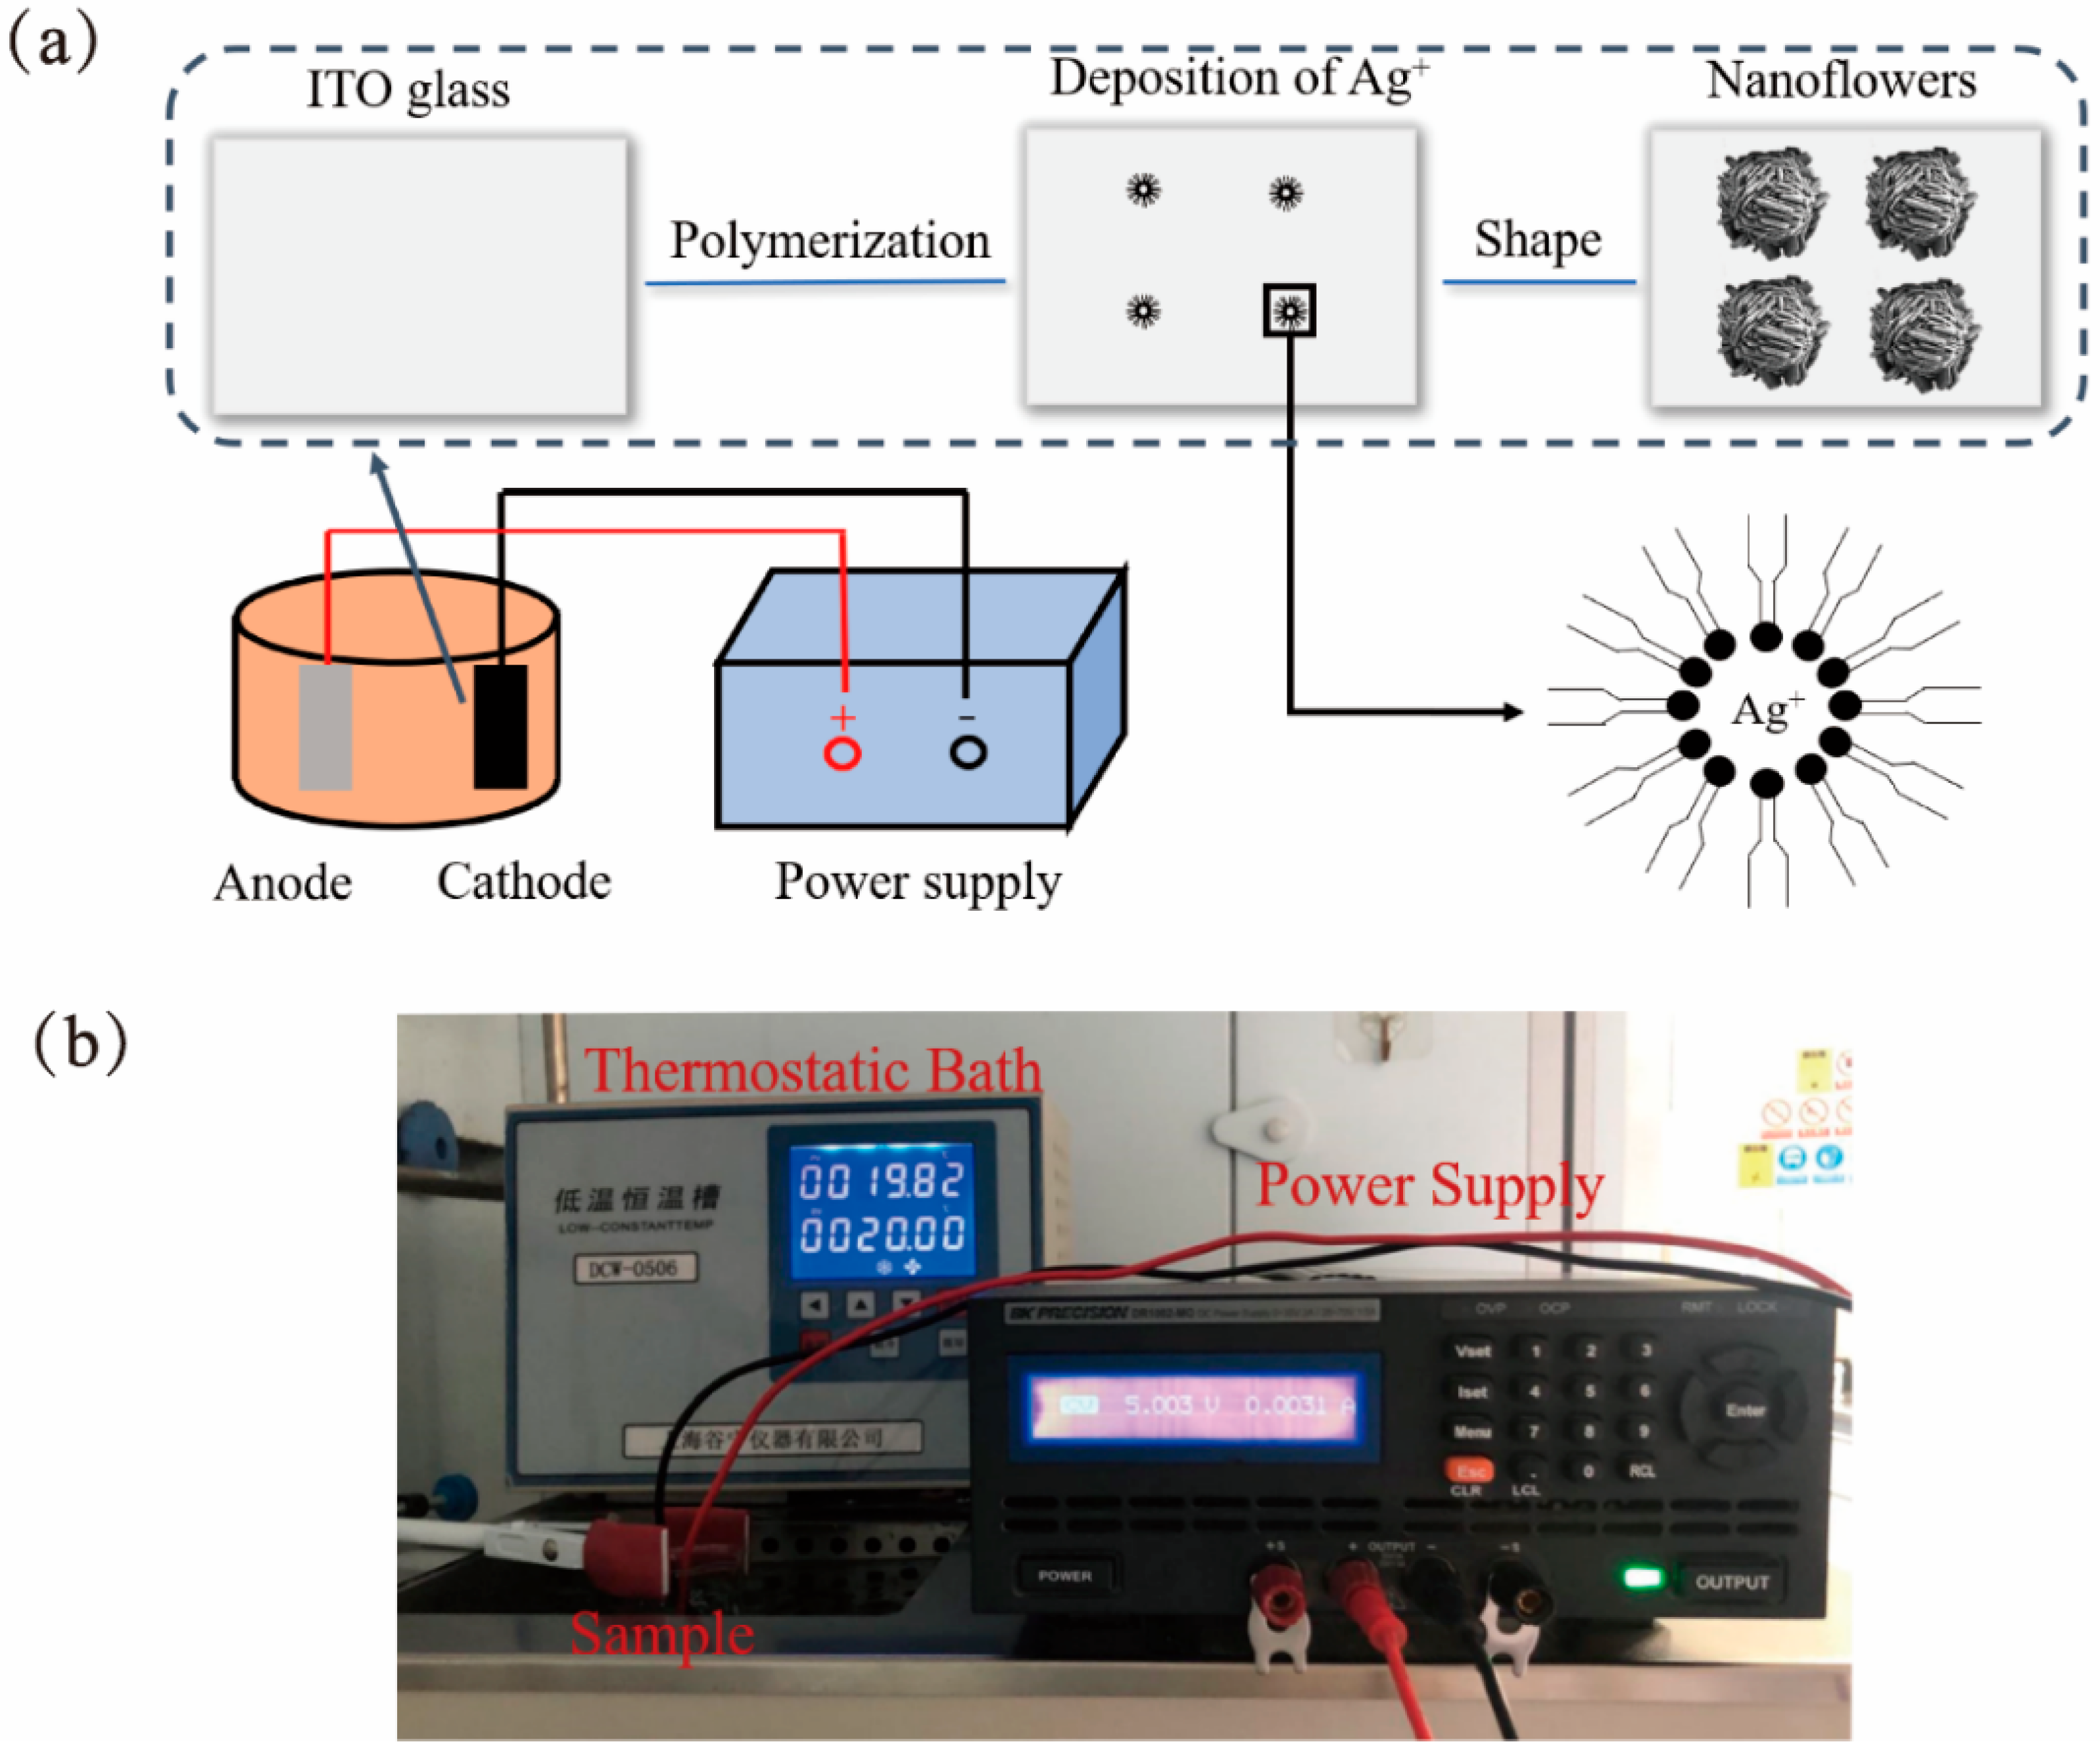
2.2. Fabrication of Flower-like Silver Nanostructures

Lyotropic LC containing the surfactant (AOT), oil-phase xylene, and water were used as a soft template to fabricate flower-like silver nanostructures. Its water content was replaced with a silver nitrate aqueous solution. Electrodeposition was performed in order to grow silver flower-like nanomaterials, and Ag+ was surrounded by lyotropic LC (Figure 2). The soft LC template constrained the flower-like silver nanostructures so that they could grow locally and orderly.
First, lyotropic LC was compounded with an aqueous solution of AOT, p-xylene, and AgNO3. AOT was dissolved in p-xylene with a 1.4 M concentration by stirring it continuously. Then, a 0.4 M AgNO3 aqueous solution was added dropwise to the mixture of AOT and p-xylene and stirred for 2 h until the mixture became a clear reddish-brown liquid. In accordance with our previous work, the cubic-phase state of the lyotropic LC was obtained in order to prepare a silver SERS substrate [35] by allowing the mixture to stand for 2 h. A silver plate and an ITO glass were used as the anode and the cathode, respectively, in the electrodeposition. The gap between the silver plate and the ITO glass was controlled at 0.7 mm by the pasting of a plastic sheet. A low-temperature thermostat bath was utilized in order to control the working temperature, and the DC voltage was supplied by a DC-stabilized power supply. Figure 2a shows the growth of flower-like silver nanostructures. Initially, Ag+ bound in lyotropic LC was gradually nucleated during the electrodeposition. After 3 h of electrolysis, the Ag+ eventually broke through the template and grew into silver nanoflowers on the cathode. Figure 2b presents the experimental equipment for the electrodeposition. The ambient temperature was controlled at 20 °C, and 5 V of DC voltage was applied between the anode and the cathode. The ITO glass with flower-like silver nanostructures was separated from the silver plate, cleaned with absolute ethanol for 15 min, and dried with a gentle flow of N2.

2.3. Characterization

The microscopic morphology of the nanostructures was characterized through thermal field emission SEM (Zeiss, Baden-Wurttemberg, Germany). The extra high tension was set to 2 kV, and the working distance was set to 4.1 mm in order to observe the nanostructures with SEM. Raman spectra were obtained using a Raman spectrometer (Horiba LabRAM, Paris, France). The working wavelength of the Raman spectrometer was 532 nm, the selected integration time was 10 s and the laser power was 0.5 mW.

2.4. SERS Enhancement Factor Calculation

The enhancement effect of the SERS material may be evaluated in terms of EF, which can be calculated as follows [41,42,43]:
E F = I S E R S I b u l k × N b u l k N S E R S
where ISERS is the intensity of the vibrational band of probe molecules on the SERS substrate, Ibulk is the intensity of the same vibrational band of probe molecules on the silicon wafer, and Nbulk is the average number of probe molecules absorbed on a silicon wafer. For the probe molecule solution, Nbulk may be determined as
N b u l k = A l a s e r V c N A S
where Alaser is the area of the focused laser spot, V is the volume of the probe solution dripped on the silicon wafer, c is the concentration of the solution, NA is Avogadro’s constant, S is the area where the probe solution drops on the substrate, and NSERS is the average number of probe molecules absorbed on the SERS substrate. NSERS can be calculated as
N S E R S = A l a s e r N d A N δ
where Nd is the number density of flower-like nanostructures on the substrate, AN is the surface area of one nanoflower, and δ is the area occupied by a single probe molecule adsorbed on the substrate. When Equations (2) and (3) are substituted into Equation (1), EF may be rewritten as
E F = I S E R S I b u l k × V c δ N A N d A N S
In this work, R6G was used as a Raman probe to detect Raman spectroscopy. An R6G solution was dropped onto the silicon wafer (10 mM) and SERS substrate (1 μM). After the R6G solution was completely dry, the silicon wafer and SERS substrates were used as samples for Raman spectroscopy.

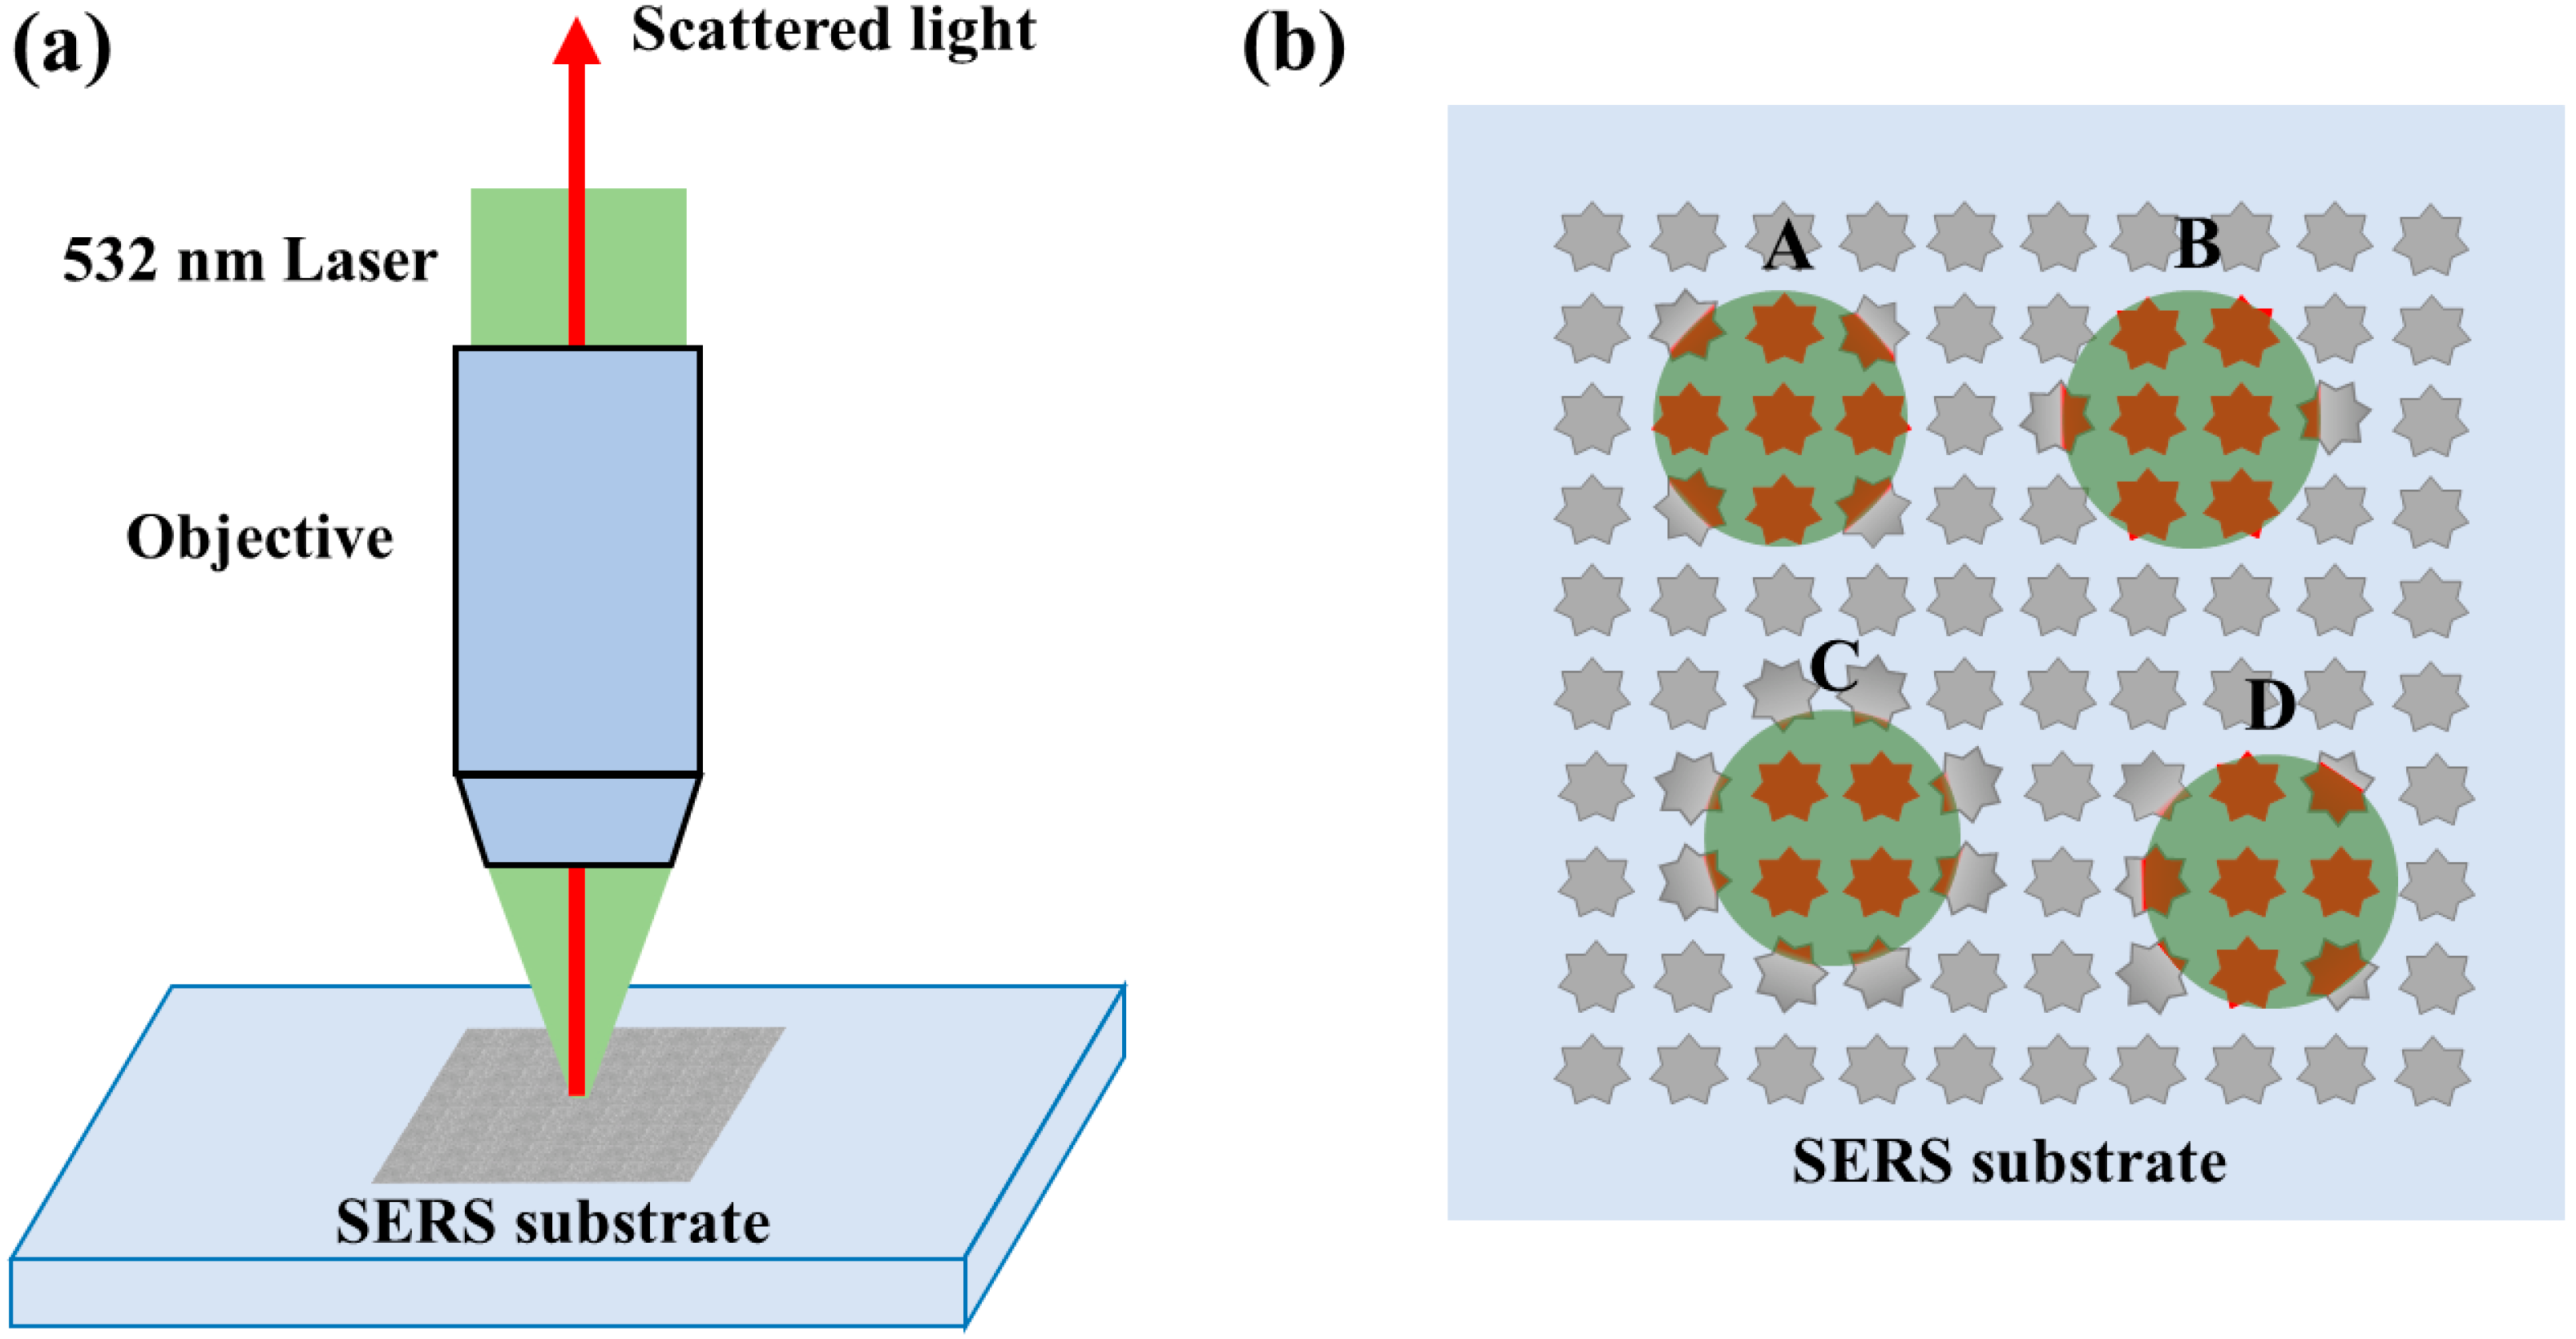
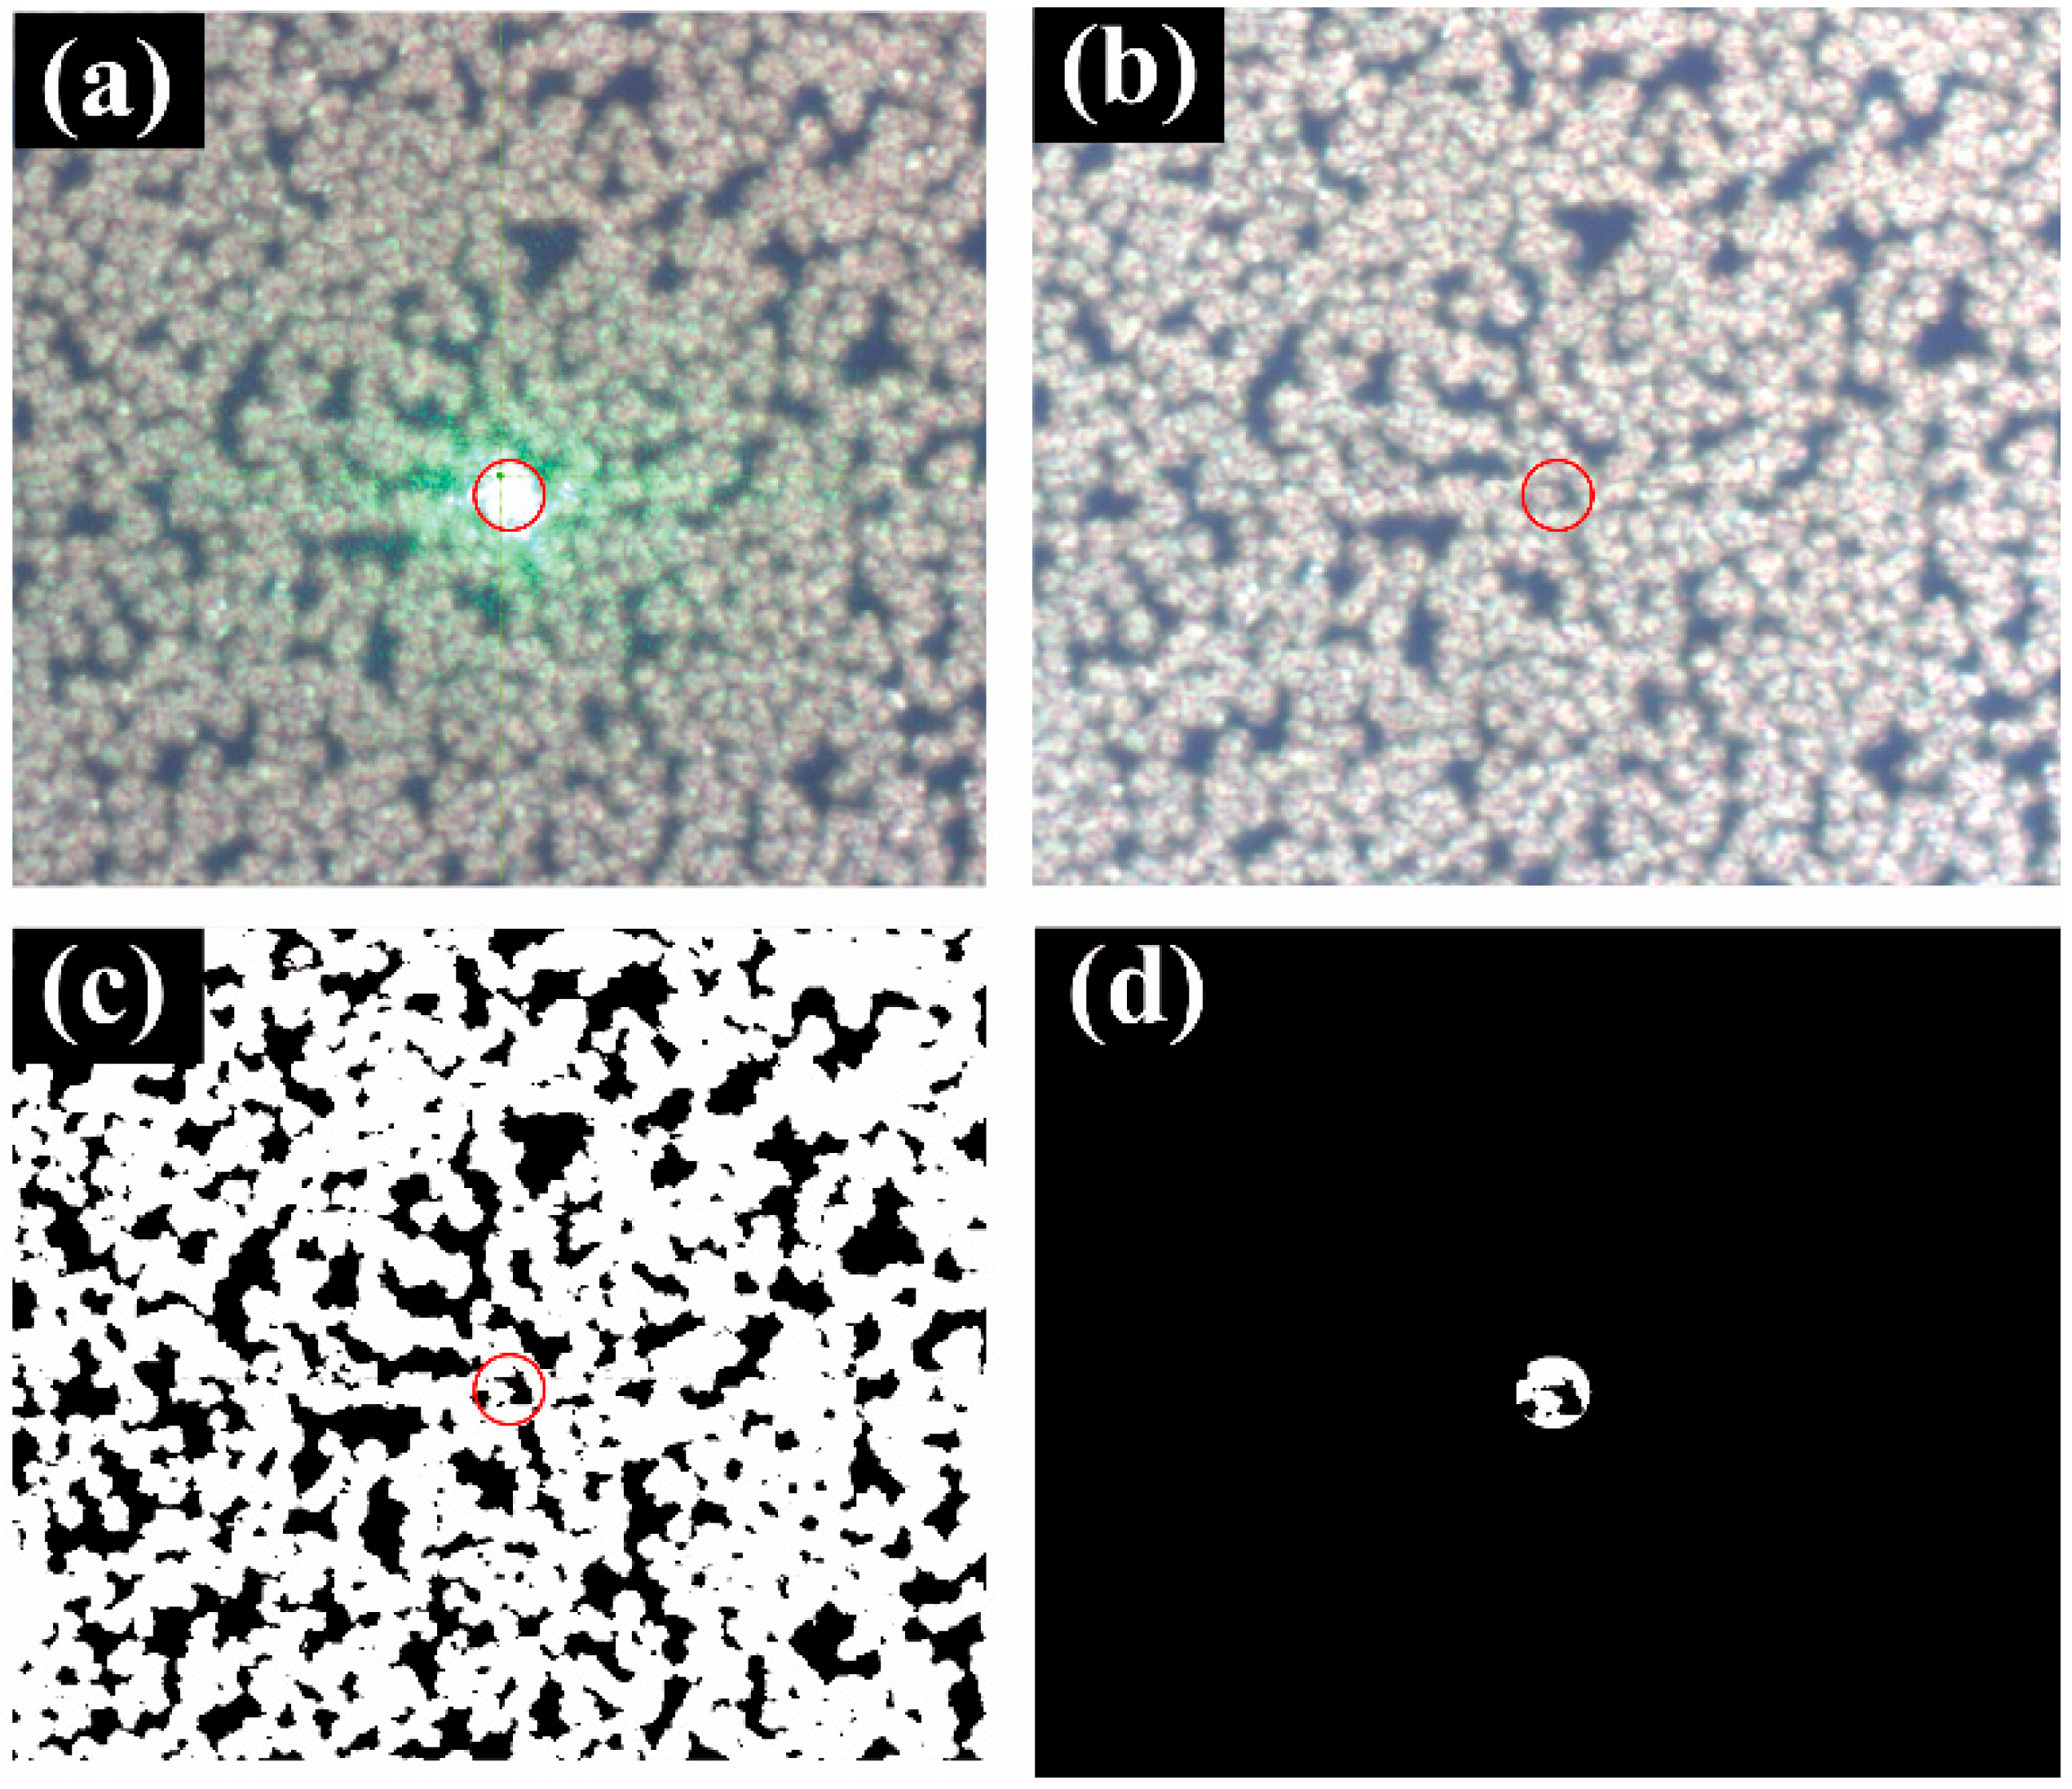
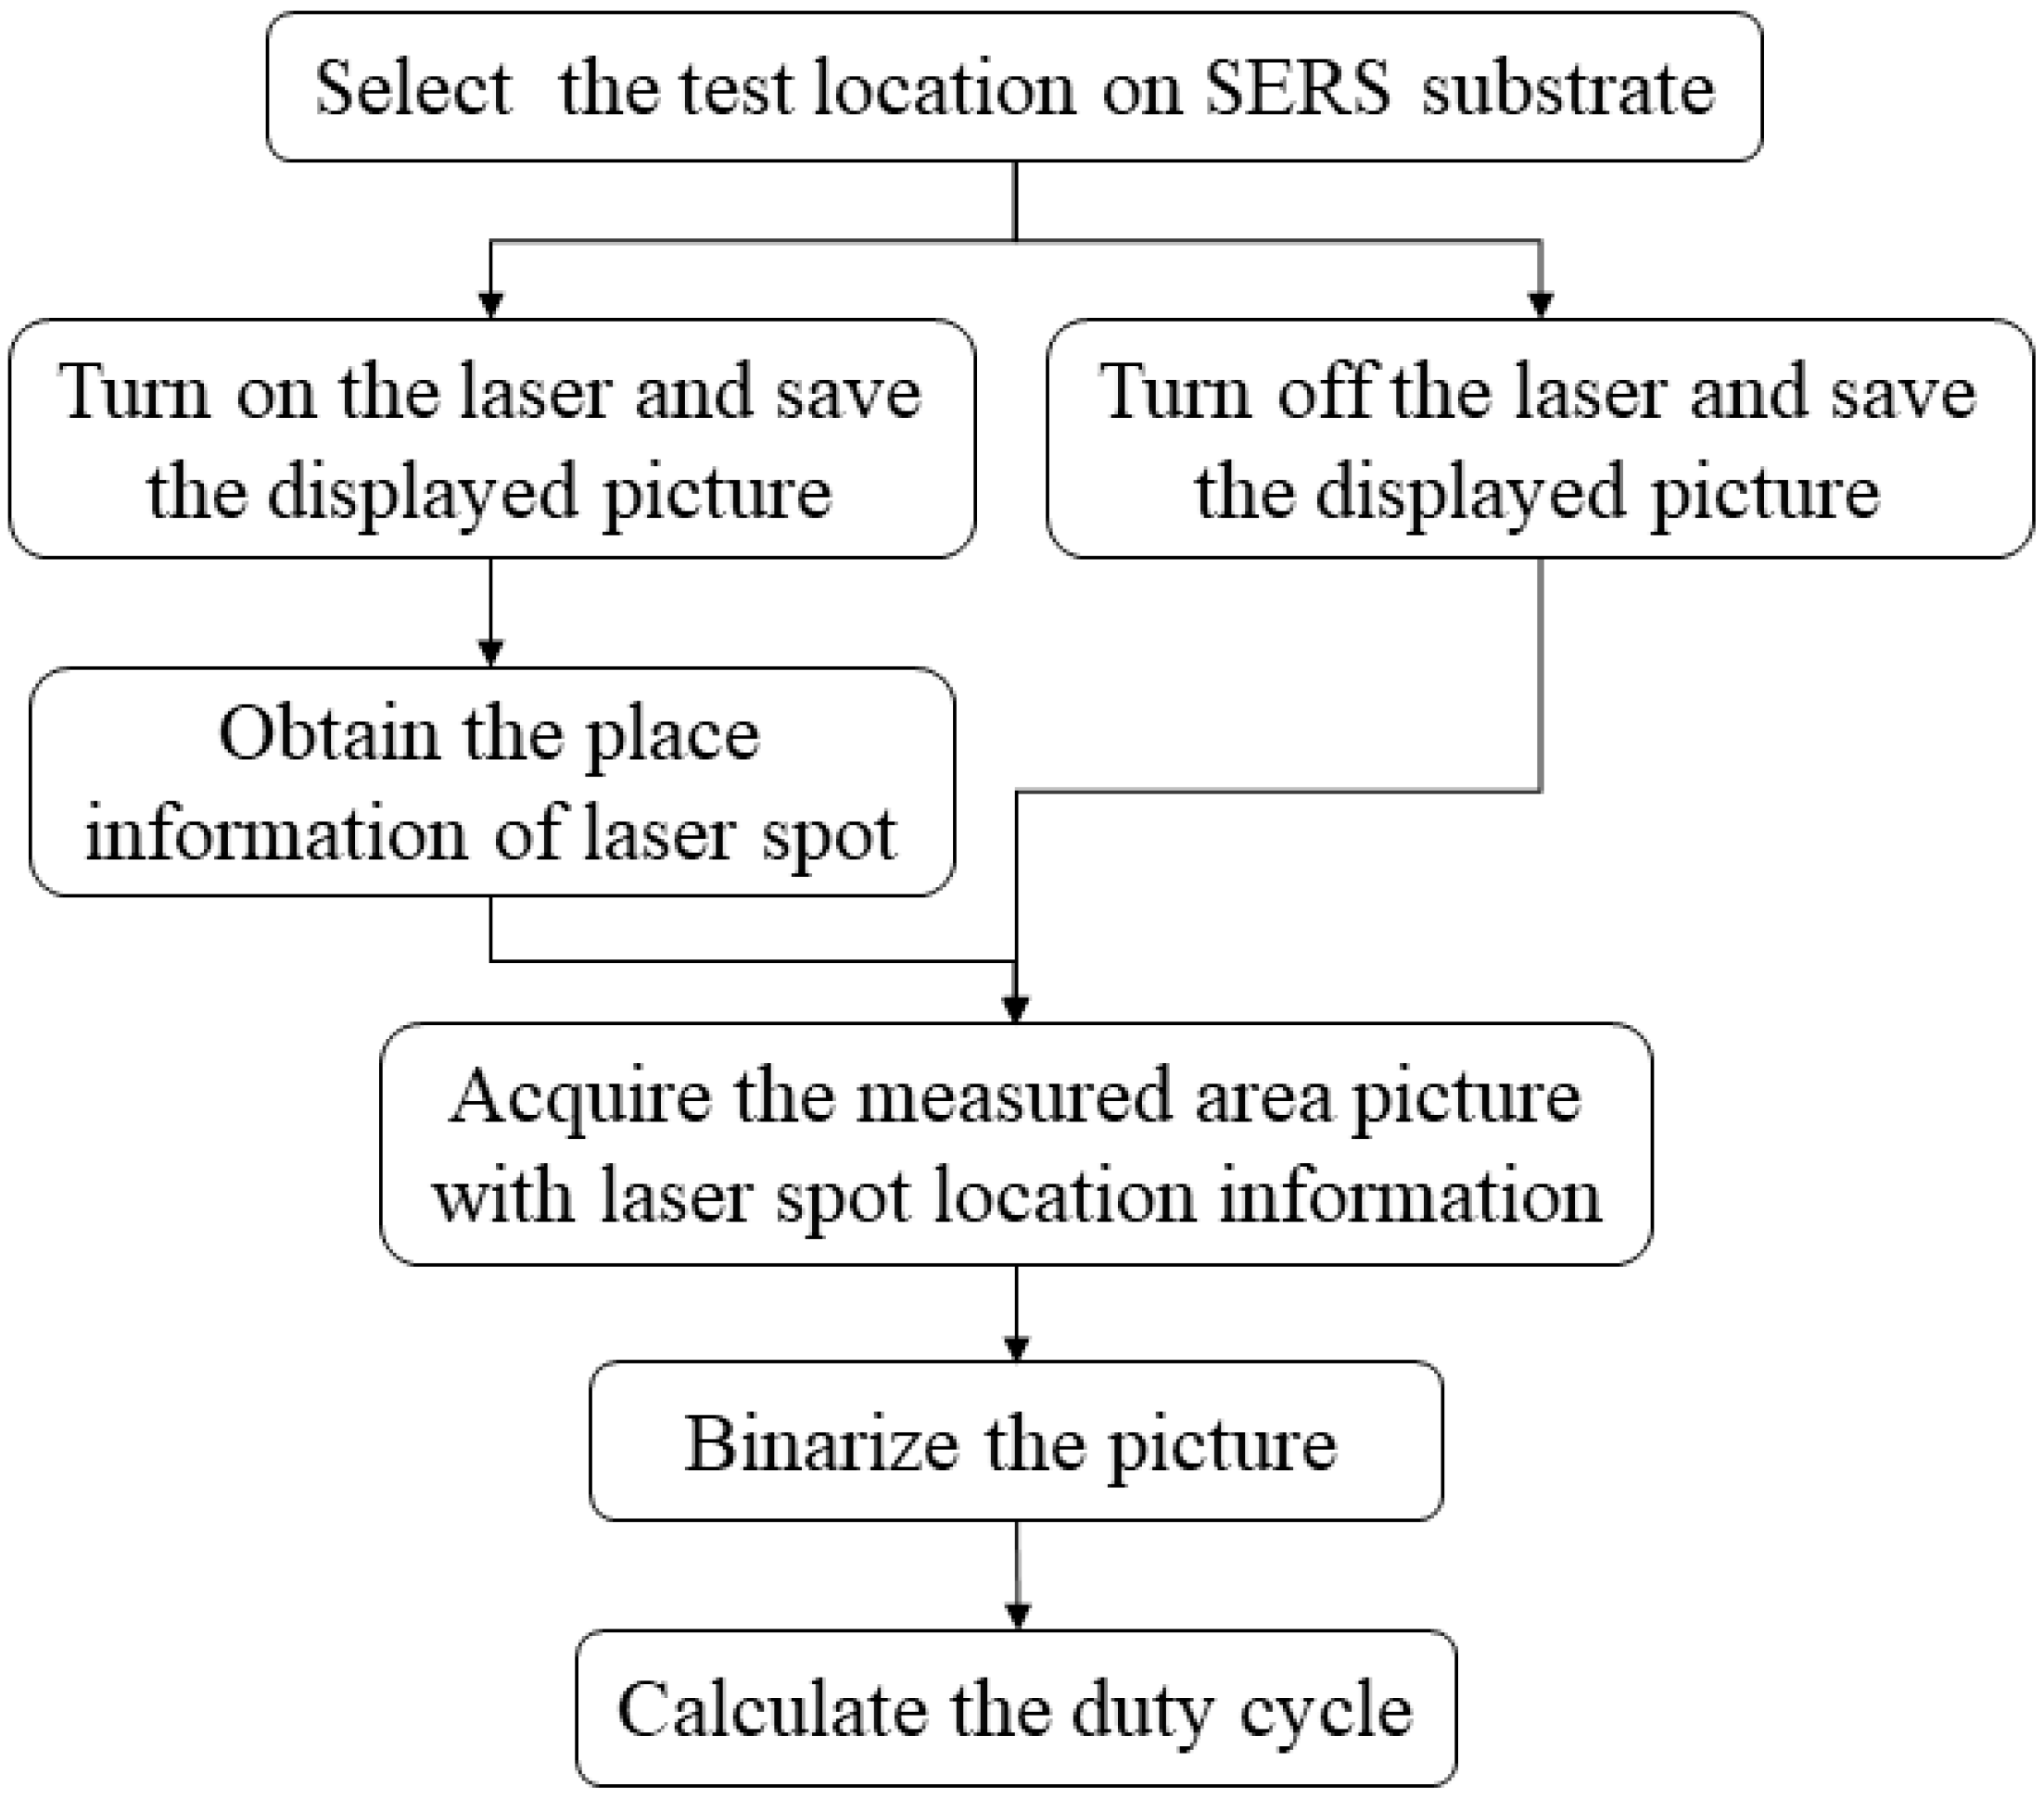
2.5. Test and Computation of the Duty Cycle

Even if the SERS substrate has the same distribution, the number of nanoparticles within the illuminated area varies when the exciting light illuminates it at different locations, because the size of the exciting light area is comparable with that of the nanostructures. As a result, different enhancement effects of the Raman spectra occur. A concept called the duty cycle of nanostructures is defined in order to describe the number of nanoparticles within the illuminated area quantitively. For calculation simplicity, if the SERS substrate is a two-dimensional planar structure, the duty cycle of nanostructures is defined as
D n a n o = S n a n o S e x c i t i n g
where Snano and Sexciting are the areas of the nanostructure and laser spot, respectively. Therefore, they should be obtained in order to calculate the duty cycle of nanostructures.
The test optical setup of the Raman spectrometer was similar to that shown in Figure 1. First, the illumination position and area of the exciting beam were ensured in order to compute the duty cycle. When the laser was turned on, the picture that is illustrated in Figure 3a was obtained using the control computer of the Raman spectrometer. From this image, the position and size of the laser spot were determined. Snano was calculated by turning off the laser and then imaging the SERS substrate at the same place. As shown in Figure 3b, the nanostructures were represented by bright sections that may be extracted with image processing. Then, the image was converted into grayscale in order to distinguish between the flower-like silver nanostructures and the gaps between structures. The grayscale image was further converted into a black and white image through binarization in order to obtain more accurate information, as shown in Figure 3c. Moreover, the position of a laser spot was used as the mask, and only the data in the mask were retained, as shown in Figure 3d. White areas denote the flower-like silver nanostructures, and black areas correspond to the gaps between nanostructures. From this picture, duty cycles were calculated, and the whole calculation flow chart is shown in Figure 4.
To obtain the universal rule of the effect of duty cycle, different laser spot sizes were used to do the experiment. This was realized by changing the objective lens of the Raman spectrometer. The 20×, 10× and 5× objective lenses were selected and the corresponding laser spot sizes were 10, 20 and 40 µm respectively.

3. Results and Discussions

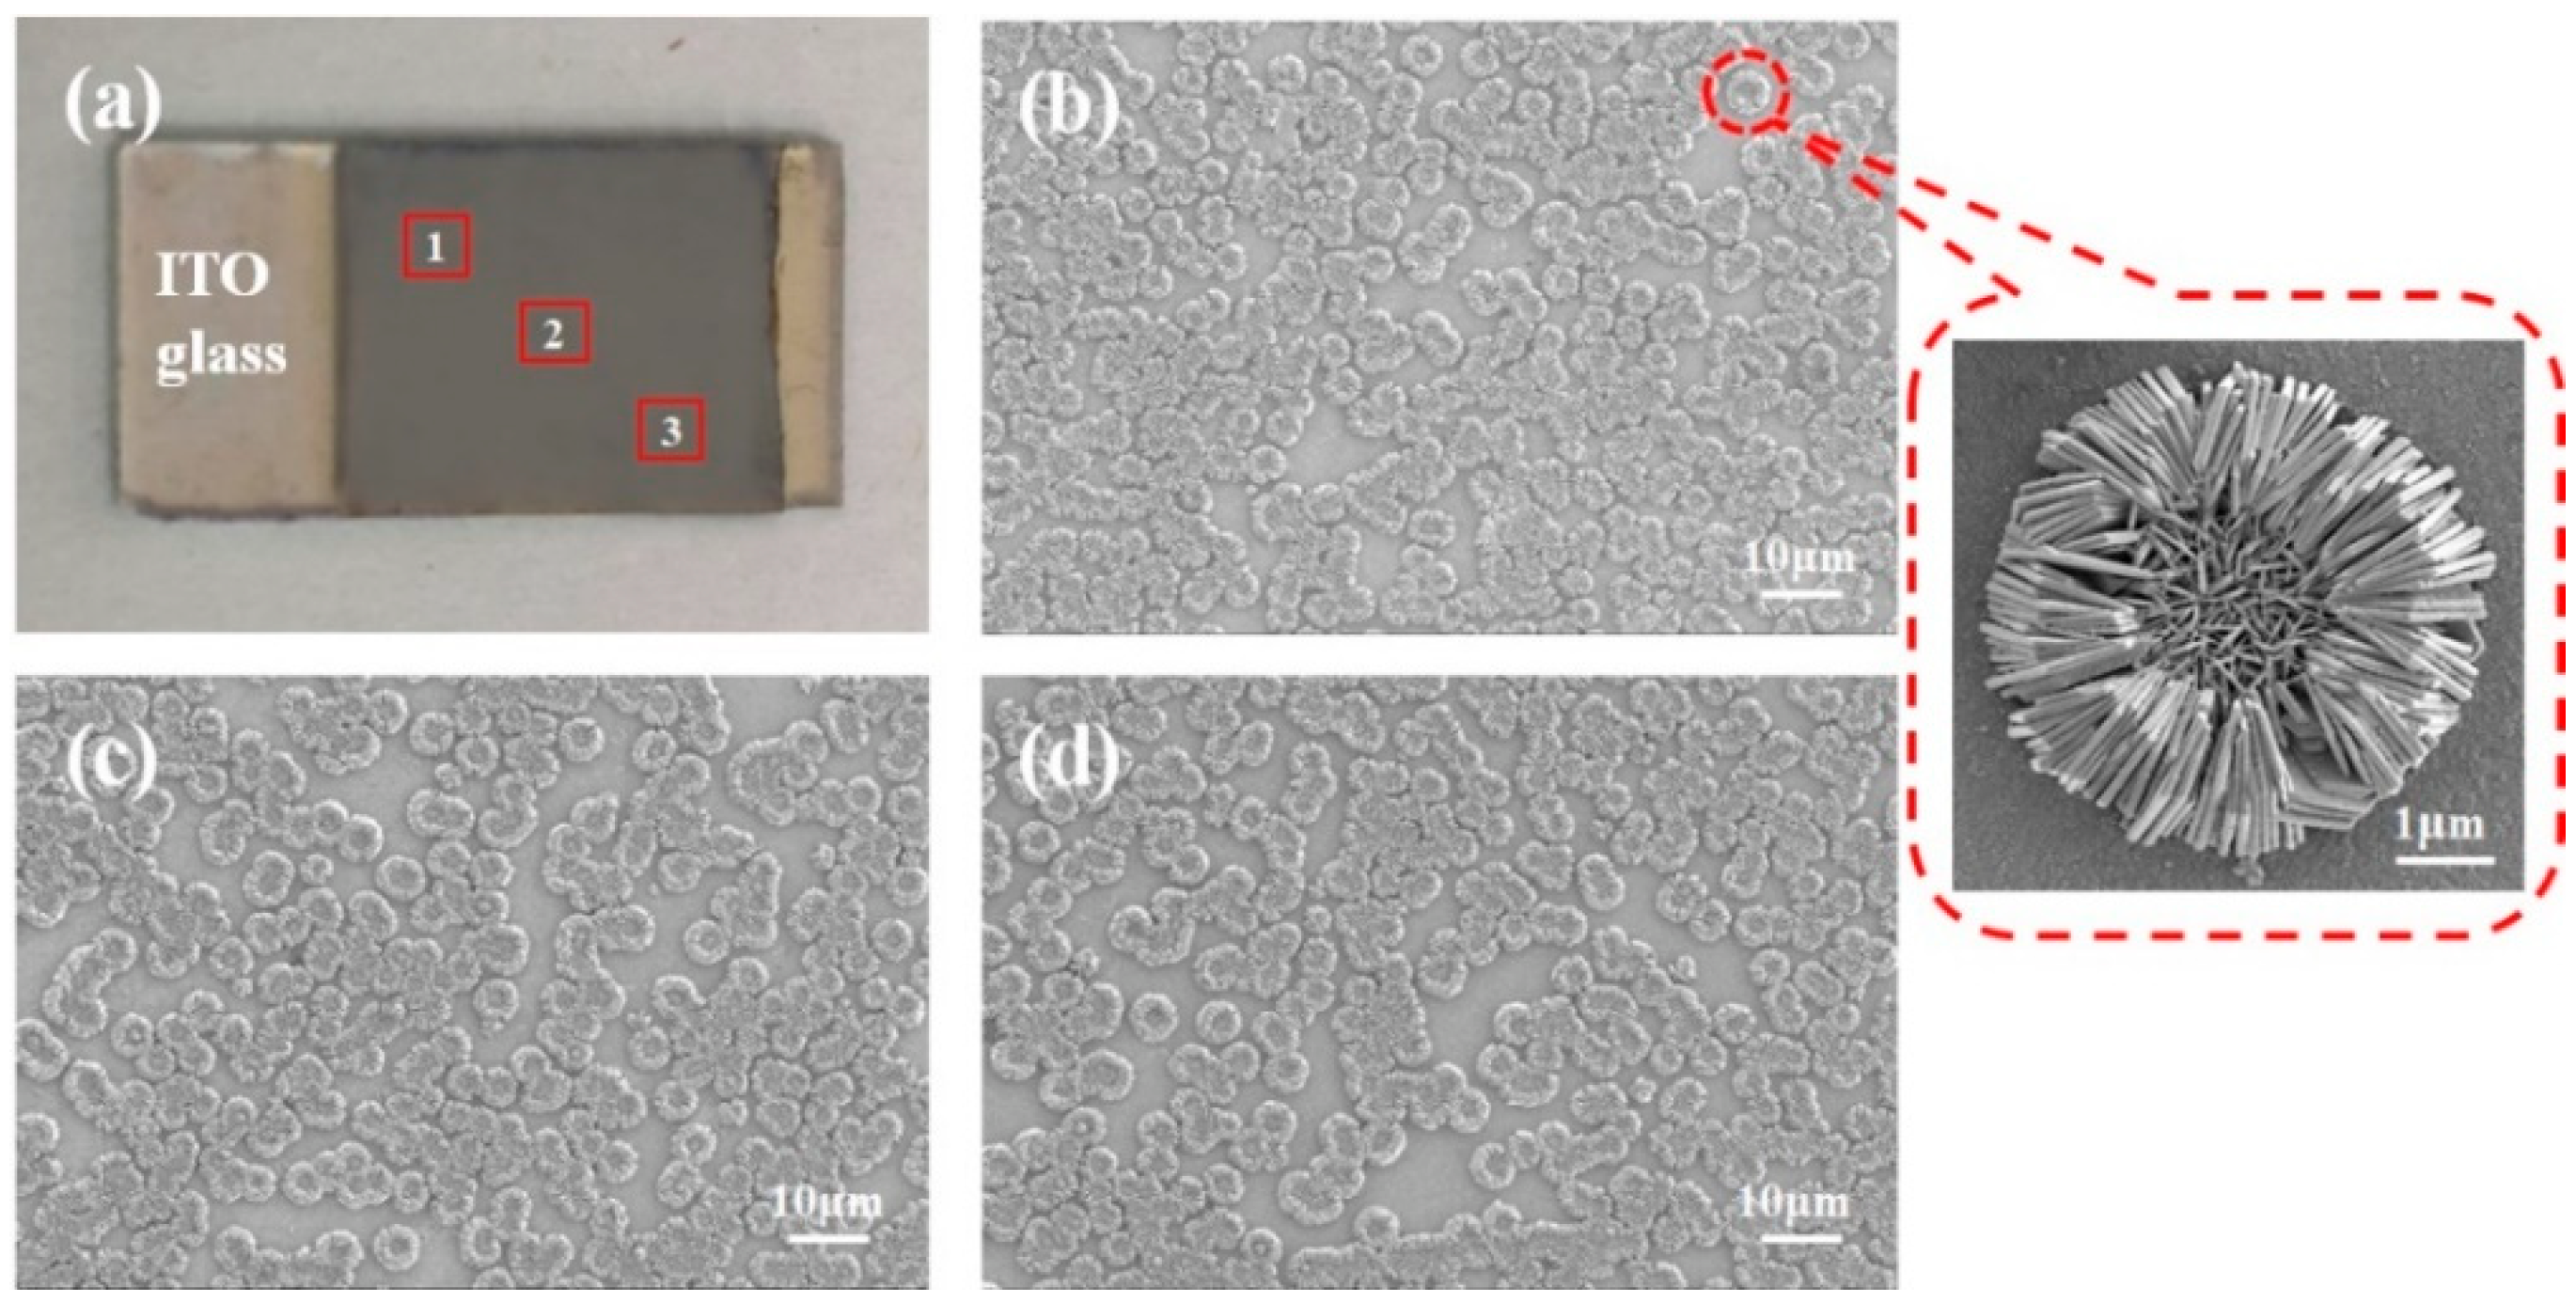
3.1. Characterization of Flower-like Silver Nanostructures

The silver flower-like SERS substrate was prepared using the growth method assisted by the soft lyotropic LC template, and its SEM images are shown in Figure 5. The gray part of the ITO glass is the prepared flower-like silver nanostructure (Figure 5a), and the SEM images of three positions are presented in Figure 5b–d. These results reveal that the flower-like silver nanostructures grew on the ITO glass substrate with uniform distribution. A magnified image of a single silver nanoflower with a measuring scale of 1 μm is illustrated in Figure 5. The diameter of the silver nanoflower is about 4 μm, and the petals with a thickness of approximately 100 nm are arranged. The silver nanoflower has many sharp inflection points, so the spectral signal enhances greatly because of the hotspot effect.

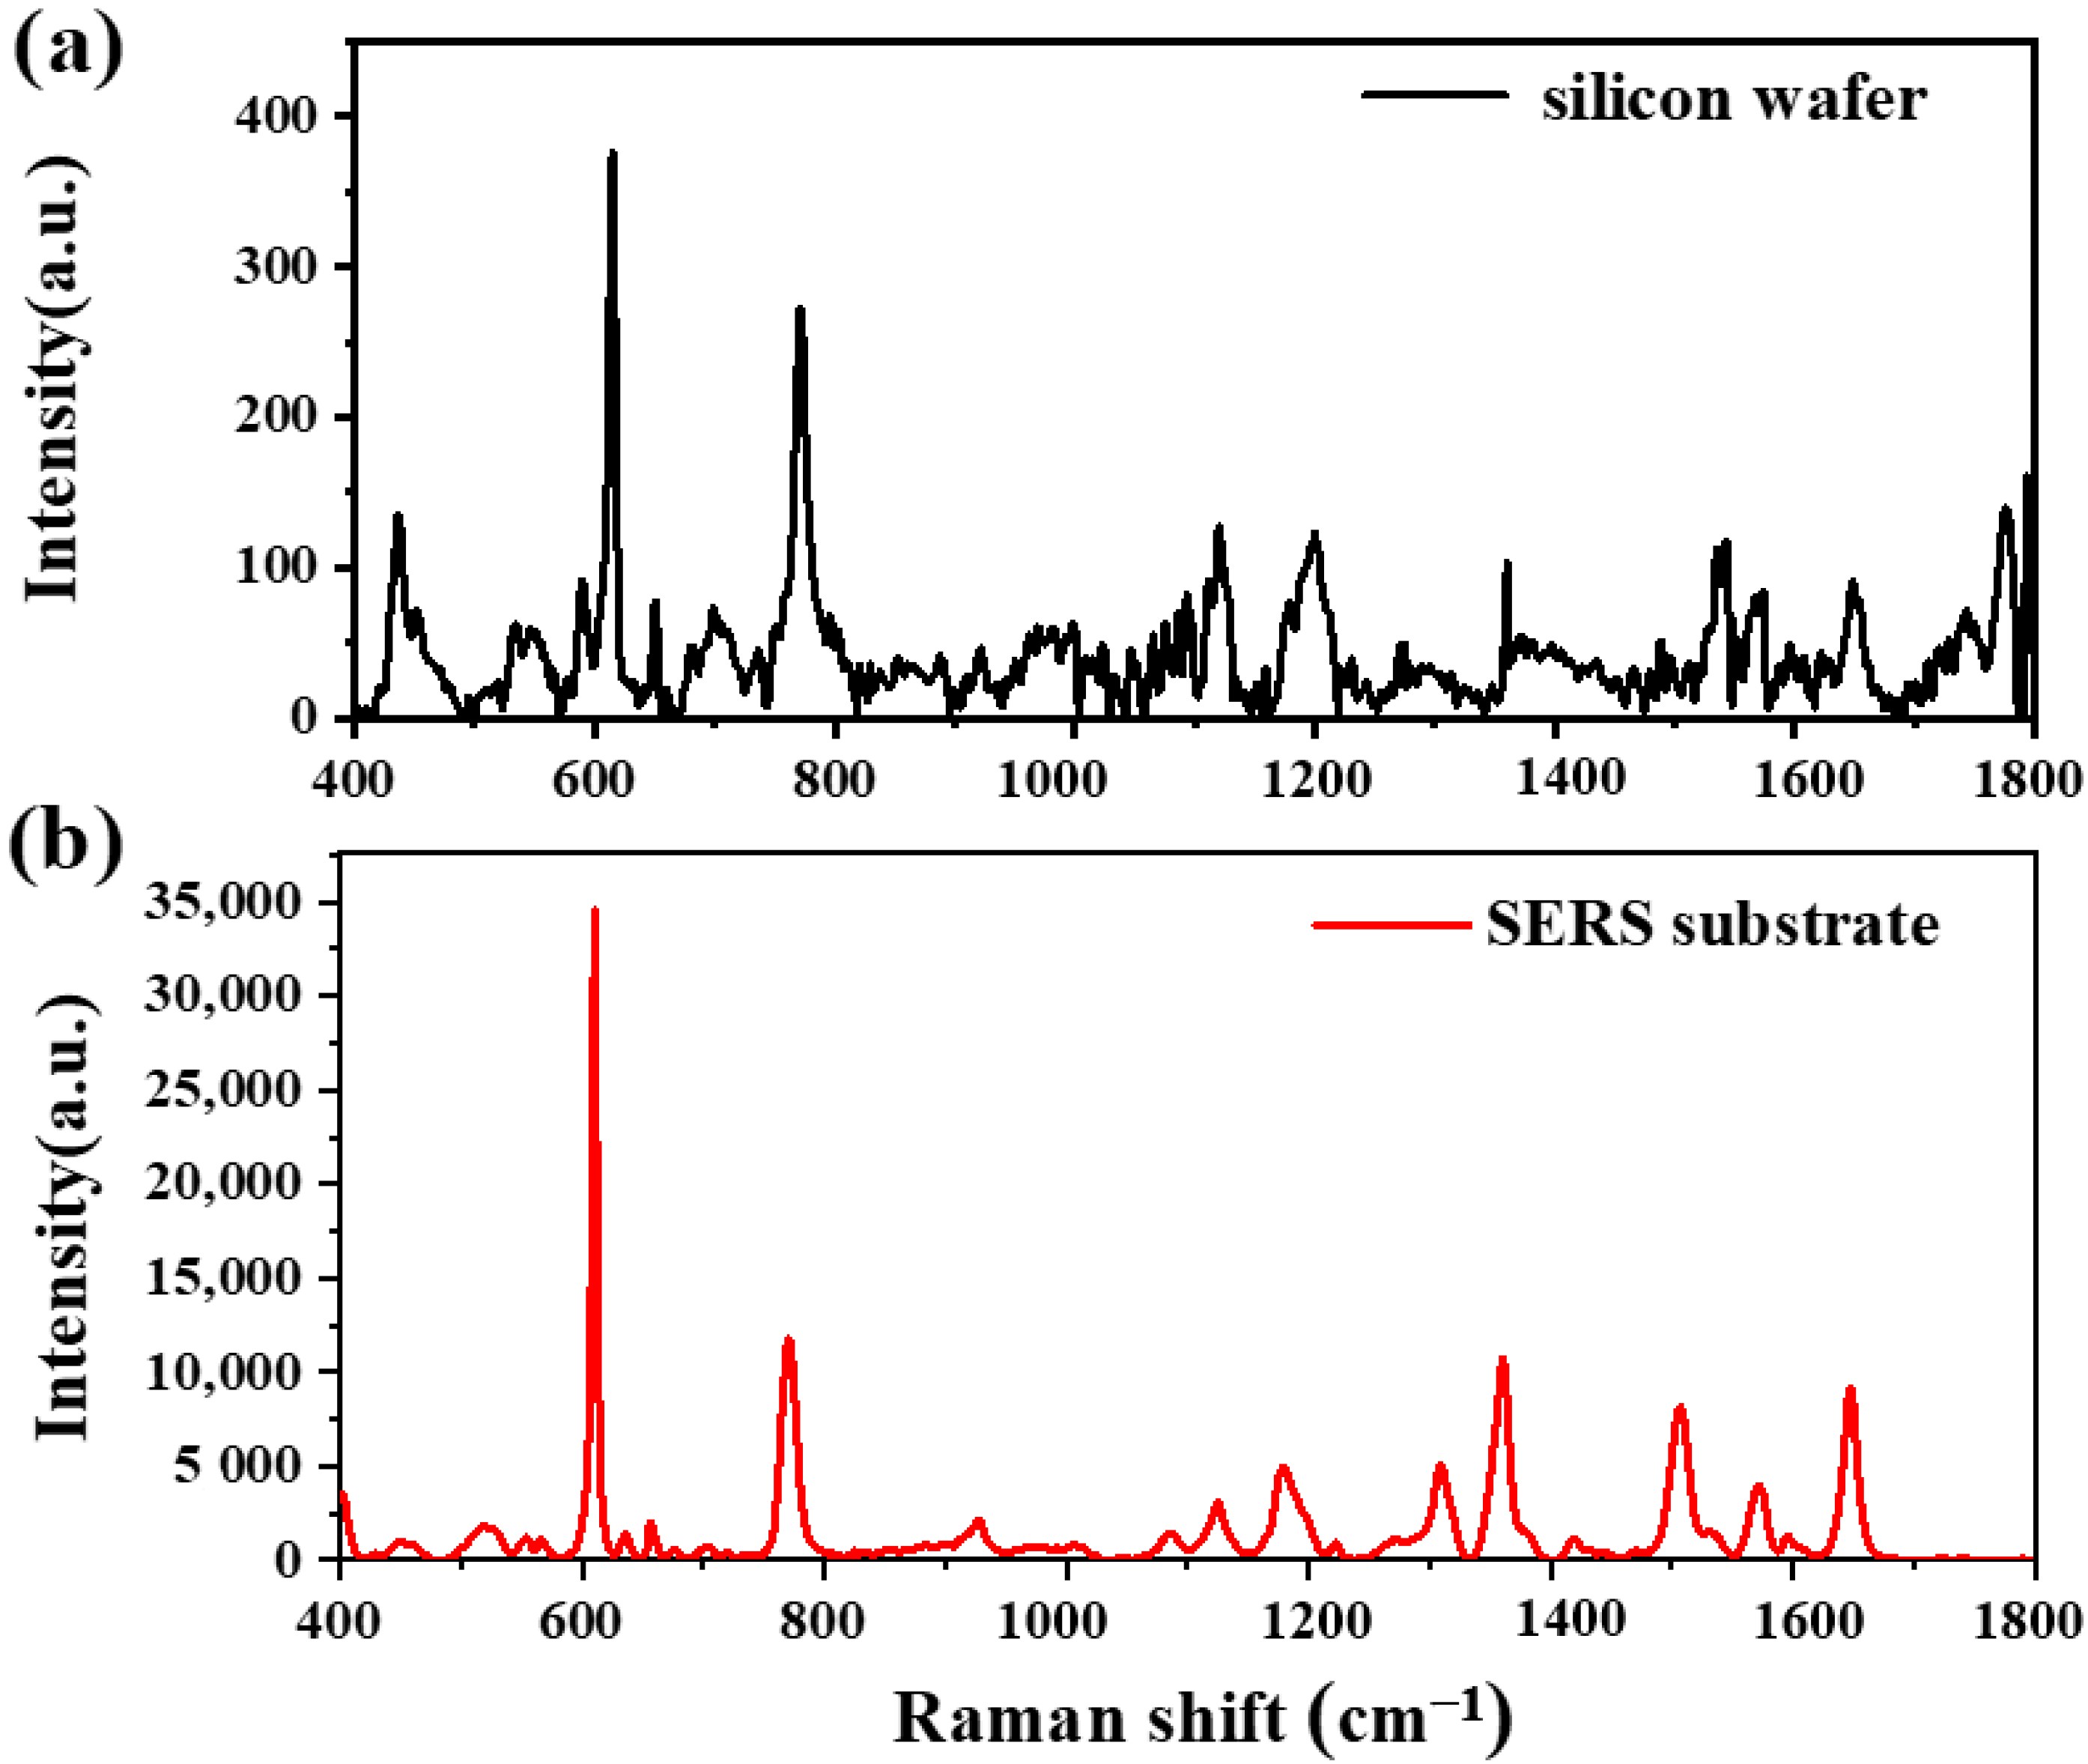
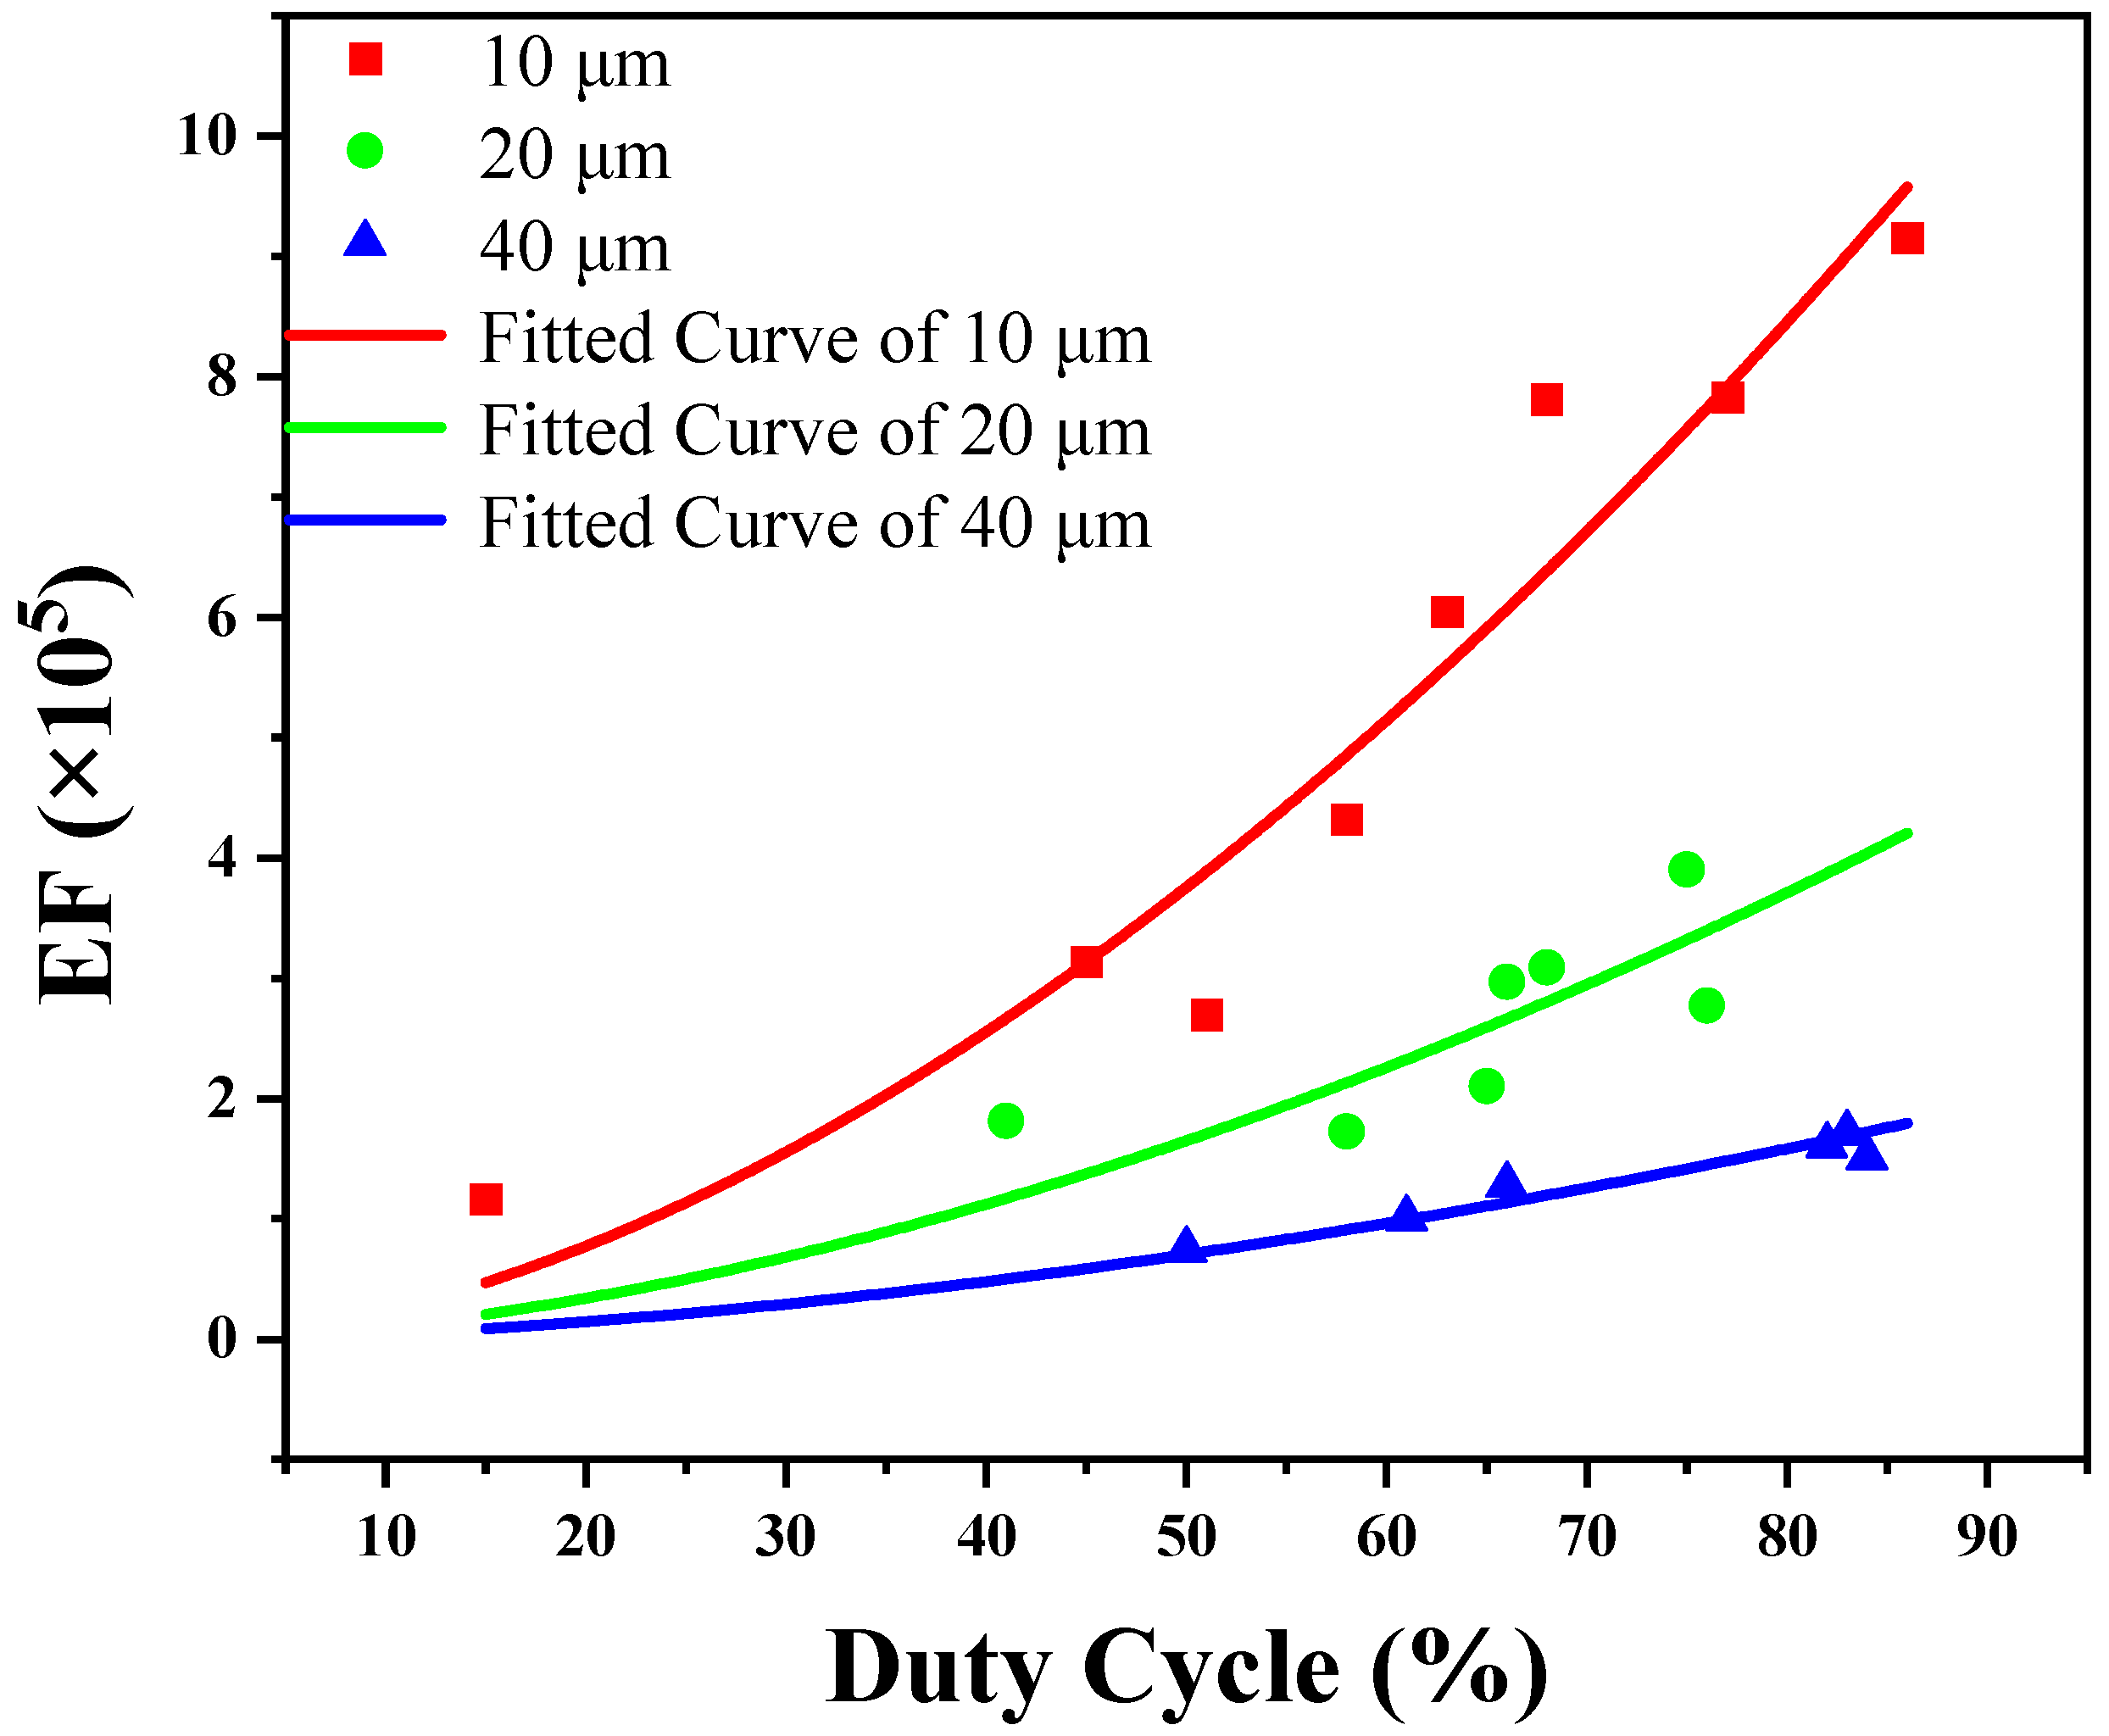
3.2. Enhancement Factor of SERS Substrate

R6G is used as a Raman probe in order to obtain the Raman spectra and the measured results are shown in Figure 6. The Raman characteristic peaks of R6G are the wave numbers of 611, 774, 1183, 1312, 1361, 1511, and 1651. The spectral intensities of the silicon wafer and SERS substrate are illustrated in Figure 6a and Figure 6b, respectively. According to Equation (4), the peak intensities of the Raman spectra, namely, ISERS and Ibulk, should be known to calculate the EF. The peak intensity with the wave number of 611 cm−1 is selected for the computation, and ISERS and Ibulk are 34,575 and 374, respectively. The volume of the R6G solution (1 μM) is 3 μL. The area S occupied by the R6G solution on the substrate may be acquired on the basis of the area’s diameter of 2.8 mm. The value of δ is 1.88 nm2, and Nd × AN is 0.7. Thus, the possible EF of the prepared SERS substrate is 7.3 × 10⁵, which indicates that the substrate has a strong enhancement effect. In the following figure, all of the EFs are measured and computed with this method.

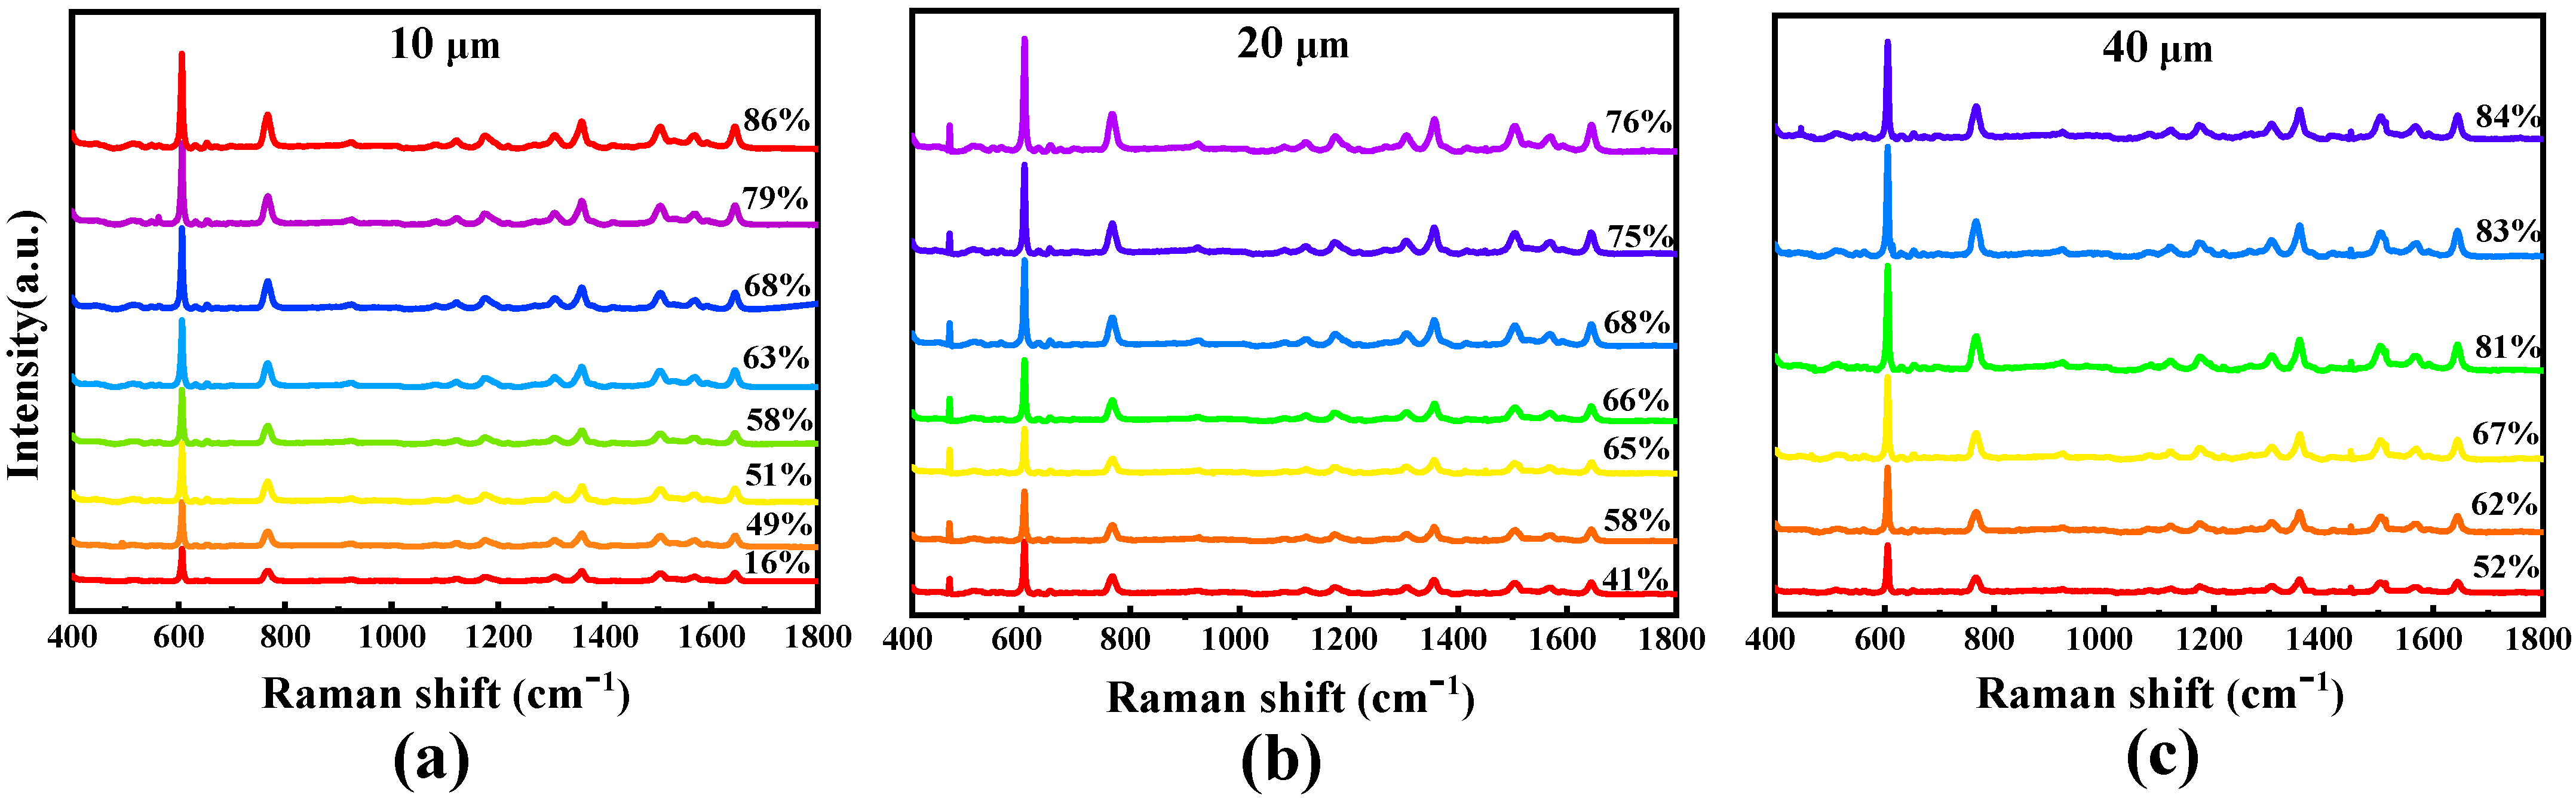
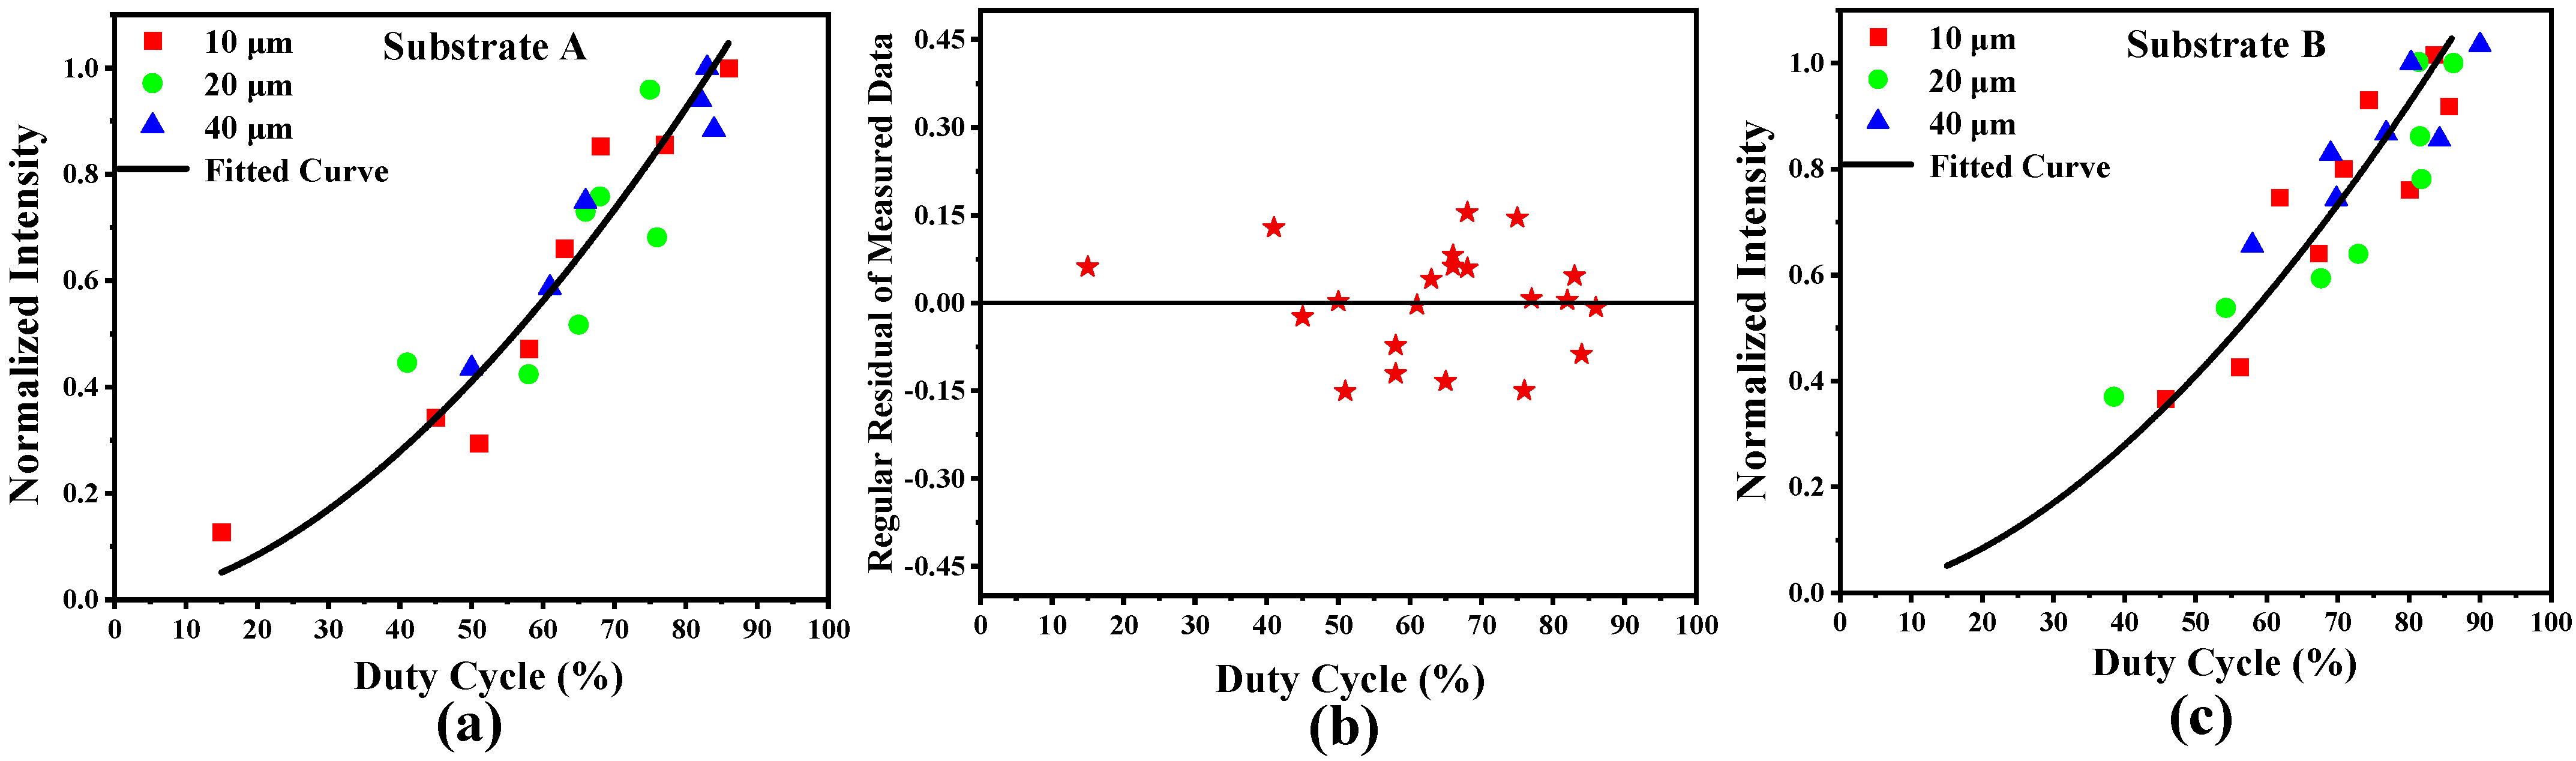
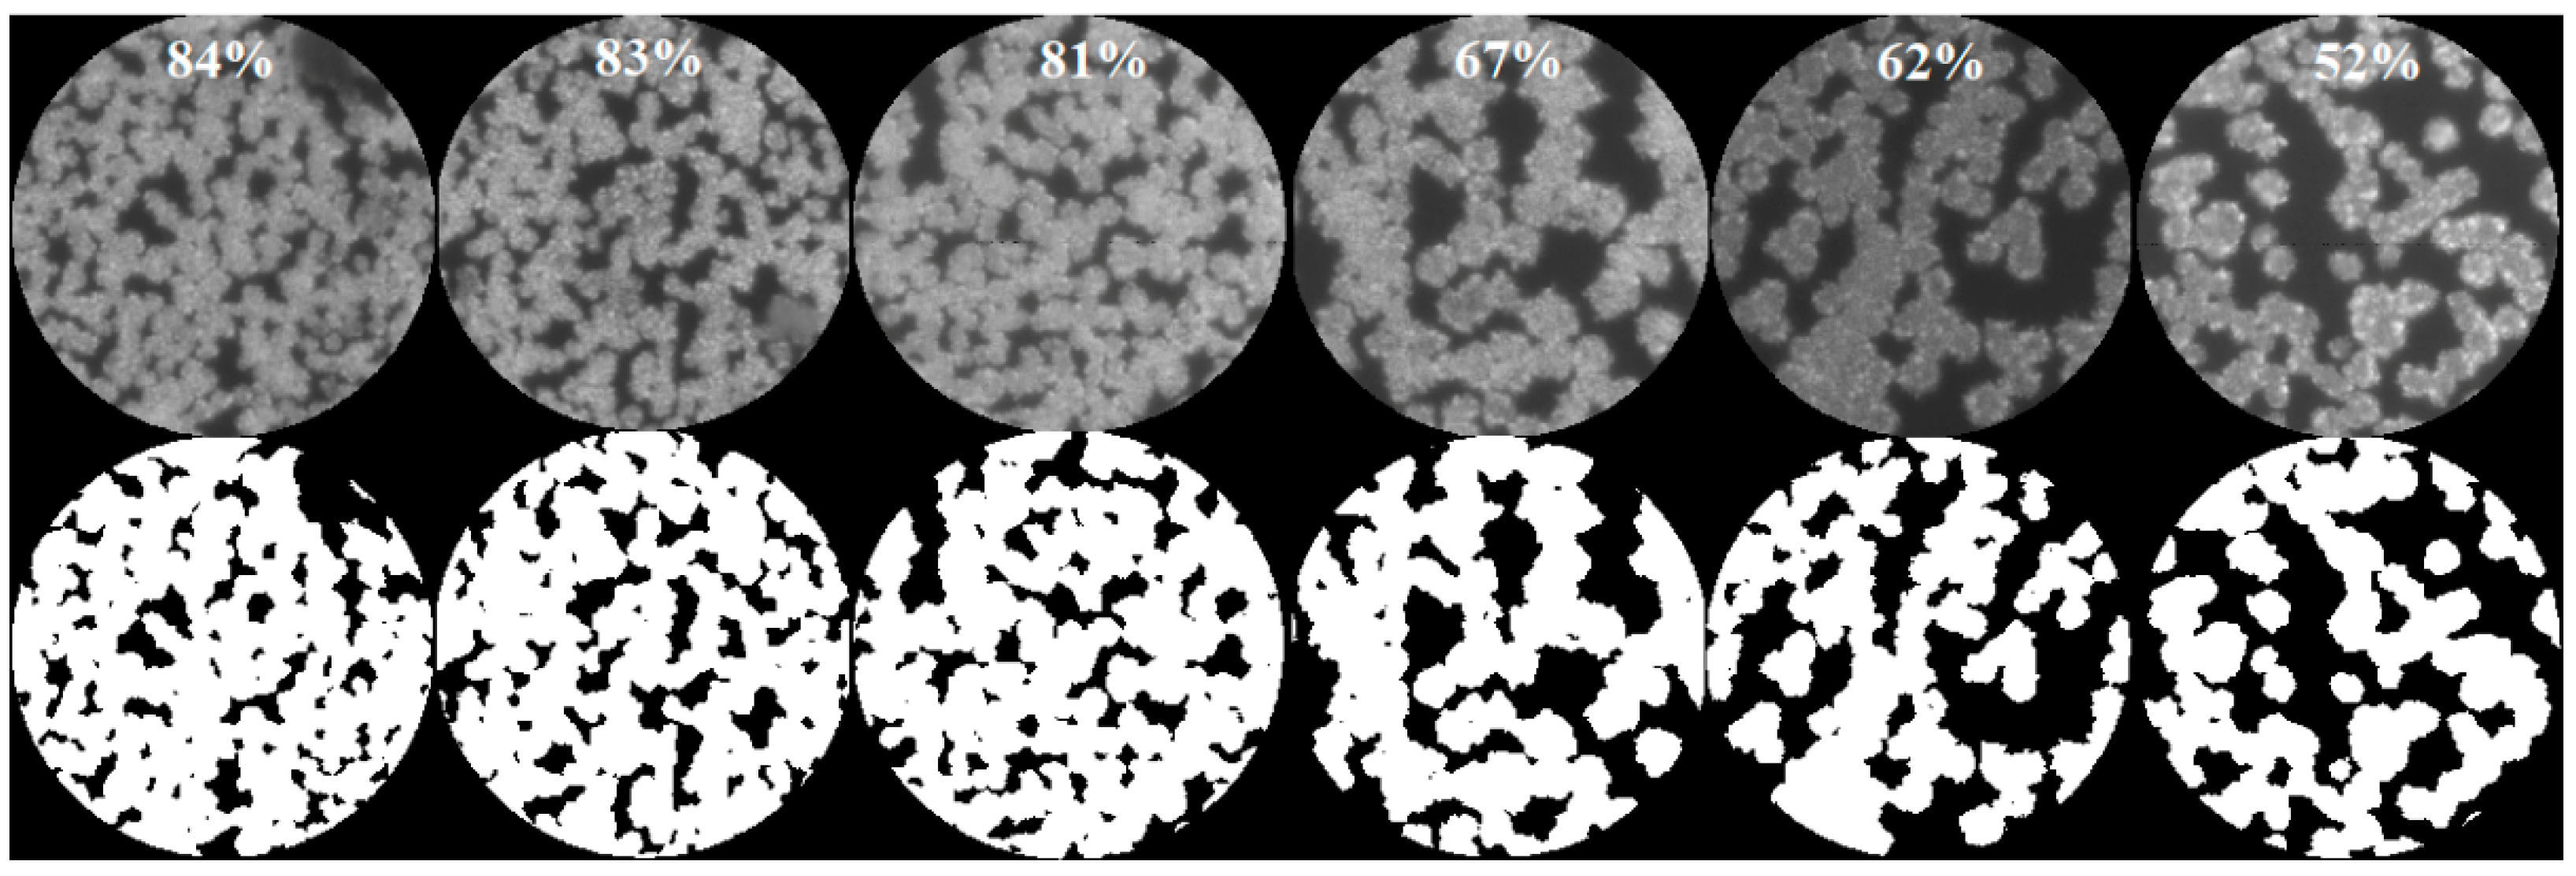
3.3. Effect of Duty Cycle on Spectral Intensity

A silver flower-like SERS substrate (labelled with substrate A) was fabricated for the duty cycle test, and different laser irradiation areas were obtained by moving the substrate to different places. Furthermore, the laser spot sizes of 10, 20 and 40 μm were chosen to test the Raman spectrum. First, the duty cycle of the nanostructures was examined and computed for 10, 20 and 40 μm laser coverage areas. As an example, the results are shown in Figure 7 with the laser spot of 40 μm. The upper and lower parts of each subfigure are the grayscale and binarized images, respectively.
R6G was also used as the probe, and the tested Raman spectra of substrate A are shown in Figure 8, which correspond to the laser spots of 10, 20 and 40 μm, respectively. This result indicates that the peak spectral intensities strengthen while the values of duty cycles increase. The peak intensity at the wave number of 611 was selected for data analysis and fitting in order to investigate the relation between the spectral intensity and the duty cycle. The measured spectral intensity varied with different laser spot sizes, so the spectral intensity was normalized for convenient comparison. The normalized spectral intensity as a function of duty cycle is presented in Figure 9a, where ■, ● and ▲ represent the measured discrete data for 10, 20 and 40 μm laser spots, respectively, and the real line is the fitted curve. For different laser spot sizes, the trend of changes in the fitted curve is similar. The fitted Raman spectral intensity may be expressed as
I = 1.3   r 1.6
where r is the duty cycle of nanostructures. By using Equation (6), the normalized spectral intensity may be computed easily with different duty cycles. After fitting, the deviation between the measured and the fitted data was calculated as shown in Figure 9b. It indicates that the deviation magnitude belongs to [−15,15]. Further, the regular residual data were analyzed and their mean value and standard deviation are 0.002 and 0.09, respectively. In addition, some other SERS substrates were measured and the fitted results had the similar law. As an example, the measured data and fitting curve of another substrate (substrate B) are shown in Figure 9c. Similarly, the deviation magnitude is limited in [−14,15] and the standard deviation is also 0.09. It illustrates that, with the proposed method, the measuring error of the Raman spectrum intensity may be less than 10%. Hence, combining the measured data and Formula (6), the spectrum intensity may be acquired and the effect of duty cycle will be reduced greatly.
The effect of duty cycle on the EF may be calculated with Equation (4), and the results of substrate A are shown in Figure 10. In contrast to the normalized spectral intensity, different laser spot sizes have various fitted EF curves. Moreover, the EF under the 10 μm spot is greater than that under the 20 and 40 μm spot because the larger the light spot is, the weaker the spectral intensity will be. For practical applications such as trace element tests, spectral intensities must be considered because they represent the number of elements. Therefore, Equation (6) may be used to measure the amount of matter for many kinds of test applications. The EF has no effect on test applications because it is only used to evaluate the enhancement ability of the SERS substrate.

4. Conclusions

The effect of the duty cycle of nanostructures on the Raman spectral intensity of SERS was studied. First, flower-like silver nanostructures were fabricated with a soft lyotropic LC template. SEM images show that their diameter was about 4 μm, and the thickness of their petals was approximately 100 nm. R6G was used to measure the enhancement effect of the SERS substrate, and the EF was up to 7.3 × 10⁵.
Then, multiple pictures measured with the Raman spectrometer were selected and processed to calculate the duty cycle of the nanostructures. The corresponding Raman spectrum was also tested. For laser spots of 10, 20 and 40 μm with different SERS substrates, the relation between the duty cycle and spectral intensity was obtained with the same fitting curve and described by using the established formula. The deviation magnitude between the measured and fitted data belongs to [−15, 15] and the standard deviation of regular residual data is 0.09. The measuring error of the Raman spectrum intensity is less than 10%.
This formula may be used to calibrate test sensitivity, and the SERS substrate is utilized to measure the amount of matter in many kinds of test applications. Moreover, these flower-like silver nanostructures may be easily prepared with lyotropic LC and have a low cost, and they may be used as SERS substrates for Raman spectrometers employed in various test applications. This work may serve as a reference for the quantitative calibration of SERS substrate sensitivity and promote the actual applications of SERS in high-sensitivity testing.

Author Contributions

Conceptualization, Z.C. and H.M.; methodology, Y.L. and Y.S.; writing—original draft preparation, S.Z.; writing—review and editing, H.S. and G.X.; supervision, X.Z.; preparation and characterization of the nanoflowers, Z.J.; and data analysis, X.L. and W.H. All authors have read and agreed to the published version of the manuscript.

Funding

This research was funded by the Postgraduate Research and Innovation Practice Activity Project of Jiangsu Province (No. KYCX21_3013), the Jiangsu Key Disciplines of the Thirteenth Five-Year Plan (No. 20168765), Industry-University-Institute cooperation Foundation of the eighth Research Institute of China Aerospace Science and Technology Corporation (No. SAST2020-025) and the Academic Research Projects of Beijing Union University (No. ZK70202007).

Institutional Review Board Statement

Not applicable.

Informed Consent Statement

Not applicable.

Data Availability Statement

Not applicable.

Acknowledgments

The SEM measurements were accomplished in the Jiangsu Jicui Organic Optoelectronic Technology Research Institute Co., Ltd. The Raman measurements were accomplished in the research center for solid state physics and materials.

Conflicts of Interest

The authors declare no conflict of interest.

Sample Availability

Samples of the compounds are available from the authors.

References

  1. Gambucci, M.; Cambiotti, E.; Sassi, P.; Latterini, L. Multilayer Gold-Silver Bimetallic Nanostructures to Enhance SERS Detection of Drugs. Molecules 2020, 25, 3450. [Google Scholar] [CrossRef] [PubMed]
  2. Guo, H.; Hamlet, L.; He, L.; Xing, B. A field-deployable surface-enhanced Raman scattering (SERS) method for sensitive analysis of silver nanoparticles in environmental waters. Sci. Total Environ. 2019, 653, 1034–1041. [Google Scholar] [CrossRef]
  3. Homma, T.; Kato, A.; Kunimoto, M.; Yanagisawa, M. Direct observation of the diffusion behavior of an electrodeposition additive in through-silicon via using in situ surface enhanced Raman spectroscopy. Electrochem. Commun. 2018, 88, 34–38. [Google Scholar] [CrossRef]
  4. Lin, L.; Qu, F.; Nie, P.; Zhang, H.; Chu, B.; He, Y. Rapid and Quantitative Determination of Sildenafil in Cocktail Based on Surface Enhanced Raman Spectroscopy. Molecules 2019, 24, 1790. [Google Scholar] [CrossRef] [Green Version]
  5. Mollica Nardo, V.; Renda, V.; Trusso, S.; Ponterio, R. Role of pH on Nanostructured SERS Active Substrates for Detection of Organic Dyes. Molecules 2021, 26, 2360. [Google Scholar] [CrossRef] [PubMed]
  6. Nuntawong, N.; Limwichean, S.; Horprathum, M.; Patthanasettakul, V.; Ketkong, A.; Thamaphat, K.; Petchruangrong, P.; Jankong, S.; Kasikijwiwat, P.; Chindaudom, P.; et al. Improved discrimination of pen inks on document by surface-enhanced Raman substrate fabricated by magnetron sputtering. Optik 2020, 201, 163499. [Google Scholar] [CrossRef]
  7. Tognaccini, L.; Ricci, M.; Gellini, C.; Feis, A.; Smulevich, G.; Becucci, M. Surface Enhanced Raman Spectroscopy for In-Field Detection of Pesticides: A Test on Dimethoate Residues in Water and on Olive Leaves. Molecules 2019, 24, 292. [Google Scholar] [CrossRef] [Green Version]
  8. Li, H.; Wang, M.; Shen, X.; Liu, S.; Wang, Y.; Li, Y.; Wang, Q.; Che, G. Rapid and sensitive detection of enrofloxacin hydrochloride based on surface enhanced Raman scattering-active flexible membrane assemblies of Ag nanoparticles. J. Environ. Manag. 2019, 249, 109387. [Google Scholar] [CrossRef]
  9. Li, Y.; Jiang, L.; Zou, Y.; Song, Z.; Jin, S. Highly reproducible SERS sensor based on self-assembled Au nanocubic monolayer film for sensitive and quantitative detection of glutathione. Appl. Surf. Sci. 2021, 540, 148381. [Google Scholar] [CrossRef]
  10. Liu, Y.; Chen, Y.; Zhang, Y.; Kou, Q.; Zhang, Y.; Wang, Y.; Chen, L.; Sun, Y.; Zhang, H.; Jung, Y. Detection and Identification of Estrogen Based on Surface-Enhanced Resonance Raman Scattering (SERRS). Molecules 2018, 23, 1330. [Google Scholar] [CrossRef] [Green Version]
  11. Qu, L.; He, S.; Wang, J.; Lin, Z.; Barry, D.; Yang, G.; Wang, P.; Zhang, P.; Li, H. Fluorescence-surface enhanced Raman scattering dual-mode nanosensors to monitor hydroxyl radicals in living cells. Sens. Actuators B Chem. 2017, 251, 934–941. [Google Scholar] [CrossRef]
  12. Huh, Y.; Chung, A.; Erickson, D. Surface enhanced Raman spectroscopy and its application to molecular and cellular analysis. Microfluid. Nanofluidics 2009, 6, 285–297. [Google Scholar] [CrossRef]
  13. Dai, C.; Lin, Z.; Agarwal, K.; Mikhael, C.; Aich, A.; Gupta, K.; Cho, J. Self-Assembled 3D Nanosplit Rings for Plasmon-Enhanced Optofluidic Sensing. Nano Lett. 2020, 20, 6697–6705. [Google Scholar] [CrossRef] [PubMed]
  14. Gu, C.; Man, S.; Tang, J.; Zhao, Z.; Liu, Z.; Zhang, Z. Preparation of a monolayer array of silica@gold core-shell nanoparticles as a SERS substrate. Optik 2020, 221, 165274. [Google Scholar] [CrossRef]
  15. Liang, L.; Zheng, P.; Zhang, C.; Barman, I. A Programmable DNA-Silicification-Based Nanocavity for Single-Molecule Plasmonic Sensing. Adv. Mater. 2021, 33, e2005133. [Google Scholar] [CrossRef]
  16. Kim, Y.; Gupta, P.; Kim, K. Controlling the Multiscale Topography of Anodized Aluminum Oxide Nanowire Structures for Surface-Enhanced Raman Scattering and Perfect Absorbers. ACS Appl. Mater. Interfaces 2020, 12, 58390–58402. [Google Scholar] [CrossRef] [PubMed]
  17. Kierdaszuk, J.; Kaźmierczak, P.; Bożek, R.; Grzonka, J.; Krajewska, A.; Zytkiewicz, Z.; Sobanska, M.; Klosek, K.; Wołos, A.; Kaminska, M.; et al. Surface-enhanced Raman scattering of graphene caused by self-induced nanogating by GaN nanowire array. Carbon 2018, 128, 70–77. [Google Scholar] [CrossRef] [Green Version]
  18. Sanguansap, Y.; Karn-orachai, K.; Laocharoensuk, R. Tailor-made porous striped gold-silver nanowires for surface enhanced Raman scattering based trace detection of β-hydroxybutyric acid. Appl. Surf. Sci. 2020, 500, 144225. [Google Scholar] [CrossRef]
  19. Wu, Y.; Imae, T.; Ujihara, M. Surface enhanced plasmon effects by gold nanospheres and nanorods in Langmuir-Blodgett films. Colloids Surf. A Physicochem. Eng. Asp. 2017, 532, 213–221. [Google Scholar] [CrossRef]
  20. Philip, D.; Gopchandran, K.; Unni, C.; Nissamudeen, K. Synthesis, characterization and SERS activity of Au-Ag nanorods. Spectroc. Acta Part A—Mol. Biomol. Spectr. 2008, 70, 780–784. [Google Scholar] [CrossRef]
  21. Sinha, G.; Depero, L.; Alessandri, I. Recyclable SERS Substrates Based on Au-Coated ZnO Nanorods. ACS Appl. Mater. Interfaces 2011, 3, 2557–2563. [Google Scholar] [CrossRef] [PubMed]
  22. Ye, Z.; Lin, L.; Tan, Z.; Zeng, Y.; Ruan, S.; Ye, J. Sub-100 nm multi-shell bimetallic gap-enhanced Raman tags. Appl. Surf. Sci. 2019, 487, 1058–1067. [Google Scholar] [CrossRef]
  23. Han, Q.; Lu, Z.; Gao, W.; Wu, M.; Wang, Y.; Wang, Z.; Qi, J.; Dong, J. Three-dimensional AuAg alloy NPs/graphene/AuAg alloy NP sandwiched hybrid nanostructure for surface enhanced Raman scattering properties. J. Mater. Chem. C 2020, 8, 12599–12606. [Google Scholar] [CrossRef]
  24. Beyene, A.; Hwang, B.; Tegegne, W.; Wang, J.; Tsai, H.; Su, W. Reliable and sensitive detection of pancreatic cancer marker by gold nanoflower-based SERS mapping immunoassay. Microchem. J. 2020, 158, 8. [Google Scholar] [CrossRef]
  25. Wu, D.; Hu, M.; Zhang, Y.; Zhou, J.; Wang, Z. Long-range ordered silver nanoflower array structure for surface enhanced Raman scattering detecting. Appl. Surf. Sci. 2020, 505, 7. [Google Scholar] [CrossRef]
  26. Xu, Y.; Kutsanedzie, F.; Hassan, M.; Zhu, J.; Li, H.; Chen, Q. Functionalized hollow Au@Ag nanoflower SERS matrix for pesticide sensing in food. Sens. Actuator B—Chem. 2020, 324, 8. [Google Scholar] [CrossRef]
  27. Ha Pham, T.; Vu, X.; Dien, N.; Trang, T.; Van, T.; Tan, P.; Ca, N. The structural transition of bimetallic Ag–Au from core/shell to alloy and SERS application. RSC Adv. 2020, 10, 24577–24594. [Google Scholar] [CrossRef]
  28. Lin, Y.; Zhang, Y.; Yang, W.; Dong, J.; Fan, F.; Zhao, Y.; Bodappa, N.; Tian, X.; Yang, Z. Size and dimension dependent surface-enhanced Raman scattering properties of well-defined Ag nanocubes. Appl. Mater. Today 2019, 14, 224–232. [Google Scholar] [CrossRef]
  29. Zhu, X.; Wang, A.; Chen, S.; Luo, X.; Feng, J. Facile synthesis of AgPt@Ag core-shell nanoparticles as highly active surface-enhanced Raman scattering substrates. Sens. Actuators B Chem. 2018, 260, 945–952. [Google Scholar] [CrossRef]
  30. John, S.; Roy, S. CuO/Cu2O nanoflake/nanowire heterostructure photocathode with enhanced surface area for photoelectrochemical solar energy conversion. Appl. Surf. Sci. 2020, 509, 144703. [Google Scholar] [CrossRef]
  31. Kim, A.; Lim, H.; Lee, H.; Park, Y.; Kim, H. Large-area and cost-effective fabrication of Ag-coated polymeric nanopillar array for surface-enhanced Raman spectroscopy. Appl. Surf. Sci. 2018, 446, 114–121. [Google Scholar] [CrossRef]
  32. Liu, G.; Li, K.; Zhang, Y.; Du, J.; Ghafoor, S.; Lu, Y. A facile periodic porous Au nanoparticle array with high-density and built-in hotspots for SERS analysis. Appl. Surf. Sci. 2020, 527, 146807. [Google Scholar] [CrossRef]
  33. Wu, T.; Lin, Y.-W. Surface-enhanced Raman scattering active gold nanoparticle/nanohole arrays fabricated through electron beam lithography. Appl. Surf. Sci. 2018, 435, 1143–1149. [Google Scholar] [CrossRef]
  34. Zhao, X.; Zhu, A.; Wang, Y.; Zhang, Y.; Zhang, X. Sunflower-Like Nanostructure with Built-In Hotspots for Alpha-Fetoprotein Detection. Molecules 2021, 26, 1197. [Google Scholar] [CrossRef] [PubMed]
  35. Zhang, Y.; Yang, C.; Xiang, X.; Zhang, P.; Peng, Z.; Cao, Z.; Mu, Q.; Xuan, L. Highly effective surface-enhanced fluorescence substrates with roughened 3D flowerlike silver nanostructures fabricated in liquid crystalline phase. Appl. Surf. Sci. 2017, 401, 297–305. [Google Scholar] [CrossRef]
  36. Zhang, Y.; Yang, C.; Xue, B.; Peng, Z.; Cao, Z.; Mu, Q.; Xuan, L. Highly effective and chemically stable surface enhanced Raman scattering substrates with flower-like 3D Ag-Au hetero-nanostructures. Sci. Rep. 2018, 8, 898. [Google Scholar] [CrossRef] [Green Version]
  37. Chen, Q.; Shi, C.; Qin, L.; Kang, S.; Li, X. A low-cost 3D core-shell nanocomposite as ultrasensitive and stable surface enhanced Raman spectroscopy substrate. Sens. Actuators B Chem. 2021, 327, 128907. [Google Scholar] [CrossRef]
  38. Lopez-Lorente, A. Recent developments on gold nanostructures for surface enhanced Raman spectroscopy: Particle shape, substrates and analytical applications. A review. Anal. Chim. Acta 2021, 1168, 338474. [Google Scholar] [CrossRef] [PubMed]
  39. Guillot, N.; de la Chapelle, M. The electromagnetic effect in surface enhanced Raman scattering: Enhancement optimization using precisely controlled nanostructures. J. Quant. Spectrosc. Radiat. Transf. 2012, 113, 2321–2333. [Google Scholar] [CrossRef]
  40. Israelsen, N.; Hanson, C.; Vargis, E. Nanoparticle properties and synthesis effects on surface-enhanced Raman scattering enhancement factor: An introduction. Sci. World J. 2015, 2015, 124582. [Google Scholar] [CrossRef] [Green Version]
  41. Dies, H.; Nosrati, R.; Raveendran, J.; Escobedo, C.; Docoslis, A. SERS-from-scratch: An electric field-guided nanoparticle assembly method for cleanroom-free and low-cost preparation of surface-enhanced Raman scattering substrates. Colloids Surf. A Physicochem. Eng. Asp. 2018, 553, 695–702. [Google Scholar] [CrossRef]
  42. Lu, H.; Jin, M.; Ma, Q.; Yan, Z.; Liu, Z.; Wang, X.; Akinoglu, E.; Van, D.; Zhou, G.; Shui, L. Ag nano-assemblies on Si surface via CTAB-assisted galvanic reaction for sensitive and reliable surface-enhanced Raman scattering detection. Sens. Actuators B Chem. 2020, 304, 127224. [Google Scholar] [CrossRef]
  43. Roy, A.; Chini, T.; Satpati, B. A simple method of growing endotaxial silver nanostructures on silicon for applications in surface enhanced Raman scattering (SERS). Appl. Surf. Sci. 2020, 501, 144225. [Google Scholar] [CrossRef]
Figure 1. Diagram of a Raman spectrometer: (a) Optical setup; (b) Different laser focused positions on the SERS substrate.
Molecules 26 06522 g001
Figure 2. (a) Growth of flower-like silver nanostructures and (b) experimental equipment for electrodeposition.
Molecules 26 06522 g002
Figure 3. Pictures for duty cycle calculation: (a) Laser is turned on and (b) off; (c) Binarized image; (d) Testing area.
Molecules 26 06522 g003
Figure 4. Calculation flow chart of duty cycles.
Molecules 26 06522 g004
Figure 5. (a) Fabricated SERS substrate. (bd) SEM images of the silver flower-like nanostructures in three different positions (scale bar 10 μm).
Molecules 26 06522 g005
Figure 6. Tested Raman spectra of R6G: (a) Silicon wafer and (b) SERS substrate.
Molecules 26 06522 g006
Figure 7. Measured and binarized images of substrate A for duty cycle calculation with 40 μm laser spots.
Molecules 26 06522 g007
Figure 8. R6G Raman spectra of substrate A with different duty cycles: (ac) 10, 20 and 40 μm spot sizes.
Molecules 26 06522 g008
Figure 9. Normalized spectral intensity (a) and regular residual (b) of substrate A as functions of duty cycle, and the normalized spectral intensity of substrate B (c): ■, ● and ▲ represent the measured discrete data for 10, 20 and 40 μm laser spots, respectively; the real line denotes the fitted curve; the residual data is represented by ★.
Molecules 26 06522 g009
Figure 10. Calculated enhancement factor of substrate A: ■, ● and ▲ represent the measured discrete data for 10, 20 and 40 μm laser spots, respectively; the real line denotes the fitted curve.
Molecules 26 06522 g010
Publisher’s Note: MDPI stays neutral with regard to jurisdictional claims in published maps and institutional affiliations.

