Article

Identification of Volatile Compounds in Blackcurrant Berries: Differences among Cultivars

by
Sandy Pagès-Hélary
1,
Laurence Dujourdy
2 and
Nathalie Cayot
1,*
1
AgroSup Dijon, Université Bourgogne Franche-Comté, PAM UMR A 02.102, F-21000 Dijon, France
2
Agrosup Dijon, Service d’Appui à la Recherche en Science des Données, F-21000 Dijon, France
*
Author to whom correspondence should be addressed.
Molecules 2021, 26(20), 6254; https://doi.org/10.3390/molecules26206254
Submission received: 17 September 2021 / Revised: 7 October 2021 / Accepted: 8 October 2021 / Published: 15 October 2021

Abstract

:
Berries of blackcurrant are known to produce a strong flavor. Some previous studies have reported that a given cultivar of blackcurrant can produce berries with a specific profile of volatile compounds. For the Burgundy region in France, the Noir de Bourgogne cultivar is especially important because it is the main ingredient of a liquor with a designation of origin. The aim of the present study was to characterize the volatile fractions of berries from 15 cultivars in order to explore the possibility of using different cultivars for liquor production. The plants were cultivated under the same conditions and harvested in the same year. The volatile fractions of the harvested berries were analyzed using HS-SPME-GC-MS. Thorough univariate statistical analysis and multivariate analysis were applied to the dataset, which made it possible to identify groups within cultivars. The Rosenthal cultivar exhibited a quite flat profile; the Lositkia, Ben Tiran, and Barchatnaia cultivars shared common features; the Noir de Bourgogne cultivar showed the highest amounts of molecules such as 3-carene, limonene, β-phellandrene, ocimene, α-terpinolene, and bicyclogermacrene. None of the studied varieties were close to the Noir de Bourgogne on the basis of VOC analysis.

1. Introduction

Blackcurrant berries (Ribes nigrum L.) are cultivated in different countries around the world for diverse uses; for instance, as perfumes, jams, or juices or as coloring matter or an ingredient for alcoholic beverages [1]. In France, blackcurrant is mainly cultivated in four different areas: Val de Loire, Oise, Vallée du Rhône, and Burgundy. For the Burgundy region, blackcurrant is especially important because it is the main ingredient of blackcurrant liquor, which is an emblem of this area. The liquors cassis de Dijon and cassis de Bourgogne both hold designations of origin. In order to get these designations of origin [2,3], liquors have to be produced mainly from the Noir de Bourgogne cultivar, which is responsible for the special taste of these liquors.
The particular organoleptic quality of the Noir de Bourgogne cultivar is empirically well-known but there are limited data in the literature to demonstrate this, except for the publication by Latrasse et al. [4].
In fact, Latrasse et al. [4] studied the volatiles of a blackcurrant juice distilled under vacuum and of hydro-alcoholic infusions. They reported that the Noir de Bourgogne cultivar was particularly rich in diacetyle, ethyl butyrate, and eucalyptol. No other data have been further reported for this cultivar. The more recent studies have been published on other cultivars used throughout the world; for example, the Brödtrop cultivar was used in the study by Liu et al. [5] and found to be characterized mainly by ethyl acetate, aromadendrene, p-cymen-8-ol, 3-methyl-1-butanol, and cis-3-hexen-1-ol. The cultivars Mortti, Ola, and Melahati were used in the study by Marsoll-Vall et al. [6], who reported monoterpene hydrocarbons and oxygenated monoterpenes as the major classes of volatiles.
The volatile fraction of blackcurrant berries is known as being sensitive to the cultivar, but it is also influenced by the climate, the area of growth, and processes like freezing or juice extraction [7]. Therefore, great attention should be paid to these parameters and to experimental conditions when comparing the volatile fractions of different cultivars.
The present study focused on the volatile fraction of blackcurrant berries from different cultivars, including Noir de Bourgogne. The aim was to characterize the volatile fractions and compare them to that of the Noir de Bourgogne cultivar in order to explore the possibility of using other cultivars for the liquor production. The substitution would be possible if a cultivar showed organoleptic qualities close to those of Noir de Bourgogne and better resistance to pests and climate changes.
The similarities and differences among the volatile fractions of the blackcurrant berries from fifteen different cultivars (including Noir de Bourgogne), cultivated under the same conditions (same area, same treatment, etc.) and harvested in the same year, were studied. Odorant molecules from all the different berries were collected and identified using HS-SPME coupled with GC-MS. The whole dataset was analyzed with different statistical methods in order to determine differences. The objective was to obtain chemical profiles for the volatile organic compounds (VOC) of the blackcurrant berries of the different cultivars.

2. Results and Discussion

2.1. Volatile Compounds Representative of the 15 Cultivars

Molecules detected and identified in the headspace for the berries from the 15 cultivars are listed in Table 1.
Only three compounds were badly chromatographed due to co-elution, but identification was reliably achieved by probability-based matching with mass spectra in an MS library:
  • For retention index 1203, the peak was attributed to β-phellandrene;
  • For retention index 1256, the peak was attributed to ocimene;
  • For retention index 1622, the peak was attributed to aromadendrene.
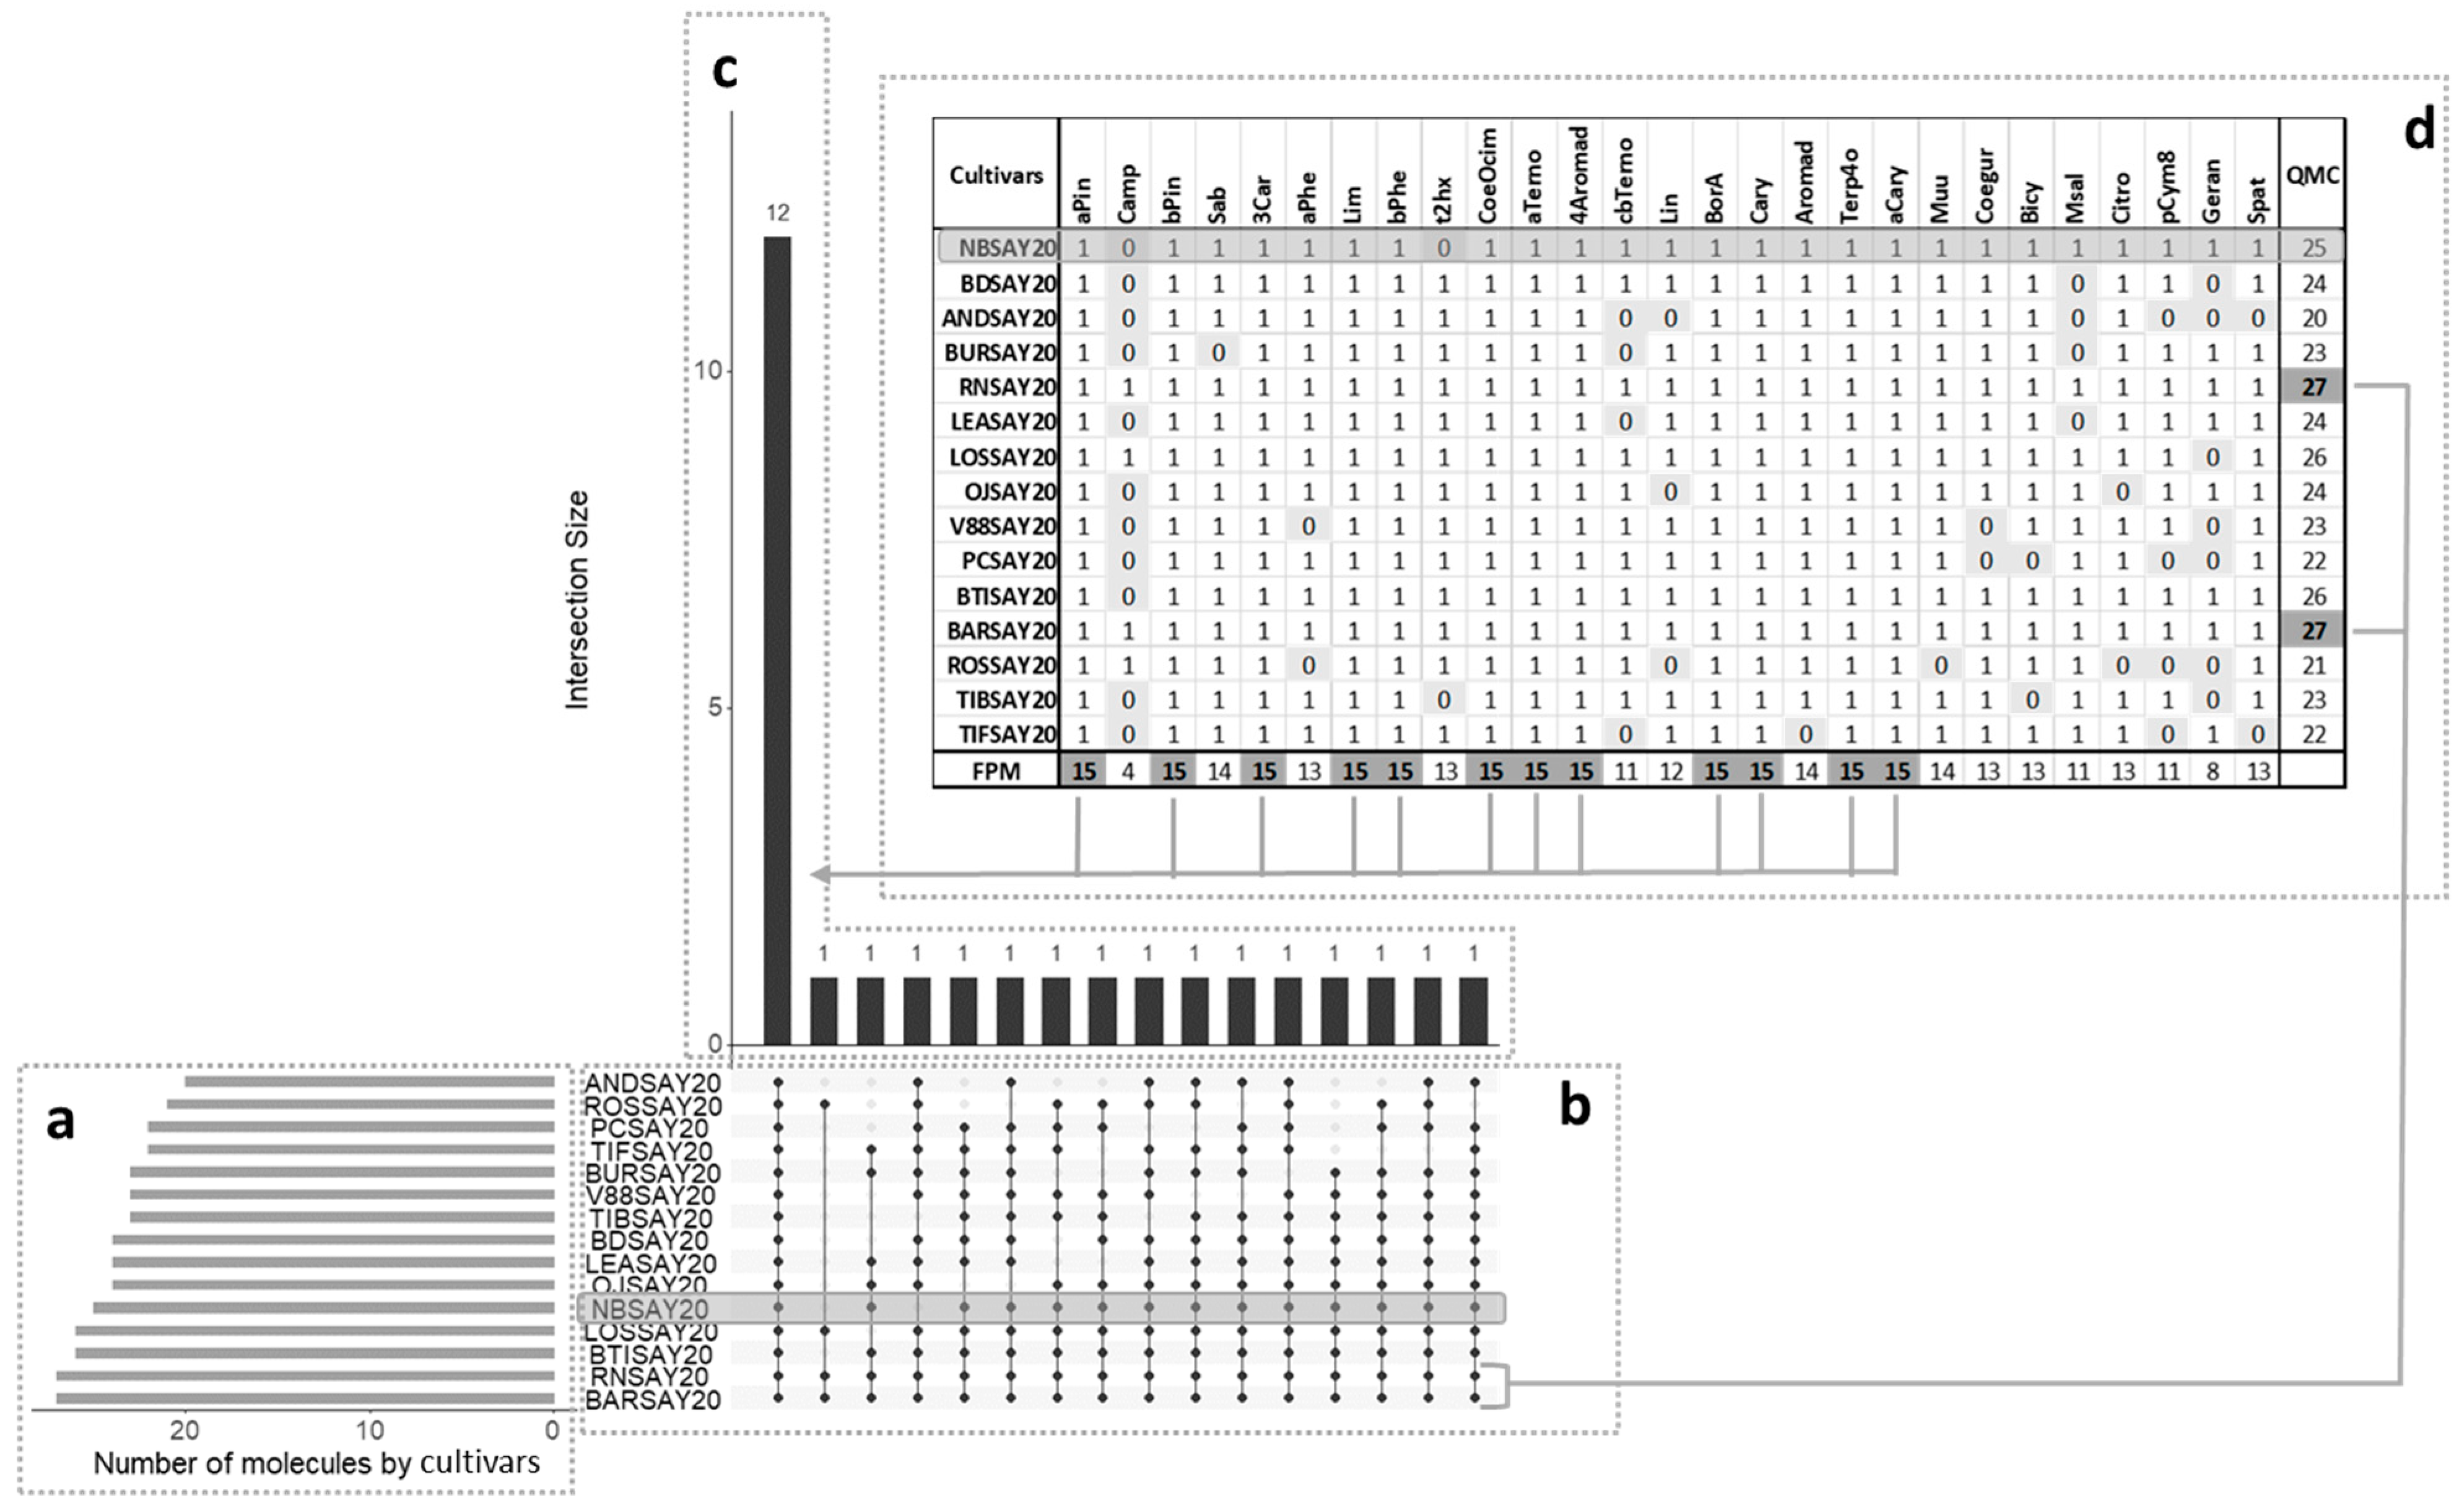
Additionally, three compounds could not be identified and were named NI1, NI2, and NI3 (respectively, retention indexes 1162, 1587, and 1825).
Other than these volatiles, 31 compounds were clearly identified, among which 26 were already reported in the scientific literature. Thus, 34 compounds were retained, which are reported in Table 1.
The profiles for volatile compounds varied greatly among the different cultivars, and they could be used to associate a specific odor with the corresponding berries.
For example, Figure 1 shows the mean of the normalized abundance of the 34 targeted compounds for four cultivars showing very different profiles, among which is Noir de Bourgogne (NBSAY20). Limonene, β-phellandrene, ocimene and bicyclogermacrene were more abundant in Noir de Bourgogne than in the three other cultivars. Descriptors were taken from www.thegoodscentscompany.com and www.pherobase.com, (accessed on 17 September 2021). The odor descriptors of these compounds were respectively citrus, mint/herbal, floral, and green/woody/weedy. The chemical profile for the Ben Tiran (BTISAY20) cultivar had the highest abundances of α-terpinolene, caryophyllene, α-cayophyllene, germacrene D, and citronellol. The odor descriptors of these compounds were respectively woody/pine/citrus, woody/clove, woody, wood/spice, and floral/rose bud/citrus.
In contrast, the VOC profiles of the Barchatnaia (BARSAY20) and Lositkia (LOSSAY20) cultivars were quite flat except for sabinene, described as woody/citrus/pine/spice.

2.2. Data Sorting

From the chromatographic study, a dataset with 45 observations (15 cultivars × 3 replicates) and 34 variables (peak areas of detected volatile compounds) was obtained.
Prior to the establishment of a GC volatile fingerprint, the reproducibility of the peak areas was checked using the relative standard deviation (RSD). This was calculated from triplicates by multiplying the standard deviation by 100 and dividing by the mean value of the peak areas (given in Table 1).
Two types of RSD were calculated and named RSD “between” and RSD “within”.
The RSD “between” corresponded to the variation coefficient between different cultivars. It made it possible to determine whether there were huge or small differences between cultivars for each volatile compound.
The RSD “within” corresponded to the variation coefficient between replicates of a given sample (=cultivar) for each molecule. It made it possible to determine whether the peak area of a given molecule was repeatable or not. These calculations helped to target molecules that were “stable” when similar chemical profiles were analyzed.
The RSD provided information on the extent of variation of a compound. The rarity of compounds, calculated using the frequency of appearance (presence or absence in the samples) in a dataset, made it possible to evaluate discriminating power. Indeed, if a compound was present only in a particular cultivar then it was considered typical of this cultivar (Table 1).
The RSD “within” and RSD “between” are reported in Table 2 for each compound and each cultivar. The extent of variation in a peak area (characterizing its stability) was based on the following assumption. On one hand, the variability within the peak area was considered high if the RSD “within” was above 40%. This number was chosen because of the complex matrix and the difficulty of integrating the peak. It meant that the chromatography of the compound was not reproducible. With such an assumption, ethanol, methyl butanoate, and ethyl butanoate were eliminated from the list of target compounds.
On the other hand, if the RSD “between” was below 70% (chosen for the same reason as for the RSD “within”), this meant that the compound did not vary sufficiently between samples to be able to differentiate them by cultivar. With such a rule, camphene, α-phellandrene, NI1, hexanol, NI3, and p-cymen-8-ol were eliminated. In parallel, we checked that there were no outliers. The RSD “between” values were examined in conjunction with the frequency of the appearance of target compounds between different samples. If a peak was rarely present and its area had a high variability, the compound was considered as discriminant. For example, camphene had a low appearance frequency (33%), an RSD “within” far lower than the limit (18), and an RSD “between” value of 69. Therefore, it was kept in the list of target molecules. At the end of this stage, we decided to eliminate only five molecules: ethanol, methyl butanoate, ethyl butanoate, NI1, and hexanol.
Then, chemical profiles of cultivars were obtained with 29 target molecules and an exploratory statistical study was implemented. In order to further reduce this number of target compounds, an initial PCA was undertaken, and γ-elemene and NI3 could be eliminated. We also checked that these compounds had tangent RSD values.
Finally, descriptive analysis (univariate and multivariate) was implemented with the 27 remaining target compounds.

2.3. Differences among Cultivars Using Univariate Descriptive Analysis

Data visualization was used to find patterns within complex datasets with many features. An UpSet plot (Figure 2) [17] was used to group data points that had many of the same values across different features together and find the largest intersecting sets. The plot has several parts.
The central bar chart (Figure 2a) shows the number of compounds in the data that were held in common in the cultivars. Each bar indicates a different combination. Underneath the bar chart, a graphical table (Figure 2b) shows which cultivars the different combinations of compounds concerned. Each row indicates one of the fifteen cultivars. The black dots and lines show the combinations of cultivars that made up subsets of compounds. Reading from left to right, all cultivars had 12 compounds in common. The corresponding compounds are in the table above the bar chart (Figure 2c). The molecules showing a frequency of presence of molecule (FPM) of 15 in a cultivar were the ones present in all cultivars: α-pinene, β-pinene, 3-carene, limonene, β-phellandrene, ocimene, α-terpinene, 4-aromadendrene, bornyl acetate, caryophyllene, aromadendrene, and α-caryophyllene. The smaller bar chart (Figure 2d) shows the unconditional frequency count (quantity of molecules (QMC)) of each cultivar across all subsets. It can be observed that the highest value corresponded to the Royal de Naples and the Barchatnaia cultivars, which had all the target compounds, and the lowest value was that of the Andega cultivar with 20 compounds. The Noir de Bourgogne cultivar had 25 compounds, including 12 in common with the other cultivars. All the other compounds of the Noir de Bourgogne cultivar were also found in at least seven other cultivars in the present study. The Noir de Bourgogne cultivar presented a medium number of molecules compared to the other cultivars and was not characterized by specific molecules.
A two-dimensional table plot [18] with a proportional circles for the peak area of each compound is shown in Figure 3a (raw data). Missing values were replaced by the detection limit value, set to 50,000 (corresponding to 100,000 divided by 2 g of sample).
The cultivars Noir de Bourgogne and Ben Tiran presented compounds with larger circles than other cultivars. Some molecules were more intense for the Noir de Bourgogne cultivar: 3-carene, limonene, β-phellandrene, ocimene, NI2, and bicyclogermacrene. Figure 3b presents the chemical profile of the Noir de Bourgogne cultivar with relative abundances indicated by the circles. This figure underlines the importance of 3-carene, ocimene, and α-terpinolene in the fingerprint of the Noir de Bourgogne cultivar.

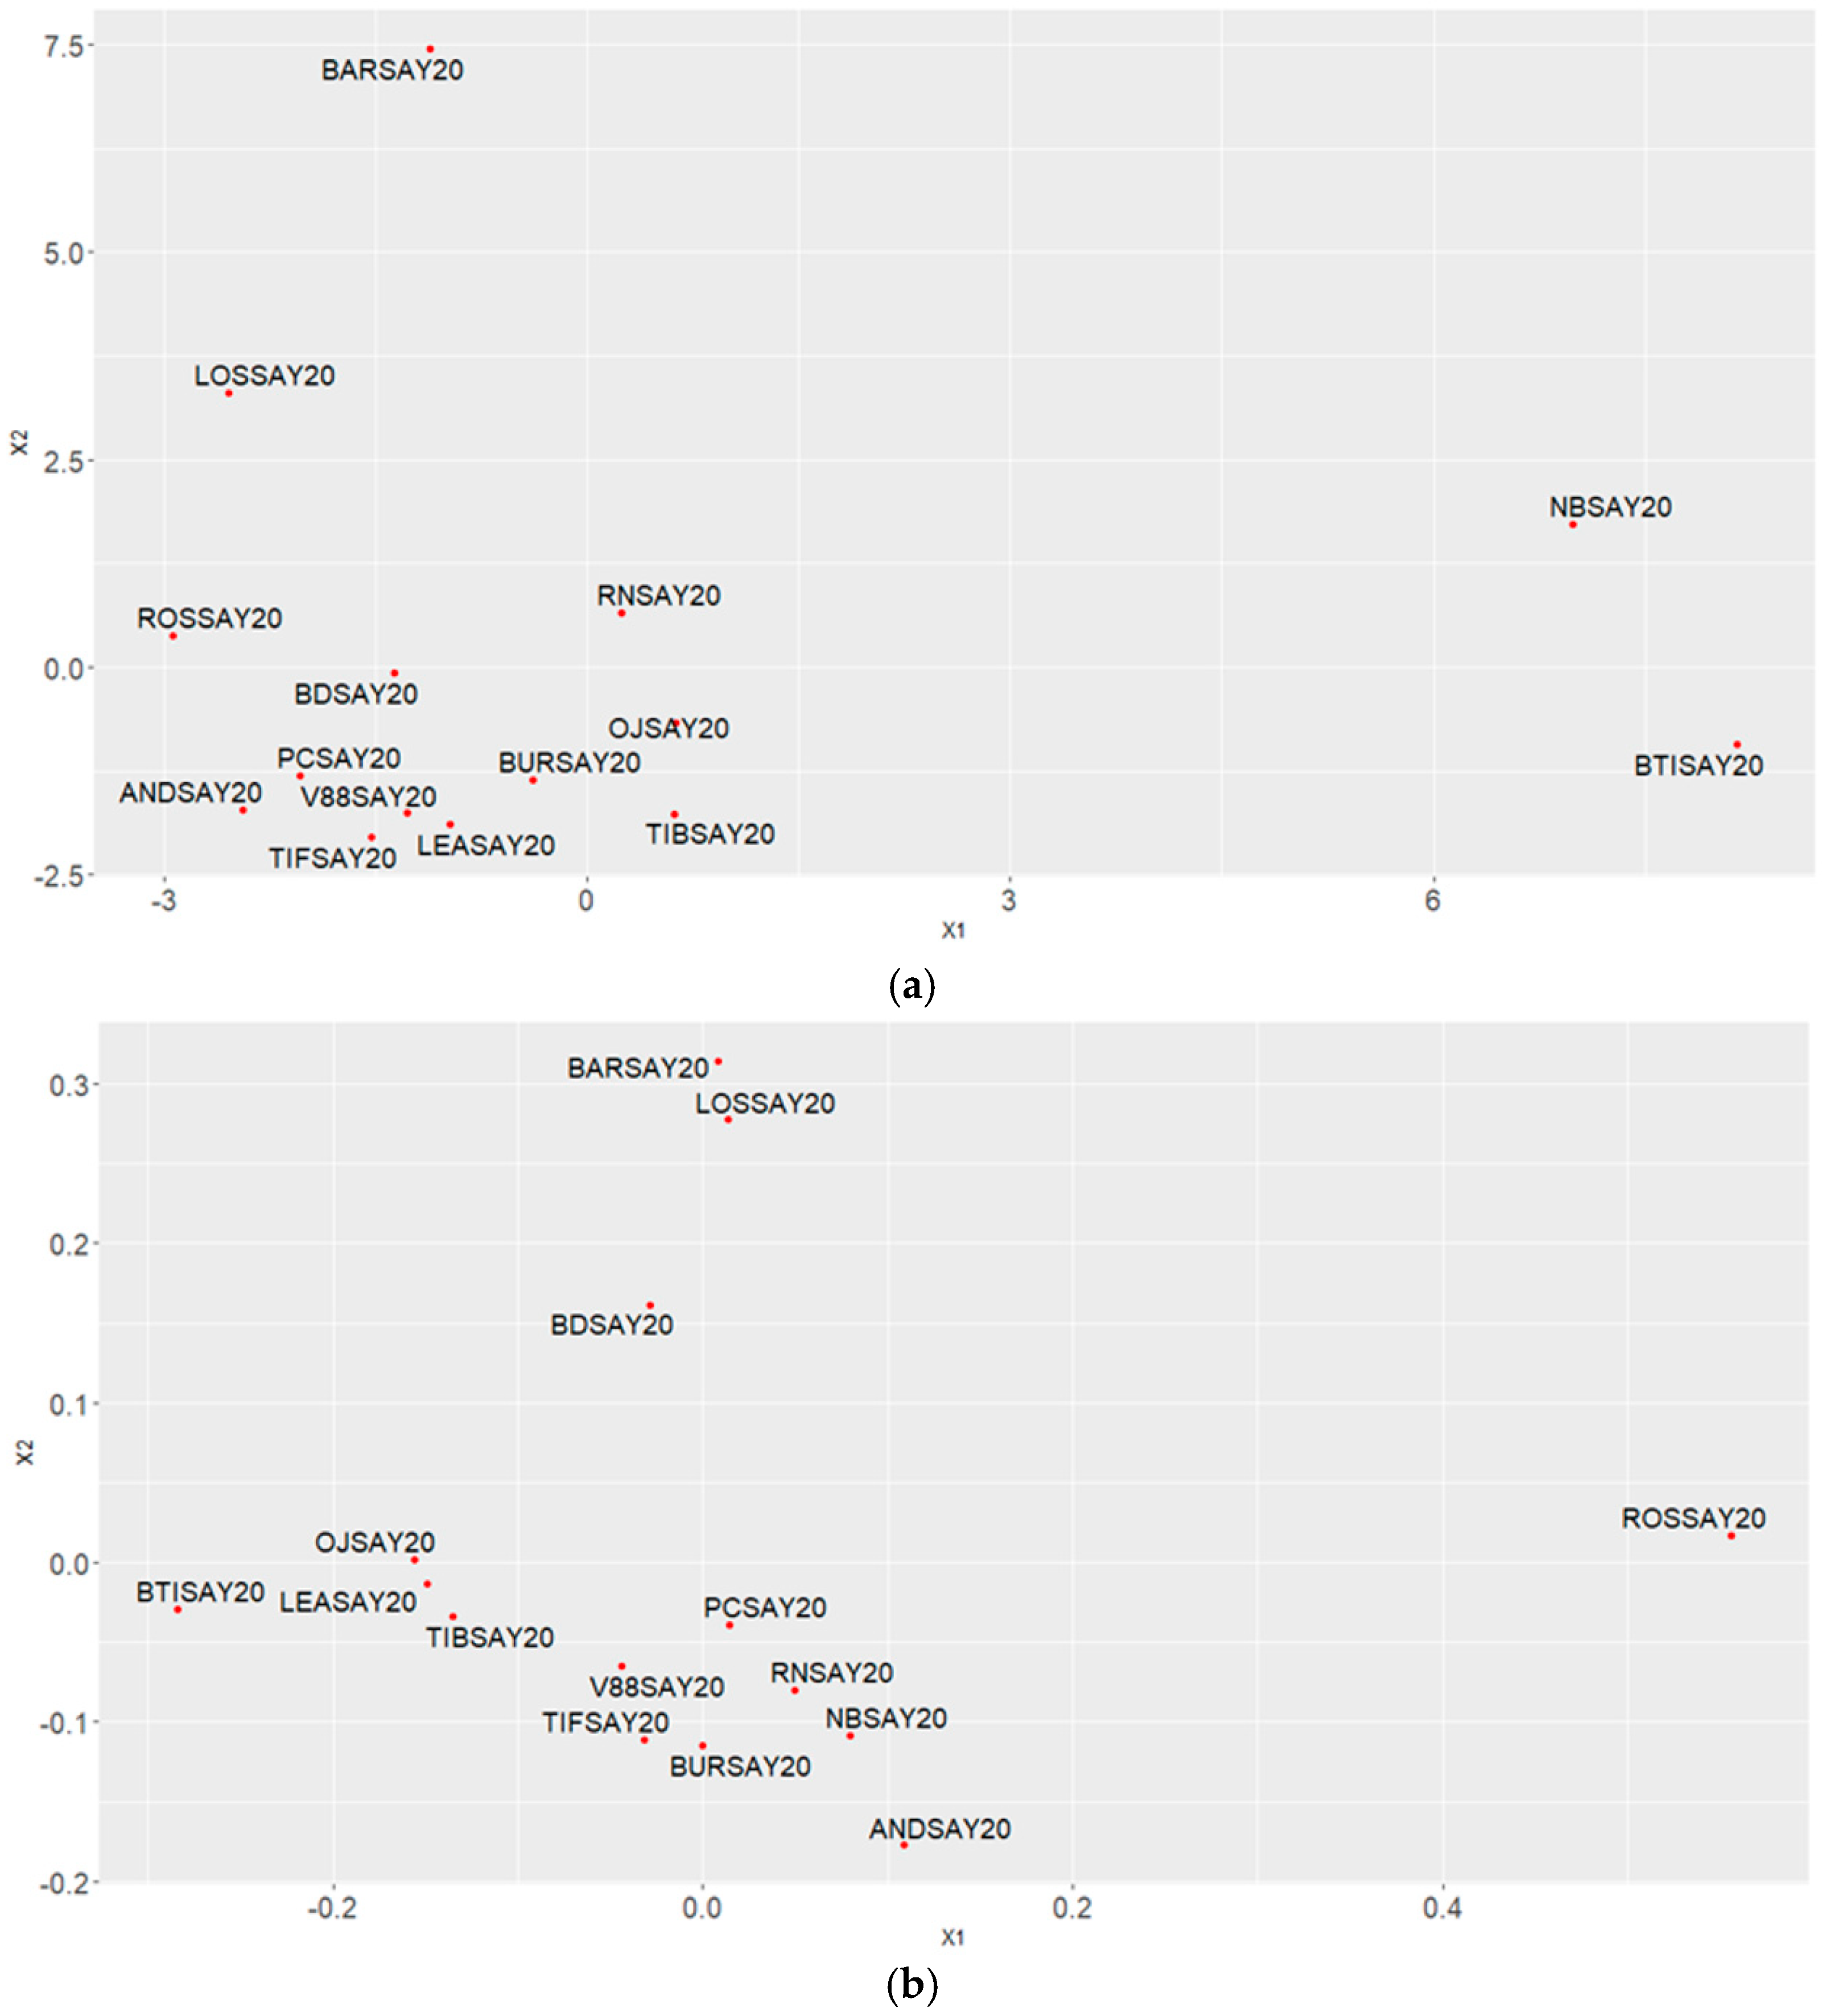
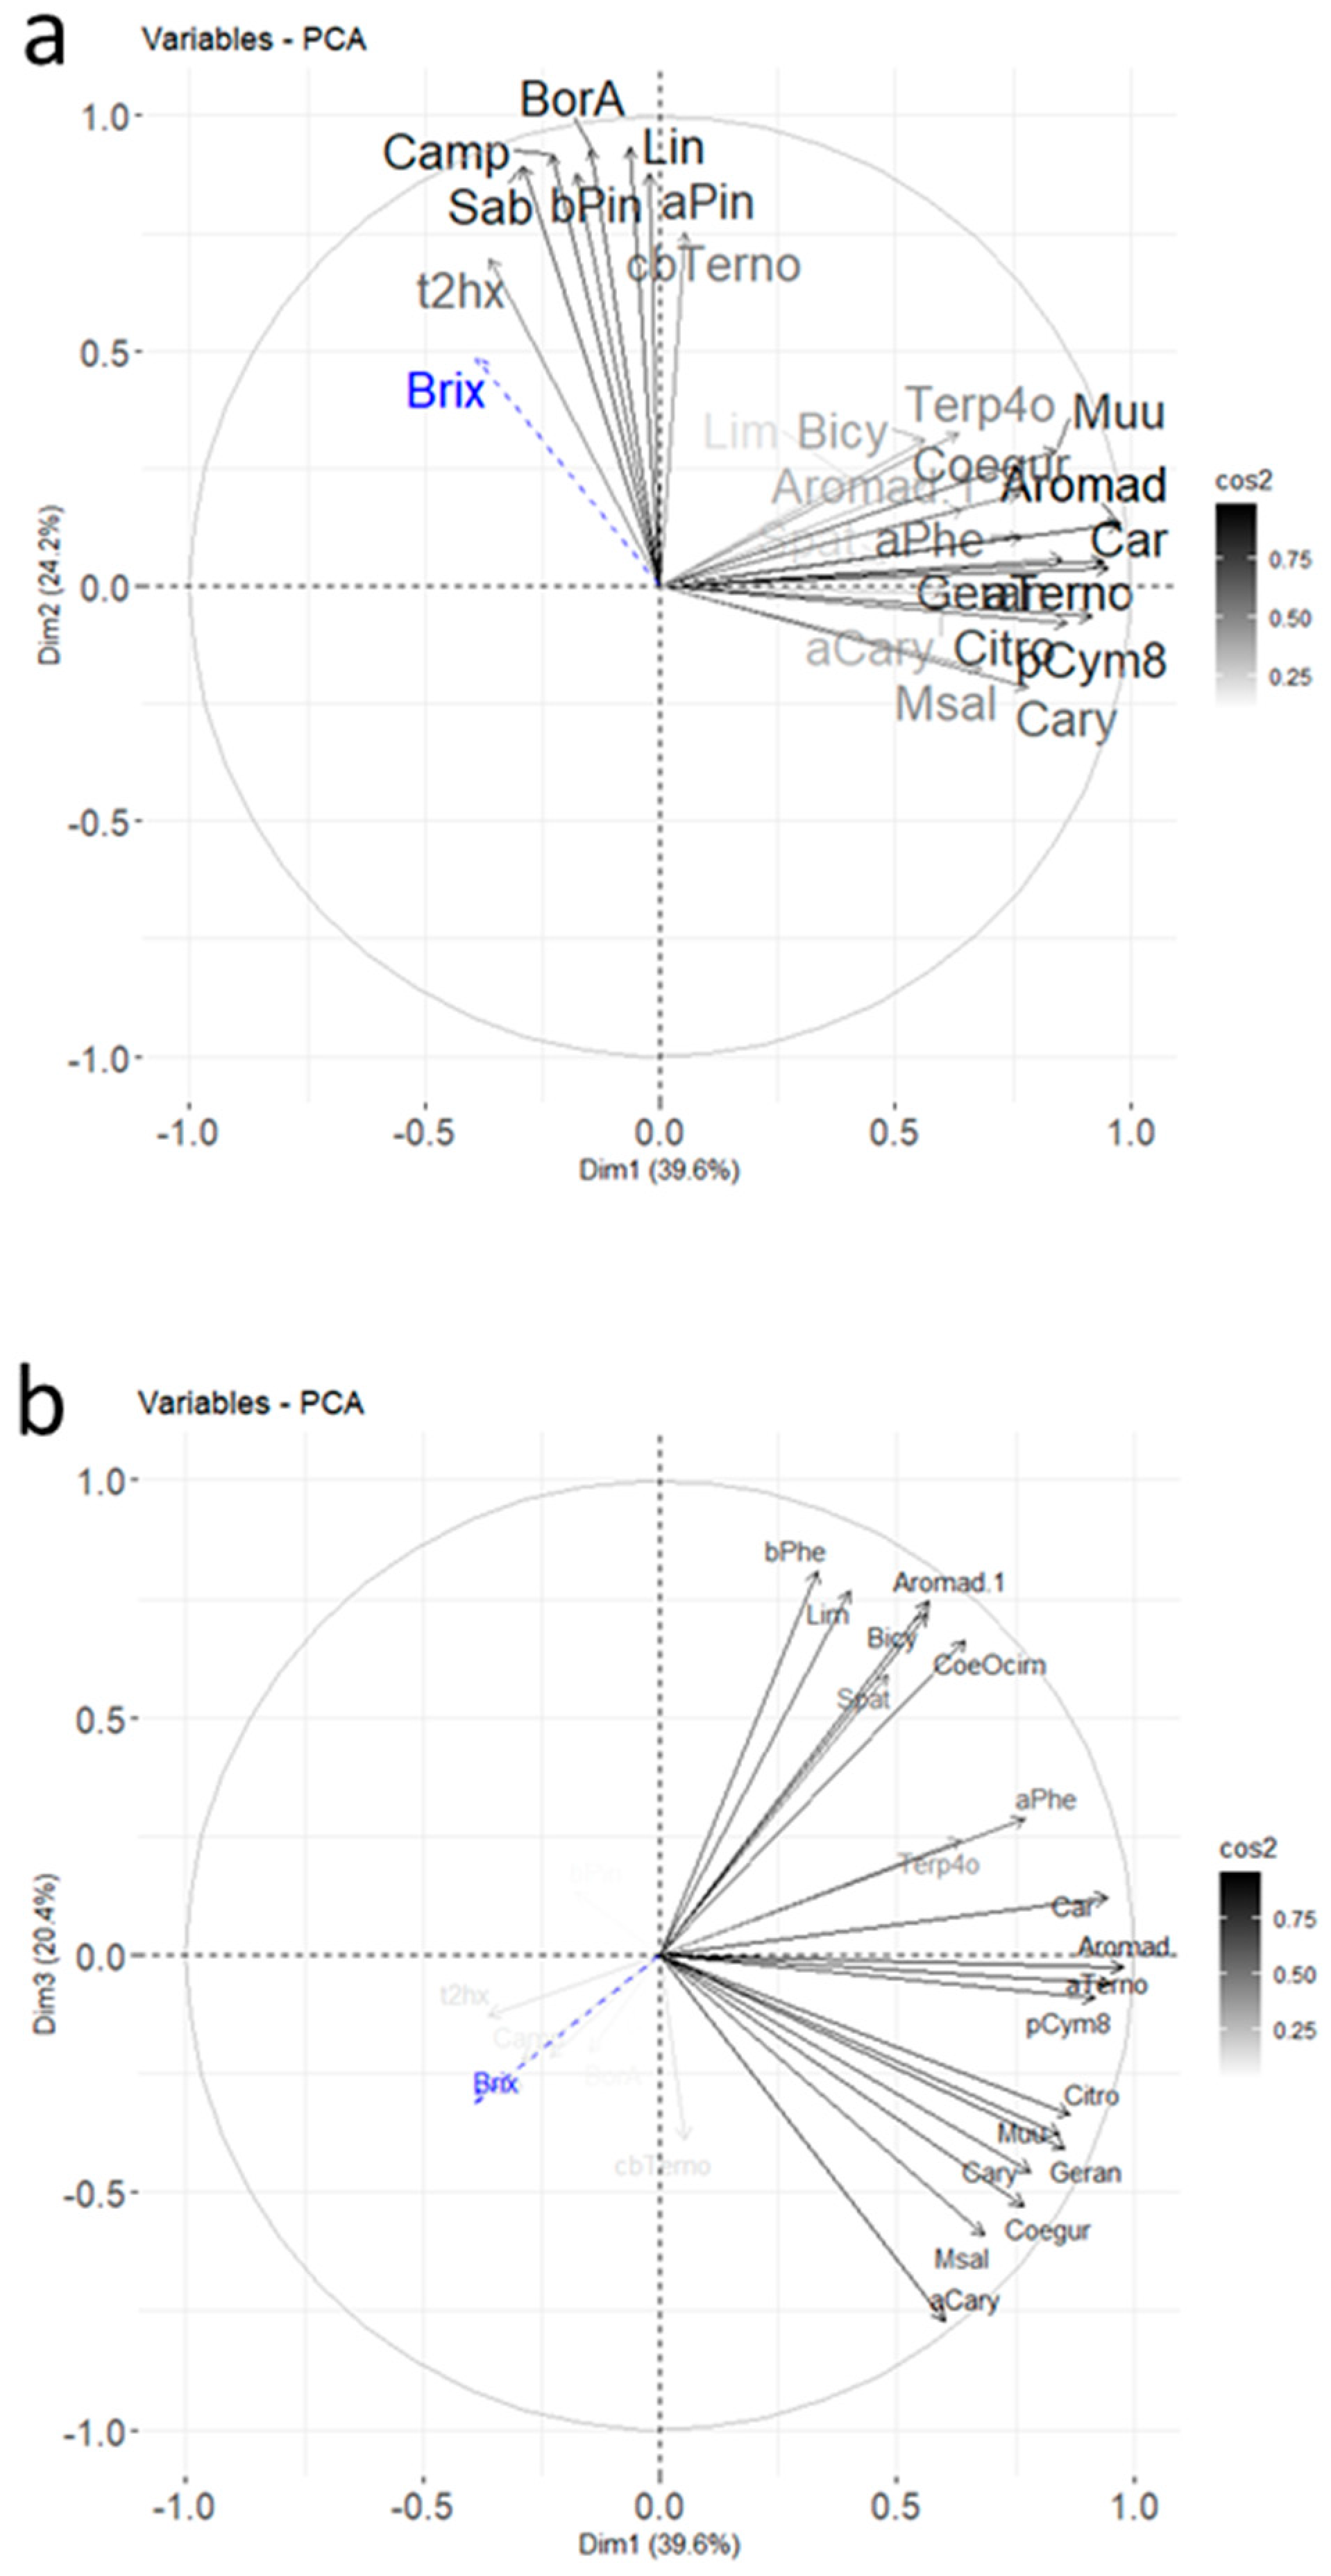
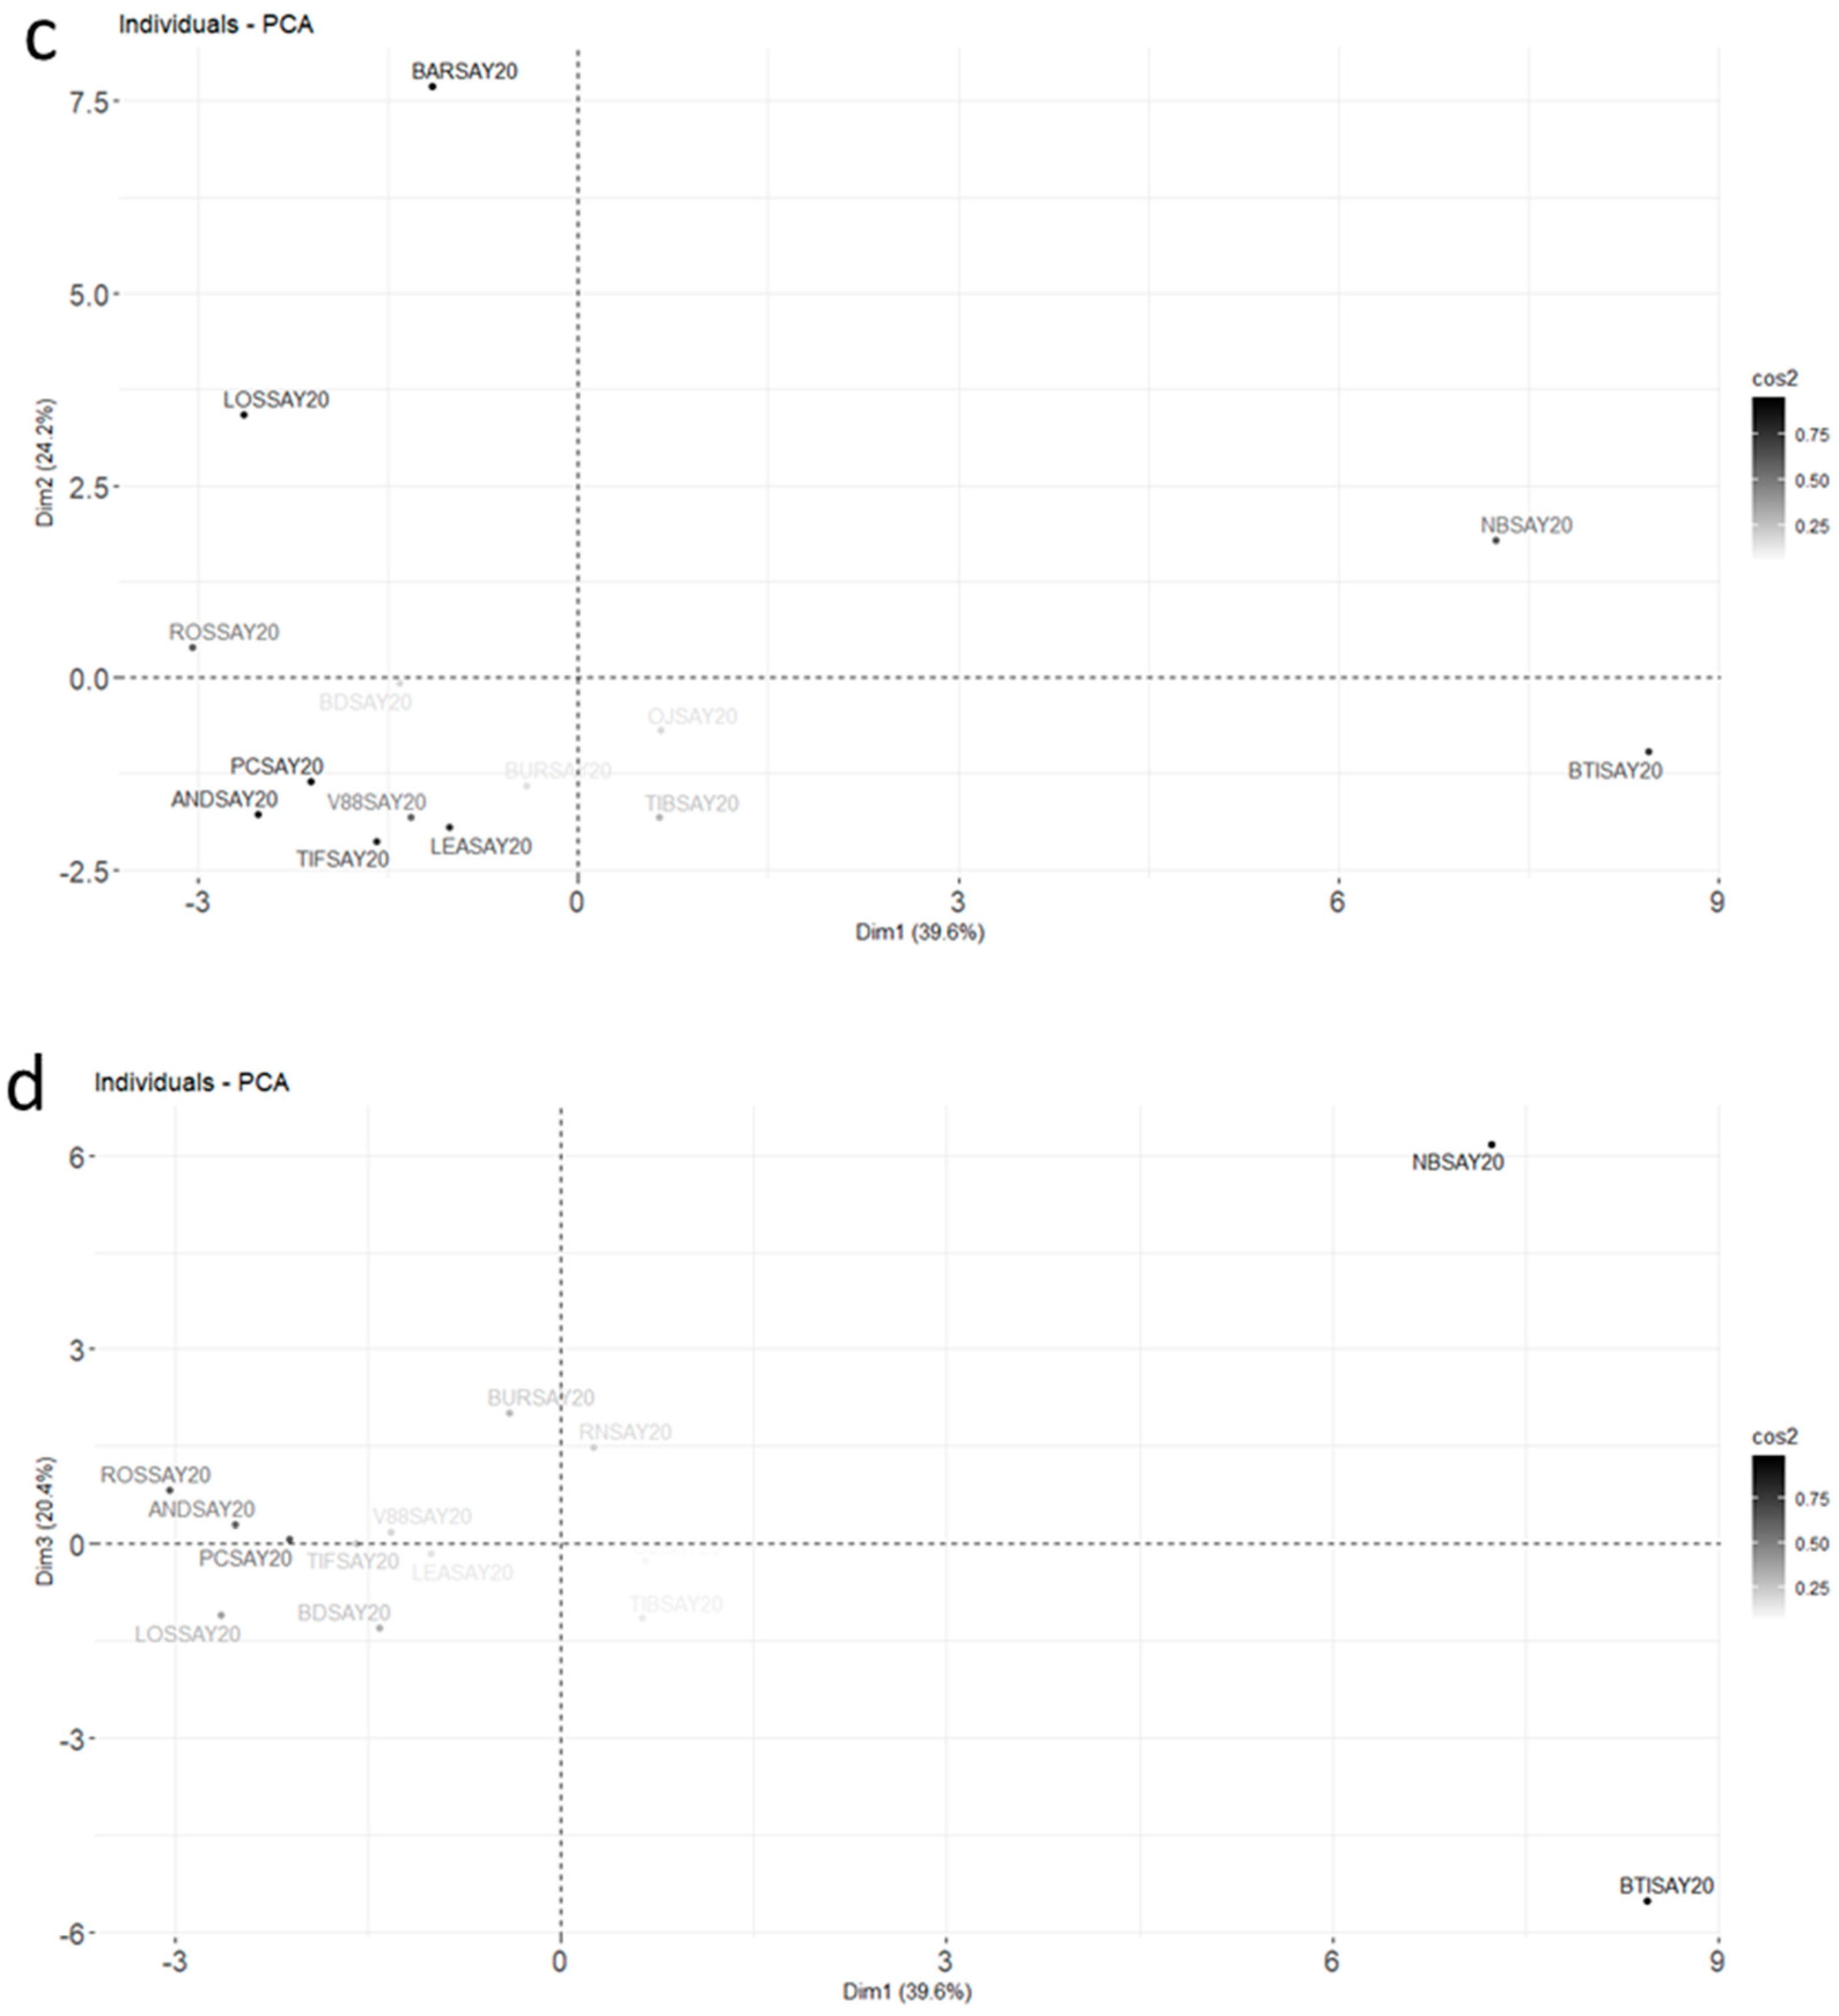
2.4. Differences among Cultivars Using Multivariate Descriptive Analysis

In order to explore in more depth the chemical profiles and determine the existence of specific groups, we first used principal components analysis (PCA) on normalized data (each peak area was divided by the sum of the areas of all peaks), as a flexible tool. The values for the total soluble solids (°Brix) of the blackcurrant berries, which were not obtained from the GC-MS analysis, were added as additional data (Appendix A) in order to visualize the relationship of this variable with the set of active variables via the factorial axes.
The PCA with correlations and a mapping of molecules and cultivars is shown in Figure 4.
Three dimensions accounted for 80.7% of the total variance. The contributions for the different molecules highlighted in Figure 3 for the Noir de Bourgogne cultivar were checked: limonene was well-represented in dimension 2, and 3-carene and α-terpinolene were well-represented in dimension 1. Ocimene, NI2, and bicyclogermacrene were well-represented in the plan Dim 1–Dim 3. The Brix degree had a poor representation; its impact was low compared to the blackcurrant composition in volatiles. It did not explain the differences observed between varieties of blackcurrant by itself.
Different groups of cultivars could be observed in the Dim 1–Dim 2 plan. The Barchatnaia, Lositkia, and Ben Tiran cultivars formed three independent groups. In the Dim 1–Dim 3 plan, the Noir de Bourgogne and Ben Tiran cultivars were opposed on axis 3. Noir de Bourgogne was characterized by high peak areas for the group of variables comprising β-phellandrene, limonene, aromadendrene, bicyclogermacrene, and ocimene, while Ben Tiran had high peak areas for α-caryophyllene, germacrene D, and methyl salicylate. Noir de Bourgogne had a unique profile and no other cultivar could be grouped with it.
MDS was carried out using Euclidean distances (see Appendix A, Figure A1a) and a distance associated with a Pearson correlation coefficient d = 1 − cor (see Appendix A, Figure A1b). From the joint analysis of both graphs, we concluded that the Noir de Bourgogne cultivar was opposed to the Lositkia cultivar, and the Rosenthal cultivar was opposed to the Ben Tiran cultivar. Finally, the Barchatnaia and the Lositkia cultivars shared a common feature: high peak areas for Camphene, Sabinene, Linalool, and Bornyl Acetate.
The Lositkia, Ben Tiran, and Barchatnaia cultivars showed quite rich profiles (26 or 27 molecules) and had 25 molecules in common. Some of them were intense (high peak areas) and the Ben Tiran cultivar exhibited the most intense profile.

3. Materials and Methods

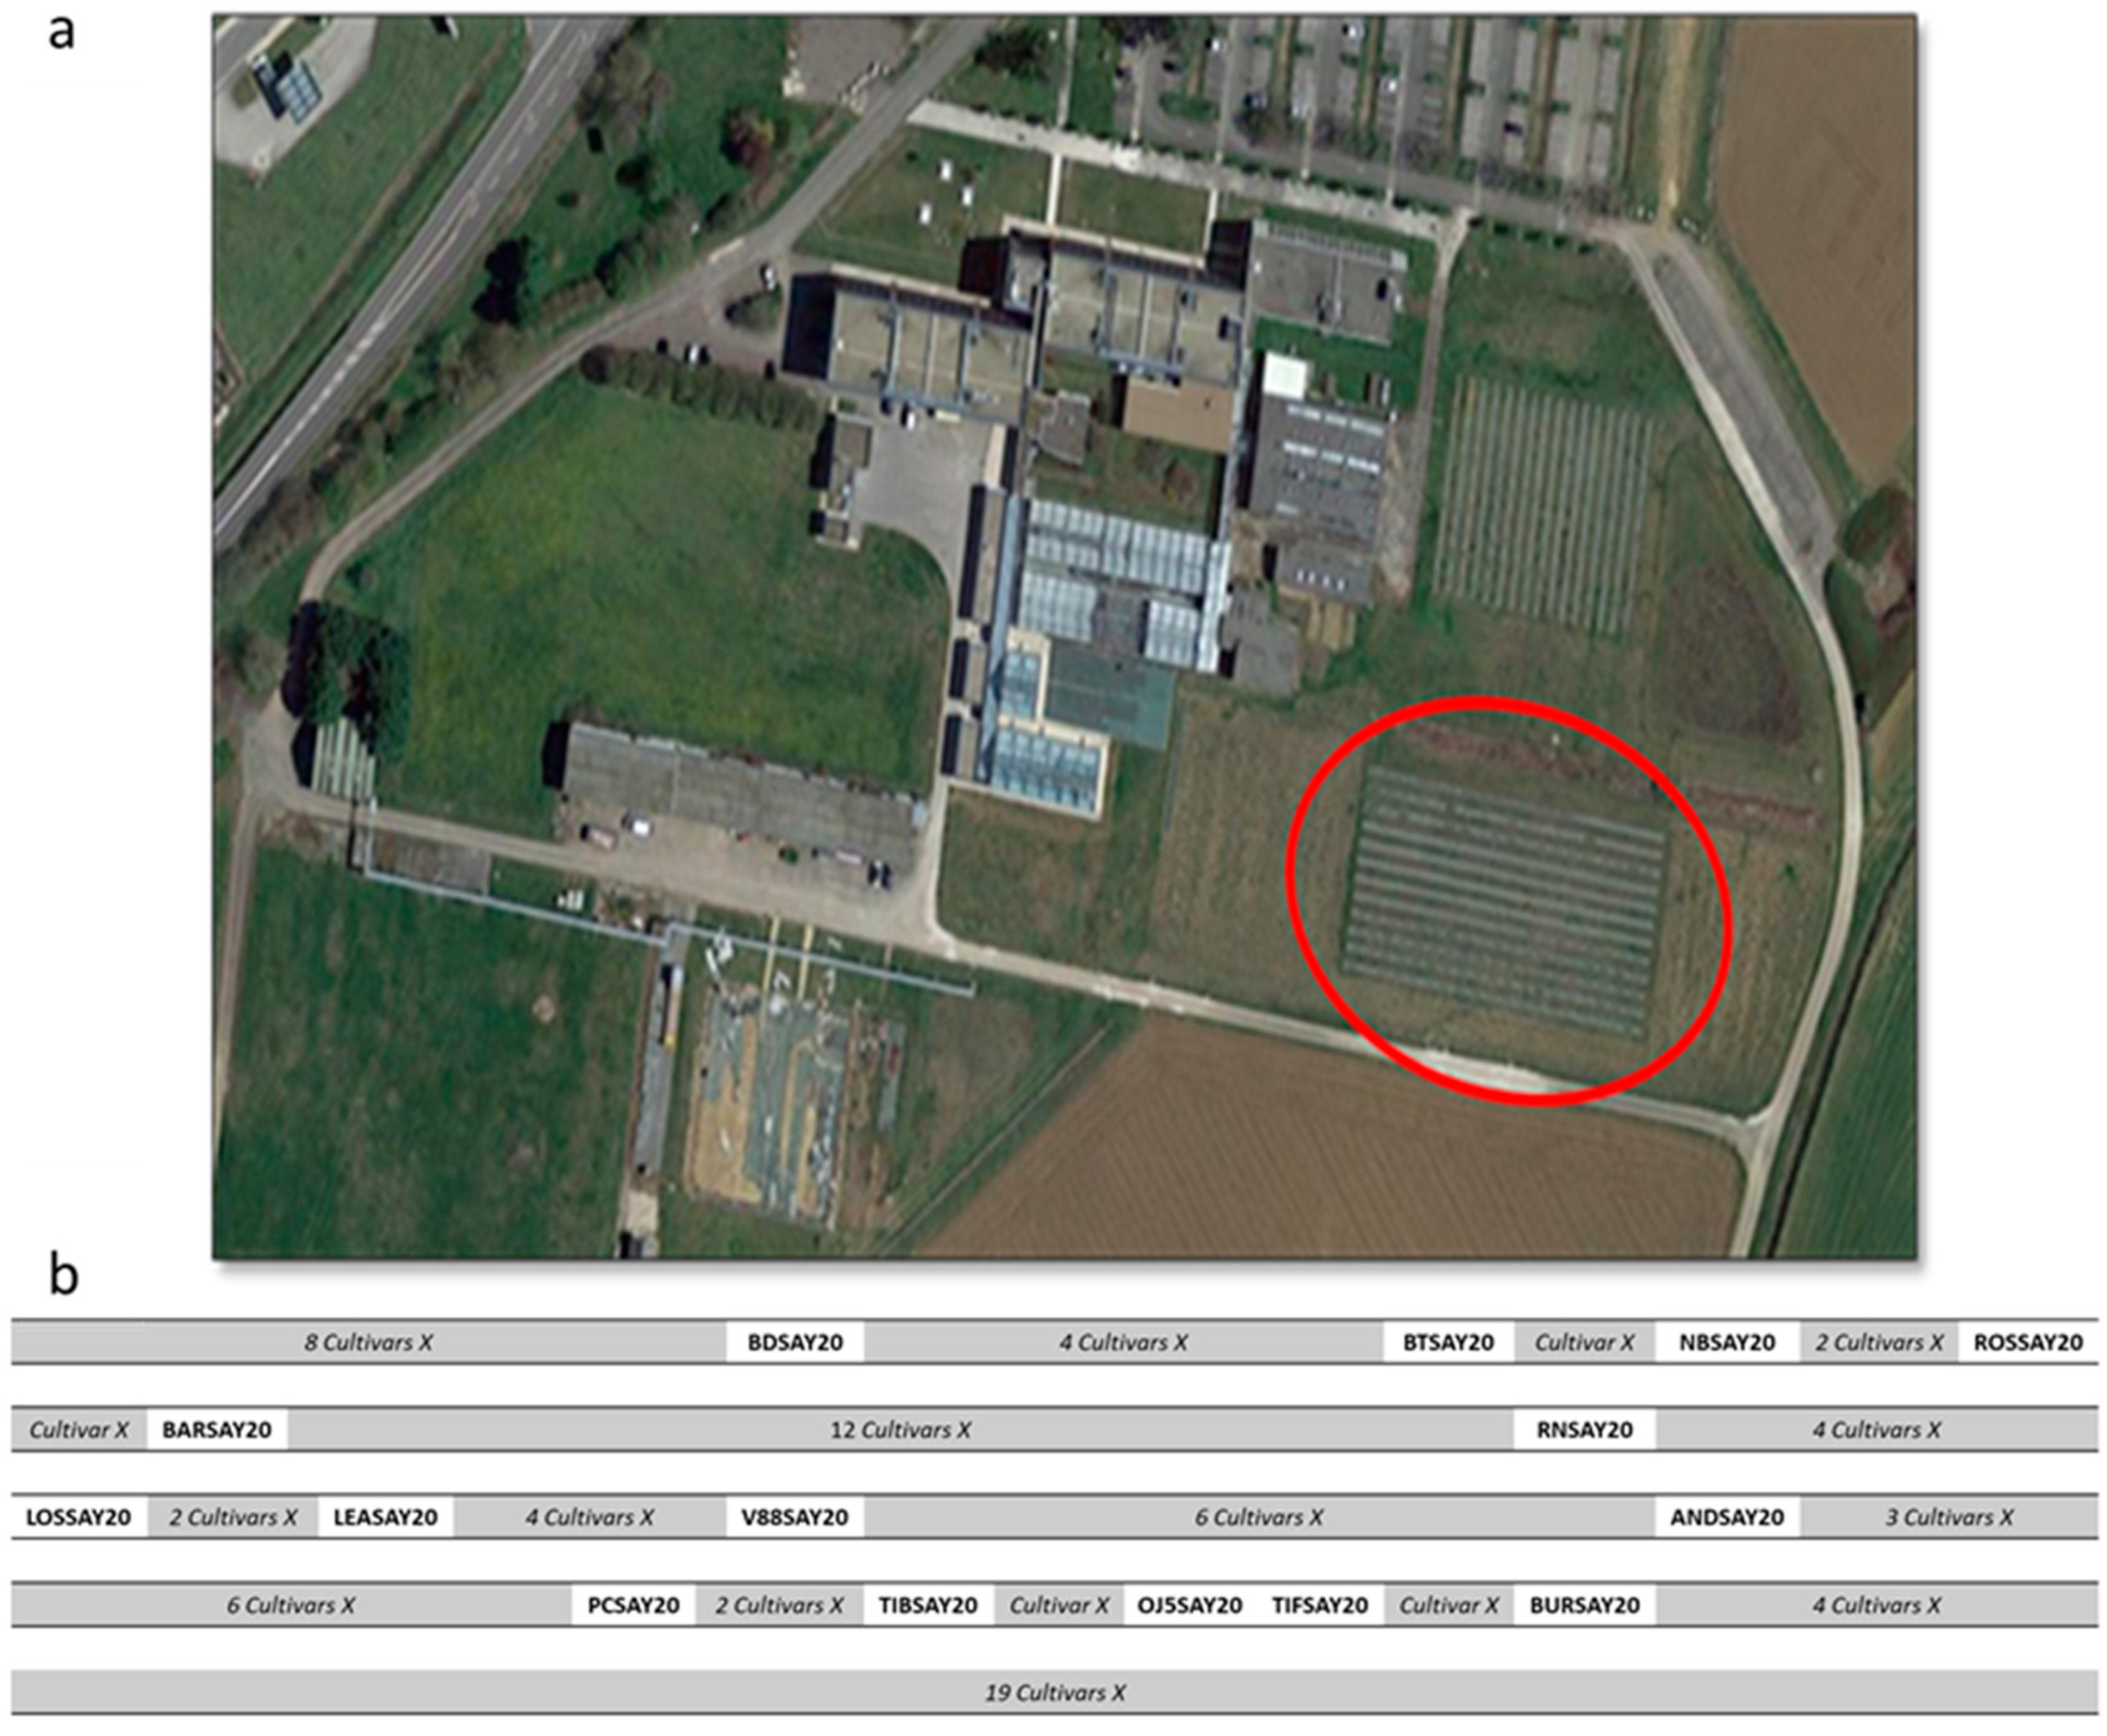
3.1. Cultivars and Cultivation

Fifteen cultivars of blackcurrant (Table 3) were grown in an open field on an experimental plot located in Burgundy (France, 47°14′6.508″ N, 5°6′28.096″ E), as shown in Figure 5a. For each cultivar, three plants were cultivated and the plot was organized as described in Figure 5b.
All plants were about six years old and were pruned each year in winter around January (only dead and obstructing branches were cut). Each blackcurrant plant received fertilizers (nitrogen, potassium, magnesium, and phosphorus) but not watering or chemical weeding.

3.2. Berry Harvesting and Storage

The fifteen cultivars of blackcurrant were harvested at maturity. Three conditions had to be met for the fruit to be considered ripe: the berries had to be easy to pick, they had to color the skin when crushed between two fingers, and the total soluble solids concentration (°Brix) at harvest had to be over 15°. As all the cultivars ripened at different times (early ripening, middle-season ripening, or late ripening), the harvesting period extended over one month from June to the beginning of July, as indicated in Table 3. All the berries of each plant were manually picked and pooled together for the same cultivar. Cultivars gave berries of different sizes, ranging from 31 to 99 g/100 berries, with 38 g/100 berries for Noir de Bourgogne. Berries were stored frozen (−40 °C) until analysis. The duration of storage ranged from one to three months (Table 3).

3.3. Analysis of the Volatile Fraction of Berries

3.3.1. HS-SPME-GC-MS

Volatiles were extracted with 1 cm SPME DVB/CAR/PDMS (divi-nylbenzene/carboxen/polydimethylsiloxane; 50/30 μm) fiber. The fiber (24 Ga 50/30 µm, for manual holder, 3 pK, 57328-U) was purchased from Sigma (Saint-Quentin-Fallavier, France) and used with a manual fiber holder. SPME vials (20 mL, VA201) and septum caps (18-mm caps, 8-mm PTFE/silicon septum, SACA001) were purchased from JASCO (Lisses, France). Exactly 2 g of frozen berries were placed in the vial. They were left to defrost for 30 min at ambient temperature. Through preliminary experiments, the equilibrium step was set to 30 min at ambient temperature and the extraction step when the fiber was exposed to the headspace to 30 min at ambient temperature.
An HP 6890 Series Gas Chromatograph (Waldbronn, Germany) equipped with an HP 5973 Mass Selective Detector (USA) (Quadrupole) was used with a DB-WAX column (30 m × 0.32 mm × 0.25 µm, 123-7032, Agilent, J&W Scientific, Santa Clara, CA, USA) to analyze the compounds of interest. The SPME fiber was de-sorbed and maintained in the injection port at 250 °C for 5 min. The sample was injected with a purge flow of 20 mL/min for 2 min. Helium was used as carrier gas at 1.4 mL/min with a linear velocity of 43 cm/s. The temperature program was isothermal at 40 °C for 10 min, an increase to 100 °C at a rate of 2 °C/min, isothermal at 100 °C for 6 min, an increase to 120 °C at a rate of 4 °C/min, isothermal at 120 °C for 2 min, and then an increase to 240 °C at a rate of 20 °C/min, which was maintained for 5 min. The total run time was 64 min. The ionization source and transfer line temperatures were set at 230 °C and 160 °C, respectively. The mass spectra were obtained using a mass-selective detector with an electron impact voltage of 70 eV in full scan mode over the range from 29 to 400 m/z.
Analyses were completed in triplicate.

3.3.2. Identification of Compounds

To conduct the data analysis, compounds with areas above 100,000 (TIC intensity corresponding to the peak integration threshold) and known to be odorant were kept.
Identification was based on the analysis of pure compounds: 3-carene, γ-terpinene, ocimene, 1S-α-pinene, β-pinene, and caryophyllene. The other volatile compounds were compared using their mass spectra from several libraries (NIST 08 (National Institute of Standards and Technology), WILEY138, and INRAMASS (personal library)). The identification of these compounds was also verified with retention index calculations.

3.3.3. Selection of Representative Volatile Compounds

Compounds identified for the three replicates of the 2020 harvest were pooled. For the final data analysis, we selected the volatile compounds found at least twice in the three replicates of each cultivar.
Compounds were reported in order of decreasing peak area and decreasing frequency of appearance (which was the percentage for the presence of peaks in the chromatogram). Comparisons between the different cultivars were based on the 34 compounds with the most important peak areas and highest frequencies of appearance (Table 1).

3.4. Strategy for Multivariate Data Analyses

The relative standard deviation (RSD) was used to determine whether the “regular” standard deviation was small or large when compared to the mean for a considered dataset. If percentages were large—for instance, more than 55%—this indicated that the data were more spread out. This made it possible to appreciate how precise the data were in the experiment. The more precise the data, the smaller the RSD was.
Univariate statistical analysis and data visualization were used to produce visualizations of information in order to highlight complex data relationships.
Finally, multivariate data analyses were used to explore chemical profiles in more depth and to determine the existence of specific groups. The goal of these analyses was to extract the important information from the data and to express this information as a set of summary indices called principal components. Then, multidimensional scaling (MDS) was used. This dimension-reduction technique was designed to project high-dimensional data down to two dimensions while preserving relative distances between observations. For both MDS and PCA, proximity measures such as the correlation coefficient or Euclidean distance were used to generate a spatial configuration (map) of points in multidimensional space, where the distances between points reflected the similarity of isolates. PCA minimized dimensions, preserving the covariance of data, and MDS minimized dimensions, preserving the distance between data points. MDS was most useful when the observations were significant and relatively small, such as different cultivars [19,20].
Data analyses were carried out using RStudio-1.4.1106 and R-4.0.5 [21,22] and specific packages: FactoMineR [23], Factoextra [24], magrittr [25], dplyr [26], ggpubr [27], corrplot [28], UpSetR [29], reshape2 [30]. FactoMineR, factoextra, and corrplot were used for PCA; UpSetR and reshape2 for creating UpSet plots; and magrittr, dplyr, and ggpubr for MDS.

4. Conclusions

Among the 15 cultivars that were cultivated in the same conditions and harvested in the same year, some cultivars showed VOC profiles for their berries that were different from the others:
  • The Rosenthal cultivar exhibited a quite flat profile with 21 molecules and was characterized by sabinene, β-phellandrene, and ocimene;
  • The cultivars Lositkia, Ben Tiran, and Barchatnaia shared the same characteristics, including having the greatest number of detected molecules;
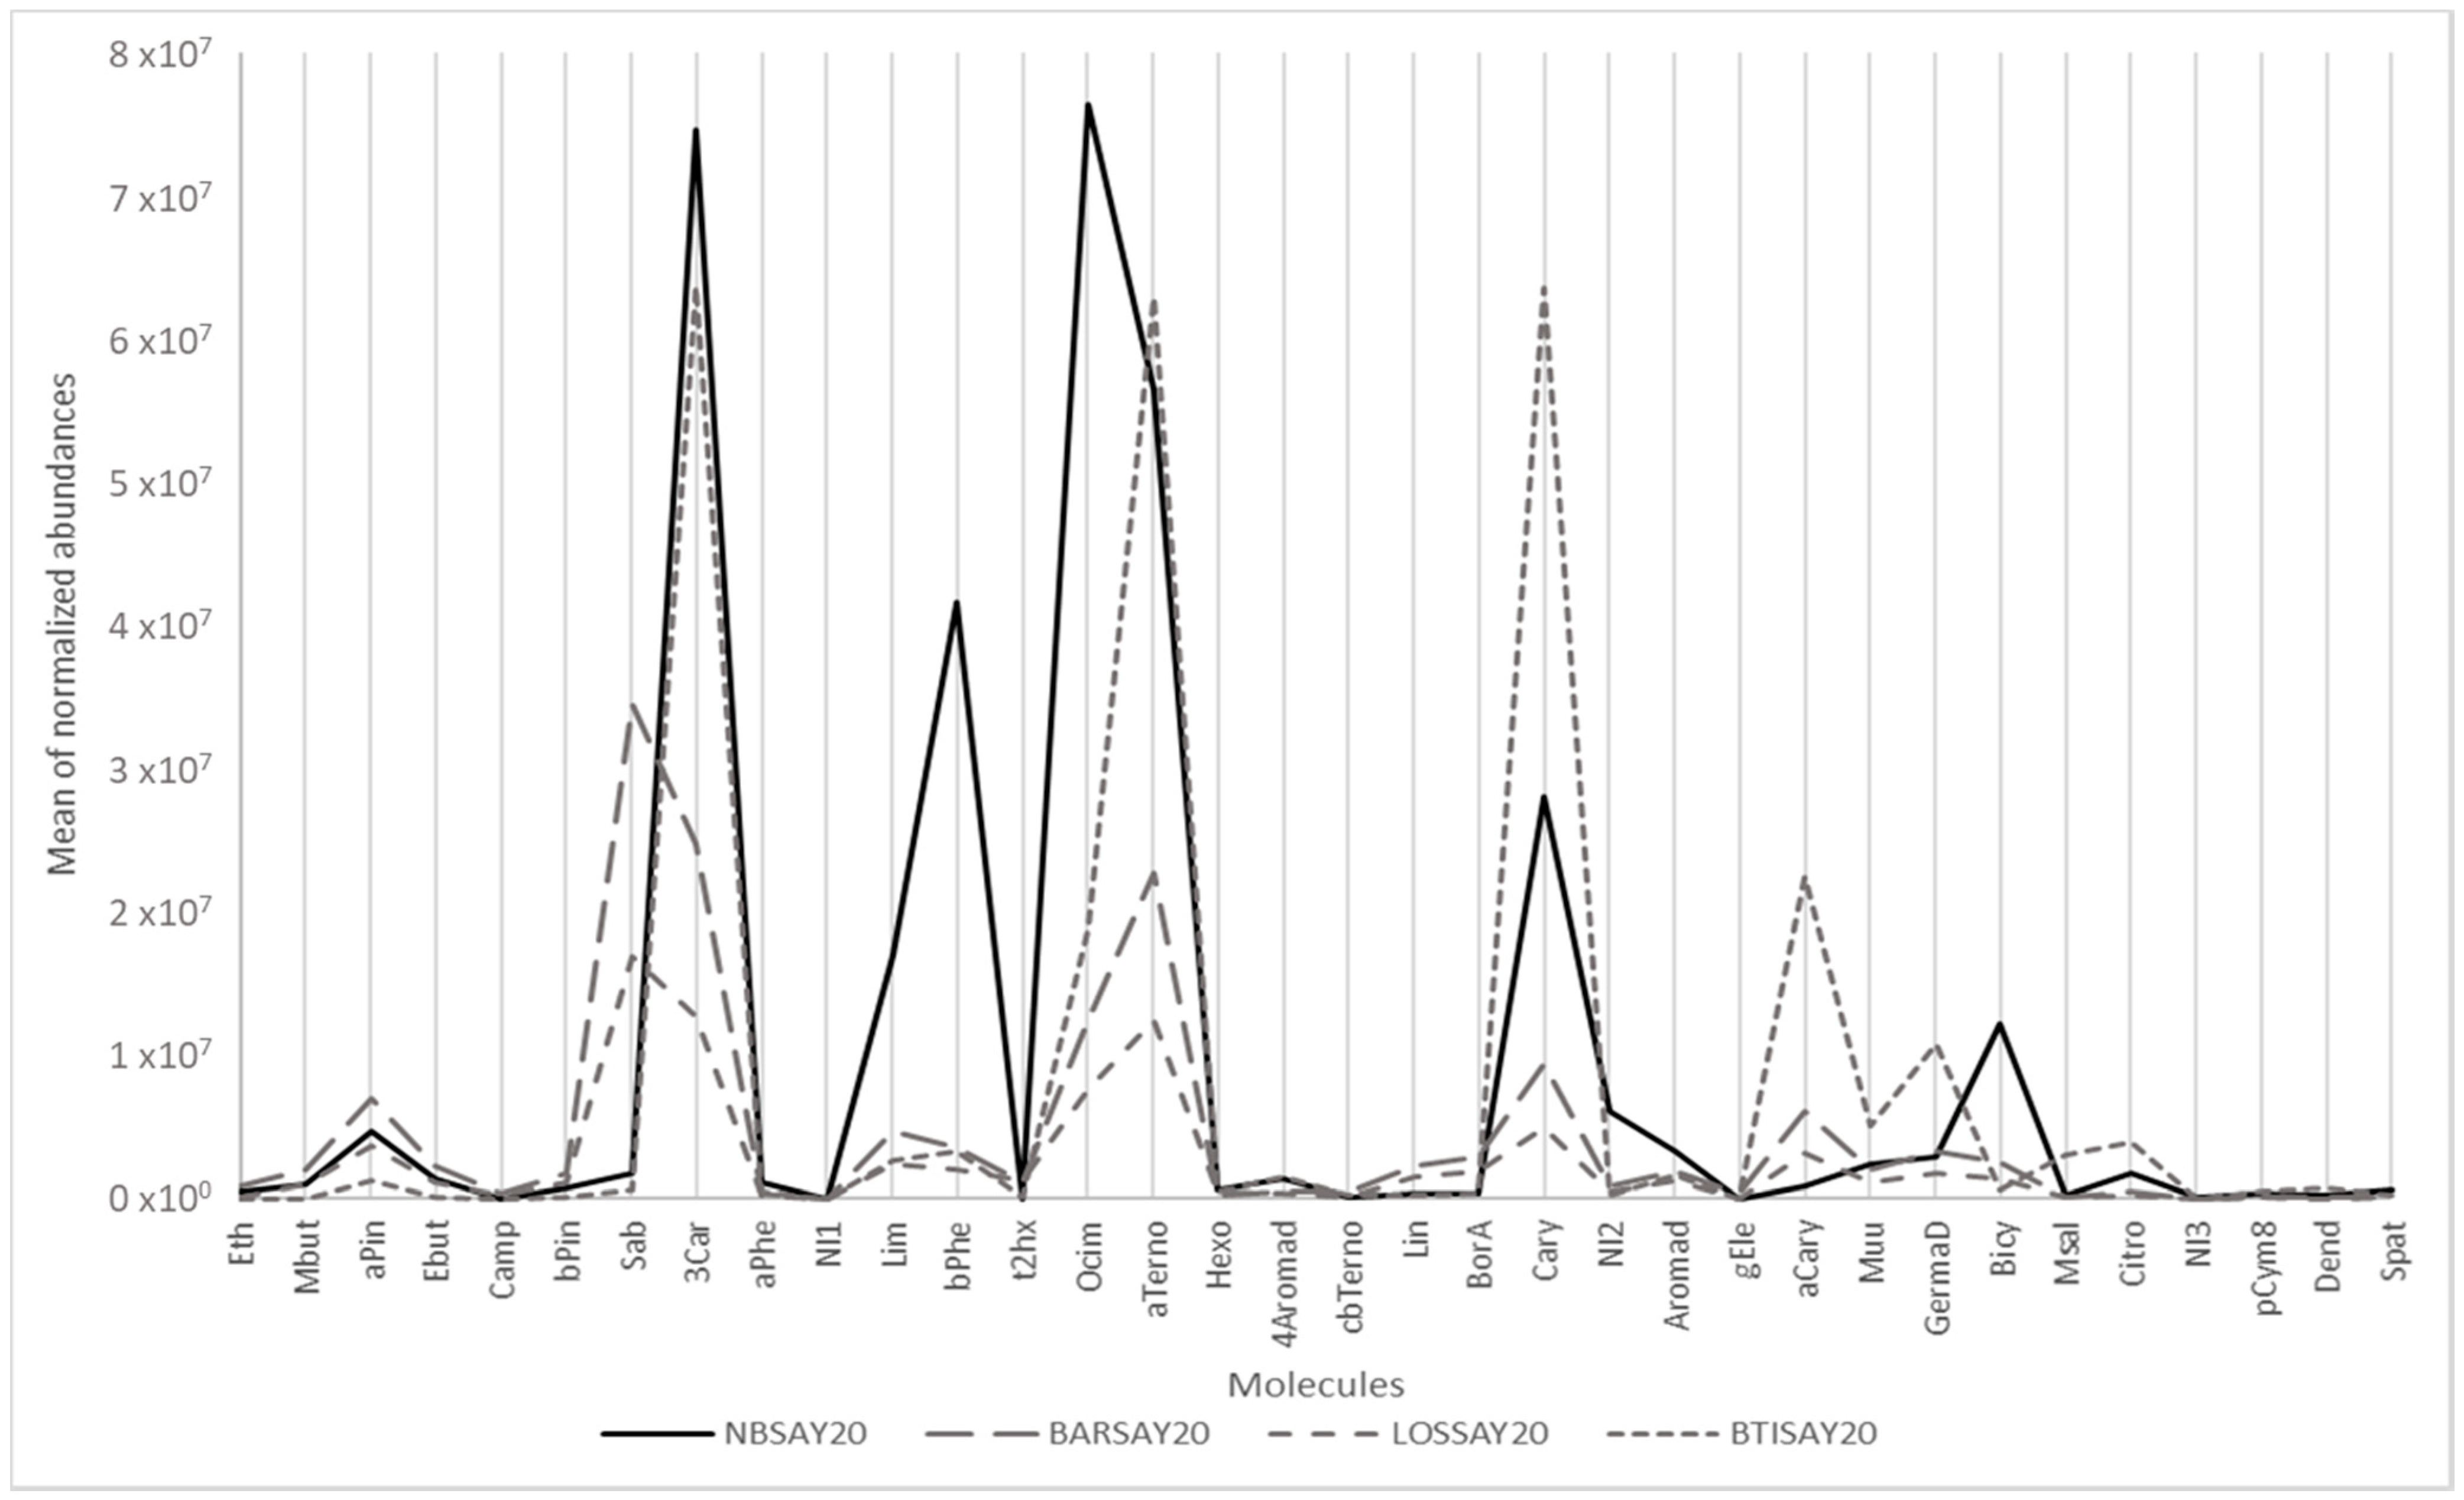
  • The Noir de Bourgogne cultivar did not show specific molecules, but it generally had the highest amounts of several molecules, such as 3-carene, limonene, β-phellandrene, ocimene, NI2, α-terpinolene, and bicyclogermacrene.
No other cultivar in this study seemed able to replace Noir de Bourgogne for the production of liquors. This study should be completed by sensory analyses.
Additionally, it is necessary to study other cultivars or to implement hybridization with Noir de Bourgogne as one of the parents.

Author Contributions

Harvesting of berries, S.P.-H.; analysis of the volatile fraction, S.P.-H.; data analysis, S.P.-H.; data interpretation, S.P.-H. and L.D.; writing, S.P.-H.; statistical analysis, L.D.; writing, L.D. and N.C.; methodology, N.C.; project administration, N.C. All authors have read and agreed to the published version of the manuscript.

Funding

This work was supported by the Regional Council of Bourgogne–Franche Comté and the “Fond Européen agricole pour le développement rural” (FEADER) as part of the project “Pérennité de la filière cassis en Bourgogne”.

Institutional Review Board Statement

Not applicable.

Informed Consent Statement

Not applicable.

Acknowledgments

We thank Philippe Mussillon and Olivier Lenoir for greenhouse growing of blackcurrant plants, Jugurta Bouidghaghen and Cécile Desbois for their help during harvesting, and Olivier Lenoir and Judith Cartron for their advice.

Conflicts of Interest

The authors declare that they have no known competing financial interests or personal relationships that could have appeared to influence the work reported in this paper.

Sample Availability

All studied samples are available from the authors.

Appendix A

Figure A1. Multidimensional scaling using (a) Euclidean distance and (b) 1—Pearson correlation coefficient (1—cor).
Molecules 26 06254 g0a1

References

  1. Cortez, R.E.; de Mejia, E.G. Blackcurrants (Ribes nigrum): A Review on Chemistry, Processing, and Health Benefits. J. Food Sci. 2019, 84, 2387–2401. [Google Scholar] [CrossRef] [PubMed] [Green Version]
  2. Ministère de l’Agriculture de l’Agroalimentaire et de la Forêt. Arrêté du 7 Août 2013 Relatif à L’indication Géographique «Cassis de Dijon». JORF, du 31 août 2013, n°0202. Available online: https://www.legifrance.gouv.fr/loda/id/JORFTEXT000027914853/ (accessed on 17 September 2021).
  3. Ministère de l’Agriculture de l’Agroalimentaire et de la Forêt. Arrêté du 22 Janvier 2015 Relatif à L’indication Géographique «Cassis de Bourgogne». JORF, du 28 janvier 2015, n°0023. Available online: https://www.legifrance.gouv.fr/loda/id/LEGITEXT000030260929/2021-02-08 (accessed on 17 September 2021).
  4. Latrasse, A.; Rigaud, J.; Sarris, J. L’arôme du cassis (Ribes nigrum L.) odeur principale et notes secondaires. Sci. Aliment. 1982, 2, 145–162. [Google Scholar]
  5. Liu, Y.; Wang, S.; Ren, J.; Yuan, G.; Li, Y.; Zhang, B.; Zhu, B. Characterization of free and bound volatile compounds in six Ribes nigrum L. blackcurrant cultivars. Food Res. Int. 2018, 103, 301–315. [Google Scholar] [CrossRef] [PubMed]
  6. Marsol-Vall, A.; Kortesniemi, M.; Karhu, S.T.; Kallio, H.; Yang, B. Profiles of Volatile Compounds in Blackcurrant (Ribes nigrum) Cultivars with a Special Focus on the Influence of Growth Latitude and Weather Conditions. J. Agric. Food Chem. 2018, 66, 7485–7495. [Google Scholar] [CrossRef] [PubMed]
  7. Marsol-Vall, A.; Laaksonen, O.; Yang, B. Effects of processing and storage conditions on volatile composition and odor characteristics of blackcurrant (Ribes nigrum) juices. Food Chem. 2019, 293, 151–160. [Google Scholar] [CrossRef] [PubMed]
  8. Nursten, H.E.; Williams, A.A. Volatile constituents of the black currant, RISES NIGR UM L.: II.—The fresh fruit. J. Sci. Food Agric. 1969, 20, 613–619. [Google Scholar] [CrossRef]
  9. Mikkelsen, B.B.; Poll, L. Decomposition and transformation of aroma compounds and anthocyanins during black currant (Ribes nigrum L.) juice processing. J. Food Sci. 2002, 67, 3447–3455. [Google Scholar] [CrossRef]
  10. Tiitinen, K.; Sandell, M.; Pohjanheimo, T.; Tahvonen, R.; Kallio, H. Flavour profile of frozen black currant: Extraction by SPME and analysis by GC sniffing. In State-of-the-Art in Flavour Chemistry and Biology; Hofmann, T., Rothe, M., Schieberle, P., Eds.; Deutsche Forschungsanstalt für Lebensmittelchemie: Garching, Germany, 2004; pp. 518–522. [Google Scholar]
  11. Ruiz del Castillo, M.L.; Dobson, G. Varietal differences in terpene composition of blackcurrant (Ribes nigrum L) berries by solid phase microextraction/gas chromatography. J. Sci. Food Agric. 2002, 82, 1510–1515. [Google Scholar] [CrossRef]
  12. Jung, K. Analysis and Sensory Evaluation of Volatile Constituents of Blackcurrant (Ribes nigrum L.) and Redcurrant (Ribes rubrum L.) Fruits; Technical University Munich: Munich, Germany, 2018; p. 140. Available online: https://www.semanticscholar.org/paper/Analysis-and-sensory-evaluation-of-volatile-of-(-(-Jung/2b5efe35e7706428d62f674bf8201605cb57a20d (accessed on 17 September 2021).
  13. Ohlsson, A. Comparison of flavour compounds in juices from different blackcurrant varieties. In Chemistry; University of Kalmar, School of Pure and Applied Natural Sciences: Kalmar, Sweden, 2009; p. 240. Available online: https://www.diva-portal.org/smash/get/diva2:272872/FULLTEXT01.pdf (accessed on 17 September 2021).
  14. Harb, J.; Bisharat, R.; Streif, J. Changes in volatile constituents of blackcurrants (Ribes nigrum L. cv. ‘Titania’) following controlled atmosphere storage. Postharvest. Biol. Technol. 2008, 47, 271–279. [Google Scholar] [CrossRef]
  15. Leino, M.; Kallio, H. Volatile compounds of blackcurrant juice and wine. Z. Lebensm.-Unters. Forsch. 1993, 196, 410–414. [Google Scholar] [CrossRef]
  16. Orav, A.; Kailas, T.; Muurisepp, M. Composition of blackcurrant aroma isolated from leaves, buds, and berries of Ribes nigrum L. Proc. Estonian Acad. Sci. Chem. 2002, 51, 225–234. [Google Scholar]
  17. Lex, A.; Gehlenborg, N.; Strobelt, H.; Vuillemot, R.; Pfister, H. UpSet: Visualization of Intersecting Sets. IEEE Trans. Vis. Comput. Graph. 2014, 20, 1983–1992. [Google Scholar] [CrossRef] [PubMed]
  18. Thioulouse, J.; Dray, S.; Dufour, A.B.; Siberchicot, A.; Jombart, T.; Pavoine, S. Multivariate Analysis of Ecological Data with ade4; Springer: New York, NY, USA, 2018. [Google Scholar]
  19. Härdle, W.; Simar, L. Applied Multivariate Statistical Analysis, 4th ed.; Springer: Berlin, Germany, 2015. [Google Scholar]
  20. Baccini, A.; Besse, P.; Déjean, S.; Martin, P.G.; Robert-Granié, C.; San Cristobal, M. Stratégies pour l’analyse statistique de données transcriptomiques. J. Société Française Stat. 2005, 146, 5–44. [Google Scholar]
  21. RStudio_Team. RStudio: Integrated Development for R; RStudio, PBC: Boston, MA, USA, 2020. [Google Scholar]
  22. R_Core_Team. R: A Language and Environment for Statistical Computing; R Foundation for Statistical Computing: Vienna, Austria, 2020. [Google Scholar]
  23. Lê, S.; Josse, J.; Husson, F. FactoMineR: An R package for multivariate analysis. J. Stat. Softw. 2008, 25, 1–18. [Google Scholar] [CrossRef] [Green Version]
  24. Kassambara, A.; Mundt, F. Factoextra: Extract and Visualize the Results of Multivariate Data Analyses. 2020. Available online: https://CRAN.R-project.org/package=factoextra (accessed on 17 September 2021).
  25. Bache, S.M.; Wickham, H. Magrittr: A Forward-Pipe Operator for R, R package Version 2.0.1. 2020. Available online: https://cran.r-project.org/web/packages/magrittr/index.html (accessed on 17 September 2021).
  26. Wickham, H.; François, R.; Henry, L.; Müller, K. Dplyr: A Grammar of Data Manipulation, R Package Version 1.0.7. 2021. Available online: https://cran.r-project.org/web/packages/dplyr/index.html (accessed on 17 September 2021).
  27. Kassambara, A. Ggpubr: ‘Ggplot2′ Based Publication Ready Plots, R package version 0.4.0. 2020. Available online: https://cran.r-project.org/web/packages/ggpubr/index.html (accessed on 17 September 2021).
  28. Wei, T.; Simko, V. R Package “corrplot”: Visualization of a Correlation Matrix, Version 0.90. 2021. Available online: https://cran.r-project.org/web/packages/corrplot/citation.html (accessed on 17 September 2021).
  29. Gehlenborg, N. UpSetR: A More Scalable Alternative to Venn and Euler Diagrams for Visualizing Intersecting Sets, R package Version 1.4.0. 2019. Available online: https://rdrr.io/cran/UpSetR/ (accessed on 17 September 2021).
  30. Wickham, H. Reshaping Data with the reshape Package. J. Stat. Softw. 2007, 21, 1–20. [Google Scholar] [CrossRef]
Figure 1. Graphical representation of the main odorant volatiles extracted from berries of different cultivars.
Molecules 26 06254 g001
Figure 2. UpSet plot showing co-occurrence of volatile molecules in the various cultivars. QMC: Quantity of molecules found in each cultivar. The total size of each set is represented on the left barplot (a). Every possible intersection is represented by the bottom plot (b), and their occurrence is shown on the top barplot (c). (d) Detailed table with frequency of presence of molecules (FPM) in cultivars; presence is indicated by 1 and absence by 0.
Molecules 26 06254 g002
Figure 3. Two-dimensional table plot with proportional circles for peak areas of each volatile compound: (a) raw data and (b) relative abundance.
Molecules 26 06254 g003
Figure 4. Final PCA plot released for harvest data from 2020 for the molecules retained after RSD sorting and the first PCA (Car indicates 3Car and Aromad indicates 4Aromad). The color gradient represents the level of square cosines for the variables (a,b) and the individuals (c,d). Variables with poor representation (cos2 < 0.5) are invisible. The supplementary variable, the Brix degree, is in dashed blue; (a,b) correspond to the variable plots in plans Dim 1–Dim 2 and Dim 1–Dim 3, respectively; (c,d) correspond to the individual plots in plans Dim 1–Dim 2 and Dim 1–Dim 3, respectively.
Molecules 26 06254 g004aMolecules 26 06254 g004b
Figure 5. Cultivars and growing areas. (a) Aerial view of the Sayens site of Agronov, Agricultural Chamber of Burgundy, Bretenières, France. The red circle indicates the plot where the fifteen blackcurrant cultivars were grown; (b) the organization of the plot. “Cultivars X” refers to other cultivars from the Sayens collection that were not taken into account in the present study.
Molecules 26 06254 g005
Table 1. List of volatile compounds detected and identified in the headspace of berries for the 15 different cultivars.
Retention IndexCAS NumberMoleculesReported in the LiteratureCodesOcc. Freq.Mean
92564-17-5Ethanol[8]Eth872.98 × 105
975643-42-7Methyl butanoate[9]Mbut938.53 × 105
102580-56-8α-Pinene[10]aPin1002.62 × 106
1030105-54-4Ethyl butanoate[4]Ebut1001.45 × 106
106879-92-5Camphene[11]Camp339.23 × 104
1102127-91-3β-Pinene[6]bPin985.86 × 105
11193387-41-5Sabinene[12]Sab966.38 × 106
114013466-78-93-Carene[13]3Car1002.77 × 107
115499-83-2α-Phellandrene[11]aPhe894.79 × 105
116299-84-3NI1 NI1111.33 × 105
1196138-86-3Limonene[4]Lim1004.79 × 106
1203555-10-2β-Phellandrene[9]bPhe1001.06 × 107
12166728-26-3Trans-2-hexenal[12]t2hx824.01 × 105
125629714-87-2Ocimene[10]Ocim1001.91 × 107
1273586-62-9α-Terpinolene[10]aTerno1002.41 × 107
1371111-27-3Hexanol[14]Hexo1006.15 × 105
1513489-40-74-Aromadendrene 4Aromad984.90 × 105
1558138-87-4Cis-β-terpineol cbTerno781.54 × 105
156878-70-6Linalool[4]Lin823.65 × 105
157476-49-3Bornyl acetate[15]BorA1005.25 × 105
158087-44-5Caryophyllene[9]Cary1001.87 × 107
1587475-20-7NI2 NI2938.95 × 105
1622489-39-4Aromadendrene Aro1001.25 × 106
1627339154-91-5γ-Elemene[16]gEle604.91 × 105
16496753-98-6α-Caryophyllene[13]aCary1004.49 × 106
167110208-80-7Muurolene[9]Muu931.06 × 106
168623986-74-5Germacrene D GermD871.80 × 106
171724703-35-3Bicyclogermacrene[16]Bicy891.78 × 106
1760119-36-8Methyl salicylate[13]Msal734.43 × 105
1789106-22-9Citronellol[9]Citro898.19 × 105
1825483-77-2NI3 NI3444.53 × 105
18481197-01-9p-Cymen-8-ol[13]pCym8731.68 × 105
195423262-34-2Dendrolasin Dend531.42 × 105
21276750-60-3Spathulenol[12]Spat842.18 × 105
Codes: abbreviation of each molecule used for statistical analysis; Occ. Freq.: appearance frequency of each molecule for the three replicates of each cultivar; Mean: global mean of chromatographic areas, calculated for all cultivars and all replicates, with missing data replaced by the normalized chromatograph detection threshold.
Table 2. Stability of peak areas, expressed by the relative standard deviation (RSD).
RSD “Within” for Each CultivarNBSAY20BDSAY20ANDSAY20BURSAY20RNSAY20LEASAY20LOSSAY20OJSAY20V88SAY20PCSAY20BTISAY20BARSAY20ROSSAY20TIBSAY20TIFSAY20Mean of the RSD “Within”RSD “Between”
Volatile Compounds
Eth37215472393066665318 243755 4492
Mbut59755715376142864323 494786605370
aPin1674242261941612021191346642973
Ebut14525235319630764713153140711074788
Camp 21 13 2910 1869
bPin2046461276755823244362876613989
Sab161721 597015535234244312687440150
3Car13146191765941172515358854563275
aPhe2079102767723 27621 39402349
NI1
Lim861711466942123110311378382584
bPhe1012819115010411831143611595225103
t2hx 183731368727382462351723 263586
Ocim547141217597431432354020494830101
aTerno910131415611339163211311558442573
Hexo11605152824333323993071233903452
4Aromad35531125522524137109251743362884
cbTerno369 17 437058146131533 3164
Lin717 23182418 23351125 301420152
BorA1135259376115783733441317283332152
Cary13109822621395184713202551423087
NI29813112563162945 14292239 25161
Aro53322310462436623631812115083284
gEle 12 1950 471138 17 47383170
aCary119105185812401933101824444524126
Muu163065019752215649817 894733114
GermD914211023661959 173510135227135
Bicy81511102865134830 454028 1427158
Msal20 47 4071251101424373827139
Citro928772247313 1669725 442632114
NI31612 22 1743 462666
pCym82148 3024464657 246 23 3363
Dend11 10331 55 725 412391
Spat124 9853135322520332016 2190
Molecules with means for the RSD “within” and the RSD “between” colored in black were suppressed for the final multivariate data analysis. Cells colored in gray correspond to molecules with abundances below the detection threshold or molecules found only once among the three replicates.
Table 3. List of the cultivars and parameters of cultivation. Size of berries: “heterogeneous” means that berries were of different sizes and “homogeneous” means that berries were globally the same size; maturity of berries: “heterogeneous” means that the maturity and color of berries varied a little and “homogeneous” means all berries were deep black.
CultivarsLabelingEarlinessHarvest DateAnalysis DateSize of BerriesWeight Mean of 1 Berry (g)Maturity of BerriesBrix Degree at Harvest
Noir de BourgogneNBSAY20Late24 June 202022 July 2020Homogeneous small0.38homogeneous ripe15.3
Black DownBDSAY20Early29 June 202021 July 2020Homogeneous small0.64homogeneous ripe17.1
AndegaANSAY20Middle season23 June 202029 July 2020Heterogeneous0.70homogeneous ripe18.6
BurgaBUSAY20Early18 June 202020 August 2020Homogeneous medium0.54homogeneous ripe14.7
Royal de NaplesRNSAY20Early23 June 202023 July 2020Homogeneous small0.46homogeneous ripe19.6
LeandraLEASAY20Very late30 June 202020 July 2020Homogeneous large0.99homogeneous ripe17.6
LositkiaLOSSAY20Middle season25 June 202031 July 2020Heterogeneous0.50heterogeneous19.4
OJ-5-3OJSAY20Late30 June 202017 July 2020Homogeneous large0.70homogeneous ripe16.3
88-04-181V88SAY20Early25 June 202030 July 2020Heterogeneous0.58heterogeneous16.3
PC110PCSAY20Middle season22 June 202024 July 2020Homogeneous large0.96homogeneous ripe18.9
Ben TiranBTISAY20Very late16 July 202023 July 2020Homogeneous large0.76homogeneous ripe16.8
BarchatnaiaBARSAY20Early24 June 202027 July 2020Homogeneous small0.50homogeneous ripe20
RosenthalROSSAY20Late25 June 202028 July 2020Homogeneous0.31homogeneous ripe16.4
TibenTIBSAY20Middle season29 June 202028 July 2020Homogeneous large0.78homogeneous ripe16.3
TifonTIFSAY20Middle season22 June 202021 August 2020Homogeneous large0.80homogeneous ripe17.4
Publisher’s Note: MDPI stays neutral with regard to jurisdictional claims in published maps and institutional affiliations.

