Abstract
Biogenic amines (BAs) and nitrites are both considered harmful compounds for customer health, and are closely correlated with the microorganisms in fermented mustard (FM). In this study, BAs and nitrite contents in fifteen FM samples from different brands were analyzed. The concentrations of cadaverine in one sample and of histamine in one sample were above the toxic level. Moreover, five FM samples contained a high level of nitrite, exceeding the maximum residue limit (20 mg/kg) suggested by the National Food Safety Standard. Then, this study investigated bacterial and fungal communities by high-throughput sequencing analysis. Firmicutes and Basidiomycota were identified as the major bacteria and fungi phylum, respectively. The correlations among microorganisms, BAs and nitrite were analyzed. Typtamine showed a positive correlation with Lactobacillus and Pseudomonas. Cadaverine and nitrite is positively correlated with Leuconostoc. Furthermore, thirteen strains were selected from the samples to evaluate the accumulation and degradation properties of their BAs and nitrite. The results indicated that the Lactobacillus isolates, including L. plantarum GZ-2 and L. brevis SC-2, can significantly reduce BAs and nitrite in FM model experiments. This study not only assessed the contents of BAs and nitrite in FM samples, but also provided potential starter cultures for BAs and nitrite control in the FM products industry.
1. Introduction
Mustard, a unique vegetable in China, is distributed south of the Yangtze River. However, it is not ideal to be consumed as a fresh vegetable due to its bitter taste. Hence, mustard is spontaneously fermented as a kind of fermented vegetable. Fresh mustard is used as the main raw material to process fermented mustard (FM) by adding salt and other auxiliary materials. It is during this process that the mustard attaches itself to the microorganisms formed after fermentation [1]. Fermenting mustard not only gives it a more unique flavor, color and texture, but it also prolongs its storage period [2]. However, the quality of fermented vegetables highly depends on microorganisms; it is difficult to guarantee the safety of final fermented products because of the high amounts of harmful residues, such as BAs [3] and nitrite, which are frequently reported in fermented foods.
During fermentation, BAs are generally produced by microorganisms through enzymatic decarboxylation of amino acids and reductive amination of ketones and aldehydes [4]. Low doses of BAs can be quickly metabolised in the digestive tract [5,6], while a high level of BAs may produce some adverse consequences, such as headache, hot flushes and skin rashes [7]. In China, the content of BAs in fermented vegetables has no official limitations. Histamine is the only biogenic amine that is officially limited in fish Products, and it is regulated to be below 50 mg/kg by the US Food and Drug Administration and below 100 mg/kg by the European Community. Several studies have suggested maximum limits of BAs content in food products, i.e., 100 mg/kg for histamine, 100–800 mg/kg for tyramine, and 1000 mg/kg for total BAs content [8]. Lee et al. [9] reported that the concentrations of histamine and tyramine in fermented onions in Korea, exceeded recommended limits by a factor of four and two, respectively. Brink et al. [8] reported that histamine concentration in sauerkraut (a kind of fermented vegetable made with white cabbage in Europe) exceeded a recommended limit. However, BAs content in FM has not been evaluated in China until now.
Nitrite is a harmful compound and could cause many diseases [10,11]. Nitrite mainly comes from nitrate by the catalyzing of nitrate reductase, which is closely related to the microbial community [12]. Reduced iron (Fe2+) in haemoglobin can be oxidized by nitrite to its maximum oxidized state (Fe3+), thus reducing the total oxygen carrying capacity of the blood and causing methemoglobinemia. In addition, nitrite may be involved in the formation of N-nitrosamine by N-nitrosation reactions with dietary-derived amines in the stomach [13,14]. Liu, et al. [15] reported that the nitrite content in 65 out of 378 fermented vegetable samples was found to be above 20 mg/kg, which is the maximum nitrite content in fermented vegetables specified by the National Food Safety Standard. Therefore, it is necessary to control the formation of nitrite in FM.
There is a close correlation among BAs, nitrite and microorganisms in FM. This study investigated the contents of BAs and nitrite in FM from different brands, and found that the bacteria and fungi communities in FM were clarified by high-throughput sequencing analysis. In addition, strains highly capable of degrading nitrite and biogenic amines were screened from samples, and potential starter cultures for BAs and nitrite control in the FM products industry were provided.
2. Materials and Methods
2.1. Samples and Media
The top 15 fermented mustard samples from different brands were purchased according to the sales on Alibaba.com (Alibaba network technology co., Ltd., Hangzhou, China). Sample label uses a combination of regional and brand abbreviations. The information of all samples is shown in Table 1. All samples were packed well and purchased on Alibaba.com. Then they were stored at −20 °C for further analysis.

Table 1.
All sample information and labels in this study.
Certified analytical standards (putrescine, histamine, cadaverine, tryptamine, phenylethylamine, tyramine, spermidine ≥ 99%, spermine ≥ 99%, arginine, ornithine ≥ 99%, glutamine ≥ 99%, histidine, lysine, tryptophan ≥ 98%), 1,7-diaminoheptane assay 98% and dansyl chloride 97% were provided by Sigma-Aldrich (Darmstadt, Germany). Other analytical grade reagents were also purchased from Sigma-Aldrich.
2.2. Determination of Nitrite Concentration
The nitrite concentration in FM samples was calculated by using the Griess reaction [16]. Briefly, an FM sample that weighs 4 g was crushed, deproteinated and defatted by 10 mL of 30% w/v ZnSO4·7H2O solution and 0.5 mL of 15% (w/v) K4Fe (CN)6·3H2O solution. Then, 1 mL of 0.2% sulfanilamide and 1 mL of 0.1% N-1-naphtyethylene diamine dihydrochloride were added sequentially to filtrates. This reaction required the room temperature and a duration of 15 min. The optical density (OD) of the colored mixtures was measured at 538nm against the reagent blank. The standard curve was obtained by performing the same color development process and OD analysis, which is shown in Figure 1.
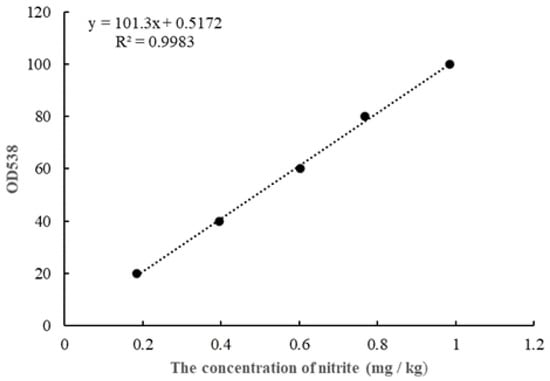
Figure 1.
The standard curve for nitrite determination.
2.3. Determination of BAs Concentrations
The methods described previously were used to measure the BAs content [17]. Briefly, 1 g of a sample was homogenized with 3 mL of 0.4 M HClO4 and extracted for 1 h. The mixture was centrifuged at 3000× g for 10 min, and the supernatant was collected. Subsequently, the supernatant (250 μL) was blended with 25 μL of NaOH (2 M) and 75 μL of saturated NaHCO3, and then reacted with 500 μL of dansyl-chloride (5 mg/mL) at 55 °C for 40 min. Later, the reactant was mixed with 25 μL of 25% NH4OH and incubated at 55 °C for 10 min. Then, a 0.22 μm membrane was utilized to filter the mixture for HPLC (high-performance liquid chromatography) analysis which was carried out by using an Agilent HPLC system with an Eclipse XDB-C18 (4.6 mm × 250 mm, 5 µm) column at 30 °C. The detection was analyzed at 254 nm. The elution solution was formed with a linear gradient of mobile phase A (acetonitrile) and B (H2O) at a flow rate of 1 mL/min. The solvent gradient was shown below: 0–4 min, 50% A; 4–22 min, 50–90% A; 22–30 min, 90–50% A; 30–35 min, 50% A.
The applied analytical method was evaluated with limits of detection (LOD), and limits of quantification (LOQ), which were showed in Table 2. The LOD and LOQ of BAs ranged from 0.19–0.42 mg/kg and 0.53–1.27 mg/kg, respectively. The result suggested that those methods were suitable for BAs analyses.
Table 2.
The limits of detection (LOD) and limits of quantification (LOQ) of analytical method for BAs.
2.4. Microbial Community Analysis
The E.Z.N.A Soil DNA kit (OMEGA, New York, NY, United States) was used to extract the genomic DNA from the FM samples. The V3-V4 region of the bacterial 16S rRNA genes was amplified with the primer 341F (5′-CCTACGGGNGGCWGCAG-3′) and 805R (5′-GACTACHVGGGTATCTAATCC-3′). The ITS1 region of fungal community was amplified with the primer ITS1F (5′-CTTGGTCATTTAGAGGAAGTAA-3′) and ITS2 (5′-GCTGCGTTCTTCATCGATGC-3′). After PCR and purification, a DNA library was built and operated on the Miseq Illumina platform at LC-Bio (Hangzhou, China).
Raw sequences generated by MiSeq sequencing and low-quality sequences were discarded using QIIME2. The UPARSE pipeline was used to analyze clean paired sequences retained for each sample and further generate operational tax-onomic units (OTUs) and screen representative sequences at 97% similarity.
2.5. Isolation and Purified of Lactic Acid Bacteria (LAB) from FM Samples
The mixtures of crushed FM samples (5 g) and 45 mL sterile saline were incubated (40 min; 35 °C). Then, samples were diluted (10−1 to 10−6) with sterile saline. As to each dilution, 200 µL sample solution was plated onto MRS agar plates and was incubated at 37 °C for 48 h. Then, observing and selecting colonies of medium size, raised, slightly white, moist, and the surrounding yellow, which was purified by spreading onto an MRS agar plate to obtain a single colony. The purified strains were initially identified as LAB s by Gram staining and hydrogen peroxide.
2.6. Strains Identification
Genomic DNA of bacteria was extracted using Tiangen Kit (Tiangen Biotech Co., Ltd., Beijing, China) and following the manufacturer’s protocol. The 16S rDNA sequence was amplified using the primers of 27f (AGAGTTTGATCMTGGCTCAG) and 1492r (CTACGGCTACCTTGTTA CGA). The PCR amplicons were sequenced and analyzed using the Blastn program.
2.7. Evaluation of BAs and Nitrite Production Ability
This study assessed the BAs production capability by culturing the strains in 5 mL MRS medium mixed with 1 g/L of histidine, tyrosine, tryptophan, phenylalanine, ornithine monohydrochloride, lysine or agmatine sulfate salt. Strains were also cultured in 5 mL MRS medium to measure the nitrite production capability. Finally, the production capability of BAs and nitrite was identified after incubating at 37 °C for 48 h.
2.8. Evaluation of BAs and Nitrite Degradation Ability
To measure the BAs and nitrite degrading ability, the cells were cultured and collected by centrifugation at 6000× g for 5 min. After washing with 0.05 mol/L phosphate buffer (pH = 7), the cell pellets were diluted to OD600 = 0.4 in phosphate buffer (0.05 mol/L) containing 100 mg/L of histamine, tyramine, tryptamine, β-phenethylamine, putrescine, cadaverine and nitrite cultured for 48 h to detect the residual BAs and nitrite. The blank phosphate buffer without cell pellets was used as the control. The inoculum density was 2% (v/v). The BA-degradation rate was measured based on the equation M = [(A − B)/A] × 100%, where M represents the BAs or nitrite degradation percentage and A and B indicate the original and final contents of BAs or nitrite, respectively [18].
2.9. Fermented Mustard Product Model Analysis
BAs and nitrite-controlling capacities of different strains were compared by using the fermented mustard model. Strain was inoculated into MRS broth at 37 °C for 12 h. The strain was then centrifuged at 4000 rpm for 10 min and washed three times with sterilized saline. The strain solution was dissolved with sterilized saline and adjusted to 1 × 10⁸ CFU/mL. The inoculum size was 5 mL strain solution/100 g cabbage, and the mustard mixed with equivalent sterile water was used as the control. After incubation for 15 days at 37 °C, the total contents of BAs and nitrite were measured.
3. Results and Discussion
3.1. BAs Contents in FM Samples
It was reported that putrescine, tyramine, cadaverine, histamine and tryptamine constitute a major part of BA profiles in sauerkraut [6,15]. This study found six common BAs with different contents in FM samples (Table 3), including tryptamine (11.02–35.74 mg/kg), putrescine (3.79–39.71 mg/kg), cadaverine (0–97.92 mg/kg), histamine (1.43–213.13 mg/kg), tyramine (0–37.85 mg/kg), and spermidine (0–3.39 mg/kg). The total content of BAs ranged from 34.57 to 295.86 mg/kg. Lee, et al. [9] studied BAs in 13 sauerkraut samples. The contents of BAs in sauerkraut ranged as follows: tryptamine, not detected (0–15.95 mg/kg); β-phenylethylamine, (0–5.97 mg/kg); putrescine, (0–254.47 mg/kg); cadaverine, (0–123.29 mg/kg); histamine, (8.67–386.03 mg/kg); tyramine, (0–181.10 mg/kg); spermidine, (2.32–18.74 mg/kg); spermine, (0–33.84 mg/kg). Mayr and Schieberle [19] studied BAs in sauerkraut and found putrescine (108.9 mg/kg), tyramine (60.66 mg/kg) and histamine (37.01 mg/kg) as major parts. Cadaverine and spermidine were identified at lower levels 21.5 and 10.98 mg/kg, respectively, while spermine (1.2 mg/kg) was at a very low level. There are differences in distribution and content of BAs in fermented vegetables from different countries, which may be caused by variations in manufacturing methods, major ingredients and storage conditions of FM samples used in the current and previous studies.
Table 3.
Contents of BAs in FM samples. Data are presented as mean ±SDs of three replicates; ND means “not detected”. Different letters (a, b, c, etc.) indicate significantly different means at p < 0.05.
The total contents of BAs in fifteen FM samples were different. GZYY sample had the highest content of total BAs (259.86 mg/kg), especially tryptamine (35.74 mg/kg) and cadaverine (97.92 mg/kg). In contrast, SCYG sample showed the lowest concentration of total BAs (34.57 mg/kg), with cadaverine and spermidine not found. Excessive BAs will bring various harmful effects. Currently, there are no officially specified limits to BAs contents in fermented vegetables, whereas histamine is the only biogenic amine that is officially limited in fish products; it is regulated to be below 50 mg/kg by the US FDA [20]. However, several studies have suggested limits for BAs content in foods: 100 mg/kg for histamine, 100–800 mg/kg for tyramine and 1000 mg/kg for total content of BAs [9,21]. This study result indicated that the total content in all the samples was below the harmful level (1000 mg/kg), and samples were in the relative safe level on the whole. However, each BA has a different toxic level for humans. For example, histamine causes nausea, headache, hot flushes and skin rashes. Tyramine and tryptamine lead to migraine and hypertensive crises [22]. Furthermore, as shown in Table 3, 1 of 15 (6.67%) FM samples contained histamine whose level is higher than the limit (50 mg/kg) specified by the US FDA. Despite the existence of tryptamine and tyramine in most FM samples, their content was below the hazardous level (100 mg/kg). Peñas et al. [23] recommended maximum limits of 50 mg/kg and 25 mg/kg for putrescine and cadaverine, respectively. The concentration of putrescine in SCDS sample was over 25 mg/kg, and 8 of 15 (53.3%) samples had a higher level of cadaverine than this safe value, which might have a negative impact on human health. Thus, it is required to decrease the content of BAs in FM to improve safety.
3.2. Nitrite Contents in FM Samples
Figure 2 showed the concentrations of nitrite in 15 samples. GZYY sample had the highest nitrite content (64.09 mg/kg), followed by samples GZWY (59.18 mg/kg), SCDS (51.53 mg/kg) and FJCH (62.63 mg/kg). On the contrary, ZJHZ sample had the lowest nitrite concentration (32.24 mg/kg). Nitrite contents of different samples vary significantly. It was confirmed that the nitrite content increases as a result of microbial metabolism [24]. Certain strains of Lactobacillus brevis, Lactobacillus plantarum and Leuconostoc. Mesenteroides were found to be able to metabolize nitrite [25]. Furthermore, it was reported that enzymatic activity and microbial metabolism were influenced by some ingredients in fermented vegetables, such as salt, sugar, ginger and garlic, which could change the nitrite contents during the fermentation process [15].
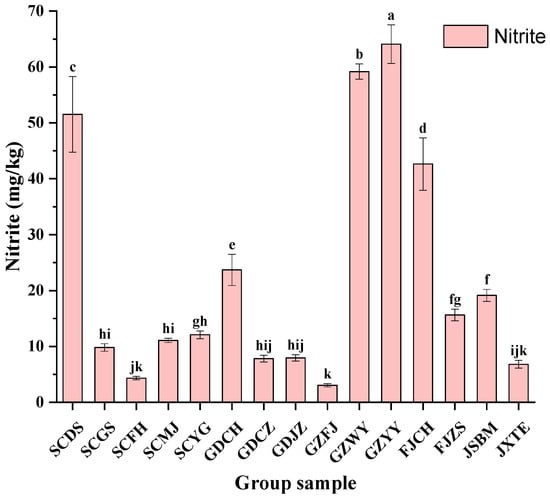
Figure 2.
Contents of nitrite in FM samples. Different letters (a, b, c, etc.) indicate significantly different means at p < 0.05.
According to National Food Safety Standard, the maximum limit for nitrite in fermented vegetables is 20 mg/kg. However, the nitrite contents in five FM samples (33.3%) exceeded the limit. Besides, the reaction between BAs and nitrite may produce nitrosamines with a well-known carcinogenic potential [26]. Therefore, controlling the content of BAs and nitrite is currently a top priority in China. The accumulation of BAs in fermented foods largely relies on the microorganisms that possess amino acids decarboxylases [27]. Similarly, the nitrate reductase catalyzing nitrite exists inside microorganisms [11]. Despite the great variation of BAs levels in fermented vegetables and the affection of vegetable varieties, fermentation conditions (pH, temperature, salt concentration, oxygen) and degree of microbiologic contamination, BAs and nitrite were significantly affected by complex microbial communities. Hence, evaluating the microbial communities and investigating their influence on BAs formation are especially important to control the BAs in FM samples.
3.3. Microbial Communities in FM Samples
As described above, contents of BAs and nitrite in FM samples vary largely, which probably results from diverse microbiological compositions. Thus, it is necessary to analyze the microbial communities in FM samples. By high-throughput sequencing, 1,236,107 16S rRNA (V3–V4 regions) and 1,258,811 ITS2 reads were generated from samples. After the quality control, 1,004,628 high-quality 16S rRNA gene sequences and 1,237,629 high-quality ITS gene sequences were obtained from each sample, with the average read length of 426 bp for bacteria and 211 bp for fungi. Alpha-diversity metrics (observed OTU, Chao1, Shannon and Good’s sample coverage) aim at evaluating richness and diversity of microbial communities (Table 4). Chao1 and Shannon indexes indicated microbial richness and diversity, respectively, throughout the samples. The Good’s coverage estimator was 99% for all samples, demonstrating that most bacterial and fungal phylotypes were found. SCYG sample had the maximum bacterial OTUs, and GDJZ sample had the highest fungal OTUs. Additionally, according to this study, the bacterial diversity was richer than that of fungi, manifesting that the bacteria were the most crucial microbial community in the fermentation process, which is consistent with previous reports [28].
Table 4.
Alpha diversity metrics of microbial community in FM samples.
As to bacteria (Figure 3A), Firmicutes was a major phylum in all FM samples, especially in FJCH, with the relative abundance up to 97.43%. Observed in all samples, Proteobacteria were a second major phylum in GDCH, JXTE and GDJZ samples and accounted for 40.51%, 24.04%, and 21.03% of the total phylum, respectively, as shown in previous reports. This result was similar to a previous study by Liu [29], in which proteobacteria and Firmicutes were the dominant phylum during the period of mustard fermentation. The abundance of Firmicutes increased and became a major phylum as fermentation progressed, with conversely decreasing Proteobacteria.
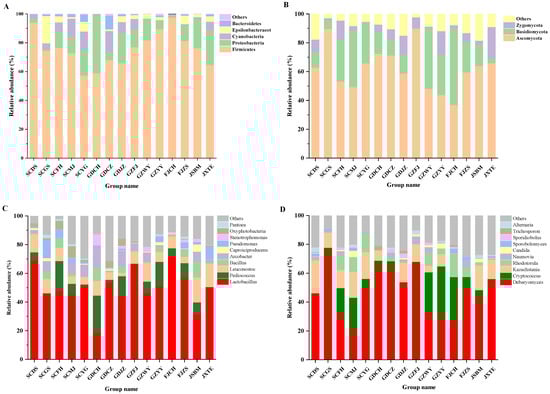
Figure 3.
Microbial community in FM samples. (A)Bacteria at the phylum level, (B) Fungi at the phylum level, (C) Bacteria at the genus level, (D) Fungi at the genus level.
At the genus level, Lactobacillus existed in all samples and was particularly enormous in FJCH, SCDS and GZFJ samples, accounting for up to 71.86%, 69.02% and 66.69% of total genus, respectively (Figure 3C). Lactobacillus, as the dominant lactic acid bacteria in fermented vegetables, could generate plenty of lactic acid to reduce the pH and enhance the acidity [29]. Besides, Pediococcus, Leuconostoc and bacillus were also widely distributed in FM samples, and are reported to be present in other traditionally fermented foods such as cheese, beer, wine, fermented soybeans [30] and Sichuan paocai [31]. Some strains of Pediococcus are reported to be able to grow under anaerobic conditions [32]. However, they were quite different from Korean kimchi whose dominant microbial communities are Leuconostoc, Weissella and Lactobacillus [33]. In fact, Leuconostoc and Weissella were not the main genera in the samples, possibly due to the influence of environmental factors, such as the concentration of salty water, fermentation period and temperature [15]. In addition, the genus Arcobacter was also highly abundant in some samples (GDCH, GDJZ, SCYG, etc.). Previous researchers have expressed that NaCl is beneficial to the growth of certain strains.
Figure 3B indicates the difference in fungal abundance in samples at phylum level. Ascomycota was the most abundant phylum in most FM samples, while Basidiomycota was the most popular phylum in FJCH sample. Both were reported to be the main fungi at phylum level in other types of traditionally fermented Chinese vegetables [32,34], which complies with this study. Figure 3D showed differences in fungal genera in various FM samples. Debaryomyces was the richest in most samples, probably due to its great tolerance to high concentration of NaCl and acid. Cryptococcus and Kazachstania were also the major fungi (≥20% in over one sample) in most samples. Cryptococcus was a ruling genus in samples GZYY (35.02%), FJCH (30.46%), GZWY (28.64%) and SCMJ (22.80%). Kazachstania was a prevailing genus in SCDS (22.80%) (Figure 3D). In addition, Candida and Sporobolomyces were found, even though they were reported to disappear rapidly during the later fermentation stage [35]. Both may include some opportunistic pathogenic strains and were usually related to many hospital-acquired infections [36]. Thus, consuming undercooked FM might have safety hazards.
Arcobacter. Vibrio has been found in salted cabbage or kimchi [37].
3.4. Correlations among Microbial Communities, Six Main BAs and Nitrite
Different microorganisms may produce varied amino acid decarboxylases which form different biogenic amines. Lactic acid bacteria (LAB) are the major microorganisms producing biogenic amines [38]. This paper studied the correlation between microbial communities and six main BAs in FM (Figure 4). The correlation between 10 genera and BAs in FM was positive, while the relation between another three genera and BAs was negative. Typtamine had a positive correlation (p < 0.001) with Lactobacillus (r = 0.72) & Pseudomonas (r = 0.72). Cadaverine and Leuconostoc (r = 0.89) showed the strongest positive correlation (p < 0.01). This result was similar to another two studies. Aflaki, F., et al. [39] found that Lactobacillus, Pediococcus and Leuconostoc are main producers of tryptamine or histamine in wine. Jin et al. found that typtamine and putrescine in Korean kimchi were produced mainly by Lactobacillus [40]. Besides, some new bacteria and fungi genera related to biogenic amines have been discovered, possibly resulting from the complicated production and accumulation of biogenic amines in fermented foods that are easily affected by various factors and their interactions.
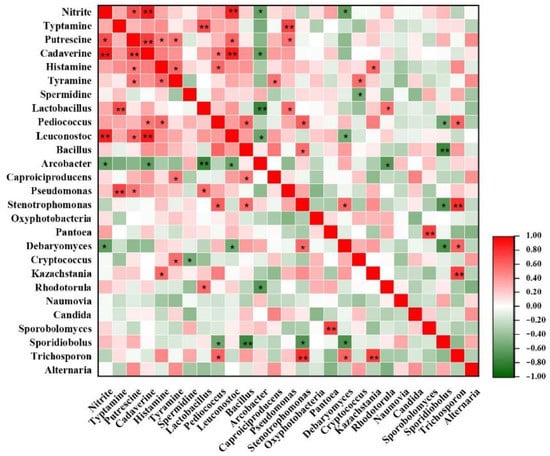
Figure 4.
Heatmap of correlations among biogenic amines (BAs), nitrate microbial community and in FM samples. The red and green colors represent positive (0 < r < 1) and negative (−1 < r < 0) correlation, respectively. *, p < 0.05; **, p < 0.01.
Nitrite and Leuconostoc (r = 0.87) showed a positive correlation (p < 0.01) (Figure 4). A previous study found that certain strains of Leuconostoc mesenteroides obtained from kimchi were capable of metabolizing nitrite. In addition, strains of Lactobacillus brevis and Lactobacillus plantarum were reported to be able to metabolize nitrite during FM fermentation [41], but the correlation between nitrate and Lactobacillus has not been found in this study. This possibly results from the dissimilarities of fermentation temperature and NaCl concentration in different FM samples, which also affects the content of nitrite.
3.5. Microbial Contribution to BAs and Nitrite Contents in FM
In view of the results of microbial diversity in FM samples, the SCYG, GZFJ, JXTE, GDCZ, GDJZ, JXTE, SCFH and GZFJ FM samples were utilized to isolate strains. Lactic acid bacteria (LAB) are the most important strain in the fermentation process, which affects the quality (flavor, texture, nutrition) through metabolism [42,43]. In order not to affect the quality, we first screened Lactobacillus from fermented mustard. Thirteen strains initially identified as LAB by Gram staining and hydrogen peroxide, which were named SC-1, SC-2, SC-3, SC-4, SC-5, JX-1, JX-2, JX-3, GD-1, GD-2, GZ-1, GZ-2, and GZ-3.
To further explore the microbial contribution to BAs and nitrite contents in FM, this study evaluated the BAs production and degradation capabilities of these isolated strains. The BAs and nitrite production capabilities of all isolated strains were identified in medium, supplemented with corresponding precursors, and the BAs and nitrite generated by different strains are shown in Table 5. Some strains could produce histamine, tyramine, tryptamine, β-phenethylamine or cadaverine from corresponding substrates. Specifically, SC-4 produced the highest content of total BAs (77.71 mg/kg), especially a relatively high level of tyramine (30.54 mg/kg). In contrast, GZ-2 produced only putrescine via corresponding substrates, and generated the least content of total BAs (4.65 mg/kg). Most isolated strains (excluding SC-1, JX-3 and GZ-2) could produce nitrite. Furthermore, this paper studied the degrading capabilities of such thirteen isolates (Table 5). Some strains, including SC-4, JX-1, JX-2 and GZ-2, showed the degradation capability of BAs. Moreover, GZ-2 was highly capable of degrading nitrite.
Table 5.
The BA-producing abilities of the isolated strains with corresponding precursor. Different letters (a, b, c, etc.) indicate significantly different means at p < 0.05.
3.6. The BAs and Nitrite Controlling Capacity of Selected Strains in FM Model
For the thirteen strains, GZ-2 and JX-3 showed a lower production capacity of BAs, but no nitrite producing ability (Table 5). SC-2 and GD-2 showed a high degradation rate of BAs and nitrite (Table 6). The 16S rDNA or ITS sequences were analyzed to identify these strains, and similarities of sequences of representative isolated strains are shown in Table 7. The result revealed that these strains were identified as Lactobacillus plantarum MLG5-1 (GZ-2); Lactobacillus sp. KLDS 1.0702 (JX-3); Lactobacillus brevis 6323 (SC-2); Leuconostoc carnosum JB16 (GD-2). Most of these strains are part of the dominant genera in FM.
Table 6.
The BA-degradation abilities of the isolated strains with corresponding precursor. Different letters (a, b, c, etc.) indicate significantly different means at p < 0.05.
Table 7.
16S rDNA sequences similarities of isolated strains with representative microbe.
The above four strains were possibly useful candidates to control the BAs, and the Lactobacillus and Leuconostoc strains were commonly used as the starter cultures in fermented meat products [44]. Thus, their BAs-controlling properties were assessed in a FM model. After the fifteen-day fermentation, the total contents of BAs and nitrite in the control sample without inoculation achieved 137.16 mg/kg and 38.79 mg/kg (Figure 5). After inoculation with GZ-2, JX-3, SC-2 and GD-2, total concentrations of BAs and nitrite were much lower than those of the control group (Figure 5). At the same time, the lowest BAs content (39.16 mg/kg) was identified in the FM inoculated with L. brevis SC-2, and the lowest nitrite content (16.34 mg/kg) was found in the FM inoculated with L. carnosum GD-2. Among the four strains, L. plantarum GZ-2, L. sp. JX-3 and L. brevis SC-2 were weakly capable of forming BAs, while L. plantarum GD-2 exhibited a higher capability of forming BAs (108.34 mg/kg) (Figure 5). The L. plantarum GZ-2 and L. carnosum GD-2 with a lower capacity of BAs and nitrite production were more beneficial to decrease the contents of BAs and nitrite in FM products (Figure 5). Therefore, L. plantarum GZ-2 and L. brevis SC-2 were highly capable of controlling BAs and nitrite during FM processing. Xia et al. [41] reported that Lactobacillus brevis AR123 could significantly quicken degradation of nitrite and shorten the fermentation period for fermented vegetables. Xia et al. [15] reported that the concentrations of BAs and nitrite in pickled cabbage inoculated with starter cultures of Lactobacillus plantarum were remarkably lower than those in the spontaneous fermentation system during the entire fermentation process. In addition, Rabie et al. [45] reported that upon inoculation with Lactobacillus plantarum 2142 in fermented vegetables, the total biogenic amine contents remained considerably lower than those of the control. All the above results indicate that there are strains of Lactobacillus plantarum and Lactobacillus brevis, which can degrade biogenic amine or nitrite. However, the degradation of BAs and nitrite with Leuconostoc carnosum in fermented vegetables was reported.
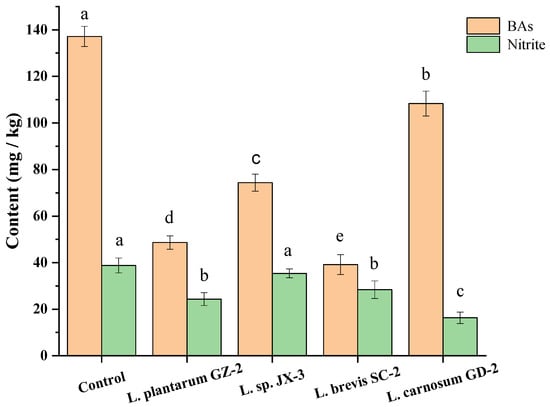
Figure 5.
BAs and nitrite contents in model fermented mustard product inoculated with different strains. Different letters (a, b, c, etc.) indicate significantly different means at p < 0.05.
4. Conclusions
In conclusion, the total BAs contents in all the fifteen FM samples were acceptable, while histamine and cadaverine were above the toxic level in some samples. Five samples contained nitrite with levels higher than the allowable limit (20 mg/kg). In addition, this paper studied bacterial and fungal communities by high-throughput sequencing analysis and identified correlations among microbes, BAs and nitrite. After the microbial community analysis, thirteen representative strains were chosen from the ruling microbial genera, and two Lactobacillus strains were identified to be beneficial to BAs control in the FM model. This study not only interpreted the microbial influence on BAs and nitrite accumulation in FM, but also provided potential starter cultures for BAs and nitrite control in the fermented meat products industry.
However, we recognize that this is a preliminary study. We only gained potential strains for BAs and nitrites control in FM products industry. In future, we will explore the intrinsic mechanisms by metagenomics and metabonomics, making clear the use of these strains for the reduction in BAs or nitrites in fermented mustard.
Author Contributions
Y.Y. (Yangyang Yu) and L.L. collected the data and wrote the manuscript; Y.X. reviewed the manuscript; K.A., Q.S. analyzed the data; Y.Y. (Yuanshan Yu) supervised the program; Z.X. designed the experiments. All authors have read and agreed to the published version of the manuscript.
Funding
This research was supported by Guangdong Provincial Key Research and Development Program (No. 2020B020220003), Science and Technology Plaining Project of Guangzhou (No. 202102021197), Science and Tech-nology Plaining Project of Guangzhou (No. 202102021197), Guangdong Provincial Agricultural Science and Technology Innovation and Extension Project (2020KJ101), Science and Technology Project of Yunnan Province (202002AE320006), Discipline team building projects of Guangdong Academy of Agricultural Sciences in the 14th Five-Year Period (No. 201604TD) and Guangzhou Science and Technology Project (No. 201903010045).
Institutional Review Board Statement
Not applicable.
Informed Consent Statement
Not applicable.
Data Availability Statement
The data presented in this study is contained within this article.
Conflicts of Interest
The authors declare that they have no competing interests.
Sample Availability
Samples of the fermented mustard in this study are available from the authors.
References
- Chen, A.-J.; Luo, W.; Peng, Y.-T.; Niu, K.-L.; Liu, X.-Y.; Shen, G.-H.; Zhang, Z.-Q.; Wan, H.; Luo, Q.-Y.; Li, S.-S. Quality and microbial flora changes of radish paocai during multiple fermentation rounds. Food Control 2019, 106, 106733. [Google Scholar] [CrossRef]
- Liu, A.; Li, X.; Pu, B.; Ao, X.; Zhou, K.; He, L.; Chen, S.; Liu, S. Use of psychrotolerant lactic acid bacteria (Lactobacillus spp. and Leuconostoc spp.) Isolated from Chinese Traditional Paocai for the Quality Improvement of Paocai Products. J. Agric. Food Chem. 2017, 65, 2580–2587. [Google Scholar] [CrossRef]
- Ruiz-Capillas, C.; Herrero, A.M. Impact of biogenic amines on food quality and safety. Foods 2019, 8, 62. [Google Scholar] [CrossRef] [Green Version]
- Park, Y.K.; Lee, J.H.; Mah, J.-H. Occurrence and reduction of biogenic amines in Kimchi and Korean fermented seafood products. Foods 2019, 8, 547. [Google Scholar] [CrossRef] [Green Version]
- Lee, S.; Yoo, M.; Shin, D. The identification and quantification of biogenic amines in Korean turbid rice wine, Makgeolli by HPLC with mass spectrometry detection. LWT-Food Sci. Technol. 2015, 62, 350–356. [Google Scholar] [CrossRef]
- Świder, O.; Roszko, M.Ł.; Wójcicki, M.; Szymczyk, K. Biogenic Amines and Free Amino Acids in Traditional Fermented Vegetables—Dietary Risk Evaluation. J. Agric. Food Chem. 2020, 68, 856–868. [Google Scholar] [CrossRef] [PubMed]
- Feddern, V.; Mazzuco, H.; Fonseca, F.N.; de Lima, G.J.M.M. A review on biogenic amines in food and feed: Toxicological aspects, impact on health and control measures. Anim. Prod. Sci. 2019, 59, 608–618. [Google Scholar] [CrossRef]
- Brink, B.T.; Damink, C.T.; Joosten, H.; Veld, J.H.H.I.T. Occurrence and formation of biologically active amines in foods. Int. J. Food Microbiol. 1990, 11, 73–84. [Google Scholar] [CrossRef]
- Lee, J.-H.; Jin, Y.H.; Park, Y.K.; Yun, S.J.; Mah, J.-H. Formation of Biogenic Amines in Pa (Green Onion) Kimchi and Gat (Mustard Leaf) Kimchi. Foods 2019, 8, 109. [Google Scholar] [CrossRef] [Green Version]
- Yang, H.; Zou, H.; Qu, C.; Zhang, L.; Liu, T.; Wu, H.; Li, Y. Dominant Microorganisms during the Spontaneous Fermentation of Suan Cai, a Chinese Fermented Vegetable. Food Sci. Technol. Res. 2014, 20, 915–926. [Google Scholar] [CrossRef] [Green Version]
- Ding, Z.; Johanningsmeier, S.D.; Price, R.; Reynolds, R.; Truong, V.-D.; Payton, S.C.; Breidt, F. Evaluation of nitrate and nitrite contents in pickled fruit and vegetable products. Food Control 2018, 90, 304–311. [Google Scholar] [CrossRef]
- Huang, T.-T.; Wu, Z.-Y.; Zhang, W.-X. Effects of garlic addition on bacterial communities and the conversions of nitrate and nitrite in a simulated pickle fermentation system. Food Control 2020, 113, 107215. [Google Scholar] [CrossRef]
- Bollenbach, A.; Hanff, E.; Tsikas, D. Investigation of NG-hydroxy-l-arginine interference in the quantitative determination of nitrite and nitrate in human plasma and urine by GC-NICI-MS. J. Chromatogr. B 2018, 1100–1101, 174–178. [Google Scholar] [CrossRef] [PubMed]
- Peng, T.; Hu, Z.; Yang, X.; Gao, Y.; Ma, C. Nitrite-induced acute kidney injury with secondary hyperparathyroidism: Case report and literature review. Medicine 2018, 97, 63–67. [Google Scholar] [CrossRef] [PubMed]
- Liu, L.; Du, P.; Zhang, G.; Mao, X.; Zhao, Y.; Wang, J.; Duan, C.; Li, C.; Li, X. Residual nitrite and biogenic amines of traditional northeast sauerkraut in China. Int. J. Food Prop. 2017, 20, 2448–2455. [Google Scholar] [CrossRef] [Green Version]
- Wang, C.; Ma, Y.; Chen, M.; Wang, Y.; Lei, S.; Li, F.; Liu, D. Effect of pH on Nitrite Reduction of Pickled Chinese Cabbage. In Proceedings of the 2010 4th International Conference on Bioinformatics and Biomedical Engineering, Chengdu, China, 18–20 June 2010; pp. 1–4. [Google Scholar]
- Li, L.; Zou, D.; Ruan, L.; Wen, Z.; Chen, S.; Xu, L.; Wei, X. Evaluation of the Biogenic Amines and Microbial Contribution in Traditional Chinese Sausages. Front. Microbiol. 2019, 10, 1–11. [Google Scholar] [CrossRef] [PubMed] [Green Version]
- Li, L.; Ruan, L.; Ji, A.; Wen, Z.; Chen, S.; Wang, L.; Wei, X. Biogenic amines analysis and microbial contribution in traditional fermented food of Douchi. Sci. Rep. 2018, 8, 12567–12573. [Google Scholar] [CrossRef] [PubMed] [Green Version]
- Mayr, C.M.; Schieberle, P. Development of stable isotope dilution assays for the simultaneous quantitation of biogenic amines and polyamines in foods by LC-MS/MS. J. Agric. Food Chem. 2012, 60, 3026–3032. [Google Scholar] [CrossRef]
- Food and Drug Administration. Fish and Fishery Products Hazards and Controls Guidance; Food and Drug Administration: Washington, DC, USA, 2011.
- Kim, B.; Byun, B.Y.; Mah, J.-H. Biogenic amine formation and bacterial contribution in Natto products. Food Chem. 2012, 135, 2005–2011. [Google Scholar] [CrossRef] [PubMed]
- Del Rio, B.; Redruello, B.; Linares, D.M.; Ladero, V.; Fernandez, M.; Martin, M.C.; Ruas-Madiedo, P.; Alvarez, M.A. The dietary biogenic amines tyramine and histamine show synergistic toxicity towards intestinal cells in culture. Food Chem. 2017, 218, 249–255. [Google Scholar] [CrossRef]
- Peñas, E.; Frias, J.; Sidro, B.; Vidal-Valverde, C. Impact of fermentation conditions and refrigerated storage on microbial quality and biogenic amine content of sauerkraut. Food Chem. 2010, 123, 143–150. [Google Scholar] [CrossRef]
- Yan, P.; Chai, Z.; Chang, X.; Zhao, W.; Yue, H.; Zhang, T. Screening and identification of microorganism degrading nitrite in Chinese sauerkraut. Agro Food Ind. Hi-tech 2015, 26, 20–23. [Google Scholar]
- Yu, S.M.; Zhang, Y. Effects of Lactic Acid Bacteria on Nitrite Degradation during Pickle Fermentation. Adv. Mater. Res. 2013, 781–784, 1656–1660. [Google Scholar] [CrossRef]
- Guarcello, R.; De Angelis, M.; Settanni, L.; Formiglio, S.; Gaglio, R.; Minervini, F.; Moschetti, G.; Gobbetti, M. Selection of Amine-Oxidizing Dairy Lactic Acid Bacteria and Identification of the Enzyme and Gene Involved in the Decrease of Biogenic Amines. Appl. Environ. Microbiol. 2016, 82, 6870–6880. [Google Scholar] [CrossRef] [Green Version]
- Gu, J.; Liu, T.; Hou, J.; Pan, L.; Sadiq, F.A.; Yuan, L.; Yang, H.; He, G. Analysis of bacterial diversity and biogenic amines content during the fermentation processing of stinky tofu. Food Res. Int. 2018, 111, 689–698. [Google Scholar] [CrossRef] [PubMed]
- Wu, R.; Yu, M.; Liu, X.; Meng, L.; Wang, Q.; Xue, Y.; Wu, J.; Yue, X. Changes in flavour and microbial diversity during natural fermentation of suan-cai, a traditional food made in Northeast China. Int. J. Food Microbiol. 2015, 211, 23–31. [Google Scholar] [CrossRef]
- Xiong, T.; Li, X.; Guan, Q.; Peng, F.; Xie, M. Starter culture fermentation of Chinese sauerkraut: Growth, acidification and metabolic analyses. Food Control 2014, 41, 122–127. [Google Scholar] [CrossRef]
- Chen, Y.-H.; Liu, X.-W.; Huang, J.-L.; Baloch, S.; Xu, X.; Pei, X.-F. Microbial diversity and chemical analysis of Shuidouchi, traditional Chinese fermented soybean. Food Res. Int. 2019, 116, 1289–1297. [Google Scholar] [CrossRef]
- Cao, J.; Yang, J.; Hou, Q.; Xu, H.; Zheng, Y.; Zhang, H.; Zhang, L. Assessment of bacterial profiles in aged, home-made Sichuan paocai brine with varying titratable acidity by PacBio SMRT sequencing technology. Food Control 2017, 78, 14–23. [Google Scholar] [CrossRef]
- Liang, H.; Chen, H.; Zhang, W.; Yu, C.; Ji, C.; Lin, X. Investigation on microbial diversity of industrial Zhacai paocai during fermentation using high-throughput sequencing and their functional characterization. LWT-Food Sci. Technol. 2018, 91, 460–466. [Google Scholar] [CrossRef]
- Park, E.-J.; Chun, J.; Cha, C.-J.; Park, W.-S.; Jeon, C.O.; Bae, J.-W. Bacterial community analysis during fermentation of ten representative kinds of kimchi with barcoded pyrosequencing. Food Microbiol. 2012, 30, 197–204. [Google Scholar] [CrossRef] [PubMed]
- Xiao, Y.; Xiong, T.; Peng, Z.; Liu, C.; Huang, T.; Yu, H.; Xie, M. Correlation between microbiota and flavours in fermentation of Chinese Sichuan Paocai. Food Res. Int. 2018, 114, 123–132. [Google Scholar] [CrossRef] [PubMed]
- Liu, Z.; Li, J.; Wei, B.; Huang, T.; Xiao, Y.; Peng, Z.; Xie, M.; Xiong, T. Bacterial community and composition in Jiang-shui and Suan-cai revealed by high-throughput sequencing of 16S rRNA. Int. J. Food Microbiol. 2019, 306, 108271–108282. [Google Scholar] [CrossRef] [PubMed]
- Devi, K.R.; Srinivasan, S.; Ravi, A.V. Inhibition of quorum sensing-mediated virulence in Serratia marcescens by Bacillus subtilis R-18. Microb. Pathog. 2018, 120, 166–175. [Google Scholar] [CrossRef] [PubMed]
- Hong, Y.; Yang, H.S.; Li, J.; Han, S.K.; Chang, H.C.; Kim, H.Y. Identification of lactic acid bacteria in salted Chinese cabbage by SDS-PAGE and PCR-DGGE. J. Sci. Food Agric. 2014, 94, 296–300. [Google Scholar] [CrossRef]
- Kirschbaum, J.; Rebscher, K.; Brückner, H. Liquid chromatographic determination of biogenic amines in fermented foods after derivatization with 3, 5-dinitrobenzoyl chloride. J. Chromatogr. A 2000, 881, 517–530. [Google Scholar] [CrossRef]
- Aflaki, F.; Ghoulipour, V.; Saemian, N.; Salahinejad, M. A simple method for benzoyl chloride derivatization of biogenic amines for high performance liquid chromatography. Anal. Methods 2014, 6, 1482–1487. [Google Scholar] [CrossRef]
- Jin, Y.H.; Lee, J.H.; Park, Y.K.; Lee, J.-H.; Mah, J.-H. The occurrence of biogenic amines and determination of biogenic amine-producing lactic acid bacteria in Kkakdugi and Chonggak kimchi. Foods 2019, 8, 73. [Google Scholar] [CrossRef] [Green Version]
- Xia, Y.; Liu, X.; Wang, G.; Zhang, H.; Xiong, Z.; Sun, Y.; Ai, L. Characterization and selection of Lactobacillus brevis starter for nitrite degradation of Chinese pickle. Food Control 2017, 78, 126–131. [Google Scholar] [CrossRef]
- Ashaolu, T.J.; Reale, A. A Holistic Review on Euro-Asian Lactic Acid Bacteria Fermented Cereals and Vegetables. Microorganisms 2020, 8, 1176. [Google Scholar] [CrossRef] [PubMed]
- Torres, S.; Verón, H.; Contreras, L.; Isla, M.I. An overview of plant-autochthonous microorganisms and fermented vegetable foods. Food Sci. Hum. Wellness 2020, 9, 112–123. [Google Scholar] [CrossRef]
- Kim, S.H.; Kim, S.H.; Kang, K.H.; Lee, S.; Kim, S.J.; Kim, J.G.; Chung, M.J. Kimchi probiotic bacteria contribute to reduced amounts of N-nitrosodimethylamine in lactic acid bacteria-fortified kimchi. LWT-Food Sci. Technol. 2017, 84, 196–203. [Google Scholar] [CrossRef]
- Rabie, M.A.; Siliha, H.; Saidy, S.; Badawy, A.A.; Malcata, F.X. Reduced biogenic amine contents in sauerkraut via addition of selected lactic acid bacteria. Food Chem. 2011, 129, 1778–1782. [Google Scholar] [CrossRef]
Publisher’s Note: MDPI stays neutral with regard to jurisdictional claims in published maps and institutional affiliations. |
© 2021 by the authors. Licensee MDPI, Basel, Switzerland. This article is an open access article distributed under the terms and conditions of the Creative Commons Attribution (CC BY) license (https://creativecommons.org/licenses/by/4.0/).