
Microwave-Assisted Extraction and HPLC-UV-CD Determination of (S)-usnic Acid in Cladonia foliacea


 ,
,  , ,
, , 
 and
and 
Abstract
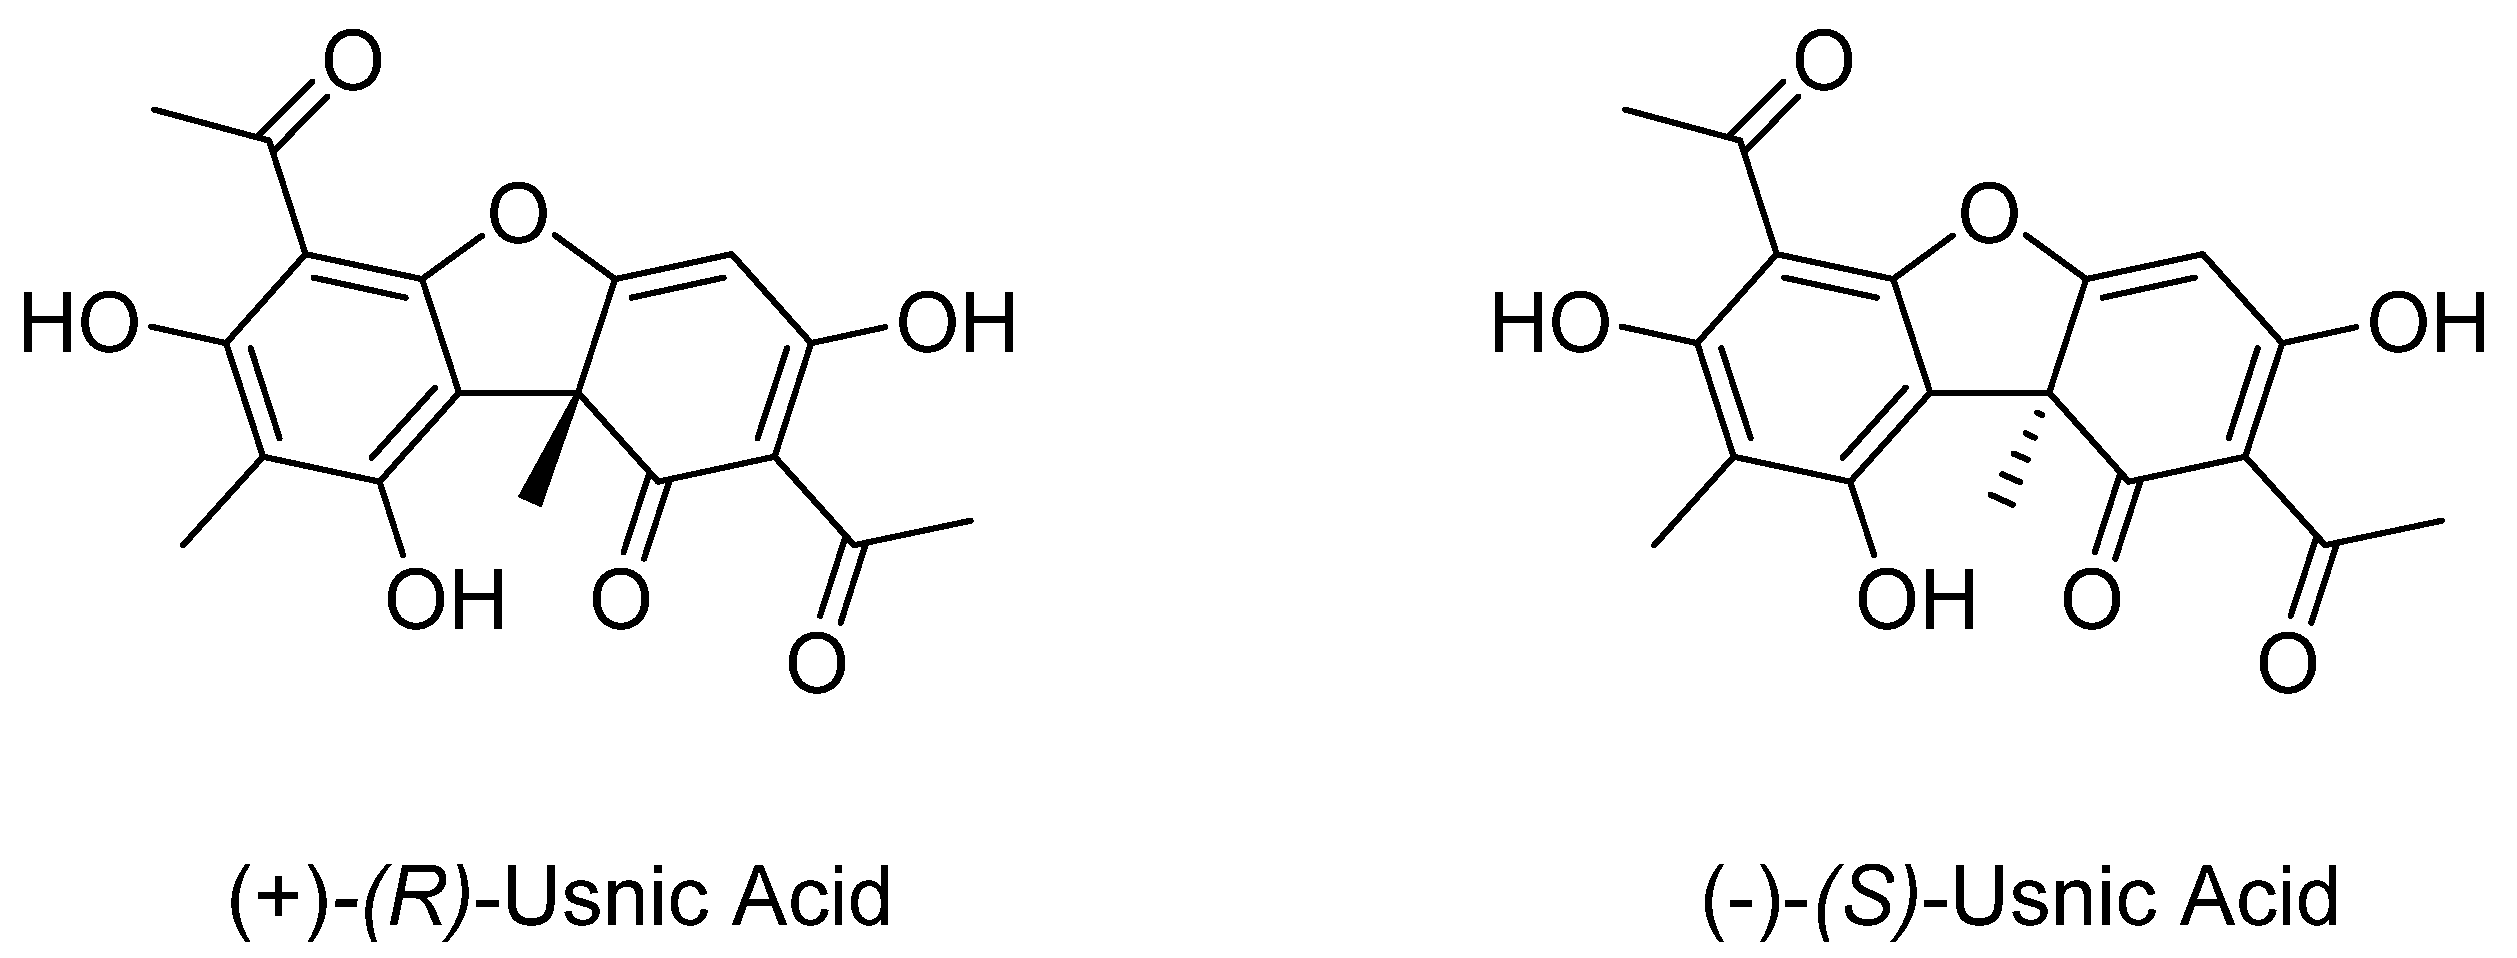
1. Introduction
2. Results
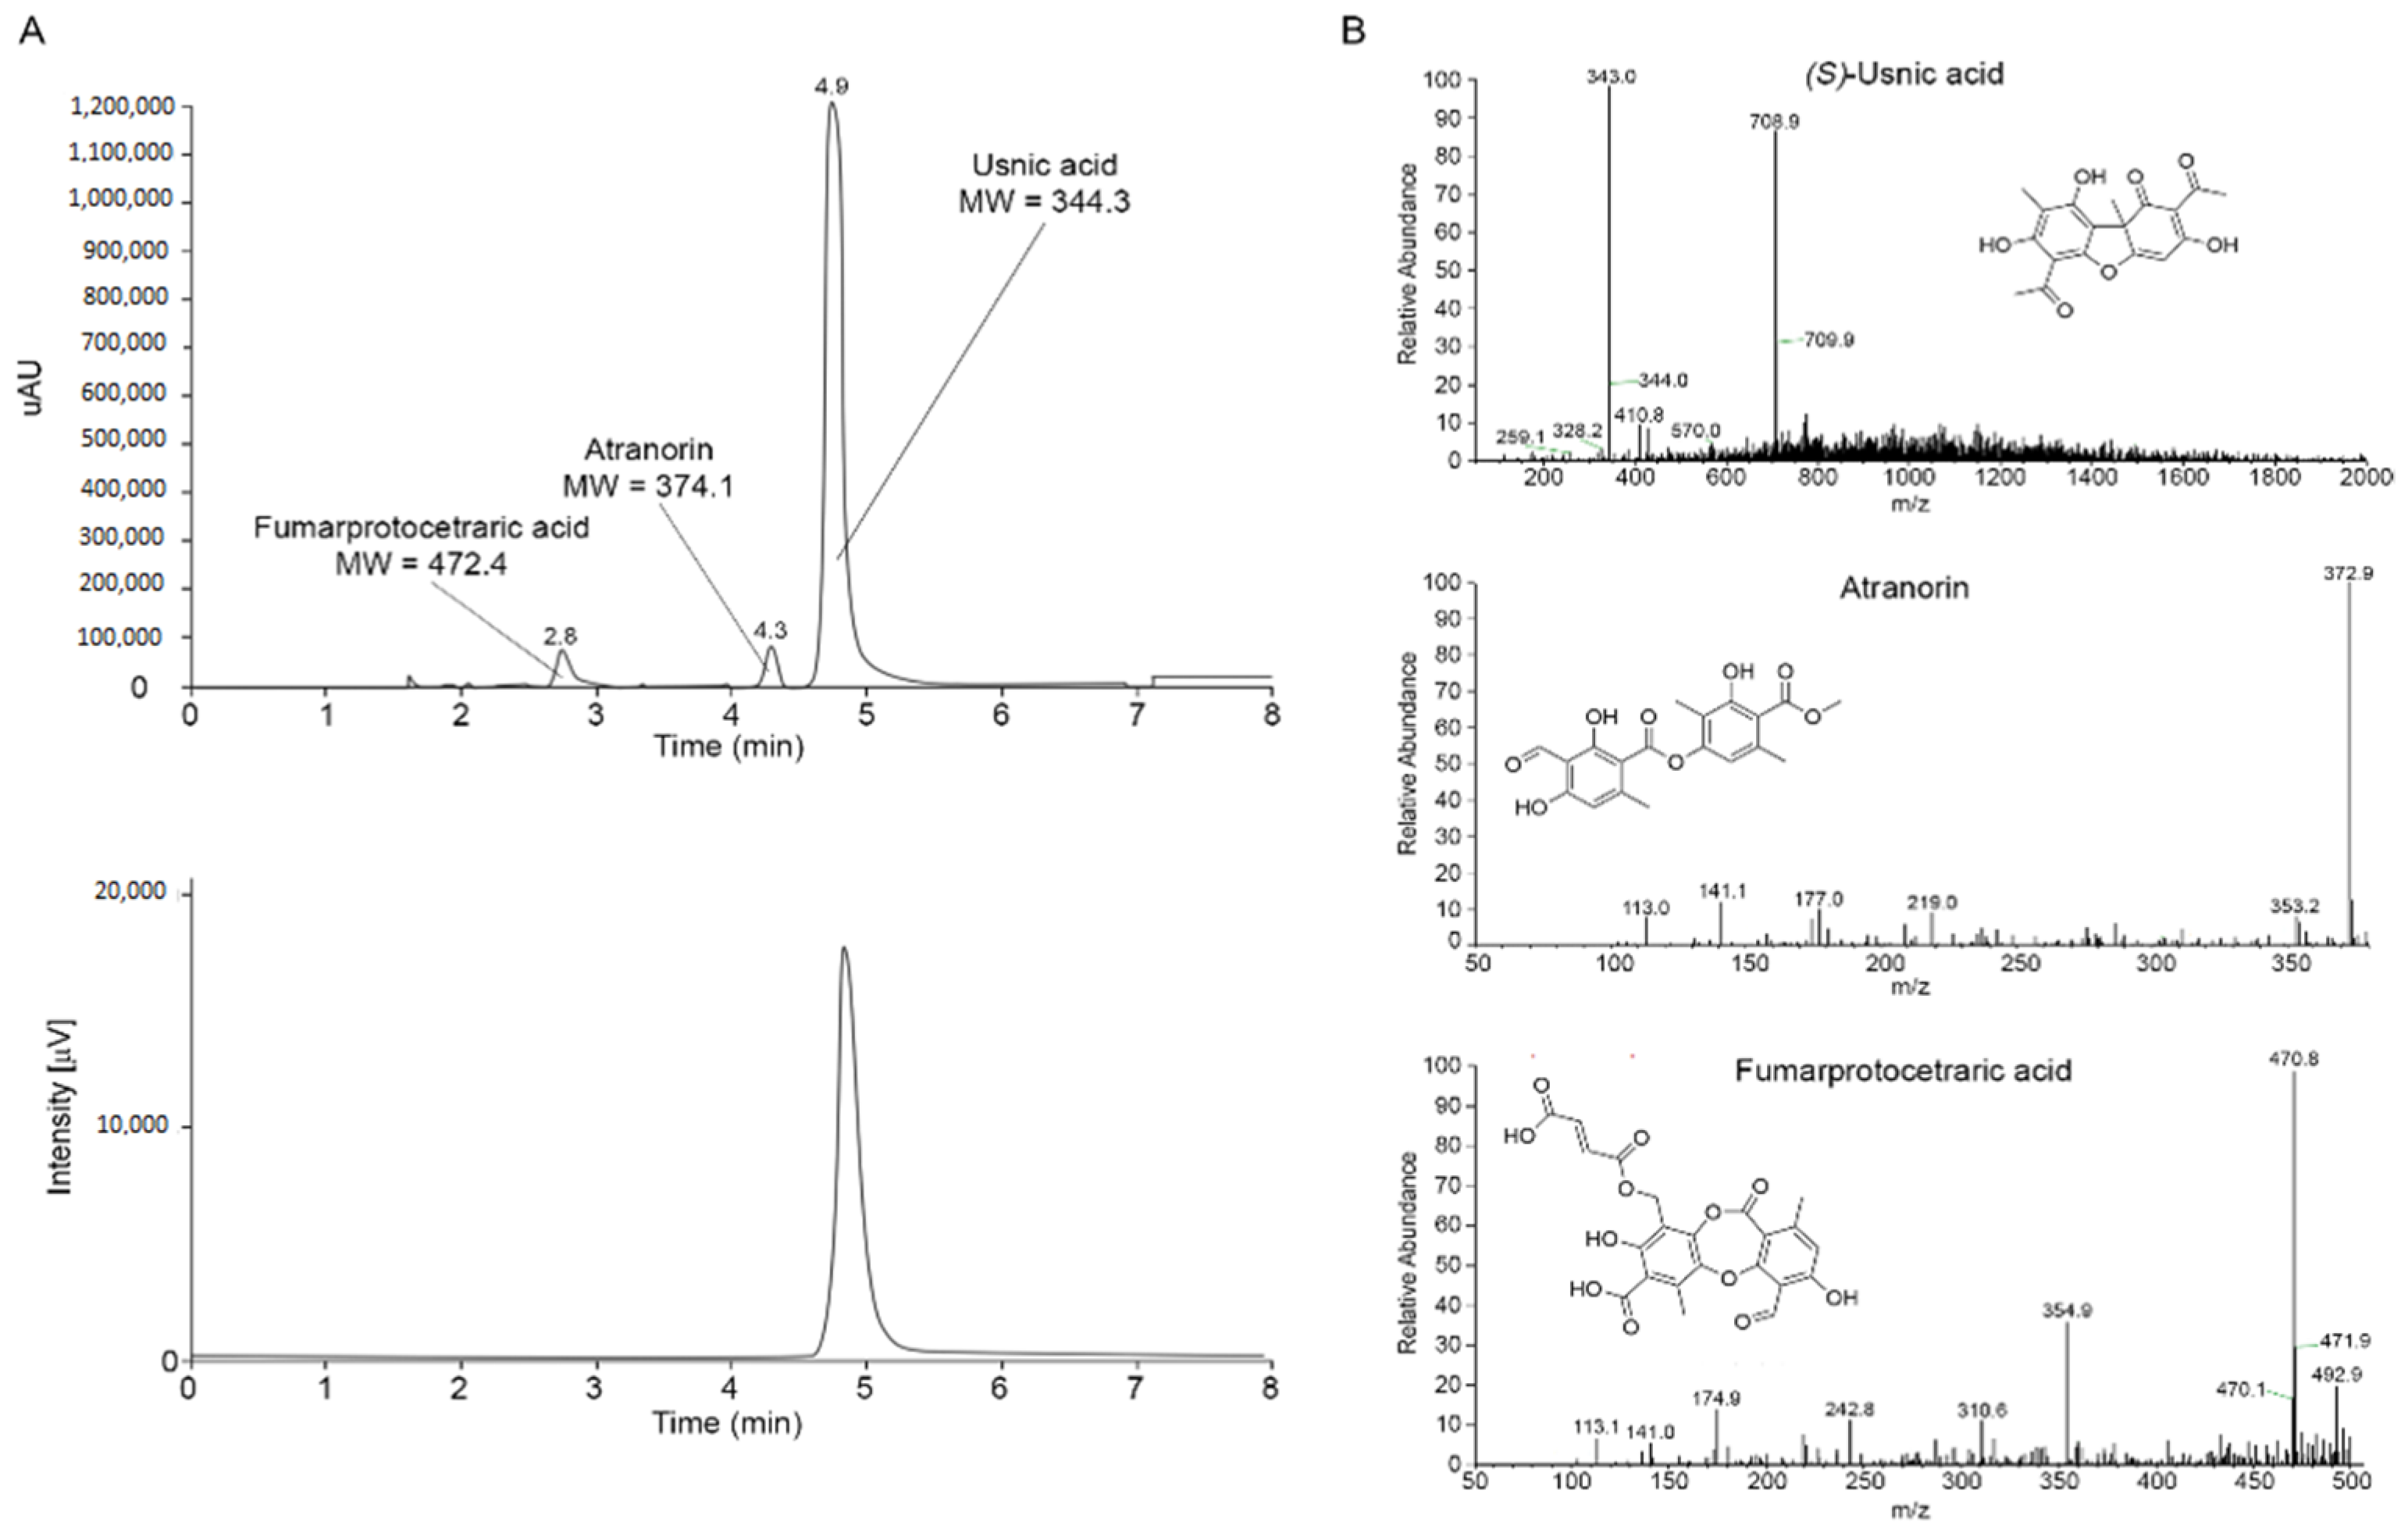
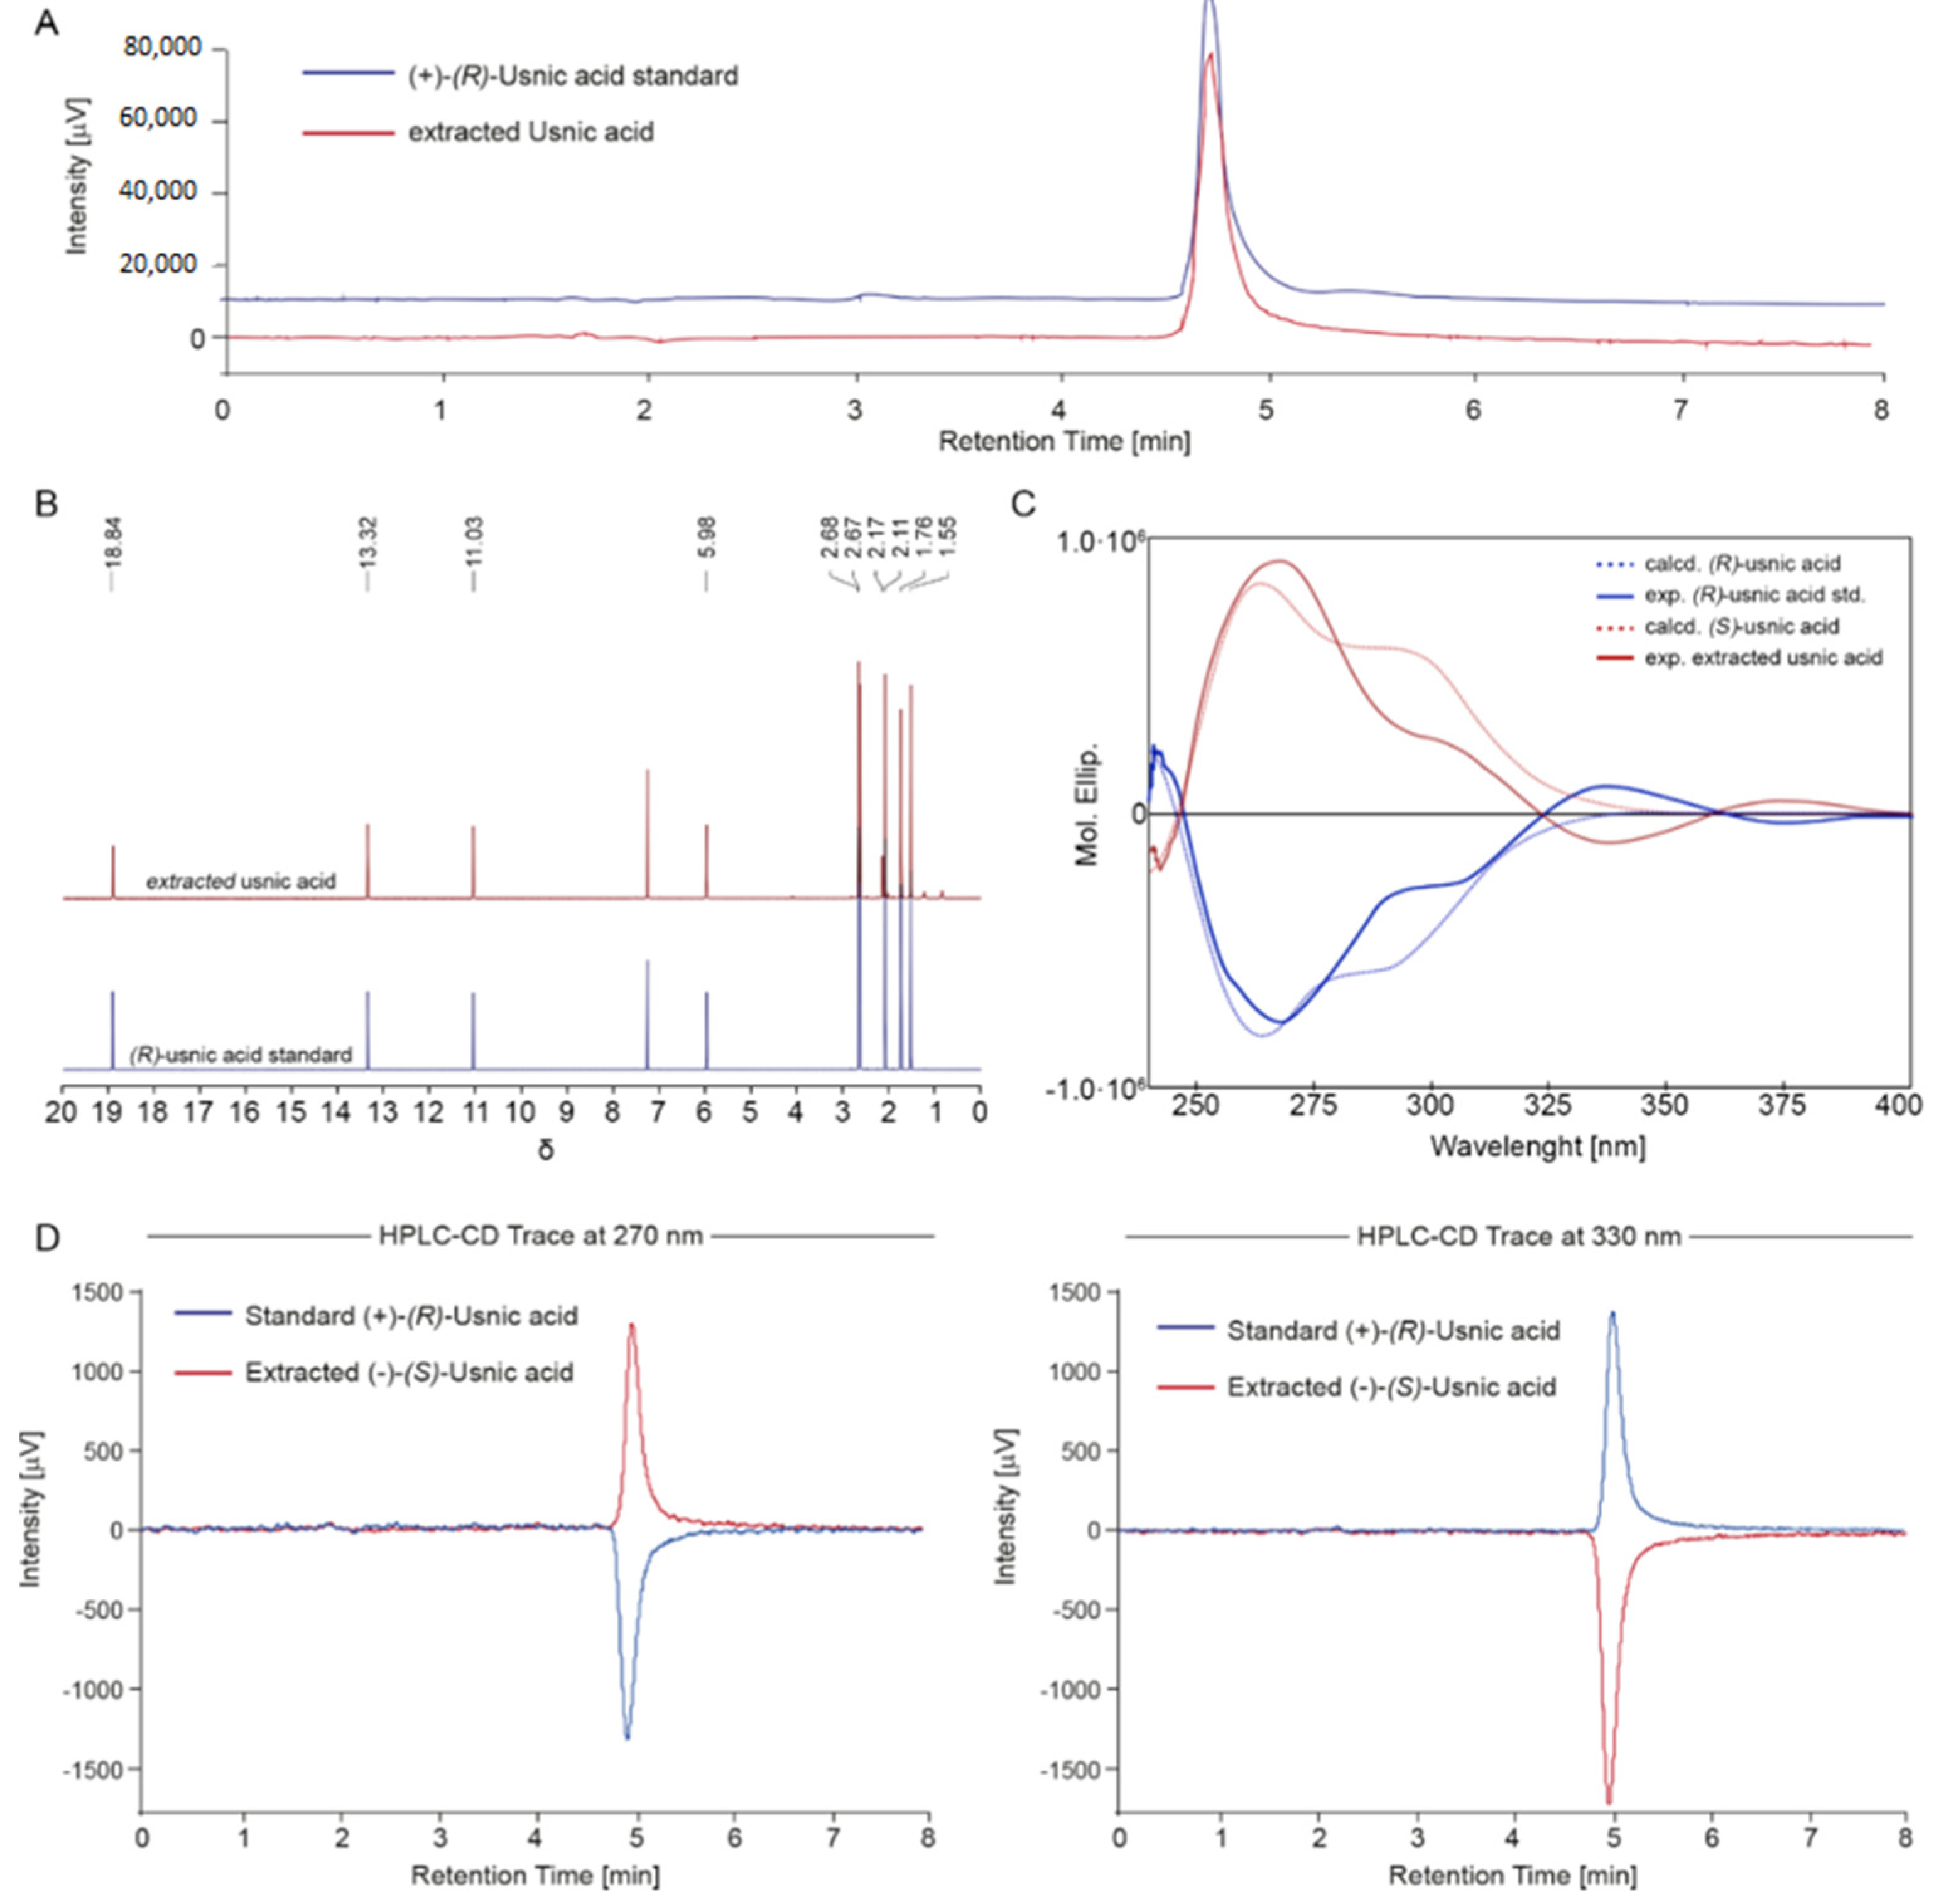
2.1. Isolation and Characterization of the Main Metabolites Present in C. foliacea Extract
2.2. Microwave-Assisted Extraction (MAE) Protocol
3. Materials and Methods
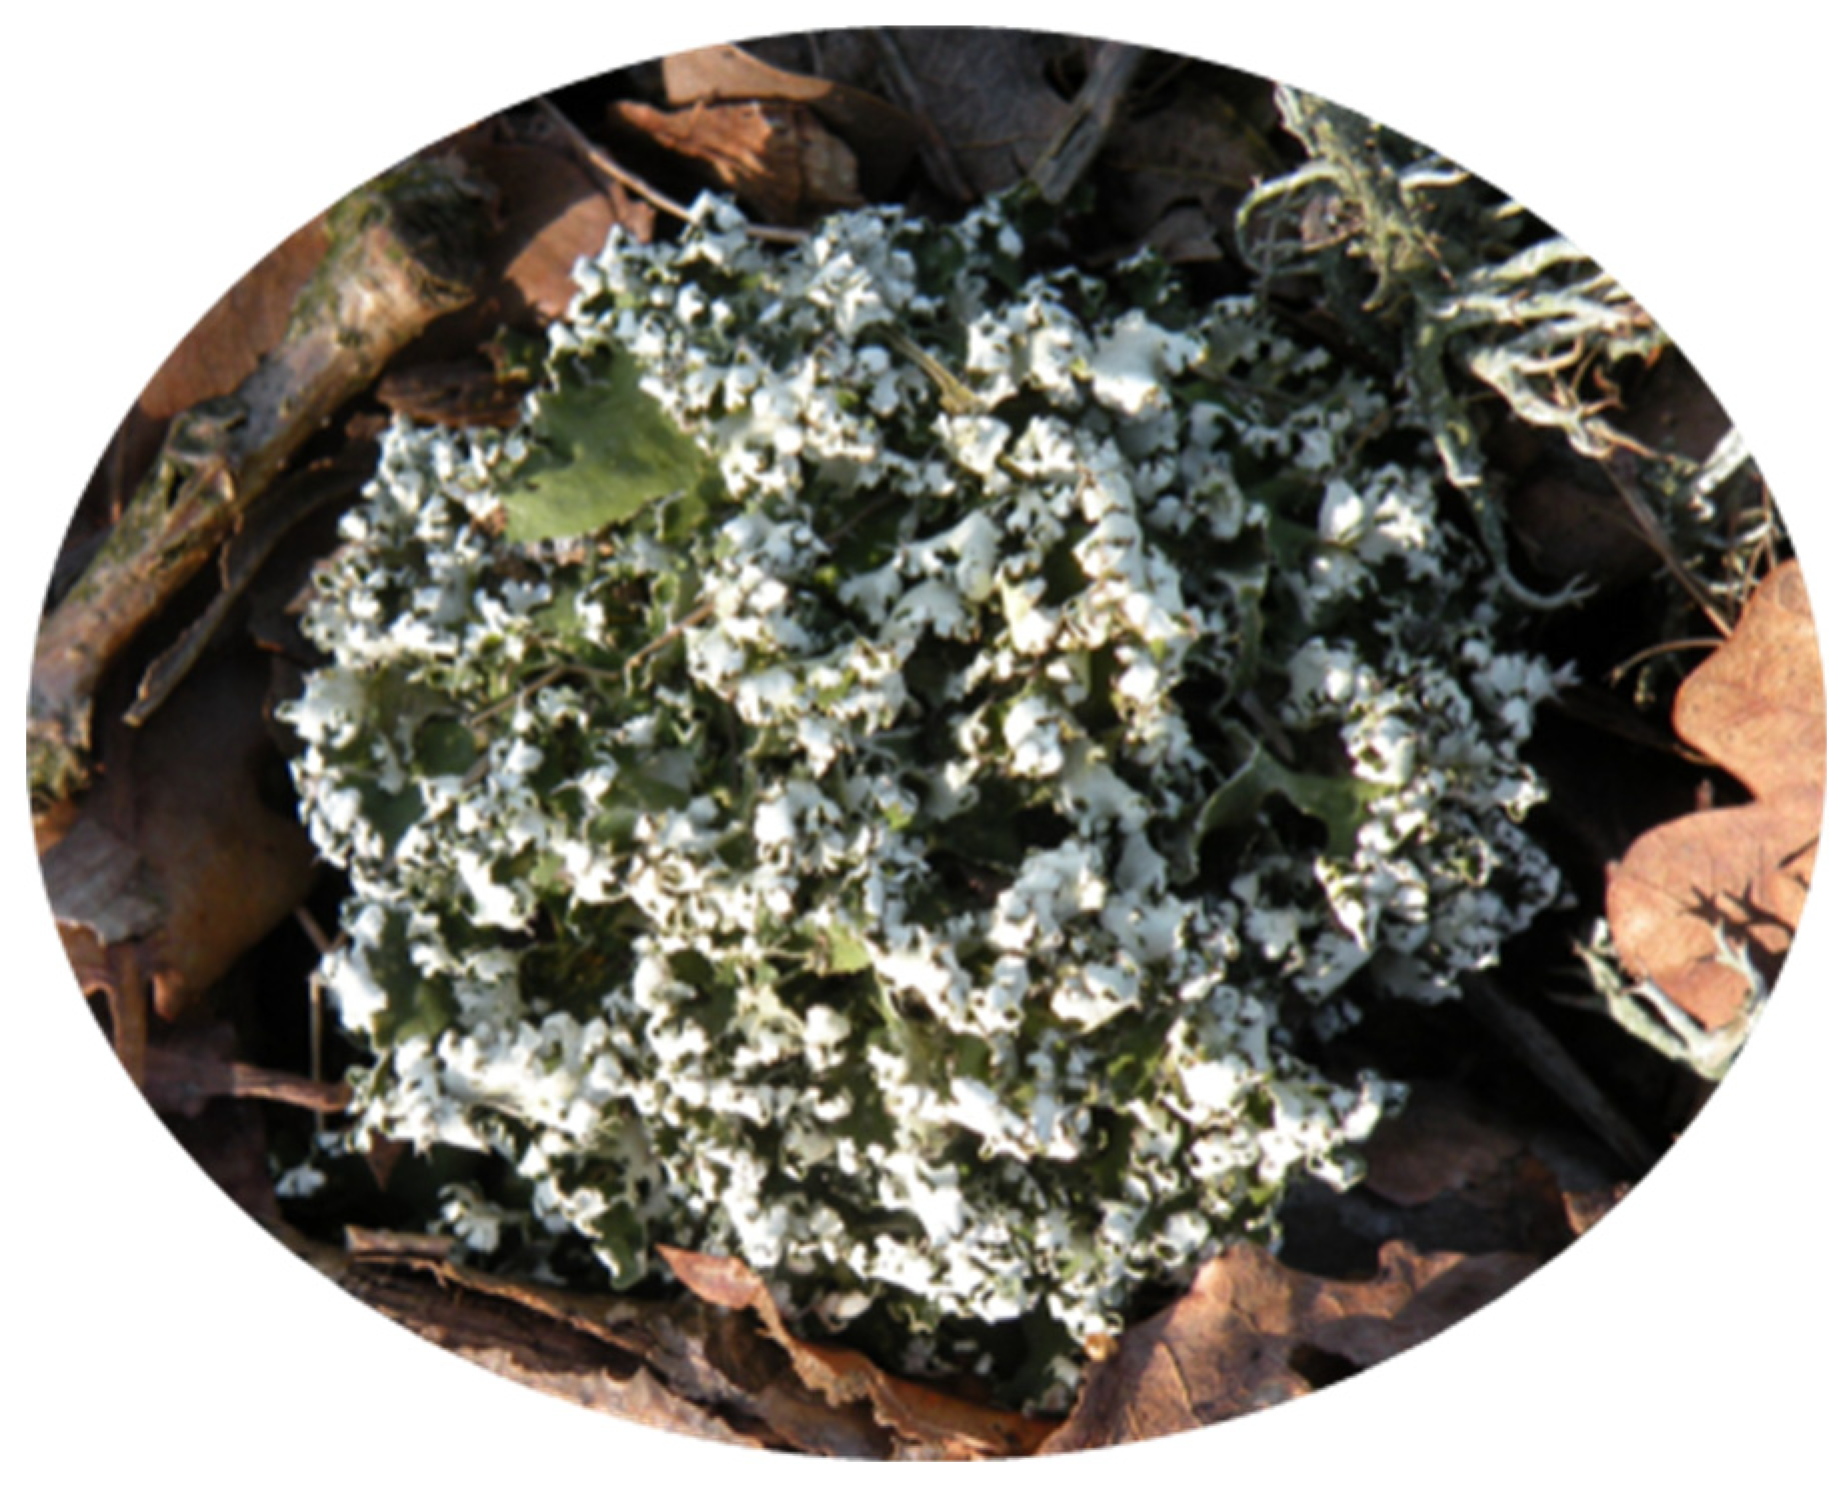
3.1. Lichen Material
3.2. Chemicals
3.3. Instruments
3.4. Isolation and Identification of Main Metabolites
3.4.1. Isolation and Identification of Main Metabolites
3.4.2. HPLC-UV/PAD-CD and HPLC-UV/PAD-ESI/MS Analysis
3.4.3. Electronic Circular Dichroism
3.4.4. Computer-Assisted Conformational Analyses and ECD Calculations
3.4.5. Quantitative Determination of (−)-(S)-UA in the Extract
3.4.6. Experimental Design of the Extraction Procedure
3.5. Experimental Design Analysis and Extraction Efficiency Enhancement
4. Conclusions
Supplementary Materials
Author Contributions
Funding
Data Availability Statement
Acknowledgments
Conflicts of Interest
Sample Availability
References
- Bonny, S.; Hitti, E.; Boustie, J.; Bernard, A.; Tomasi, S. Optimization of a microwave-assisted extraction of secondary metabolites from crustose lichens with quantitative spectrophoto densitometry analysis. J. Chromatogr. A 2009, 1216, 7651–7656. [Google Scholar] [CrossRef]
- Malhotra, S.; Subban, R.; Singh, A. lichens-role in traditional medicine and drug discovery. Inter. J. Altern. Med. 2007, 5, 1–6. [Google Scholar]
- Weissbuch, B.K. Medicinal Lichens: The Final Frontier. J. Am. Herb. Guild 2014, 12, 23–28. [Google Scholar]
- Freysdottir, J.; Omarsdottir, S.; Ingólfsdóttir, K.; Vikingsson, A.; Olafsdottir, E.S. In vitro and in vivo immunomodulating effects of traditionally prepared extract and purified compounds from Cetraria islandica. Int. Immunopharmacol. 2008, 8, 423–430. [Google Scholar] [CrossRef] [PubMed]
- Ingólfsdóttir, K.; Wiedemann, B.; Birgisdóttir, M.; Nenninger, A.; Jónsdóttir, S.; Wagner, H. Inhibitory effects of baeomycesic acid from the lichen Thamnolia subuliformis on 5-lipoxygenase in vitro. Phytomedicine 1997, 4, 125–128. [Google Scholar] [CrossRef]
- Martins, M.; Silva, M.; Silva, H.; Silva, L.; Albuquerque, M.; Aires, A.; Falcão, E.; Pereira, E.; de Melo, A.; da Silva, N. Barbatic acid offers a new possibility for control of biomphalaria glabrata and schistosomiasis. Molecules 2017, 22, 568. [Google Scholar] [CrossRef] [PubMed]
- Jeon, Y.J.; Kim, S.; Kim, J.H.; Youn, U.J.; Suh, S.S. The comprehensive roles of ATRANORIN, A secondary metabolite from the antarctic lichen Stereocaulon caespitosum, in HCC tumorigenesis. Molecules 2019, 24, 1414. [Google Scholar] [CrossRef]
- Foden, F.R.; McCormick, J.; O’Mant, D.M. Vulpinic acids as potential antiinflammatory agents. 1. Vulpinic acids with substituents in the aromatic ring. J. Med. Chem. 1975, 18, 199–203. [Google Scholar] [CrossRef]
- Kumar, K.C.S.; Müller, K. Depsides as non-redox inhibitors of leukotriene B4 biosynthesis and HaCaT cell growth. 2. Novel analogs of obtusatic acid. Eur. J. Med. Chem. 2000, 35, 405–411. [Google Scholar] [CrossRef]
- Galanty, A.; Paśko, P.; Podolak, I. Enantioselective activity of usnic acid: A comprehensive review and future perspectives. Phytochem. Rev. 2019, 18, 527–548. [Google Scholar] [CrossRef]
- Luzina, O.A.; Salakuthdinov, N.F. Usnic acid and its derivatives for pharmaceutical use: A patent review (2000–2017). Expert Opin. Ther. Pat. 2018, 28, 477–491. [Google Scholar] [CrossRef] [PubMed]
- Luzina, O.; Filimonov, A.; Zakharenko, A.; Chepanova, A.; Zakharova, O.; Ilina, E.; Dyrkheeva, N.; Likhatskaya, G.; Salakhutdinov, N.; Lavrik, O. Usnic Acid conjugates with monoterpenoids as potent Tyrosyl-DNA phosphodiesterase 1 Inhibitors. J. Nat. Prod. 2020, 83, 2320–2329. [Google Scholar] [CrossRef] [PubMed]
- Shi, C.-J.; Peng, W.; Zhao, J.H.; Yang, H.L.; Qu, L.L.; Wang, C.; Kong, L.Y.; Wang, X.B. Usnic acid derivatives as tau-aggregation and neuroinflammation inhibitors. Eur. J. Med. Chem. 2020, 187, 111961. [Google Scholar] [CrossRef] [PubMed]
- Mallavadhani, U.V.; Vanga, N.R.; Rao, K.B.; Jain, N. Synthesis and antiproliferative activity of novel (+)- usnic acid analogues. J. Asian Nat. Prod. Res. 2020, 22, 562–577. [Google Scholar] [CrossRef] [PubMed]
- Luzina, O.A.; Sokolov, D.N.; Pokrovskii, M.A.; Pokrovskii, A.G.; Bekker, O.B.; Danilenko, V.N.; Salakhutdinov, N.F. Synthesis and Biological Activity of Usnic Acid Enamine Derivatives. Chem. Nat. Compd. 2015, 51, 646–651. [Google Scholar] [CrossRef]
- Zakharenko, A.; Luzina, O.; Koval, O.; Nilov, D.; Gushchina, I.; Dyrkheeva, N.; Švedas, V.; Salakhutdinov, N.; Lavrik, O. Tyrosyl-DNA phosphodiesterase 1 inhibitors: Usnic acid enamines enhance the cytotoxic effect of camptothecin. Nat. Prod. 2016, 79, 2961–2967. [Google Scholar] [CrossRef]
- Shtro, A.A.; Zarubaev, V.V.; Luzina, O.A.; Sokolov, D.N.; Kiselev, O.I.; Salakhutdinov, N.F. Novel derivatives of usnic acid effectively inhibiting reproduction of influenza A virus. Bioorg. Med. Chem. 2014, 22, 6826–6836. [Google Scholar] [CrossRef]
- Bruno, M.; Trucchi, B.; Monti, D.; Romeo, S.; Kaiser, M.; Verotta, L. Synthesis of a potent antimalarial agent through natural products conjugation. ChemMedChem 2013, 8, 221–225. [Google Scholar] [CrossRef]
- Cirillo, D.; Borroni, E.; Festoso, I.; Monti, D.; Romeo, S.; Mazier, D.; Verotta, L. Synthesis and antimycobacterial activity of (+)-usnic acid conjugates. Arch. Pharm. Chem. Life Sci. 2018, 351, e1800177. [Google Scholar] [CrossRef]
- Pastrana-Mena, R.; Mathias, D.K.; Delves, M.; Rajaram, K.; King, J.G.; Yee, R.; Trucchi, B.; Verotta, L.; Dinglasan, R.R. A malaria transmission-blocking (+)-usnic acid derivative prevents plasmodium zygote-to-ookinete maturation in the mosquito midgut. ACS Chem. Biol. 2016, 11, 3461–3472. [Google Scholar] [CrossRef]
- Pyrczak-Felczykowska, A.; Narlawar, R.; Pawlik, A.; Guzow-Krzemińska, B.; Artymiuk, D.; Hać, A.; Ryś, K.; Rendina, L.M.; Reekie, T.A.; Herman-Antosiewicz, A.; et al. Synthesis of usnic acid derivatives and evaluation of their antiproliferative activity against cancer cells. J. Nat. Prod. 2019, 82, 1768–1778. [Google Scholar] [CrossRef] [PubMed]
- Zakharova, O.; Luzina, O.; Zakharenko, A.; Sokolov, D.; Filimonov, A.; Dyrkheeva, N.; Chepanova, A.; Ilina, E.; Ilyina, A.; Klabenkova, K.; et al. Synthesis and evaluation of aryliden- and hetarylidenfuranone derivatives of usnic acid as highly potent Tdp1 inhibitors. Bioorg. Med. Chem. 2018, 26, 4470–4480. [Google Scholar] [CrossRef] [PubMed]
- Luzina, O.A.; Sokolov, D.N.; Shernyukov, A.V.; Salakhutdinov, N.F. Synthesis of aurones based on usninic acid. Chem. Nat. Compd. 2012, 48, 385–391. [Google Scholar] [CrossRef]
- Filimonov, A.S.; Chepanova, A.A.; Luzina, O.A.; Zakharenko, A.L.; Zakharova, O.D.; Ilina, E.S.; Dyrkheeva, N.S.; Kuprushkin, M.S.; Kolotaev, A.V.; Khachatryan, D.S.; et al. New hydrazinothiazole derivatives of usnic acid as potent Tdp1 inhibitors. Molecules 2019, 24, 3711. [Google Scholar] [CrossRef] [PubMed]
- Zakharenko, A.L.; Luzina, O.A.; Sokolov, D.N.; Kaledin, V.I.; Nikolin, V.P.; Popova, N.A.; Patel, J.; Zakharova, O.D.; Chepanova, A.A.; Zafar, A.; et al. Novel tyrosyl-DNA phosphodiesterase 1 inhibitors enhance the therapeutic impact of topotecan on in vivo tumor models. Eur. J. Med. Chem. 2019, 161, 581–593. [Google Scholar] [CrossRef]
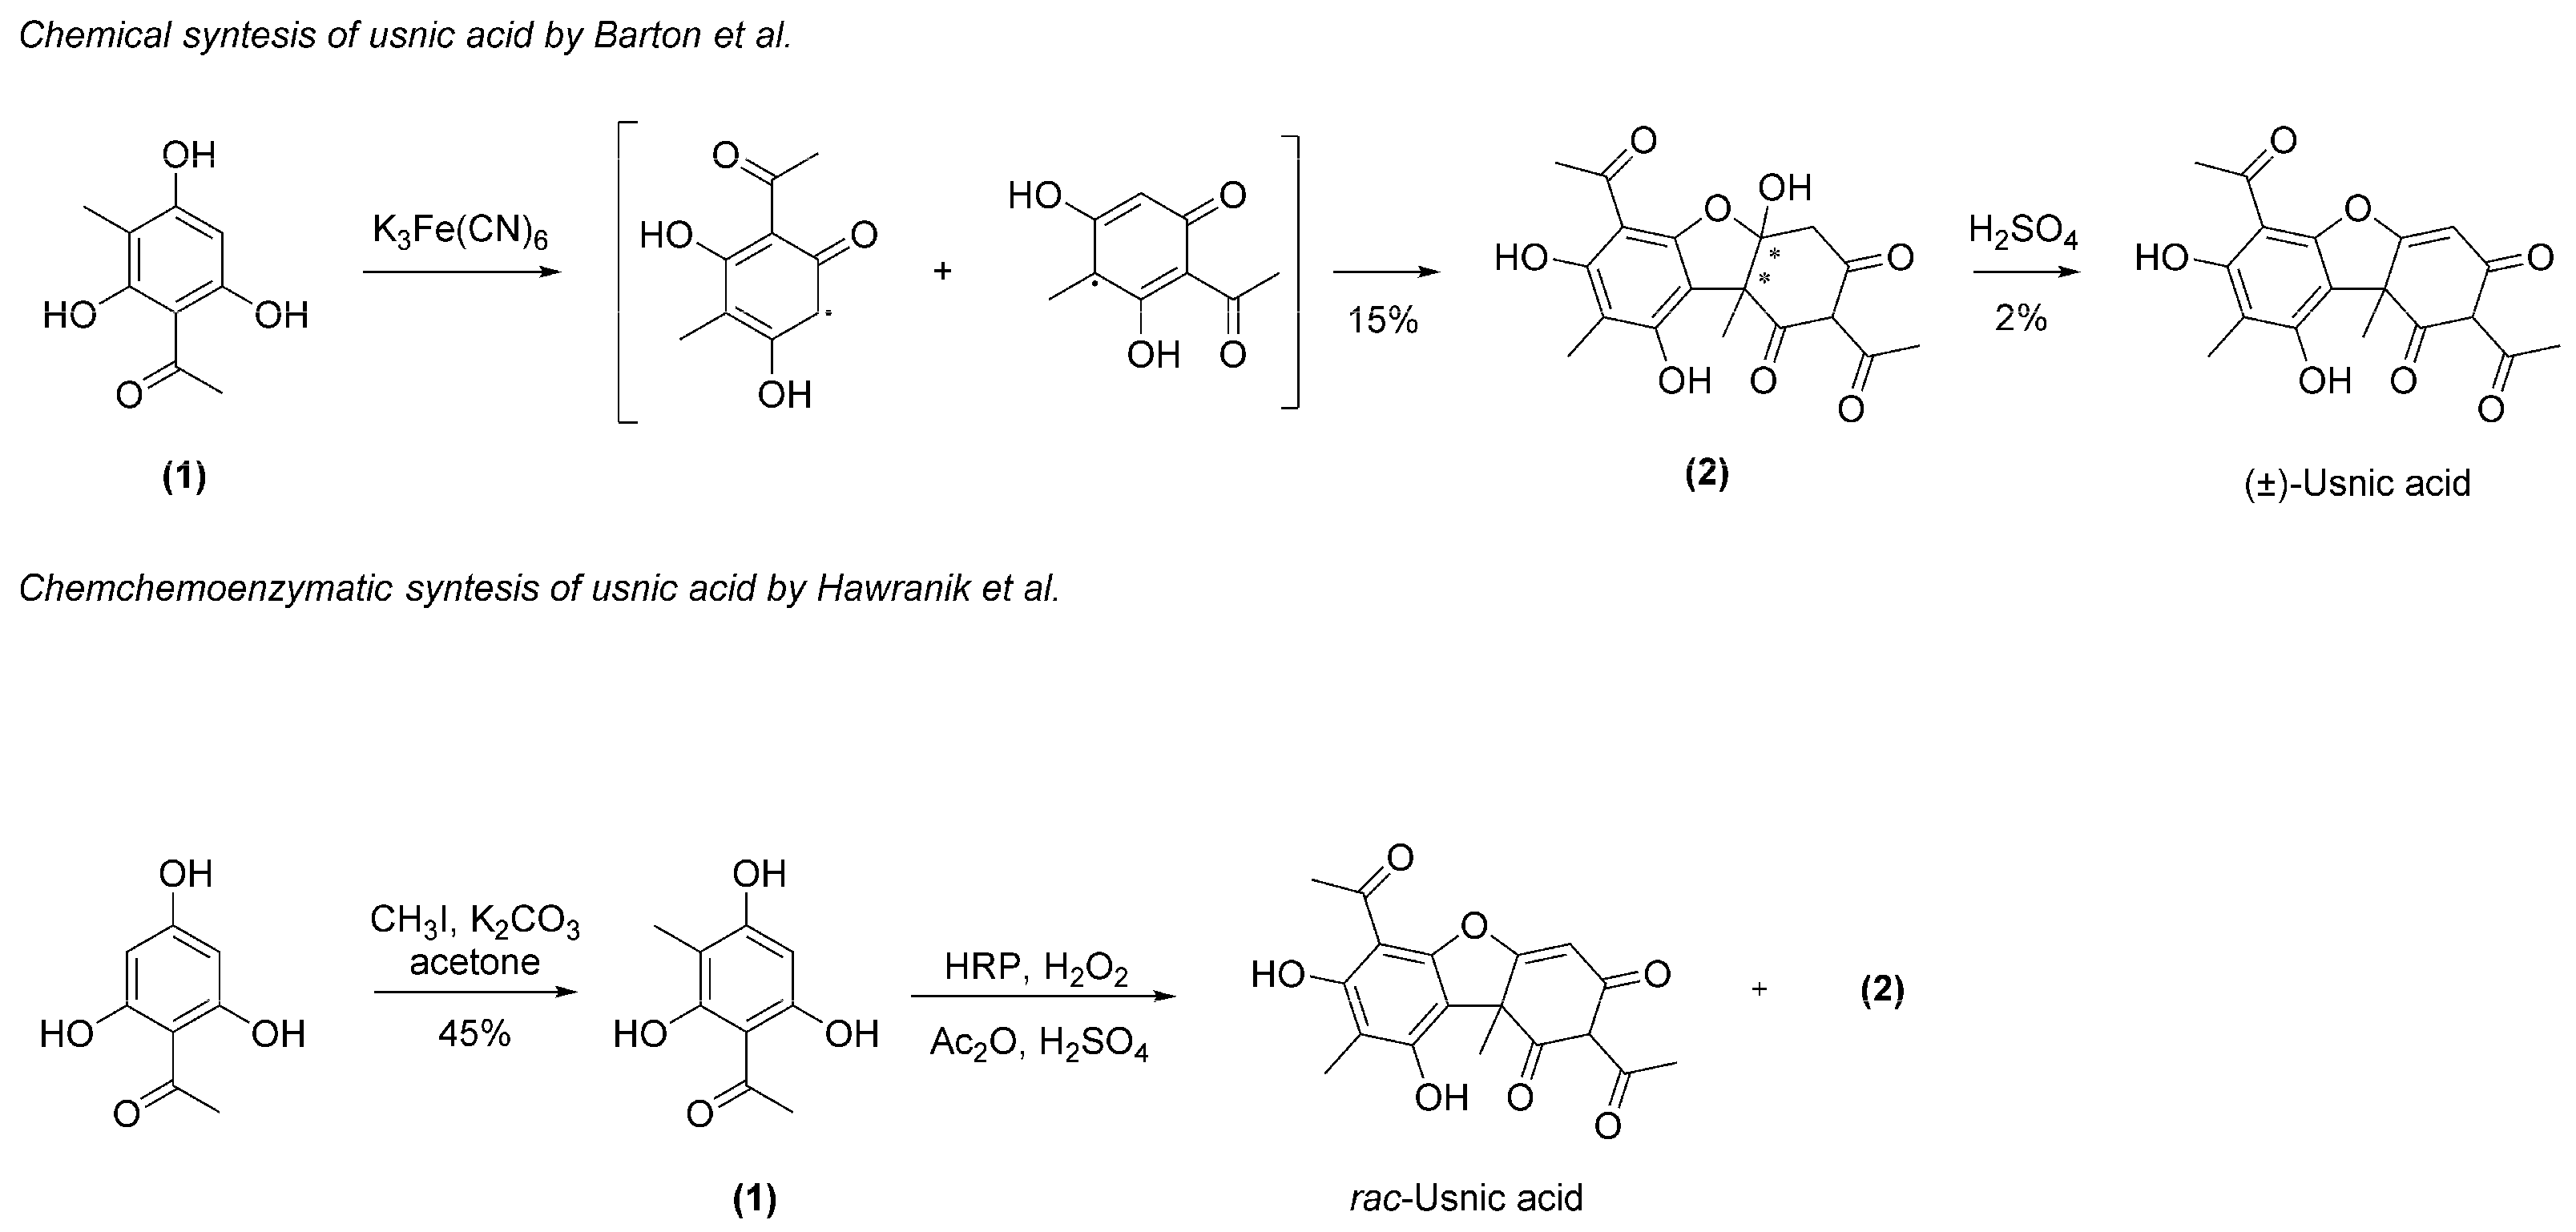
- Barton, D.H.R.; Deflorin, A.M.; Edwards, O.E. The synthesis of usnic acid. J. Chem. Soc. 1956, 530–534. [Google Scholar] [CrossRef]
- Hawranik, D.J.; Anderson, K.S.; Simmonds, R.; Sorensen, J.L. The chemoenzymatic synthesis of usnic acid. Bioorg. Med. Chem. Let. 2009, 19, 2383–2385. [Google Scholar] [CrossRef]
- Singh, S.; Khatoon, S.; Joshi, Y.; Prgyadeep, S.; Upreti, D.K.; Rawat, A.K.S. A validated HPTLC densitometric method for simultaneous determination of evernic and usnic acids in four usnea species and comparison of their antioxidant potential. J. Chromatogra. Sci. 2016, 54, 1670–1677. [Google Scholar] [CrossRef]
- Kosanić, M.; Ristić, S.; Stanojković, T.; Manojlović, N.; Ranković, B. Extracts of five cladonia lichens as sources of biologically active compounds. Farmacia 2018, 66, 644–651. [Google Scholar] [CrossRef]
- Oran, S.; Sahin, S.; Sahinturk, P.; Ozturk, S.; Demir, C. Antioxidant and antimicrobial potential, and HPLC analysis of stictic and usnic acids of three Usnea species from Uludag mountain (Bursa, Turkey). Iran. J. Pharmac. Res. 2016, 15, 527–535. [Google Scholar]
- Popovici, V.; Bucur, L.; Popescu, A.; Caraiane, A.; Badea, V. Determination of the content in usnic acid and polyphenols from the extracts of Usnea barbata L. and the evaluation of their antioxidant activity. Farmacia 2018, 66, 337–341. [Google Scholar]
- Popovici, V.; Bucur, L.; Costache, T.; Gherghel, D.; Vochita, G.; Mihai, C.T.; Rotinberg, P.; Schroder, V.; Badea, F.C.; Badea, V. Studies on preparation and UHPLC analysis of the Usnea barbata (L) F.H.Wigg dry acetone extract. Revista de Chimie 2019, 70, 3775–3777. [Google Scholar] [CrossRef]
- Zugic, A.; Jeremic, I.; Isakovic, A.; Arsic, I.; Savic, S.; Tadic, V. Evaluation of anticancer and antioxidant activity of a commercially available CO2 supercritical extract of old man’s beard (Usnea barbata). PLoS ONE 2016, 11, e0146342. [Google Scholar] [CrossRef] [PubMed]
- Chaowuttikul, C.; Thitikornpong, W.; Palanuvej, C.; Ruangrungsi, N. Quantitative determination of usnic acid content in Usnea siamensis by TLC-densitometry and TLC image analysis. Res. J. Pharmac. Bio. Chem. Sci. 2014, 5, 118–125. [Google Scholar]
- Kiliç, N.; Islakoğlu, Y.Ö.; Büyük, İ.; Gür-Dedeoğlu, B.; Cansaran-Duman, D. Determination of usnic acid responsive mirnas in breast cancer cell lines. Anti-Cancer Agen. Med. Chem. 2016, 19, 1463–1472. [Google Scholar] [CrossRef]
- Kyslychenko, O.A.; Protska, V.V.; Zhuravel, I.O. HPLC determination of phenolic compounds content in Parmelia sulcata and Parmelia vagans thalli. Pharmacia 2019, 66, 161–164. [Google Scholar] [CrossRef]
- Wang, H.; Yang, T.; Cheng, X.; Kwong, S.; Liu, C.; An, R.; Li, G.; Wang, X.; Wang, C. Simultaneous determination of usnic, diffractaic, evernic and barbatic acids in rat plasma by ultra-high-performance liquid chromatography–quadrupole exactive Orbitrap mass spectrometry and its application to pharmacokinetic studies. Biomed. Chromatogr. 2018, 32, e4123. [Google Scholar] [CrossRef]
- Varol, M.; Tay, T.; Candan, M.; Türk, A.; Koparal, A.T. Evaluation of the sunscreen lichen substances usnic acid and atranorin. Biocell 2015, 39, 25–31. [Google Scholar]
- Koparal, A.T. Anti-angiogenic and antiproliferative properties of the lichen substances (-)-usnic acid and vulpinic acid. Z. Naturforsch C 2015, 70, 159–164. [Google Scholar] [CrossRef]
- Koparal, A.T.; Ayaz Tüylü, B.; Türk, H. In vitro cytotoxic activities of (+)-usnic acid and (−)-usnic acid on V79, A549, and human lymphocyte cells and their non-genotoxicity on human lymphocytes. Nat. Prod. Res. 2006, 20, 1300–1307. [Google Scholar] [CrossRef]
- Gheza, G.; Assini, S.; Valcuvia-Passadore, M. Contribution to the knowledge of lichen flora of inland sand dunes in the western Po Plain (N Italy). Plant. Biosyst. 2015, 149, 307–314. [Google Scholar] [CrossRef]
- Nimis, P.L. The Lichens of Italy—A Second Annotated Catalogue; EUT: Trieste, Italy, 2016; p. 740. [Google Scholar]
- Gheza, G.; Assini, S.; Lelli, C.; Marini, L.; Mayrhofer, H.; Nascimbene, J. Biodiversity and conservation of terricolous lichens and bryophytes in continental lowlands of northern Italy: The role of different dry habitat types. Biodive. Conser. 2020, 29, 3533–3550. [Google Scholar] [CrossRef]
- Malacrida, A.; Cavalloro, V.; Martino, E.; Cassetti, A.; Nicolini, G.; Rigolio, R.; Cavaletti, G.; Mannucci, B.; Vasile, F.; Di Giacomo, M.; et al. Anti-multiple myeloma potential of secondary metabolites from hibiscus sabdariffa. Molecules 2019, 24, 2500. [Google Scholar] [CrossRef] [PubMed]
- Vigani, B.; Rossi, S.; Gentile, M.; Sandri, G.; Bonferoni, M.C.; Cavalloro, V.; Martino, E.; Collina, S.; Ferrari, F. Development of a mucoadhesive and an in situ gelling formulation based on κ-carrageenan for application on oral mucosa and esophagus walls. II. Loading of a bioactive hydroalcoholic extract. Mar. Drugs 2019, 17, 153. [Google Scholar] [CrossRef] [PubMed]
- Martino, E.; Collina, S.; Rossi, D.; Bazzoni, D.; Gaggeri, R.; Bracco, F.; Azzolina, O. Influence of the extraction mode on the yield of hyperoside, vitexin and vitexin-2″-O-rhamnoside from Crataegus monogyna Jacq. (hawthorn). Phytochem. Anal. 2008, 19, 534–540. [Google Scholar] [CrossRef]
- Granata, M.U.; Bracco, F.; Catoni, R.; Martino, E. Secondary metabolites profile and physiological leaf traits in wild and cultivated Corylus avellana under different nutritional status. Nat. Prod. Res. 2019, 56, 1–8. [Google Scholar] [CrossRef]
- Martino, E.; Della Volpe, S.; Cavalloro, V.; Amri, B.; Kaab, L.B.B.; Marrubini, G.; Rossi, D.; Collina, S. The use of a microwave-assisted solvent extraction coupled with HPLC-UV/PAD to assess the quality of Marrubium vulgare L. (white horehound) herbal raw material. Phytochem. Anal. 2019, 30, 377–384. [Google Scholar] [CrossRef]
- Amri, B.; Martino, E.; Vitulo, F.; Corana, F.; Ben-Kaâb, L.B.; Rui, M.; Rossi, D.; Mori, M.; Rossi, S.; Collina, S. Marrubium vulgare L. leave extract: Phytochemical composition, antioxidant and wound healing properties. Molecules 2017, 22, 1851. [Google Scholar] [CrossRef]
- Rossi, D.; Ahmed, K.M.; Gaggeri, R.; Volpe, S.D.; Maggi, L.; Mazzeo, G.; Longhi, G.; Abbate, S.; Corana, F.; Martino, E.; et al. (R)-(-)-Aloesaponol III 8-methyl ether from eremurus persicus: A novel compound against leishmaniosis. Molecules 2017, 22, 519. [Google Scholar] [CrossRef]
- Gaggeri, R.; Rossi, D.; Christodoulou, M.S.; Passarella, D.; Leoni, F.; Azzolina, O.; Collina, S. Chiral flavanones from Amygdalus lycioides Spach: Structural elucidation and identification of TNFalpha inhibitors by bioactivity-guided fractionation. Molecules 2012, 17, 1665–1674. [Google Scholar] [CrossRef]
- Popovici, V.; Bucur, L.A.; Schröder, V.; Gherghel, D.; Mihai, C.T.; Caraiane, A.; Badea, F.C.; Vochița, G.; Badea, V. Evaluation of the Cytotoxic Activity of the Usnea barbata (L.) F. H. Wigg Dry Extract. Molecules 2020, 25, 1865. [Google Scholar] [CrossRef]
- Rossi, D.; Nasti, R.; Collina, S.; Mazzeo, G.; Ghidinelli, S.; Longhi, G.; Memo, M.; Abbate, S. The role of chirality in a set of key intermediates of pharmaceutical interest, 3-aryl-substituted-γ-butyrolactones, evidenced by chiral HPLC separation and by chiroptical spectroscopies. J. Pharmac. Biomed. Analy. 2017, 144, 41–51. [Google Scholar] [CrossRef] [PubMed]
- Carvalho, M.-G.; Carvalho, G.J.A.; Braz-Filho, R. Chemical constituents from Ouratea floribunda: Complete 1H- and 13C-NMR assignments of atranorin and its new acetyl derivative. J. Brazil. Chem. Soc. 2000, 11, 143–147. [Google Scholar] [CrossRef]
- Su, B.-N.; Cuendet, M.; Nikolic, D.; Kristinsson, H.; Ingólfsdóttir, K.; van Breemen, R.B.; Fong, H.H.S.; Pezzuto, J.M.; Kinghorn, A.D. NMR study of fumarprotocetraric acid, a complex lichen depsidone derivative from Cladonia furcate. Mag. Res. Chem. 2003, 41, 391–394. [Google Scholar] [CrossRef]
- Yang, Y.; Nguyen, T.T.; Jeong, M.-H.; Crişan, F.; Yu, Y.H.; Ha, H.-H.; Choi, K.H.; Jeong, H.G.; Jeong, T.C.; Lee, K.Y.; et al. Inhibitory Activity of (+)-Usnic Acid against Non-Small Cell Lung Cancer Cell Motility. PLoS ONE 2016, 11, e0146575. [Google Scholar] [CrossRef] [PubMed]
- Marrubini, G.; Fattorini, P.; Previderé, C.; Goi, S.; Sorçaburu Cigliero, S.; Grignani, P.; Serra, M.; Biesuz, R.; Massolini, G. Experimental design applied to the optimization of microwave-assisted DNA hydrolysis. J. Chromatogr. A 2012, 1249, 8–16. [Google Scholar] [CrossRef]
- Moldovan, M.L.; Iurian, S.; Puscas, C.; Silaghi-Dumitrescu, R.; Hanganu, D.; Bogdan, C.; Vlase, L.; Oniga, I.; Benedec, D. A Design of Experiments Strategy to Enhance the Recovery of Polyphenolic Compounds from Vitis vinifera By-Products through Heat Reflux Extraction. Biomolecules 2019, 9, 529. [Google Scholar] [CrossRef]
- Fisher, R.A. and Mackenzie, W.A. Studies in crop variation. II. The manurial response of different potato varieties. J. Agric. Sci. 1923, 13, 311–320. [Google Scholar] [CrossRef]
- Yates, F. Sir Ronald Fisher and the Design of Experiments. Biometrics 1964, 20, 307–332. [Google Scholar] [CrossRef]
- Box, G.E.P.; Allen, J.L. An Accidental Statistician: The life and memories of George E.P. Box; John Wiley & Sons: Hoboken, NJ, USA, 2013. [Google Scholar]
- Box, G.E.P.; Hunter, J.S.; Hunter, W.G. Statistics for experimenters: Design, Innovation, and Discovery; John Wiley & Sons: Hoboken, NJ, USA, 2005. [Google Scholar]
- Montgomery, D.J. Design and Analysis of Experiments; John Wiley & Sons: Hoboken, NJ, USA, 2019. [Google Scholar]
- Carlson, R. Design and Optimization in Organic Synthesis, 3rd ed.; Elsevier Science: Amsterdam, The Netherlands, 2012. [Google Scholar]
- Hibbert, D.B. Experimental design in chromatography: A tutorial review. J. Chromatogr. B 2012, 910, 2–13. [Google Scholar] [CrossRef]
- Marrubini, G.; Dugheri, S.; Cappelli, G.; Arcangeli, G.; Mucci, N.; Appelblad, P.; Melzi, C.; Speltini, A. Experimental designs for solid-phase microextraction method development in bioanalysis: A review. Anal. Chim. Acta 2020, 1119, 77–100. [Google Scholar] [CrossRef] [PubMed]
- Vasilev, N.; Boccard, J.; Lang, G.; Grömping, U.; Fischer, R.; Goepfert, S.; Rudaz, S.; Schillberg, S. Structured plant metabolomics for the simultaneous exploration of multiple factors. Sci. Rep. 2016, 6, 37390. [Google Scholar] [CrossRef] [PubMed]


| Exp# | Solvent | N° of Cycles × Minutes | T°C | Y1 Extraction Yield (%) | Y2 (−)-(S)-UA Yield 1 |
|---|---|---|---|---|---|
| 1 | Acetone | 2 × 5 | 60 | 4.16 | 12.86 |
| 2 | Acetone | 3 × 5 | 60 | 3.40 | 12.88 |
| 3 | Acetone | 2 × 5 | 80 | 3.60 | 13.07 |
| 4 | Acetone | 3 × 5 | 80 | 3.31 | 11.73 |
| 5 | Ethyl Acetate | 2 × 5 | 60 | 3.93 | 12.49 |
| 6 | Ethyl Acetate | 3 × 5 | 60 | 2.76 | 10.28 |
| 7 | Ethyl Acetate | 2 × 5 | 80 | 2.50 | 13.04 |
| 8 | Ethyl Acetate | 3 × 5 | 80 | 1.70 | 11.64 |
| 9 | Ethanol | 2 × 5 | 60 | 6.63 | 12.78 |
| 10 | Ethanol | 3 × 5 | 60 | 5.84 | 11.54 |
| 11 | Ethanol | 2 × 5 | 80 | 6.73 | 13.51 |
| 12 | Ethanol | 3 × 5 | 80 | 7.29 | 12.79 |
| 13 * | Ethanol | 2 × 5 | 70 | 6.15 ± 0.01 | 13.2 ± 0.7 |
| Predicted ** | Ethanol | 2 × 5 | 70 | 7 ± 2 | 13 ± 2 |
Publisher’s Note: MDPI stays neutral with regard to jurisdictional claims in published maps and institutional affiliations. |
© 2021 by the authors. Licensee MDPI, Basel, Switzerland. This article is an open access article distributed under the terms and conditions of the Creative Commons Attribution (CC BY) license (http://creativecommons.org/licenses/by/4.0/).
Share and Cite
Cavalloro, V.; Marrubini, G.; Stabile, R.; Rossi, D.; Linciano, P.; Gheza, G.; Assini, S.; Martino, E.; Collina, S. Microwave-Assisted Extraction and HPLC-UV-CD Determination of (S)-usnic Acid in Cladonia foliacea. Molecules 2021, 26, 455. https://doi.org/10.3390/molecules26020455
Cavalloro V, Marrubini G, Stabile R, Rossi D, Linciano P, Gheza G, Assini S, Martino E, Collina S. Microwave-Assisted Extraction and HPLC-UV-CD Determination of (S)-usnic Acid in Cladonia foliacea. Molecules. 2021; 26(2):455. https://doi.org/10.3390/molecules26020455
Chicago/Turabian StyleCavalloro, Valeria, Giorgio Marrubini, Rita Stabile, Daniela Rossi, Pasquale Linciano, Gabriele Gheza, Silvia Assini, Emanuela Martino, and Simona Collina. 2021. "Microwave-Assisted Extraction and HPLC-UV-CD Determination of (S)-usnic Acid in Cladonia foliacea" Molecules 26, no. 2: 455. https://doi.org/10.3390/molecules26020455
APA StyleCavalloro, V., Marrubini, G., Stabile, R., Rossi, D., Linciano, P., Gheza, G., Assini, S., Martino, E., & Collina, S. (2021). Microwave-Assisted Extraction and HPLC-UV-CD Determination of (S)-usnic Acid in Cladonia foliacea. Molecules, 26(2), 455. https://doi.org/10.3390/molecules26020455