
First and Second Dissociation Enthalpies in Bi-Component Crystals Consisting of Maleic Acid and L-Phenylalanine

 ,
,  and
and
Abstract
:
1. Introduction
2. Results and Discussion
2.1. Synthesis
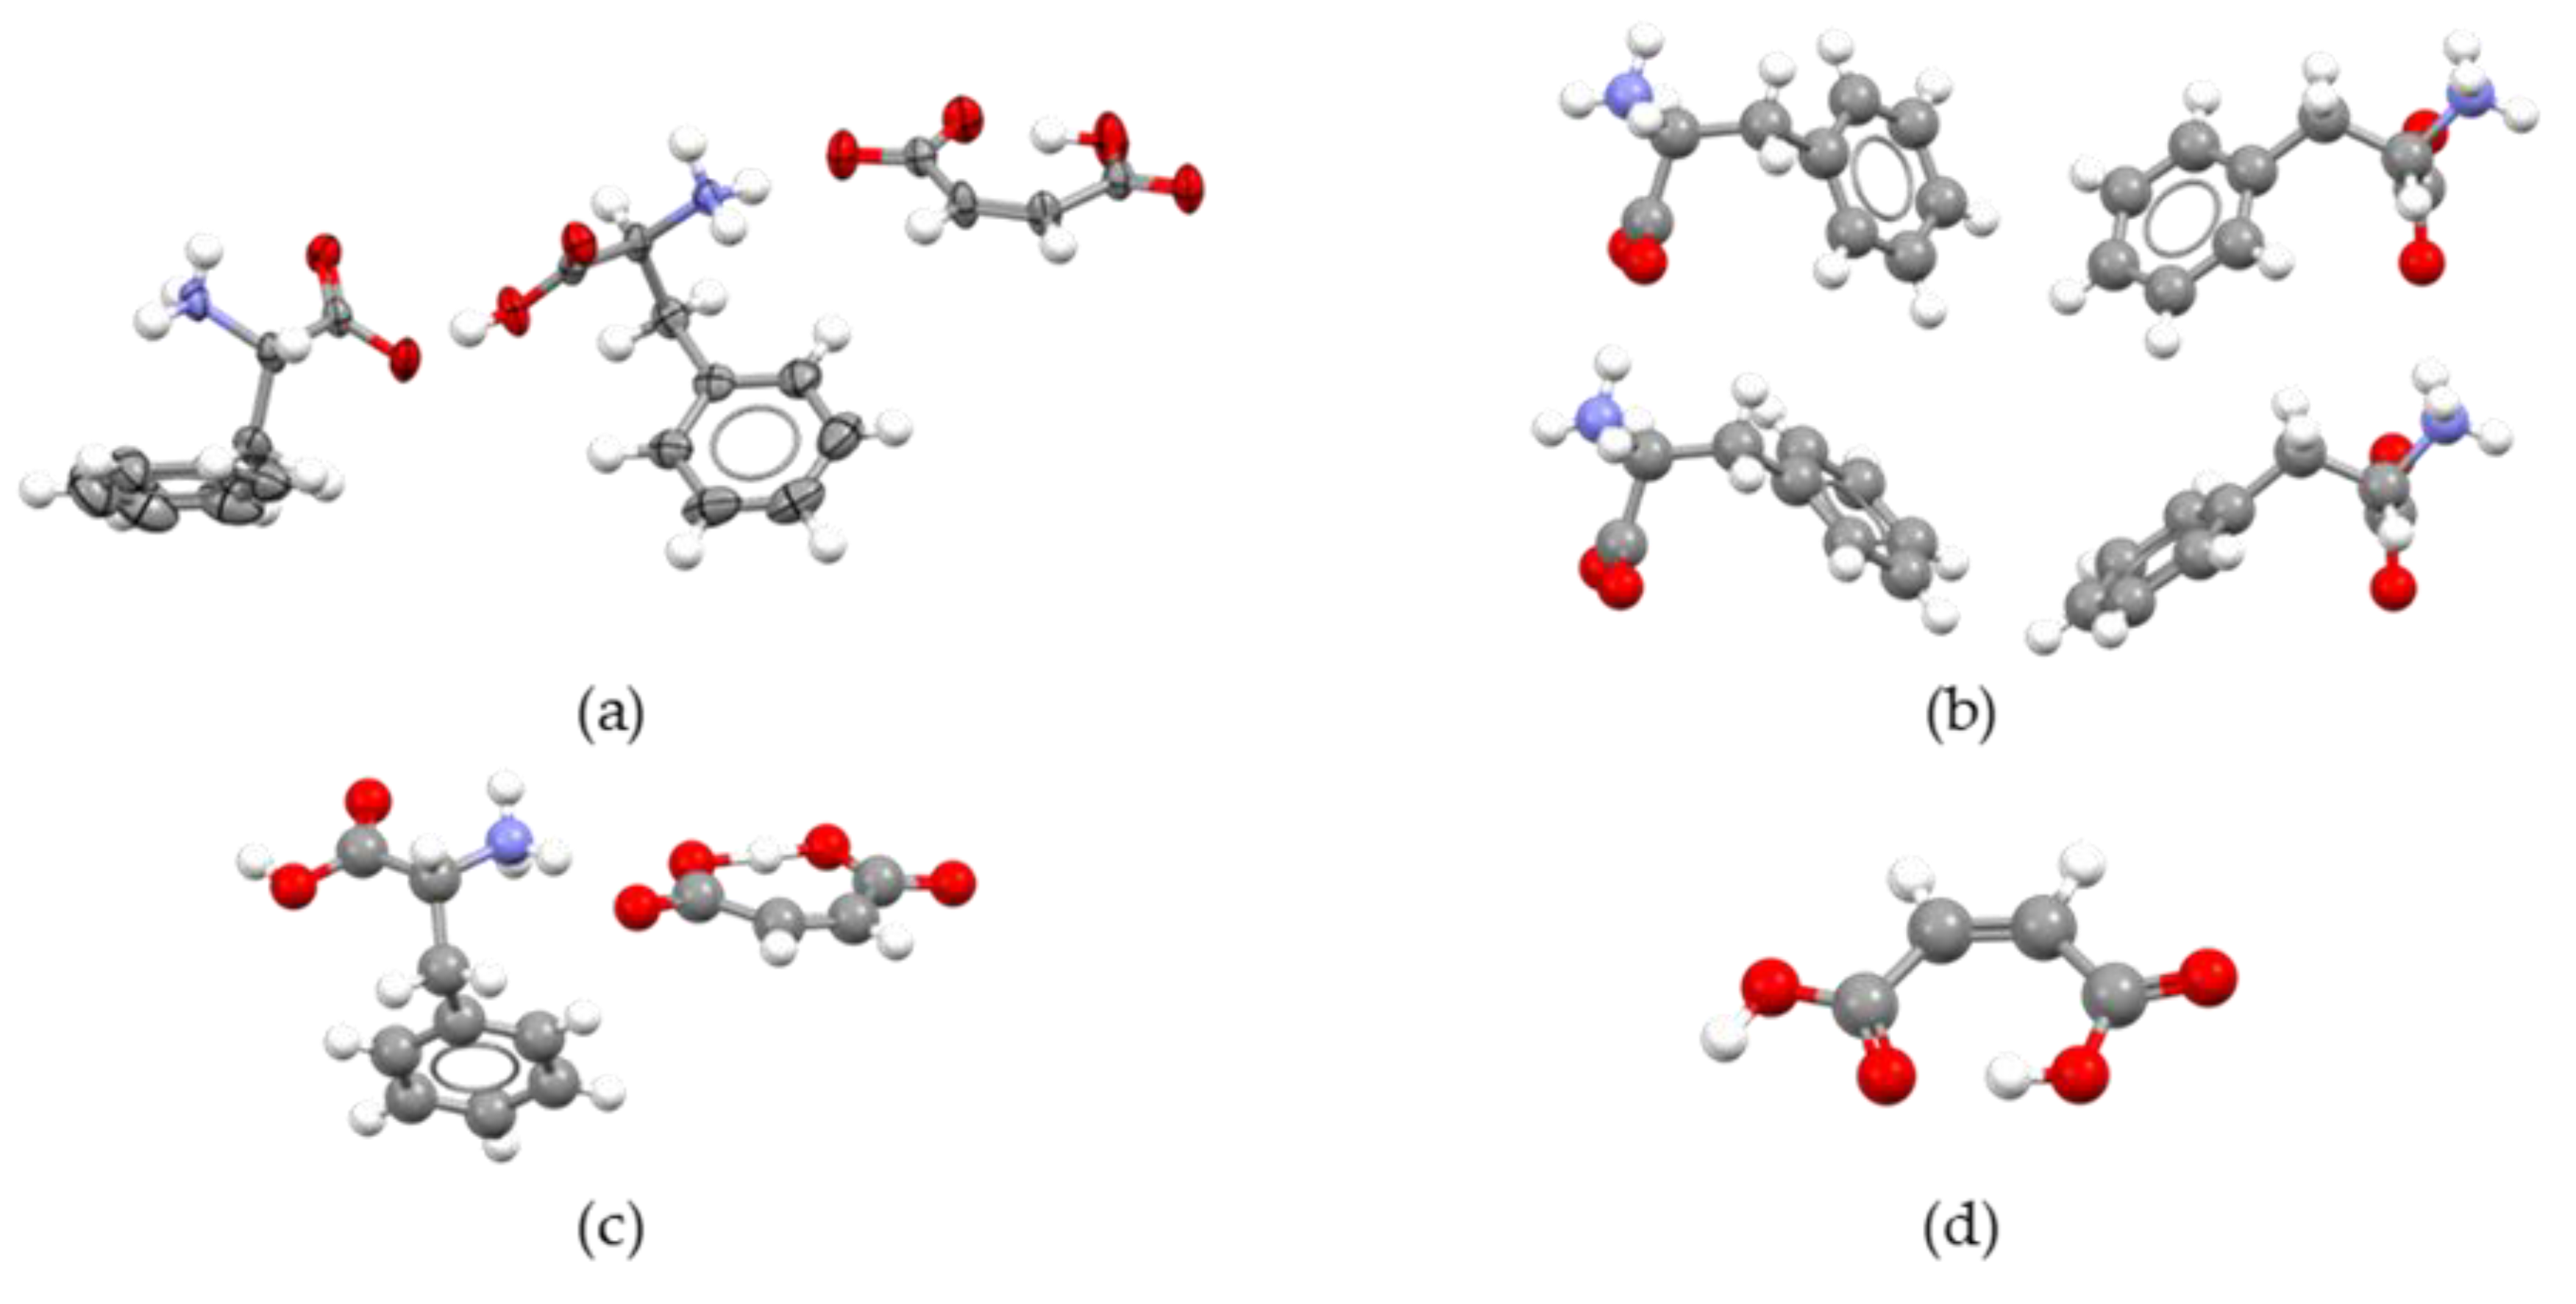
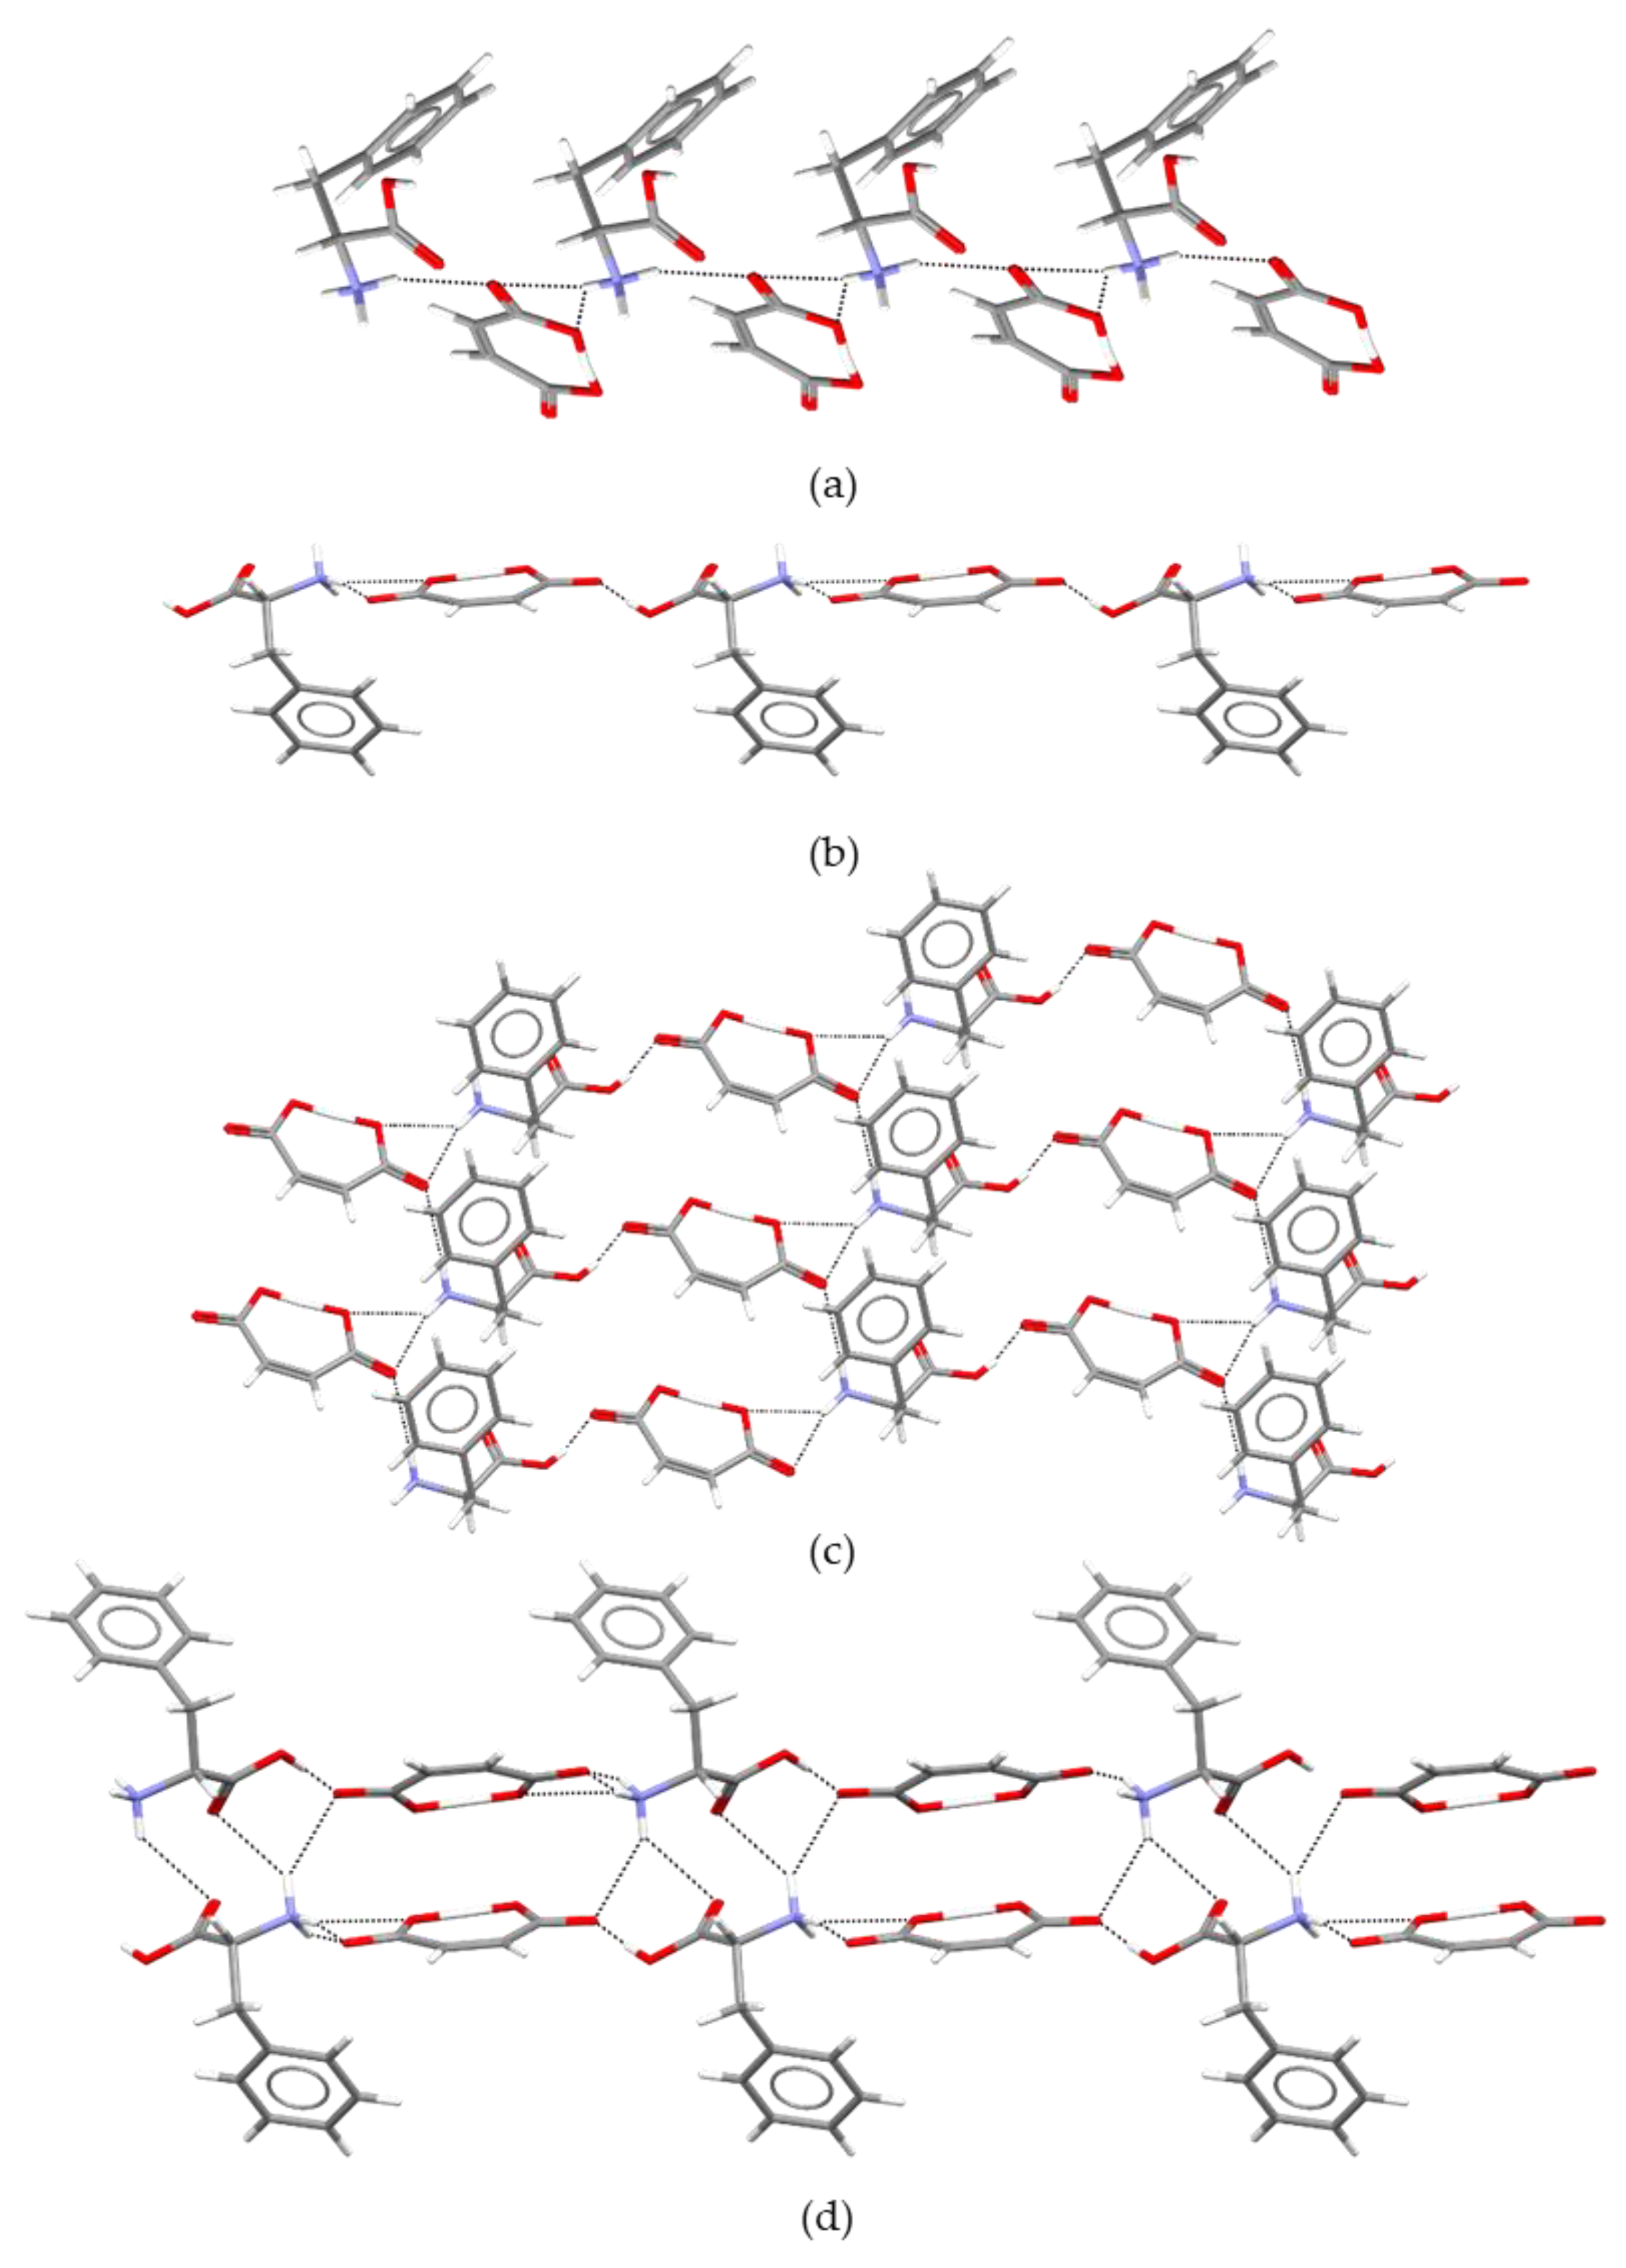
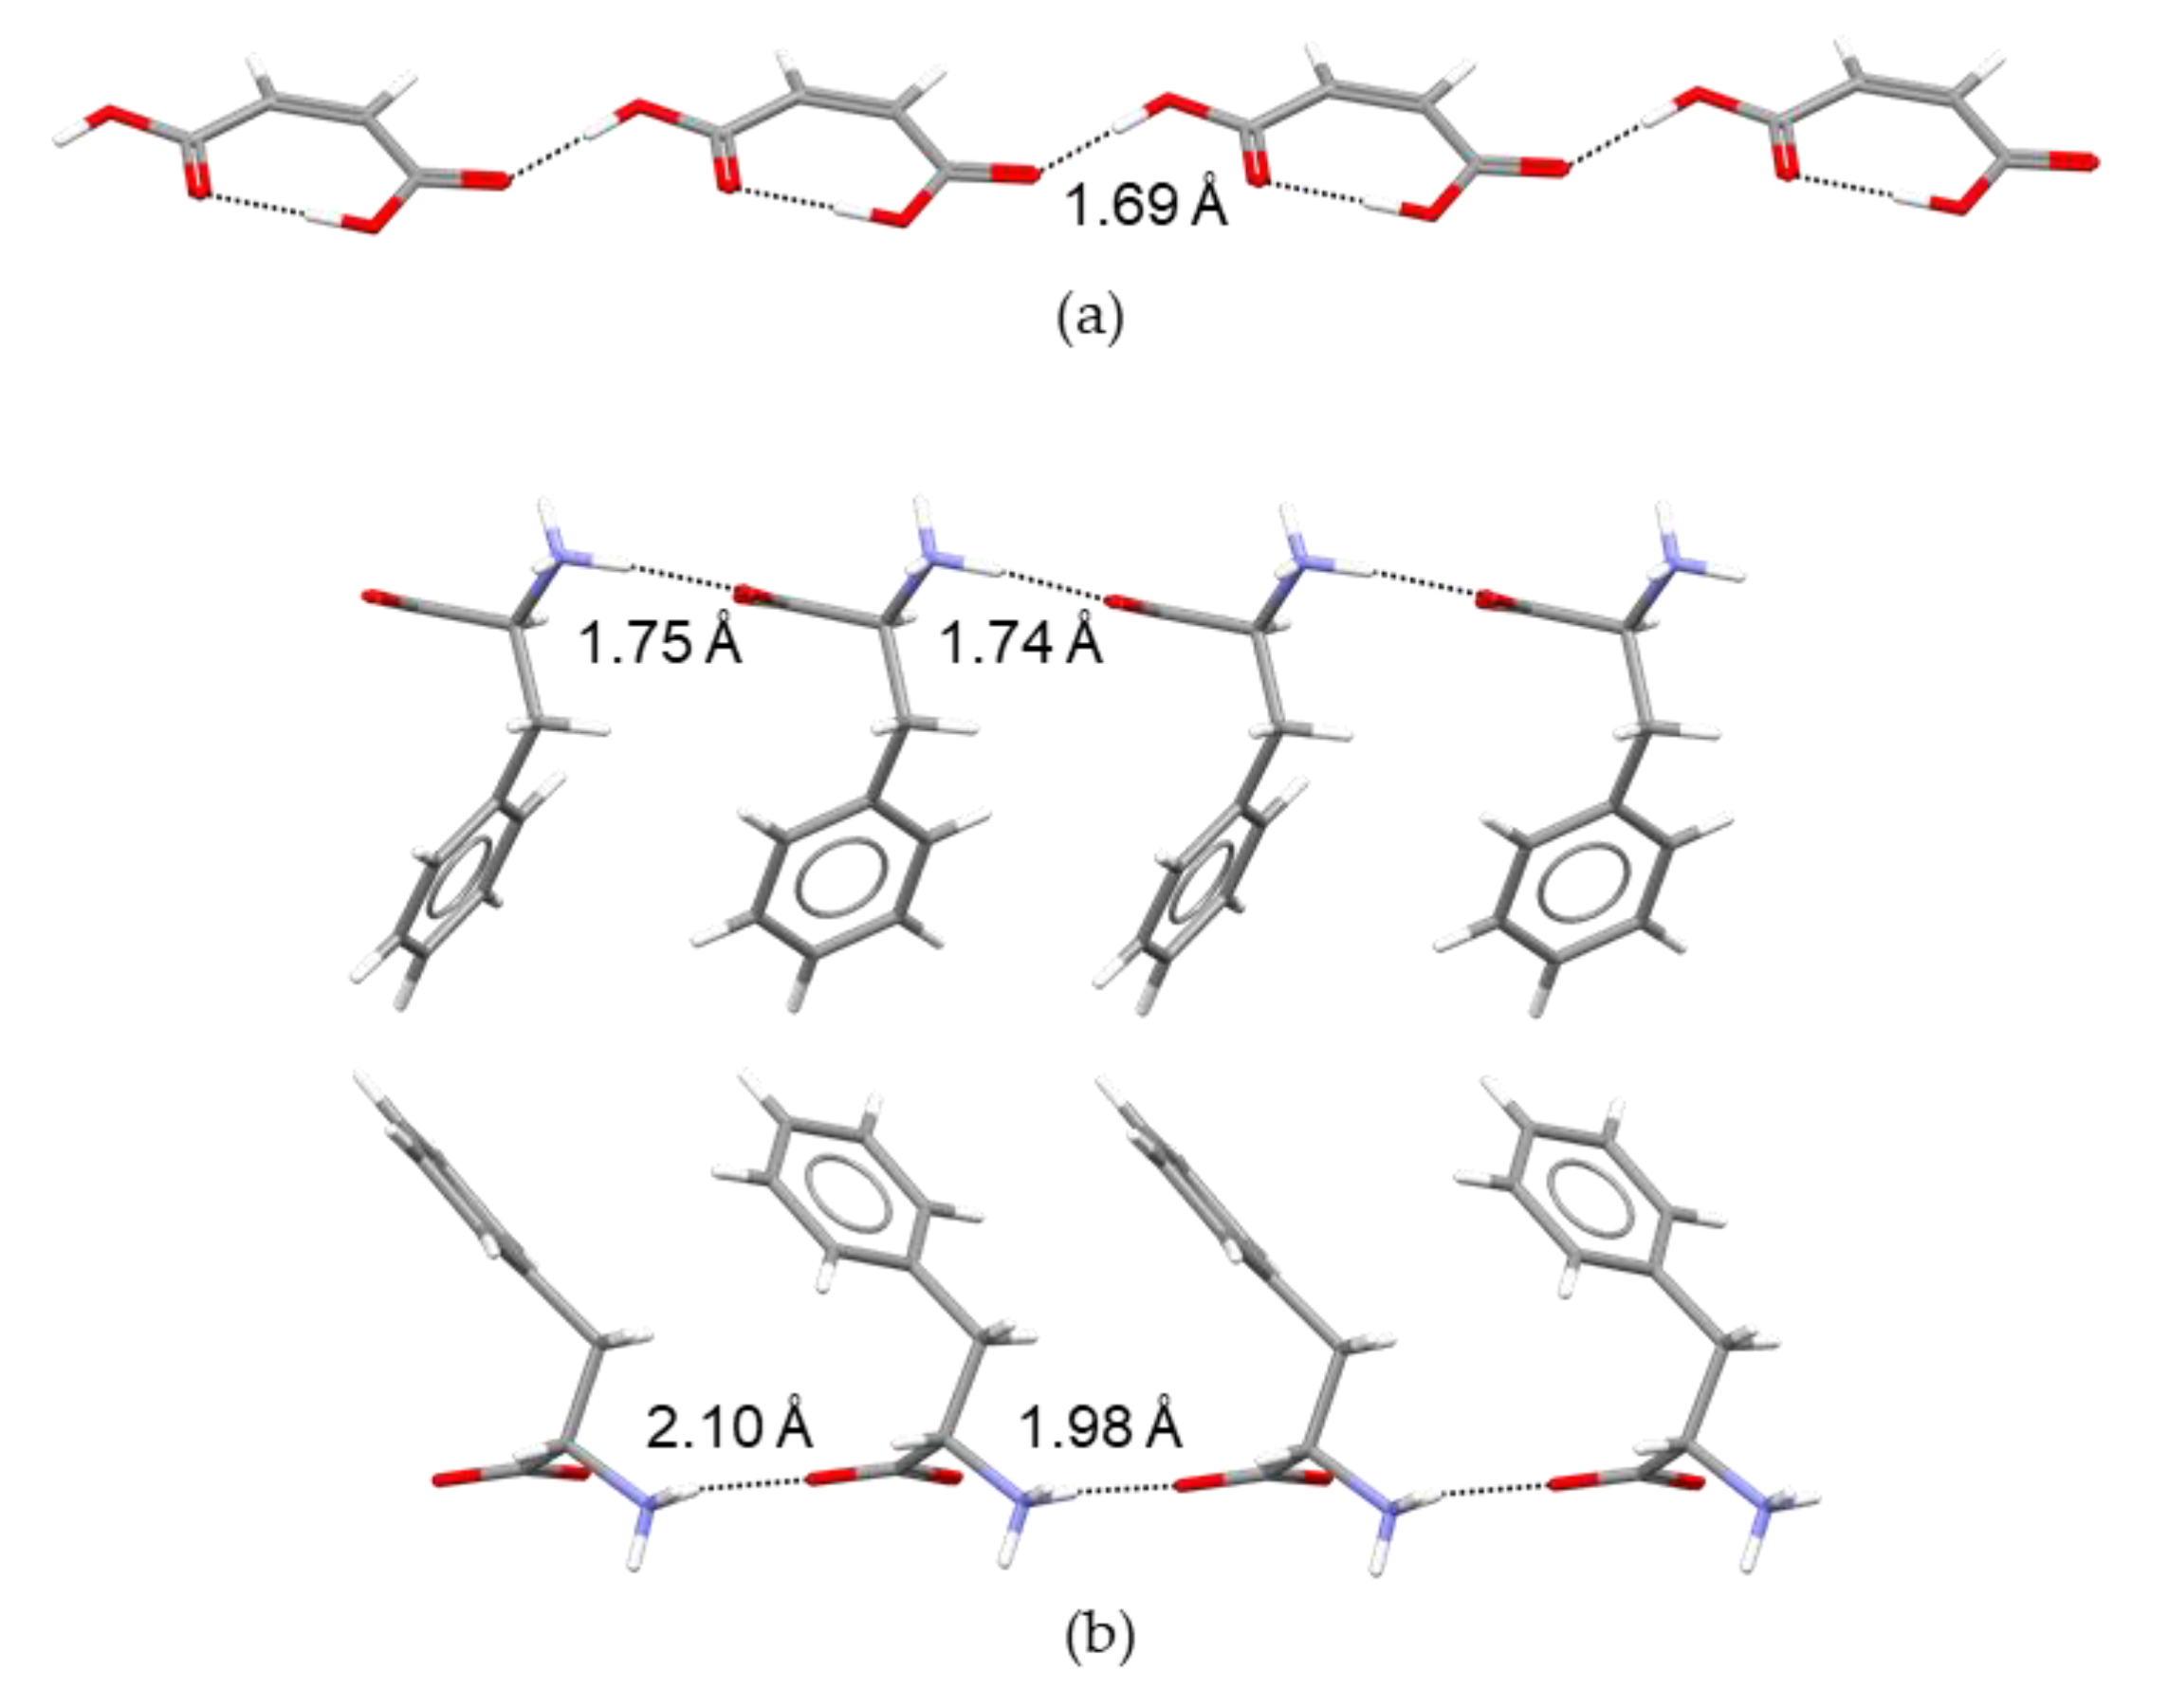
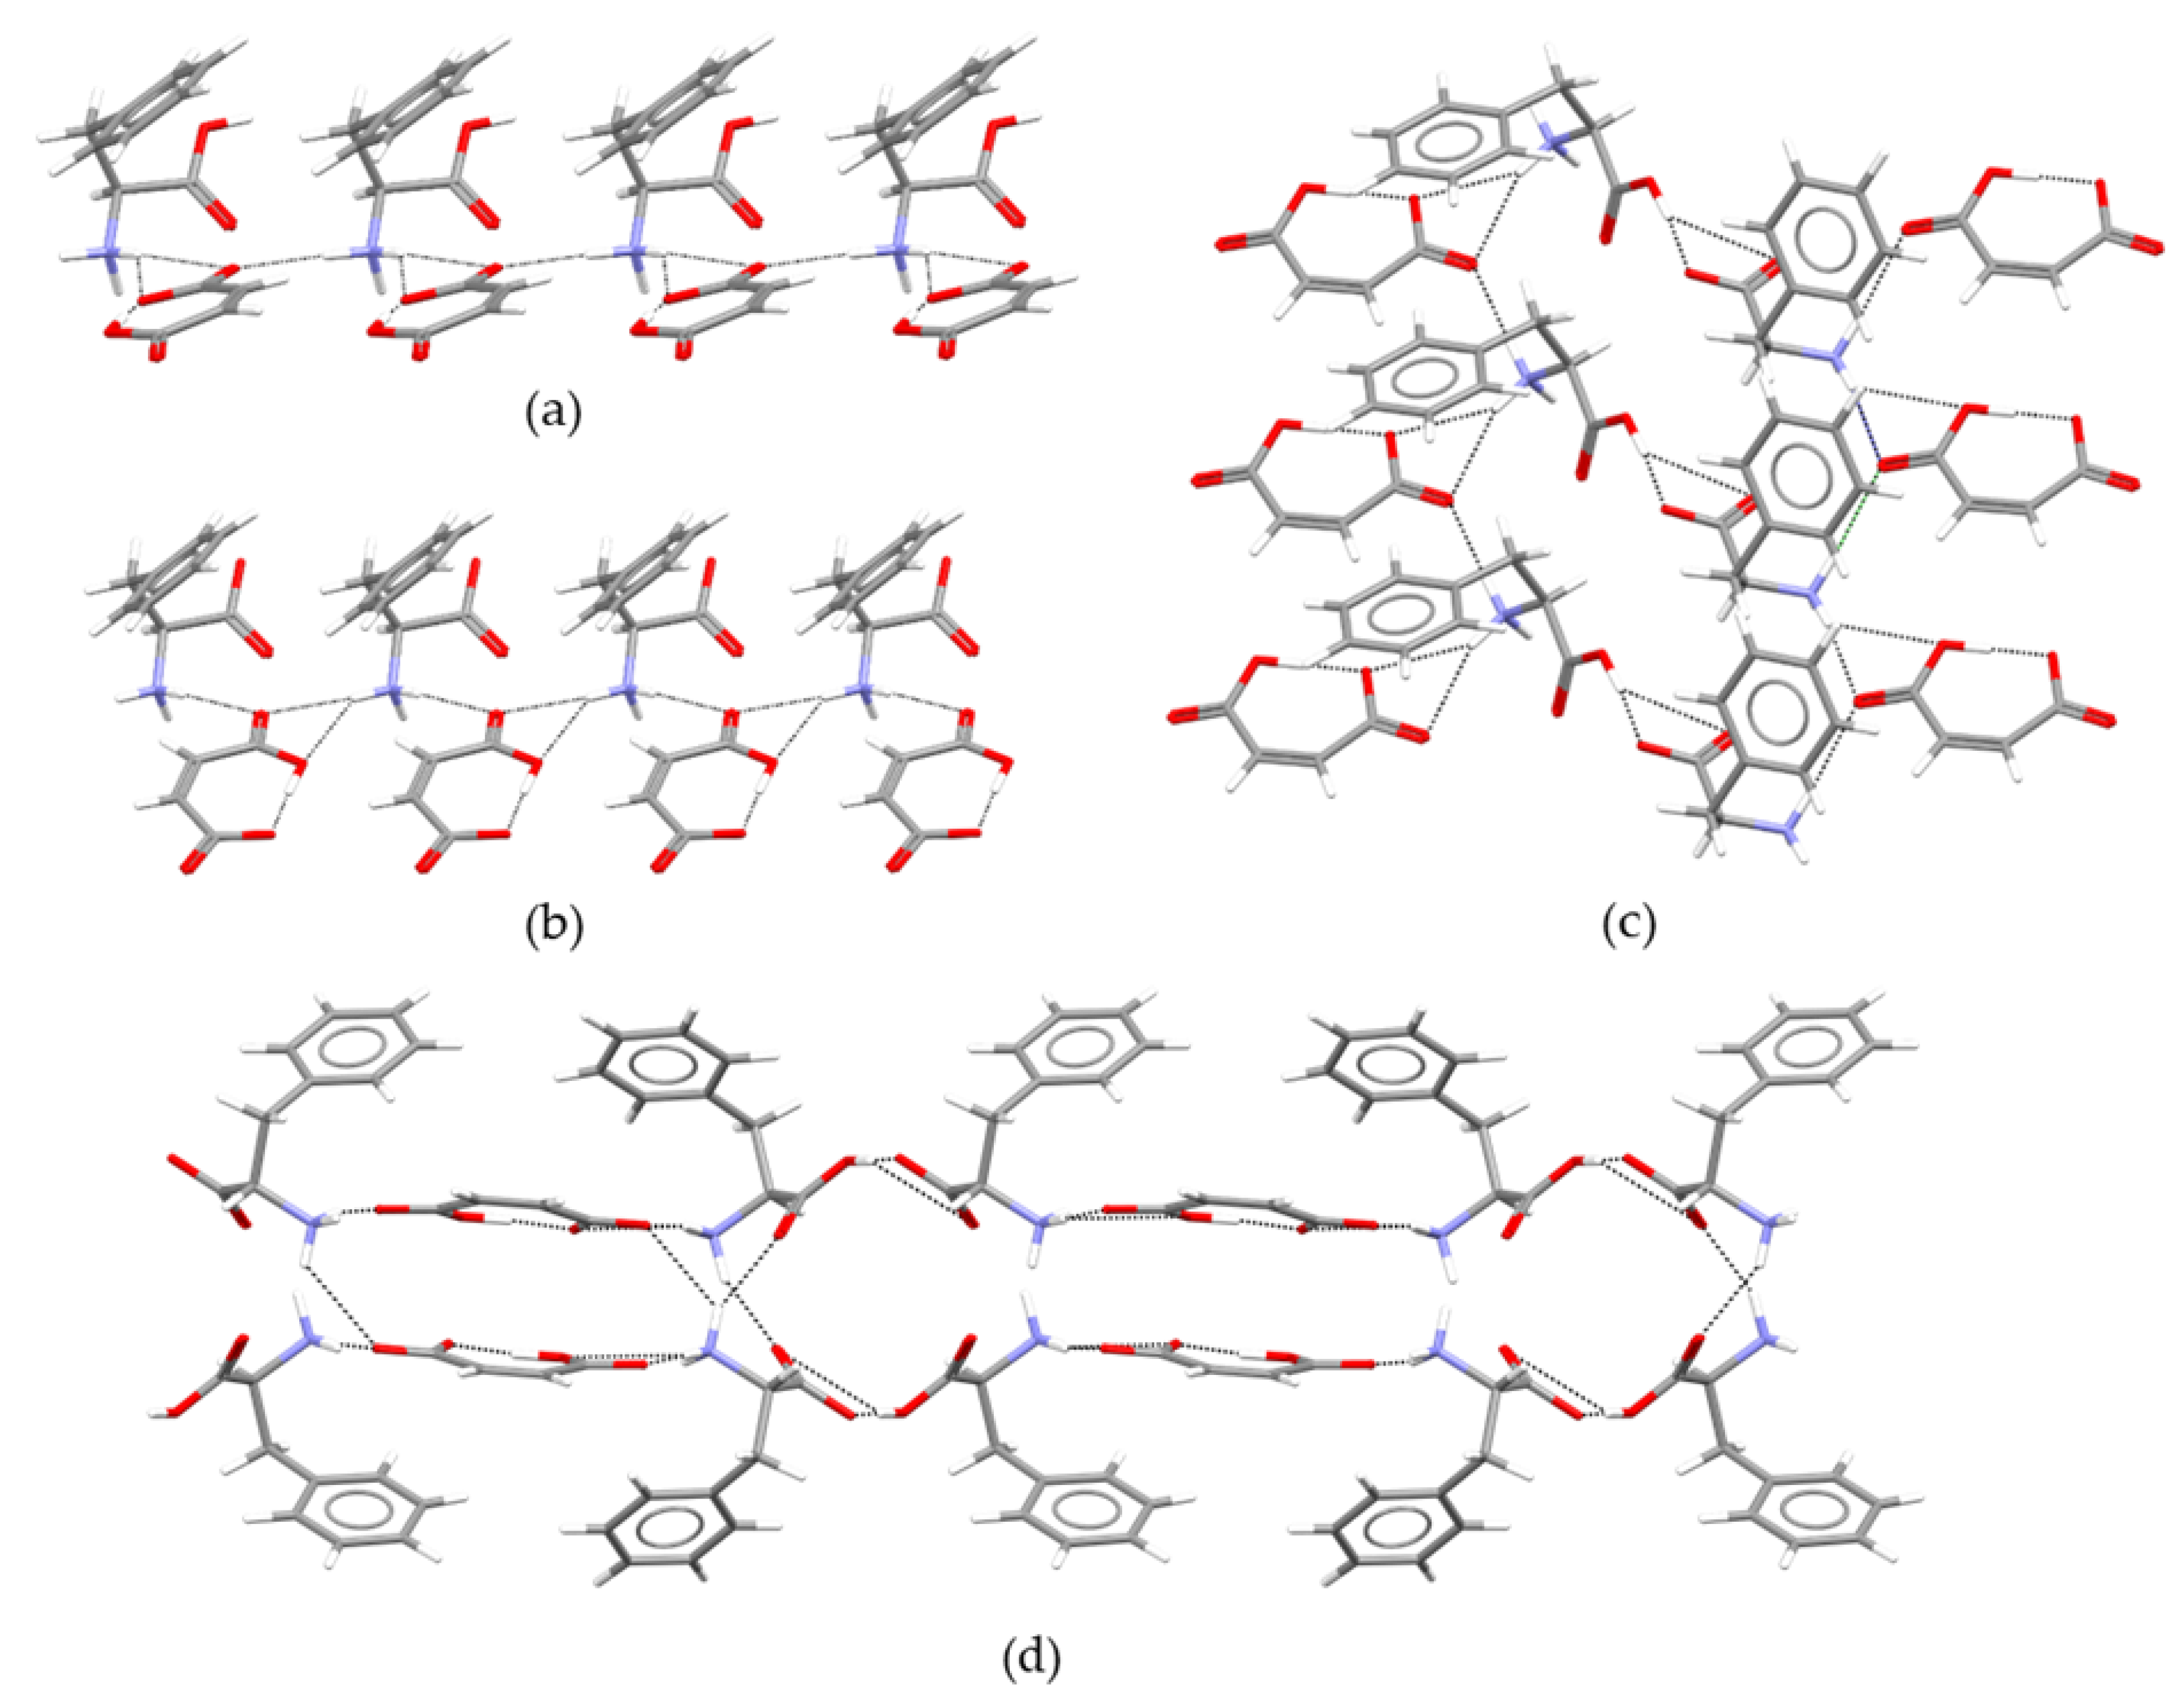
2.2. Structure
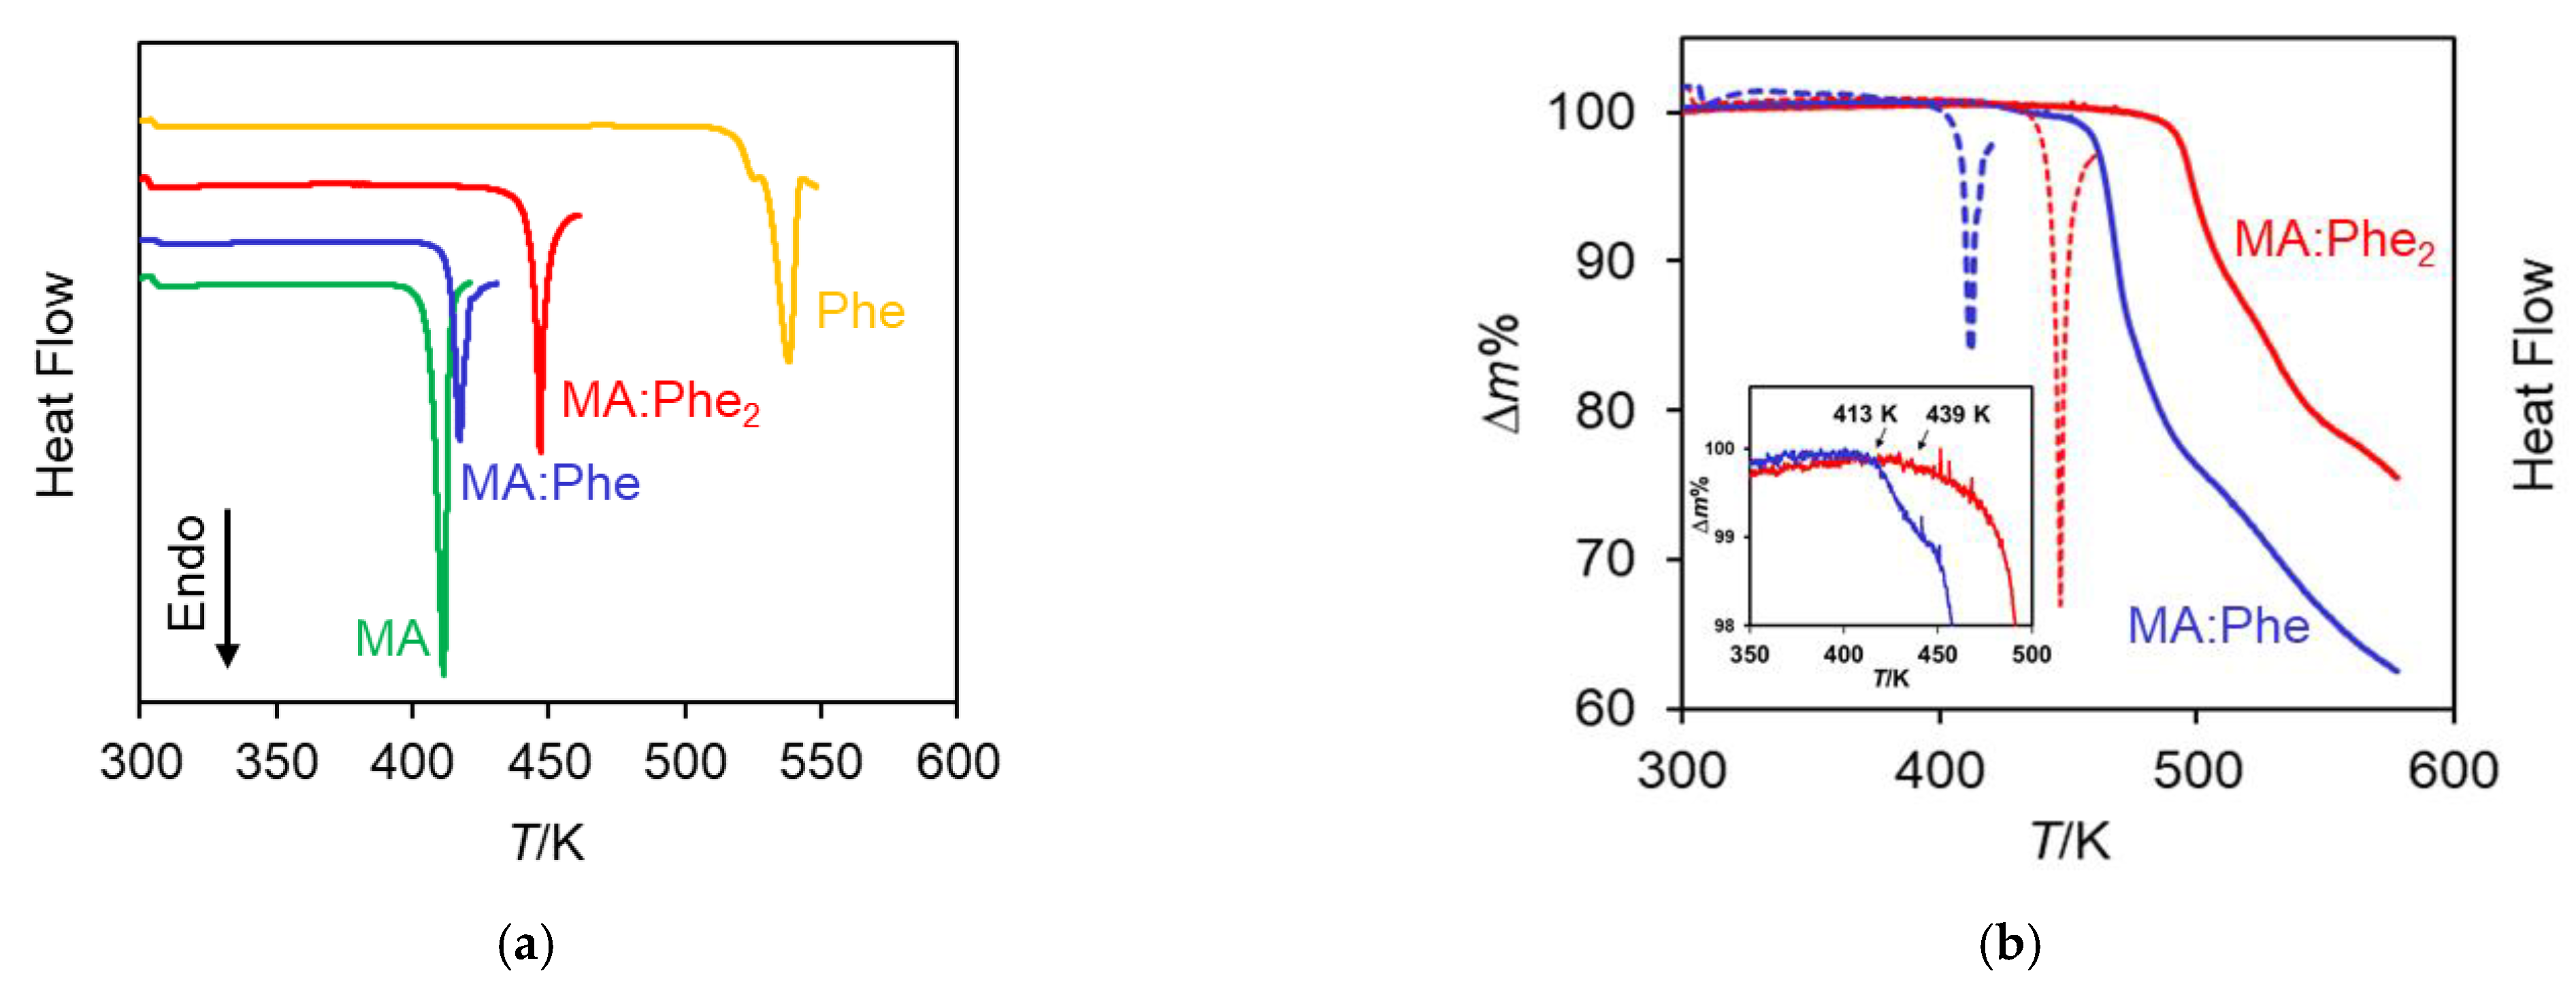
2.3. Thermal Analysis
2.4. Solution Calorimetry
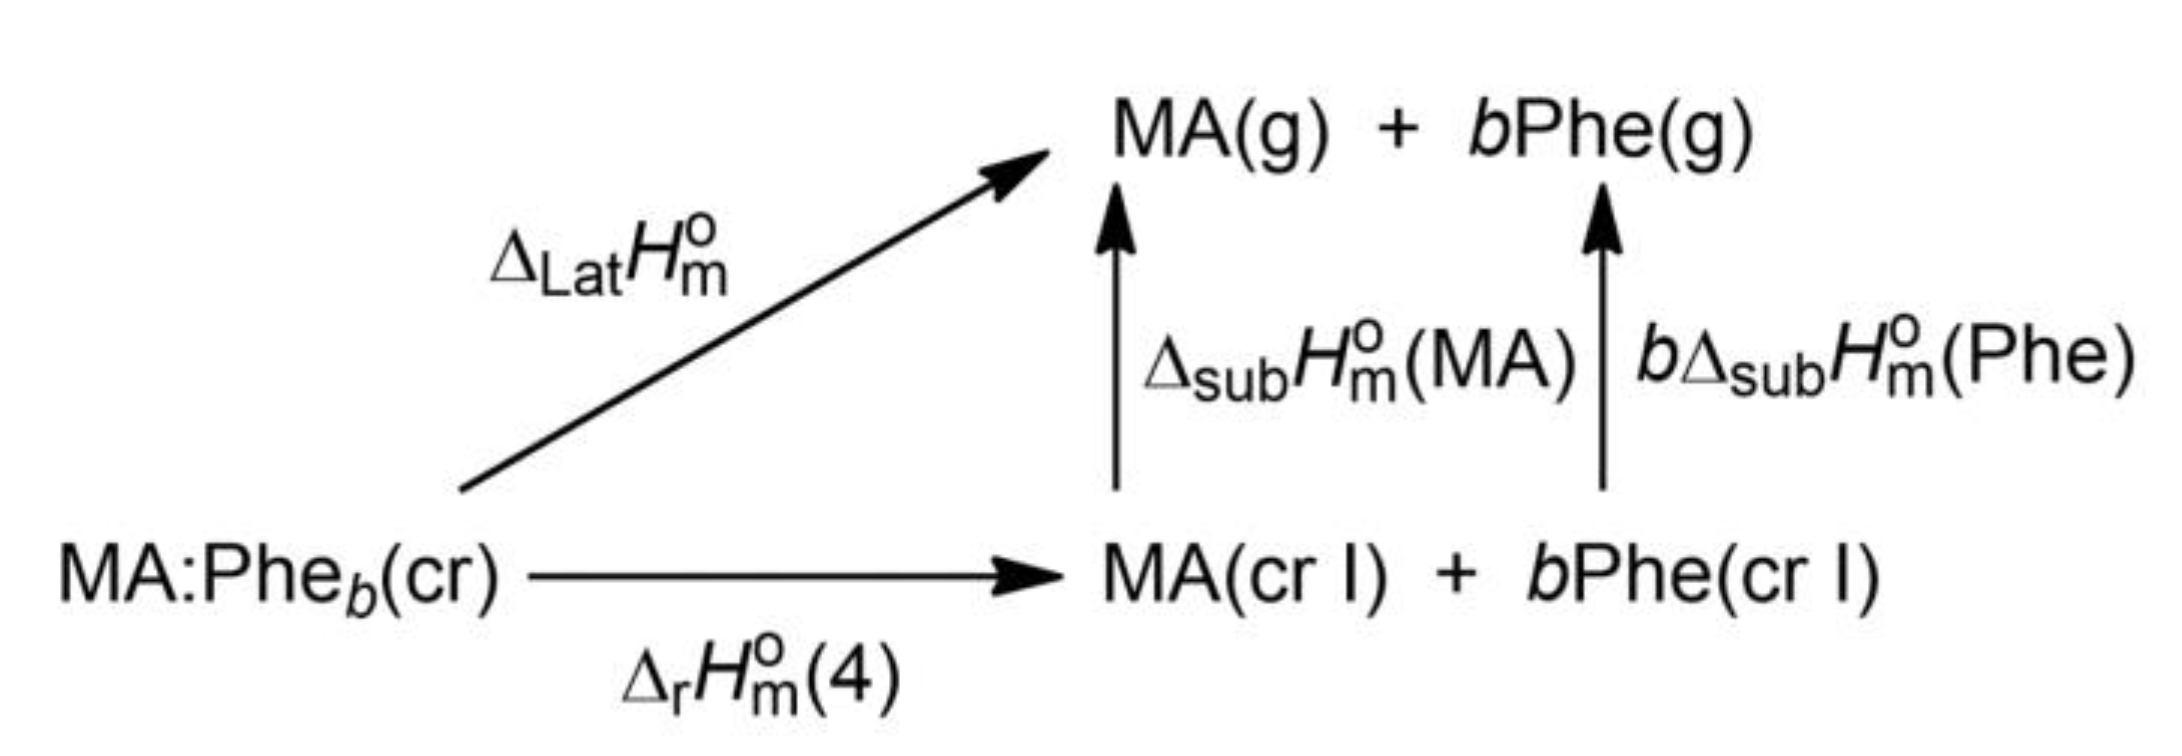
2.5. Lattice Enthalpies
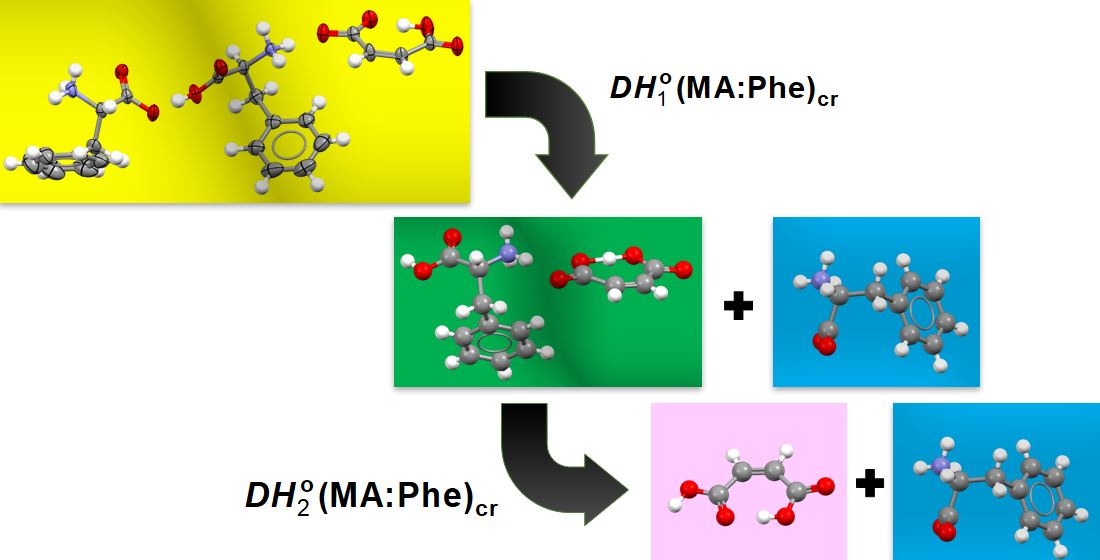
2.6. Dissociation Enthalpies
- (i)
- The MA:Phe2, MA:Phe, and MA:Gly bi-component crystals are stable towards dissociation into pure components, since positive values were obtained in all cases;
- (ii)
- MA:Phe2 should be more stable than MA:Phe, since = 2.1×. Given that = 444.6 ± 0.6 K was significantly larger than = 415.8 ± 0.6 K (Table 2), this is in line with previous observations in bi-component co-crystals, suggesting that the stoichiometric combination with the higher melting point is the most stable (larger dissociation Gibbs energy) [24];
- (iii)
- The first dissociation enthalpy of MA:Phe2, = 8.49 ± 0.34 kJ mol−1, is only slightly larger than the second, = 7.59 ± 0.20 kJ mol−1. This indicates that the enthalpic cost of removing the zwitterionic Phe± unit from MA:Phe2 to produce MA:Phe is not much different from that associated with the disruption of the MA:Phe lattice to yield neutral MA(cr I) and Phe(cr I), which implies the back neutralization of MA− by proton transfer from HPhe+ and the concomitant rearrangement of the latter to a zwitterionic tautomer;
- (iv)
- The dissociation enthalpy of MA:Phe (7.59 ± 0.20 kJ mol−1) is smaller than that of MA:Gly (9.6 ± 1.0 kJ mol−1), despite the fact that the opposite is observed in terms of lattice enthalpy (see Section 2.5). This stresses the fact that the values are not simply determined by the energetics of the bi-component crystal but also by that of the crystalline dissociation products considered.
3. Materials and Methods
3.1. General Analytical Methods
3.2. Materials
3.3. Single-Crystal X-ray Diffraction
3.4. Thermal Analysis
3.5. Solution Calorimetry
4. Conclusions
Supplementary Materials
Author Contributions
Funding
Institutional Review Board Statement
Informed Consent Statement
Conflicts of Interest
Sample Availability
References
- Wöhler, F. Untersuchungen über das chinon. Anal. Chem. Pharm. 1844, 51, 145–163. [Google Scholar] [CrossRef] [Green Version]
- Stahly, G.P. A survey of cocrystals reported prior to 2000. Cryst. Growth Des. 2009, 9, 4212–4229. [Google Scholar] [CrossRef]
- Kumar, A.; Kumar, S.; Nanda, A. A review about regulatory status and recent patents of pharmaceutical co-crystals. Adv. Pharm. Bull. 2018, 8, 355–363. [Google Scholar] [CrossRef]
- Qian, H.F.; Wang, Y.G.; Geng, J.; Huang, W. A rare case of a dye co-crystal showing better dyeing performance. CrystEngComm 2015, 17, 2083–2086. [Google Scholar] [CrossRef]
- Sekhon, B.S. Co-crystals of agrochemical actives. Int. J. Agric. Sci. 2015, 5, 472–475. [Google Scholar]
- Wong, M.S.; Bosshard, C.; Gunter, P. Crystal engineering of molecular NLO materials. Adv. Mater. 1997, 9, 837–842. [Google Scholar] [CrossRef]
- Kamalesu, S.; Swarnalatha, K.; Gomathi, S.; Muthiah, P.T. Synthesis, structure, optical and thermal studies of a new organic cocrystal: 2-Amino-5-nitropyridine: 2-Naphthoxy acetic acid. Optik 2017, 140, 786–793. [Google Scholar]
- Bolton, O.; Matzger, A.J. Improved stability and smart-material functionality realized in an energetic cocrystal. Angew. Chem. Int. Ed. 2011, 50, 8960–8963. [Google Scholar] [CrossRef]
- Bennion, J.C.; Matzger, A.J. Development and evolution of energetic cocrystals. Acc. Chem. Res. 2021, 54, 1699–1710. [Google Scholar] [CrossRef] [PubMed]
- Zhang, C.Y.; Jiao, F.B.; Li, H.Z. Crystal engineering for creating low sensitivity and highly energetic materials. Cryst. Growth Des. 2018, 18, 5713–5726. [Google Scholar] [CrossRef]
- Duggirala, N.K.; Perry, M.L.; Almarsson, Ö.; Zaworotko, M.J. Pharmaceutical cocrystals: Along the path to improved medicines. Chem. Commun. 2016, 52, 640–655. [Google Scholar] [CrossRef]
- Cherukuvada, S.; Kaur, R.; Row, T.N.G. Co-crystallization and small molecule crystal form diversity: From pharmaceutical to materials applications. CrystEngComm 2016, 18, 8528–8555. [Google Scholar] [CrossRef]
- Gadade, D.D.; Pekamwar, S.S. Pharmaceutical cocrystals: Regulatory and strategic aspects, design and dkevelopment. Adv. Pharm. Bull. 2016, 6, 479–494. [Google Scholar] [CrossRef]
- Kale, D.P.; Zode, S.S.; Bansal, A.K. Challenges in translational development of pharmaceutical cocrystals. J. Pharm. Sci. 2017, 106, 457–470. [Google Scholar] [CrossRef]
- Dalpiaz, A.; Pavan, B.; Ferretti, V. Can pharmaceutical co-crystals provide an opportunity to modify the biological properties of drugs? Drug Discov. Today 2017, 22, 1134–1138. [Google Scholar] [CrossRef]
- Karimi-Jafari, M.; Padrela, L.; Walker, G.M.; Croker, D.M. Creating cocrystals: A review of pharmaceutical cocrystal preparation routes and applications. Cryst. Growth Des. 2018, 18, 6370–6387. [Google Scholar] [CrossRef]
- Sokal, A.; Pindelska, E. Pharmaceutical cocrystals as an opportunity to modify drug properties: From the idea to application: A Review. Curr. Pharm. Des. 2018, 24, 1357–1365. [Google Scholar] [CrossRef] [PubMed]
- Yousef, M.A.E.; Vangala, V.R. Pharmaceutical cocrystals: Molecules, crystals, formulations, medicines. Cryst. Growth Des. 2019, 19, 7420–7438. [Google Scholar] [CrossRef]
- Malamatari, M.; Ross, S.A.; Douroumis, D.; Velaga, S.P. Experimental cocrystal screening and solution based scale-up cocrystallization methods. Adv. Drug Deliv. Rev. 2017, 117, 162–177. [Google Scholar] [CrossRef]
- Kavanagh, O.N.; Croker, D.M.; Walker, G.M.; Zaworotko, M.J. Pharmaceutical cocrystals: From serendipity to design to application. Drug Discov. Today 2019, 24, 796–804. [Google Scholar] [CrossRef] [Green Version]
- Almansa, C.; Frampton, C.S.; Vela, J.M.; Whitelock, S.; Plata-Salamán, C.R. Co-crystals as a new approach to multimodal analgesia and the treatment of pain. J. Pain Res. 2019, 12, 2679–2689. [Google Scholar] [CrossRef] [Green Version]
- Wang, X.; Du, S.; Zhang, R.; Jia, X.; Yang, T.; Zhang, X. Drug-drug cocrystals: Opportunities and challenges. Asian J. Pharm. Sci. 2021, 16, 307–317. [Google Scholar] [CrossRef] [PubMed]
- Abdelquader, M.M.; Essa, E.A.; El Maghraby, G.M. Inhibition of co-crystallization of olmesartan medoxomil and hydrochlorothiazide for enhanced dissolution rate in their fixed dose combination. AAPS PharmSciTech 2019, 20, 1–12. [Google Scholar] [CrossRef] [PubMed]
- Perlovich, G.L. Formation thermodynamics of two-component molecular crystals: Polymorphism, stoichiometry, and impact of enantiomers. Cryst. Growth Des. 2020, 20, 5526–5537. [Google Scholar] [CrossRef]
- Taylor, C.R.; Day, G.M. Evaluating the energetic driving force for cocrystal formation. Cryst. Growth Des. 2018, 18, 892–904. [Google Scholar] [CrossRef] [PubMed] [Green Version]
- Martinho Simões, J.A.; Minas da Piedade, M.E. Molecular Energetics; Oxford University Press: New York, NY, USA, 2008. [Google Scholar]
- Évora, A.O.L.; Bernardes, C.E.S.; Piedade, M.F.M.; Conceição, A.C.L.; Minas da Piedade, M.E. Energetics of glycine cocrystal or salt formation with two regioisomers: Fumaric acid and maleic acid. Cryst. Growth Des. 2019, 19, 5054–5064. [Google Scholar] [CrossRef]
- Groom, C.R.; Bruno, I.J.; Lightfoot, M.P.; Ward, S.C. The Cambridge Structural Database. Acta Crystallogr. 2016, B72, 171–179. [Google Scholar] [CrossRef]
- Suzuki, K.; Seki, S. Physicochemical studies of molecular compounds. IV. Heats of solution of crystalline quinone, hydroquinone and quinidrone into acetone and heat of formation of crystalline quinhydrone. Bull. Chem. Soc. Jpn. 1953, 26, 372–380. [Google Scholar] [CrossRef] [Green Version]
- Zhang, S.W.; Brunskill, A.P.J.; Schwartz, E.; Sun, S.W. Celecoxib-nicotinamide cocrystal revisited: Can entropy control cocrystal formation? Cryst. Growth Des. 2017, 17, 2836–2843. [Google Scholar] [CrossRef]
- Araujo, G.L.B.; Ferreira, F.F.; Bernardes, C.E.S.; Sato, J.A.P.; Gil, O.M.; Faria, D.L.A.; Loebenberg, R.; Byrn, S.R.; Ghisleni, D.D.M.; Bou-Chacra, N.A.; et al. A new thermodynamically favored flubendazole/maleic acid binary crystal form: Structure, energetics, and in silico PBPK model-based investigation. Cryst. Growth Des. 2018, 18, 2377–2386. [Google Scholar] [CrossRef]
- Ahuja, D.; Svard, M.; Rasmuson, A.C. Investigation of solid-liquid phase diagrams of the sulfamethazine-salicylic acid co-crystal. CrystEngComm 2019, 21, 2863–2874. [Google Scholar] [CrossRef]
- Svard, M.; Ahuja, D.; Rasmuson, Å.C. Calorimetric determination of cocrystal thermodynamic stability: Sulfamethazine-salicylic acid case study. Cryst. Growth Des. 2020, 20, 4243–4251. [Google Scholar] [CrossRef]
- Vasilev, N.A.; Surov, A.O.; Voronin, A.P.; Drozd, K.V.; Perlovich, G.L. Novel cocrystals of itraconazole: Insights from phase diagrams, formation thermodynamics and solubility. Int. J. Pharmaceut. 2021, 599, 120441. [Google Scholar] [CrossRef]
- Li, Z.; Matzger, A.J. Influence of coformer stoichiometric ratio on pharmaceutical cocrystal dissolution: Three cocrystals of carbamazepine/4-aminobenzoic acid. Mol. Pharmaceut. 2016, 13, 990–995. [Google Scholar] [CrossRef] [PubMed] [Green Version]
- Jayasankar, A.; Reddy, L.S.; Bethune, S.J.; Rodriguez-Hornedo, N. Role of cocrystal and solution chemistry on the formation and stability of cocrystals with different stoichiometry. Cryst. Growth Des. 2009, 9, 889–897. [Google Scholar] [CrossRef]
- James, M.N.G.; Williams, G.J. Refinement of crystal-structure of maleic acid. Acta Crystallogr. 1974, B30, 1249–1257. [Google Scholar] [CrossRef] [Green Version]
- Ihlefeldt, F.S.; Pettersen, F.B.; von Bonin, A.; Zawadzka, M.; Gorbitz, C.H. The polymorphs of L-phenylalanine. Angew. Chem. 2014, 53, 13600–13604. [Google Scholar] [CrossRef]
- Woińska, M.; Jayatilaka, D.; Spackman, M.A.; Edwards, A.J.; Dominiak, P.M.; Woźniak, K.; Nishibori, E.; Sugimoto, K.; Grabowsky, S. Hirshfeld atom refinement for modelling strong hydrogen bonds. Acta Crystallogr. 2014, A70, 483–498. [Google Scholar] [CrossRef]
- Alagar, M.; Krishnakumar, R.V.; Natarajan, S. L-phenylalaninium maleate. Acta Crystallogr. 2001, E57, o968–o970. [Google Scholar] [CrossRef]
- Macrae, C.F.; Edgington, P.R.; McCabe, P.; Pidcock, E.; Shields, G.P.; Taylor, R.; Towler, M.; van de Streek, J. Mercury: Visualization and analysis of crystal structures. J. Appl. Cryst. 2006, 39, 453–457. [Google Scholar] [CrossRef] [Green Version]
- Kitaigorodsky, A.I. Molecular Crystals and Molecules; Academic Press: New York, NY, USA, 1973. [Google Scholar]
- Spek, A.L. PLATON, A Multipurpose Crystallographic Tool; Utrecht University: Utrecht, The Netherlands, 2007. [Google Scholar]
- Perlovich, G.L. Two-component molecular crystals: Evaluation of the formation thermodynamics based on melting points and sublimation data. CrystEngComm 2017, 19, 2870–2883. [Google Scholar] [CrossRef] [Green Version]
- Guo, K.; Sadiq, G.; Seaton, C.; Davey, R.; Yin, Q.X. Co-crystallization in the caffeine/maleic acid system: Lessons from phase equilibria. Cryst. Growth Des. 2010, 10, 268–273. [Google Scholar] [CrossRef]
- Lu, J.; Wang, J.; Li, Z.; Rohani, S. Characterization and pseudopolymorphism of L-phenylalanine anhydrous and monohydrate forms. Afr. J. Pharm. Pharmacol. 2012, 6, 269–277. [Google Scholar] [CrossRef] [Green Version]
- Li, J.; Liu, Y.W.; Shi, J.Y.; Wang, Z.Y.; Hu, L.; Yang, X.; Wang, C.X. The investigation of thermal decomposition pathways of phenylalanine and tyrosine by TG-FTIR. Thermochim. Acta 2008, 467, 20–29. [Google Scholar]
- Pedley, J.B. Thermochemical Data and Structures of Organic Compounds; Thermodynamics Research Center: College Station, TX, USA, 1994. [Google Scholar]
- Tyunina, V.V.; Krasnov, A.V.; Tyunina, E.Y.; Badelin, V.G.; Girichev, G.V. Enthalpy of sublimation of natural aromatic amino acids determined by Knudsen's effusion mass spectrometric method. J. Chem. Thermodyn. 2014, 74, 221–226. [Google Scholar] [CrossRef]
- Laugier, J.; Bochu, B. CELREF V3; ENSP/Laboratoire des Matériaux et du Génie Physique: Saint Martin d'Hères, France, 2003; Available online: http://www.CCP14.ac.uk/tutorial/lmgp/CELREF.htm (accessed on 15 August 2021).
- APEX3; Bruker AXS Inc.: Madison, WI, USA, 2016.
- SADABS. Area-Detector Absorption Correction; Bruker AXS Inc.: Madison, WI, USA, 2004.
- SAINT: Area-Detector Integration Software (Version7.23); Bruker AXS Inc.: Madison, WI, USA, 2004.
- Sheldrick, G.M. A short history of SHELX. Acta Cryst. 2008, A64, 112–122. [Google Scholar] [CrossRef] [Green Version]
- Farrugia, L.J. WinGX and ORTEP for Windows: An update. J. Appl. Crystallogr. 2012, 45, 849–854. [Google Scholar] [CrossRef]
- Bernardes, C.E.S. CBCAL 3.0-A Program for Calorimeter Control and Data Acquisition; FCUL: Lisbon, Portugal, 2019. [Google Scholar]
- Bernardes, C.E.S. EASY GRAPH II-making data plotting and analysis easier (Version 2.0.20.1). Zenodo 2021. [Google Scholar] [CrossRef]


| MA(cr I) b | Phe(cr I) c | MA:Phe d | MA:Phe2 e | |
|---|---|---|---|---|
| Space Group | P21/c | P21 | P21 | P21 |
| a/Å | 7.473 (1) | 8.795 (4) | 11.0560 (9) | 13.9549 (17) |
| b/Å | 10.098 (2) | 6.0363 (2) | 5.3326 (4) | 5.4179 (6) |
| c/Å | 7.627 (2) | 31.5233 (13) | 11.4712 (7) | 15.4056 (16) |
| β/deg | 123.59 (2) | 96.6441 (12) | 101.070 (10) | 108.795 (10) |
| V/Å3 | 479.44 (17) | 1662.40 (12) | 663.73 (8) | 1102.65 (21) |
| Z | 4 | 8 | 2 | 2 |
| ρ/g⋅cm−3 | 1.6081 (6) | 1.3201 (1) | 1.4073 (2) | 1.3447 (3) |
| Vo/Å3 | 86.7 | 144.2 | 230.6 | 377.7 |
| k | 0.723 | 0.694 | 0.695 | 0.685 |
| Compound | ||||
|---|---|---|---|---|
| MA(cr I) | Phen(cr I) | MA:Phe | MA:Phe2 | |
| Ton/K | 410.7 ± 1.4 (4) | 517 | 415.8 ± 0.6 (12) | 444.6 ± 0.6 (5) |
| Tmax/K | 412.9 ± 1.0 (4) | 527 (1) 537 (1) | 418.8 ± 0.8 (12) | 447.3 ± 0.8 (5) |
| /kJ mol−1 | 38.6 ± 0.6 | Dec. | Dec. | Dec. |
| Compound | ||
|---|---|---|
| MA:Phe | MA:Phe2 | |
| b | 1 | 2 |
| 34.97 ± 0.13 | 50.48 ± 0.22 | |
| 20.34 ± 0.15 | 20.34 ± 0.15 | |
| 7.04 ± 0.05 | 7.03 ± 0.06 | |
| 7.59 ± 0.20 | 16.08 ± 0.27 | |
| Reaction | |
|---|---|
| MA:Phe2(cr) → MA:Phe(cr) + Phe(cr I) | 8.49 ± 0.34 |
| MA:Phe(cr) → MA(cr I) + Phe(cr I) | 7.59 ± 0.20 |
| MA:Phe2(cr) → MA(cr I) + 2Phe(cr I) | 16.08 ± 0.27 |
| MA:Gly(cr) → MA(cr I) + Gly(cr γ) | 9.6 ± 1.0 a |
| CCDC reference number | 2102636 | 2102637 |
| Empirical formula | C22H26N2O8 | C22H26N2O8 |
| Formula weight | 446.46 | 446.46 |
| T/K | 168 ± 2 | 293 ± 2 |
| Crystal size/mm | 0.40 × 0.35 × 0.10 | 0.80 × 0.60 × 0.20 |
| Crystal color | Colorless | Colorless |
| Crystal system | Monoclinic | Monoclinic |
| Space group | P21 | P21 |
| a/Å | 13.7482 (17) | 13.9549 (17) |
| b/Å | 5.4010 (7) | 5.4179 (6) |
| c/Å | 15.3787 (19) | 15.4056 (16) |
| β/deg | 109.028 (4) | 108.795 (3) |
| V/Å3 | 1079.5 (2) | 1102.7 (2) |
| Z/Z’ | 2/1 | 2/1 |
| ρcalc/g⋅cm−3 | 1.373 (1) | 1.345 (1) |
| µ/mm−1 | 0.105 | 0.103 |
| F (000) | 472 | 472 |
| θ limits/deg | 2.419–26.466 | 2.390–26.477 |
| Limiting indices | –17 ≤ h ≤17 | –17 ≤ h ≤17 |
| –6 ≤ k ≤ 6 | –6 ≤ k ≤ 6 | |
| –19 ≤ l ≤ 19 | –19 ≤ l ≤ 19 | |
| Number of reflections collected/unique | 17895/4434; [R(int) = 0.0599] | 48992/4451; [R(int) = 0.0519] |
| Completeness to θ | 99.7% | 96.9% |
| Data/restraints/parameters | 4434/1/321 | 4451/1/321 |
| GOF on F2 | 1.067 | 1.054 |
| Final R indices [l > 2σ(l)] | R1 = 0.0497; R2 = 0.1116 | R1 = 0.0368; R2 = 0.0844 |
| R indices (all data) | R1 = 0.0631; R2 = 0.1159 | R1 = 0.0439; R2 = 0.0878 |
| Largest diff peak and hole/e Å3 | 0.302 and −0.211 | 0.149 and –0.122 |
Publisher’s Note: MDPI stays neutral with regard to jurisdictional claims in published maps and institutional affiliations. |
© 2021 by the authors. Licensee MDPI, Basel, Switzerland. This article is an open access article distributed under the terms and conditions of the Creative Commons Attribution (CC BY) license (https://creativecommons.org/licenses/by/4.0/).
Share and Cite
Feliciano, I.O.; Silva, D.P.; Piedade, M.F.M.; Bernardes, C.E.S.; Minas da Piedade, M.E. First and Second Dissociation Enthalpies in Bi-Component Crystals Consisting of Maleic Acid and L-Phenylalanine. Molecules 2021, 26, 5714. https://doi.org/10.3390/molecules26185714
Feliciano IO, Silva DP, Piedade MFM, Bernardes CES, Minas da Piedade ME. First and Second Dissociation Enthalpies in Bi-Component Crystals Consisting of Maleic Acid and L-Phenylalanine. Molecules. 2021; 26(18):5714. https://doi.org/10.3390/molecules26185714
Chicago/Turabian StyleFeliciano, Inês O., Daniela P. Silva, M. Fátima M. Piedade, Carlos E. S. Bernardes, and Manuel E. Minas da Piedade. 2021. "First and Second Dissociation Enthalpies in Bi-Component Crystals Consisting of Maleic Acid and L-Phenylalanine" Molecules 26, no. 18: 5714. https://doi.org/10.3390/molecules26185714
APA StyleFeliciano, I. O., Silva, D. P., Piedade, M. F. M., Bernardes, C. E. S., & Minas da Piedade, M. E. (2021). First and Second Dissociation Enthalpies in Bi-Component Crystals Consisting of Maleic Acid and L-Phenylalanine. Molecules, 26(18), 5714. https://doi.org/10.3390/molecules26185714