
Ozonation of Decalin as a Model Saturated Cyclic Molecule: A Spectroscopic Study

 ,
, 
Abstract
:1. Introduction
2. Results and Discussion
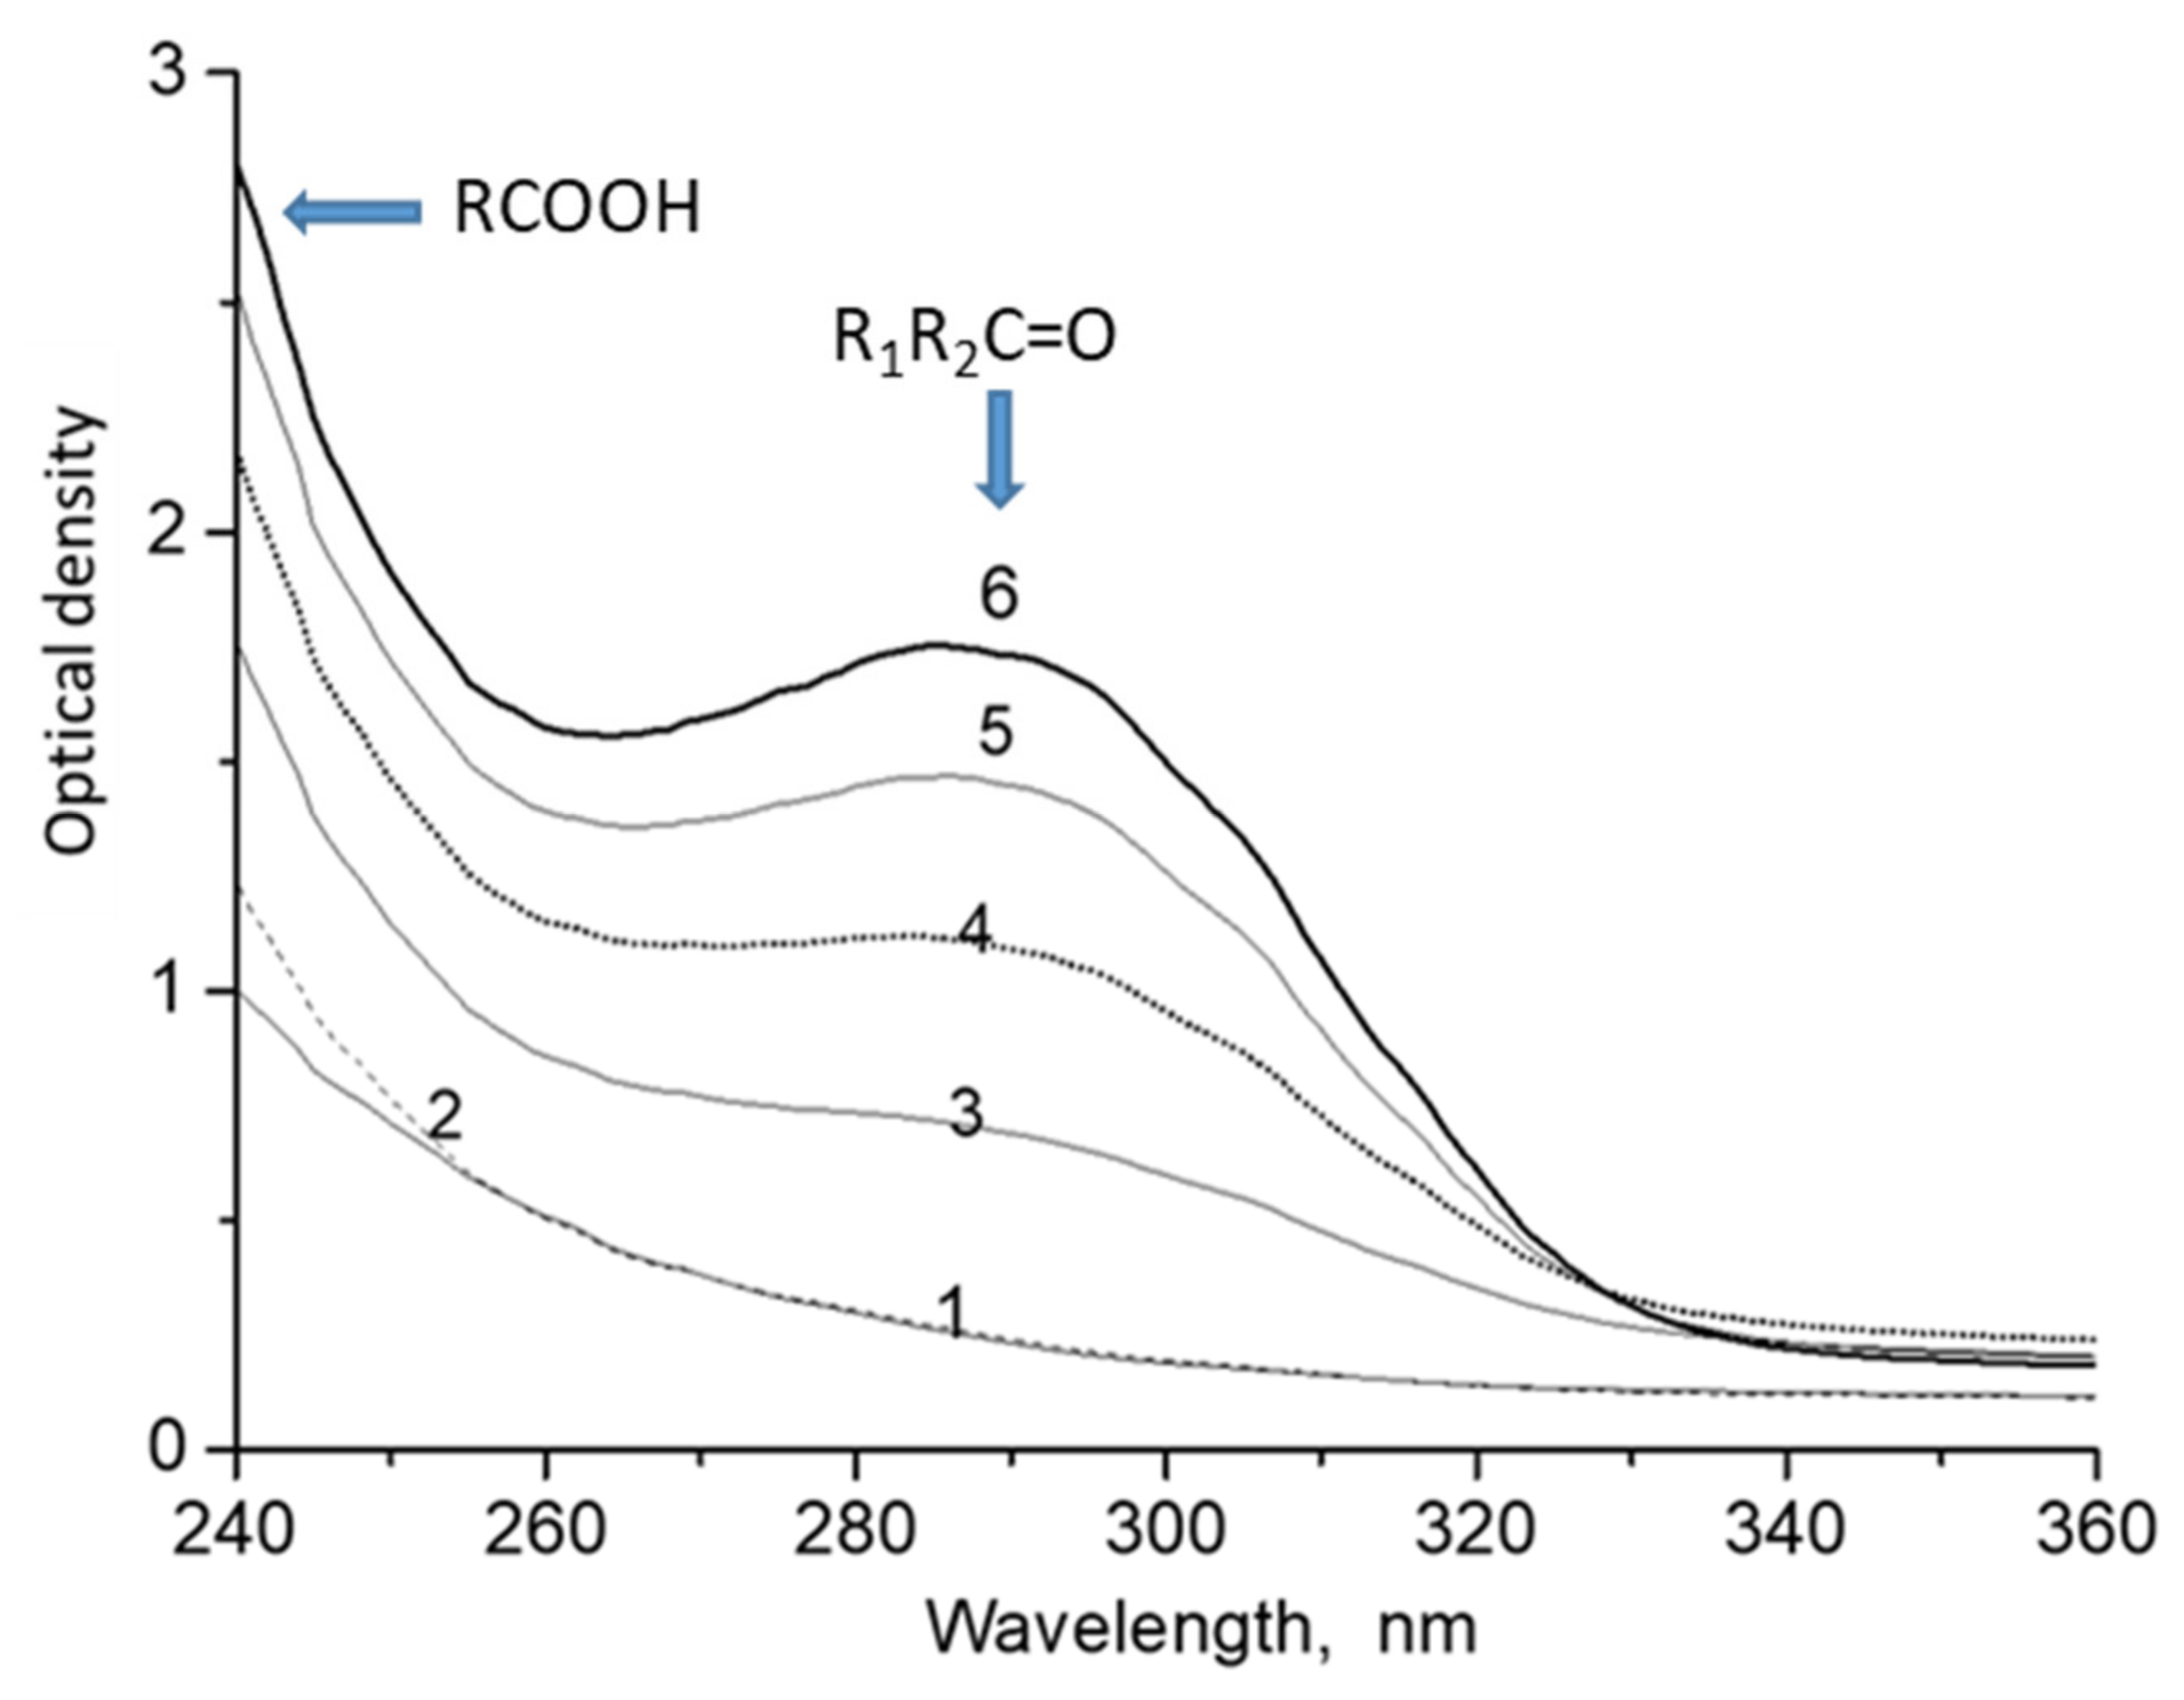
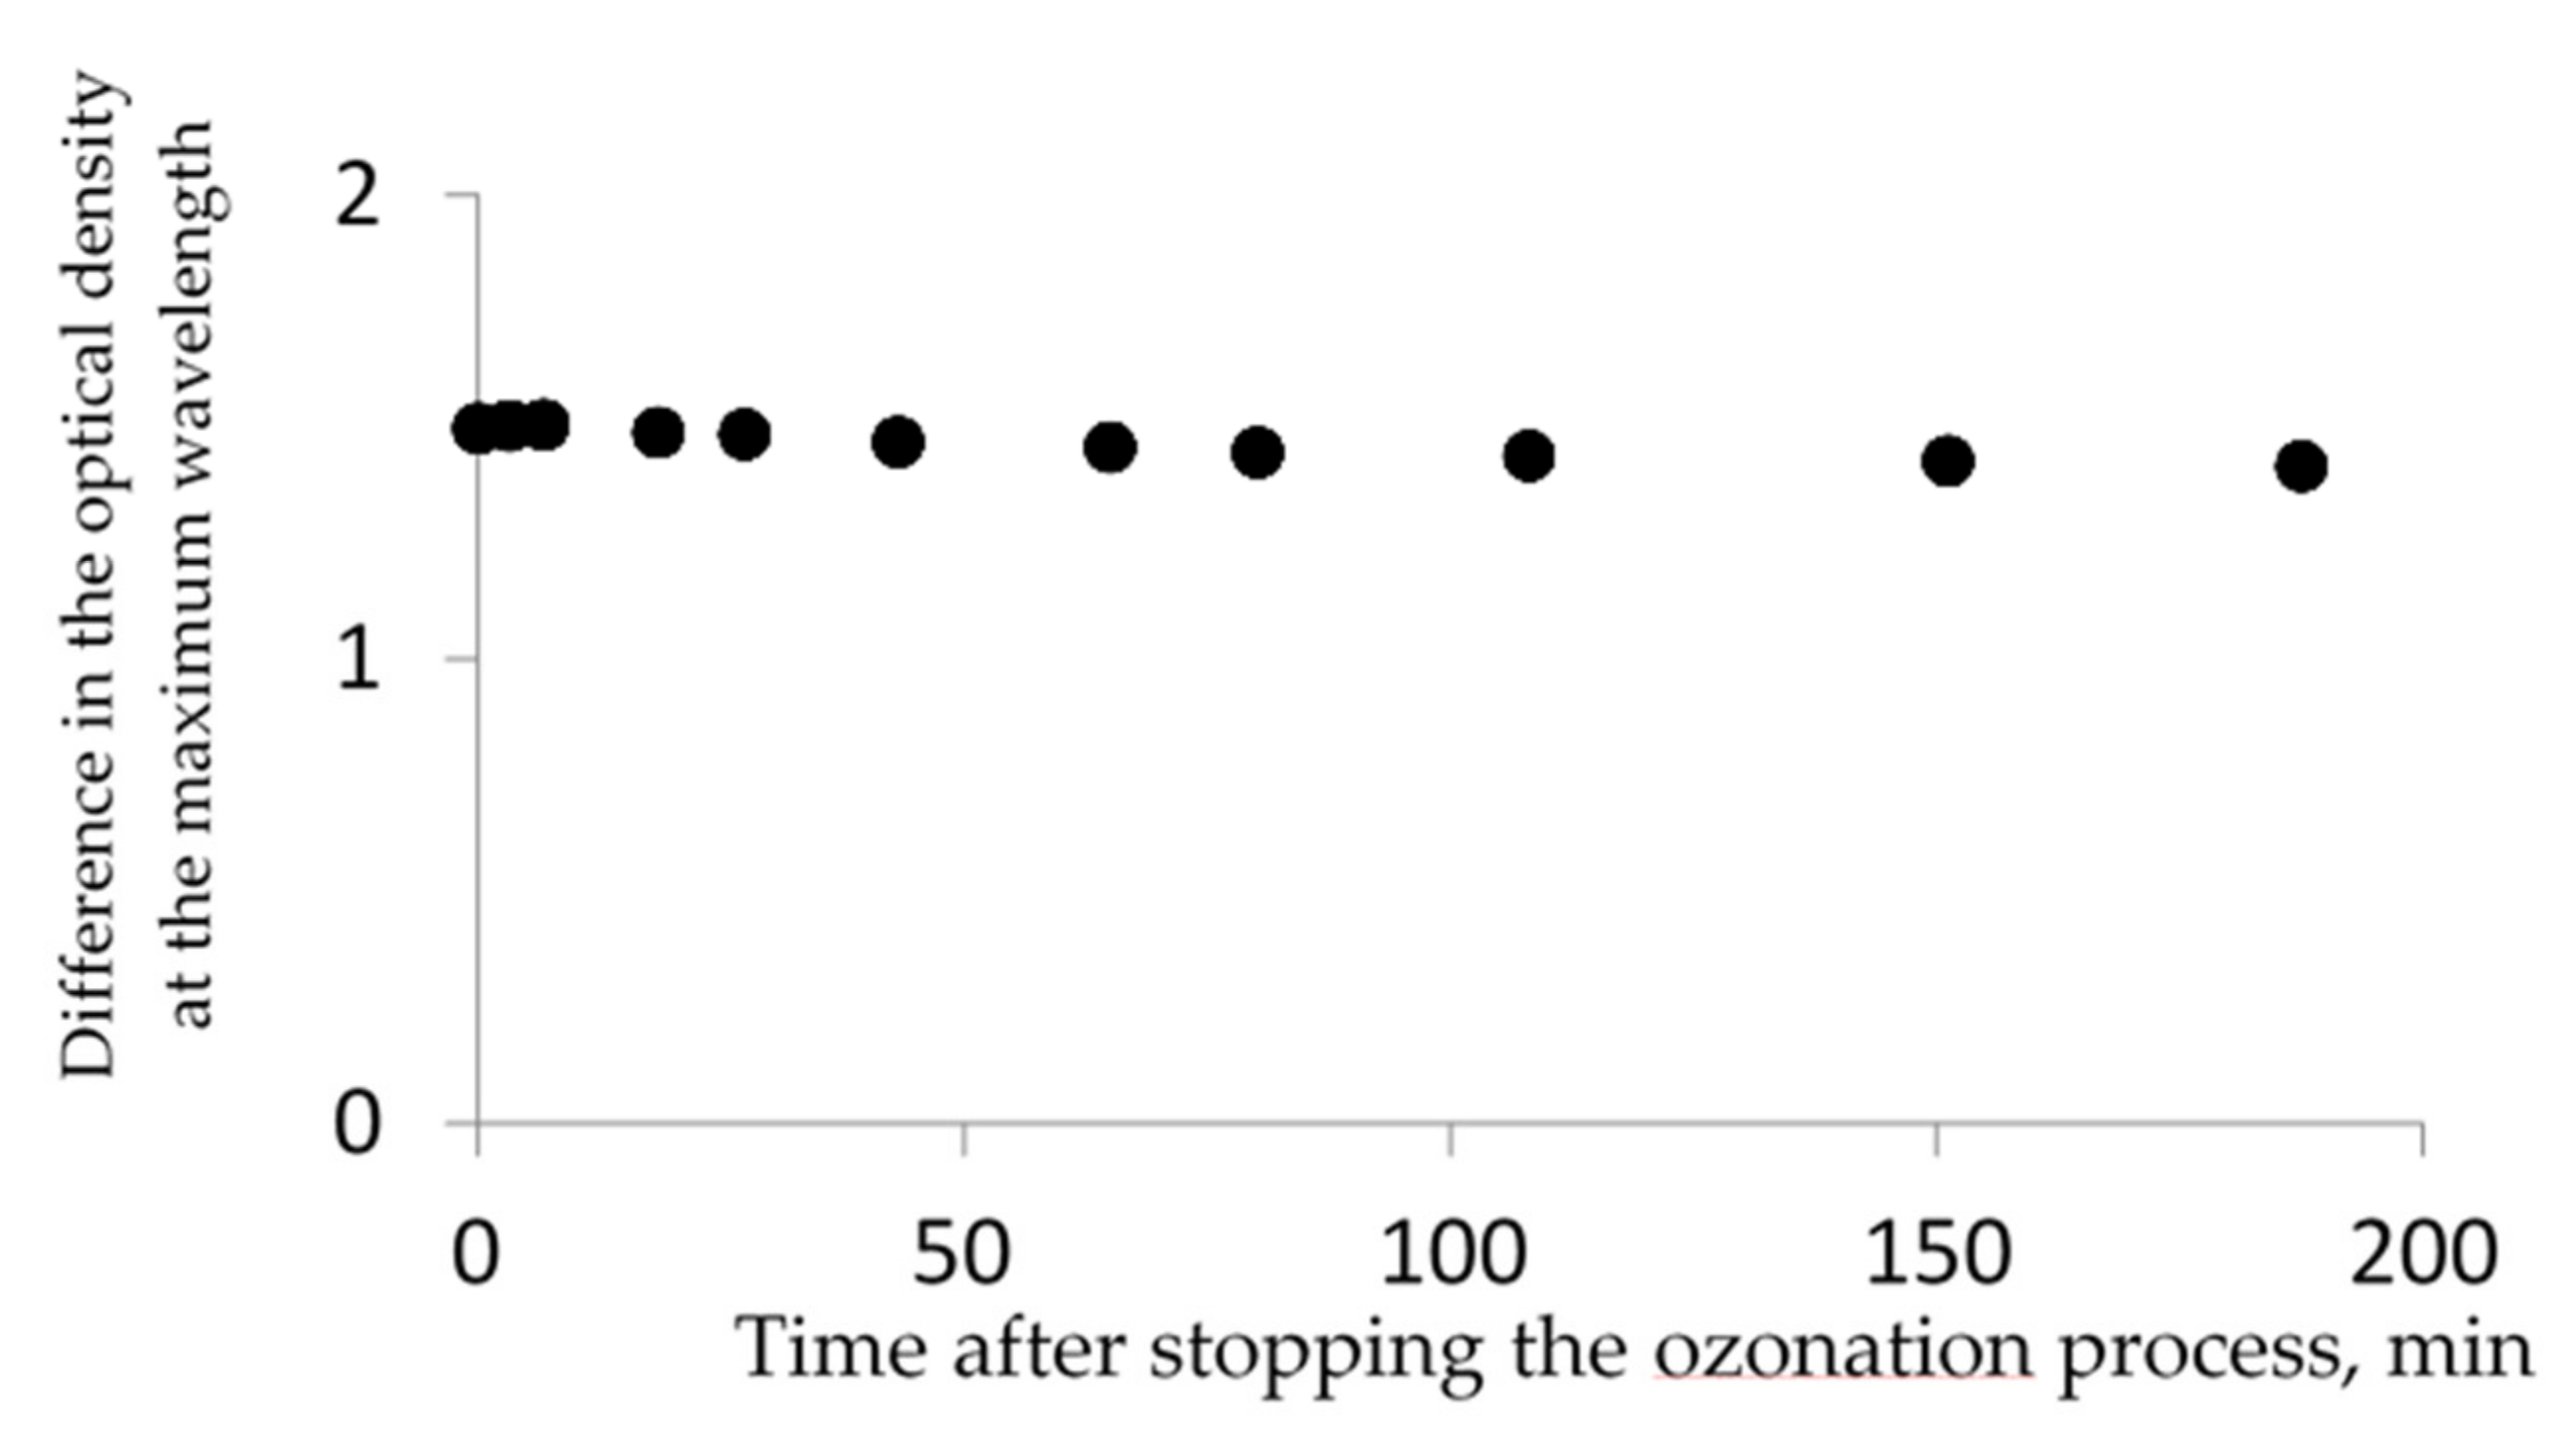
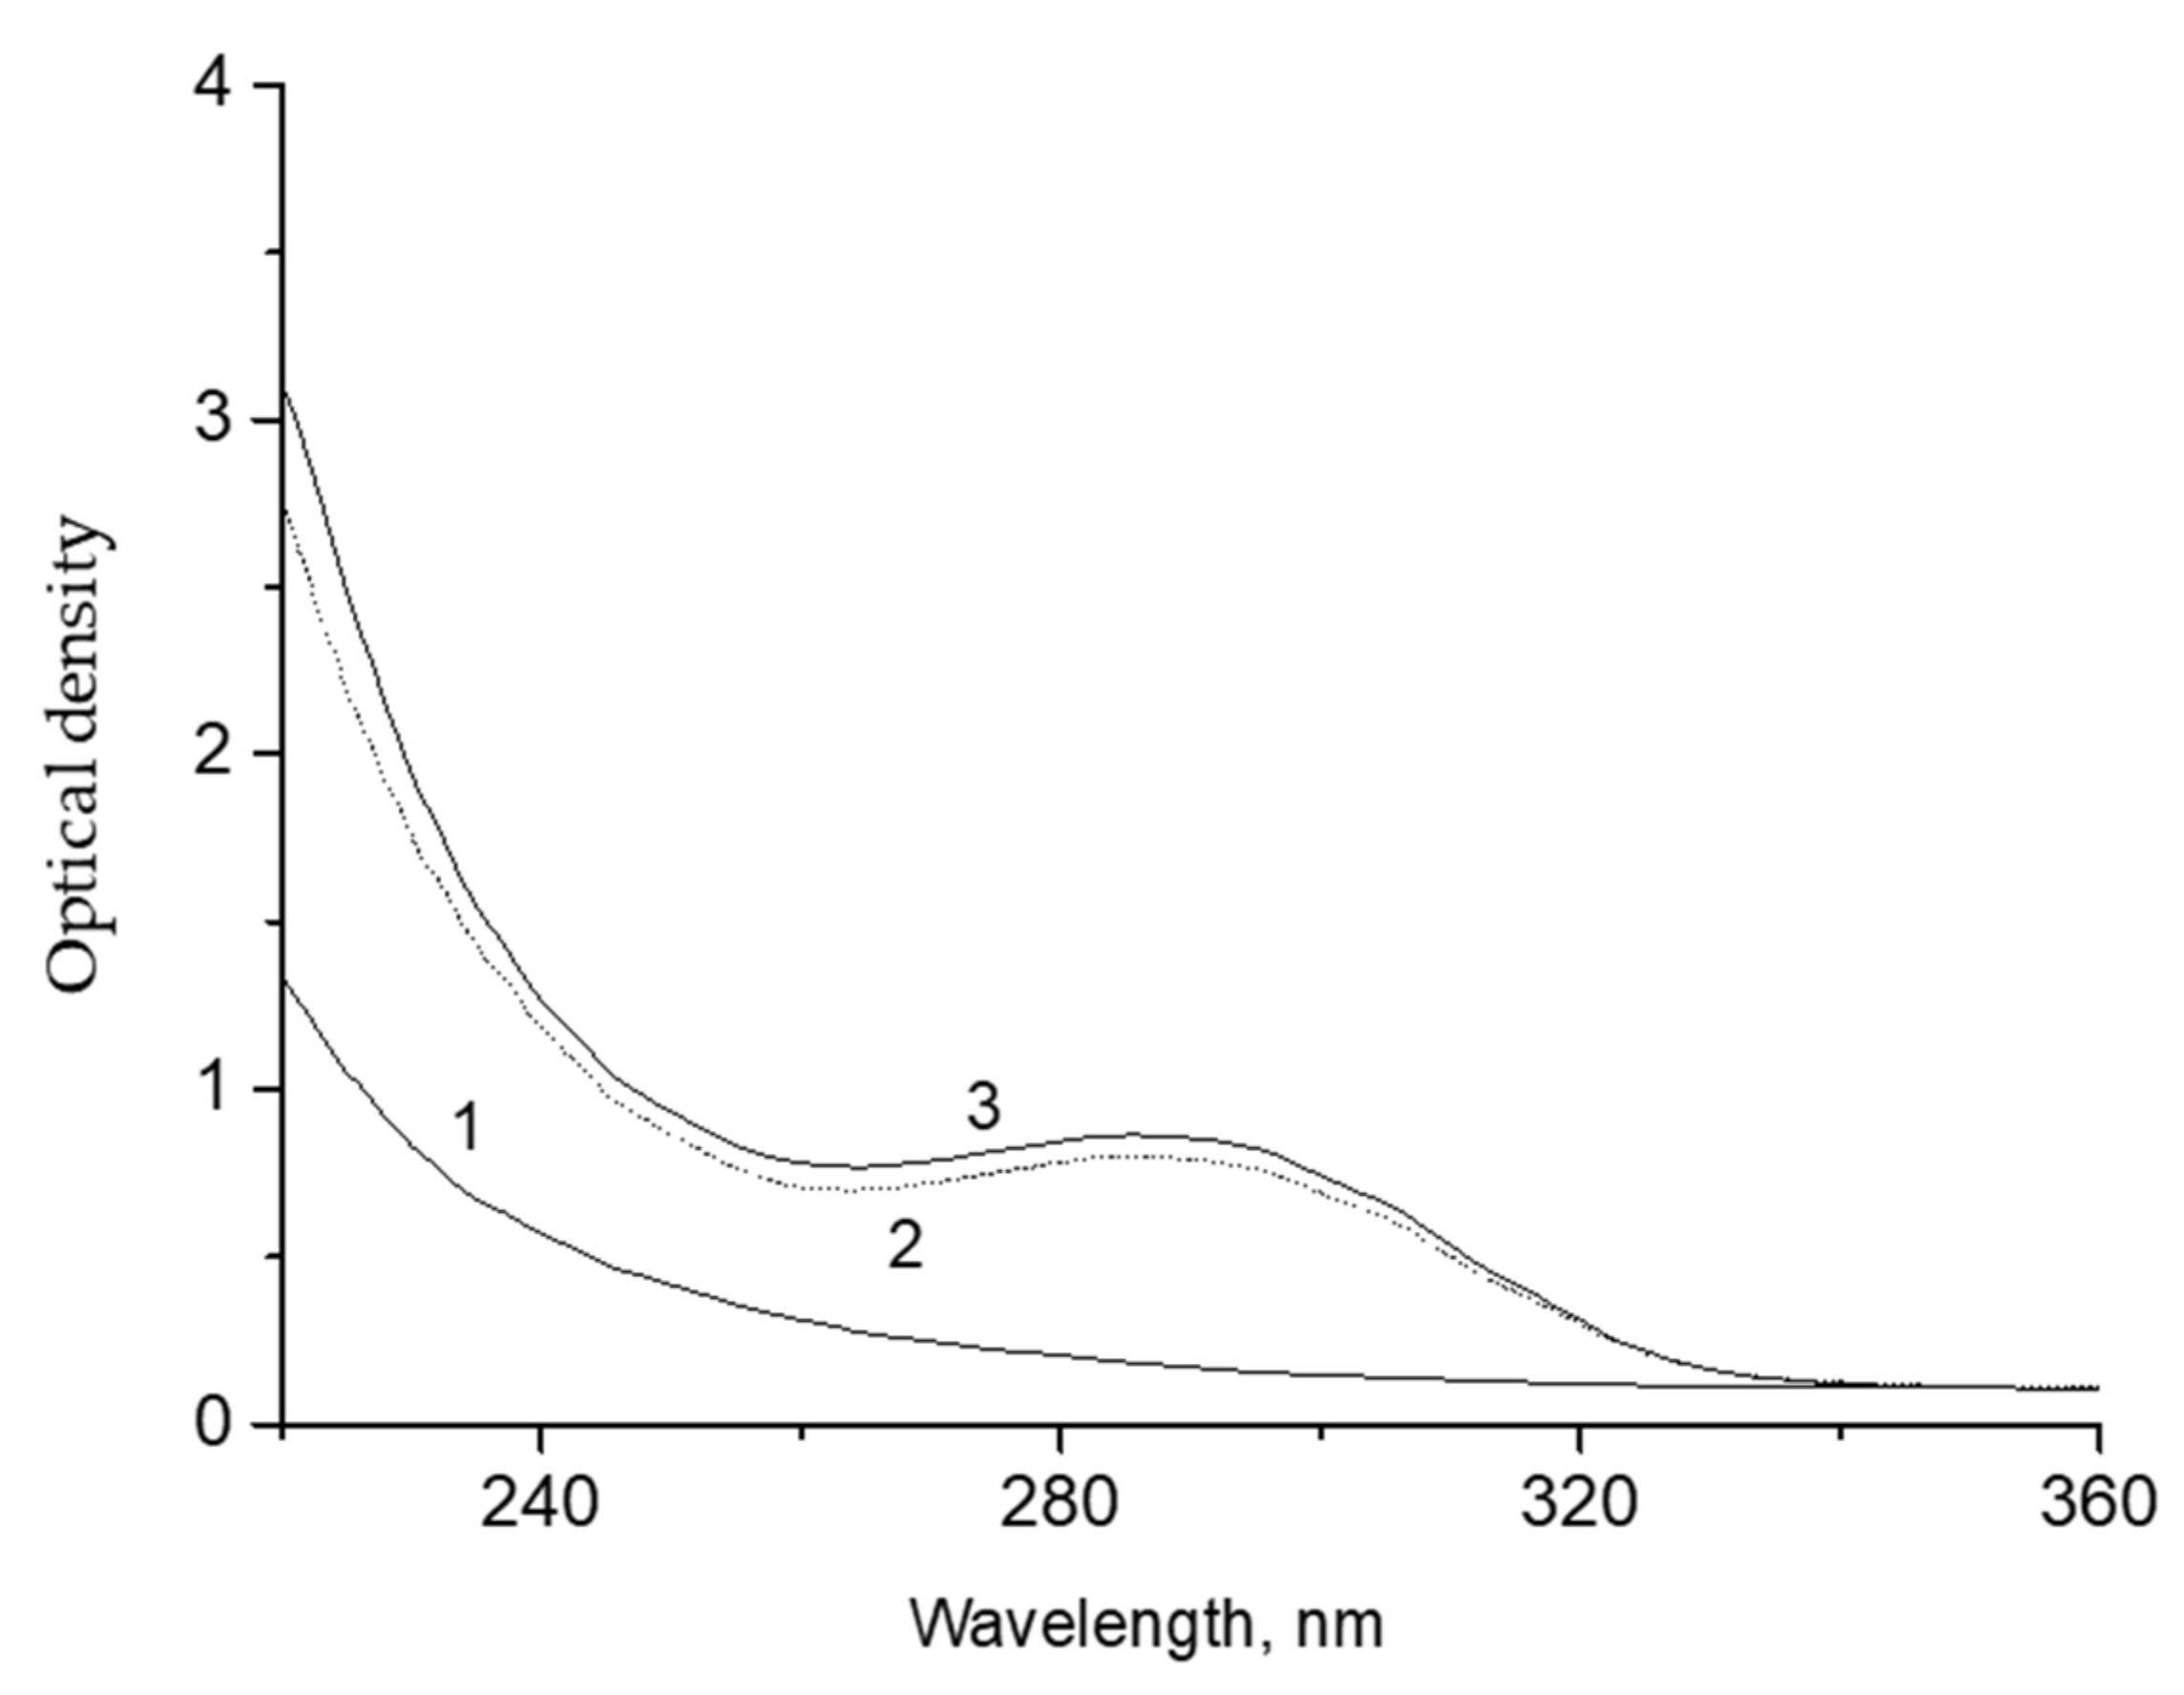
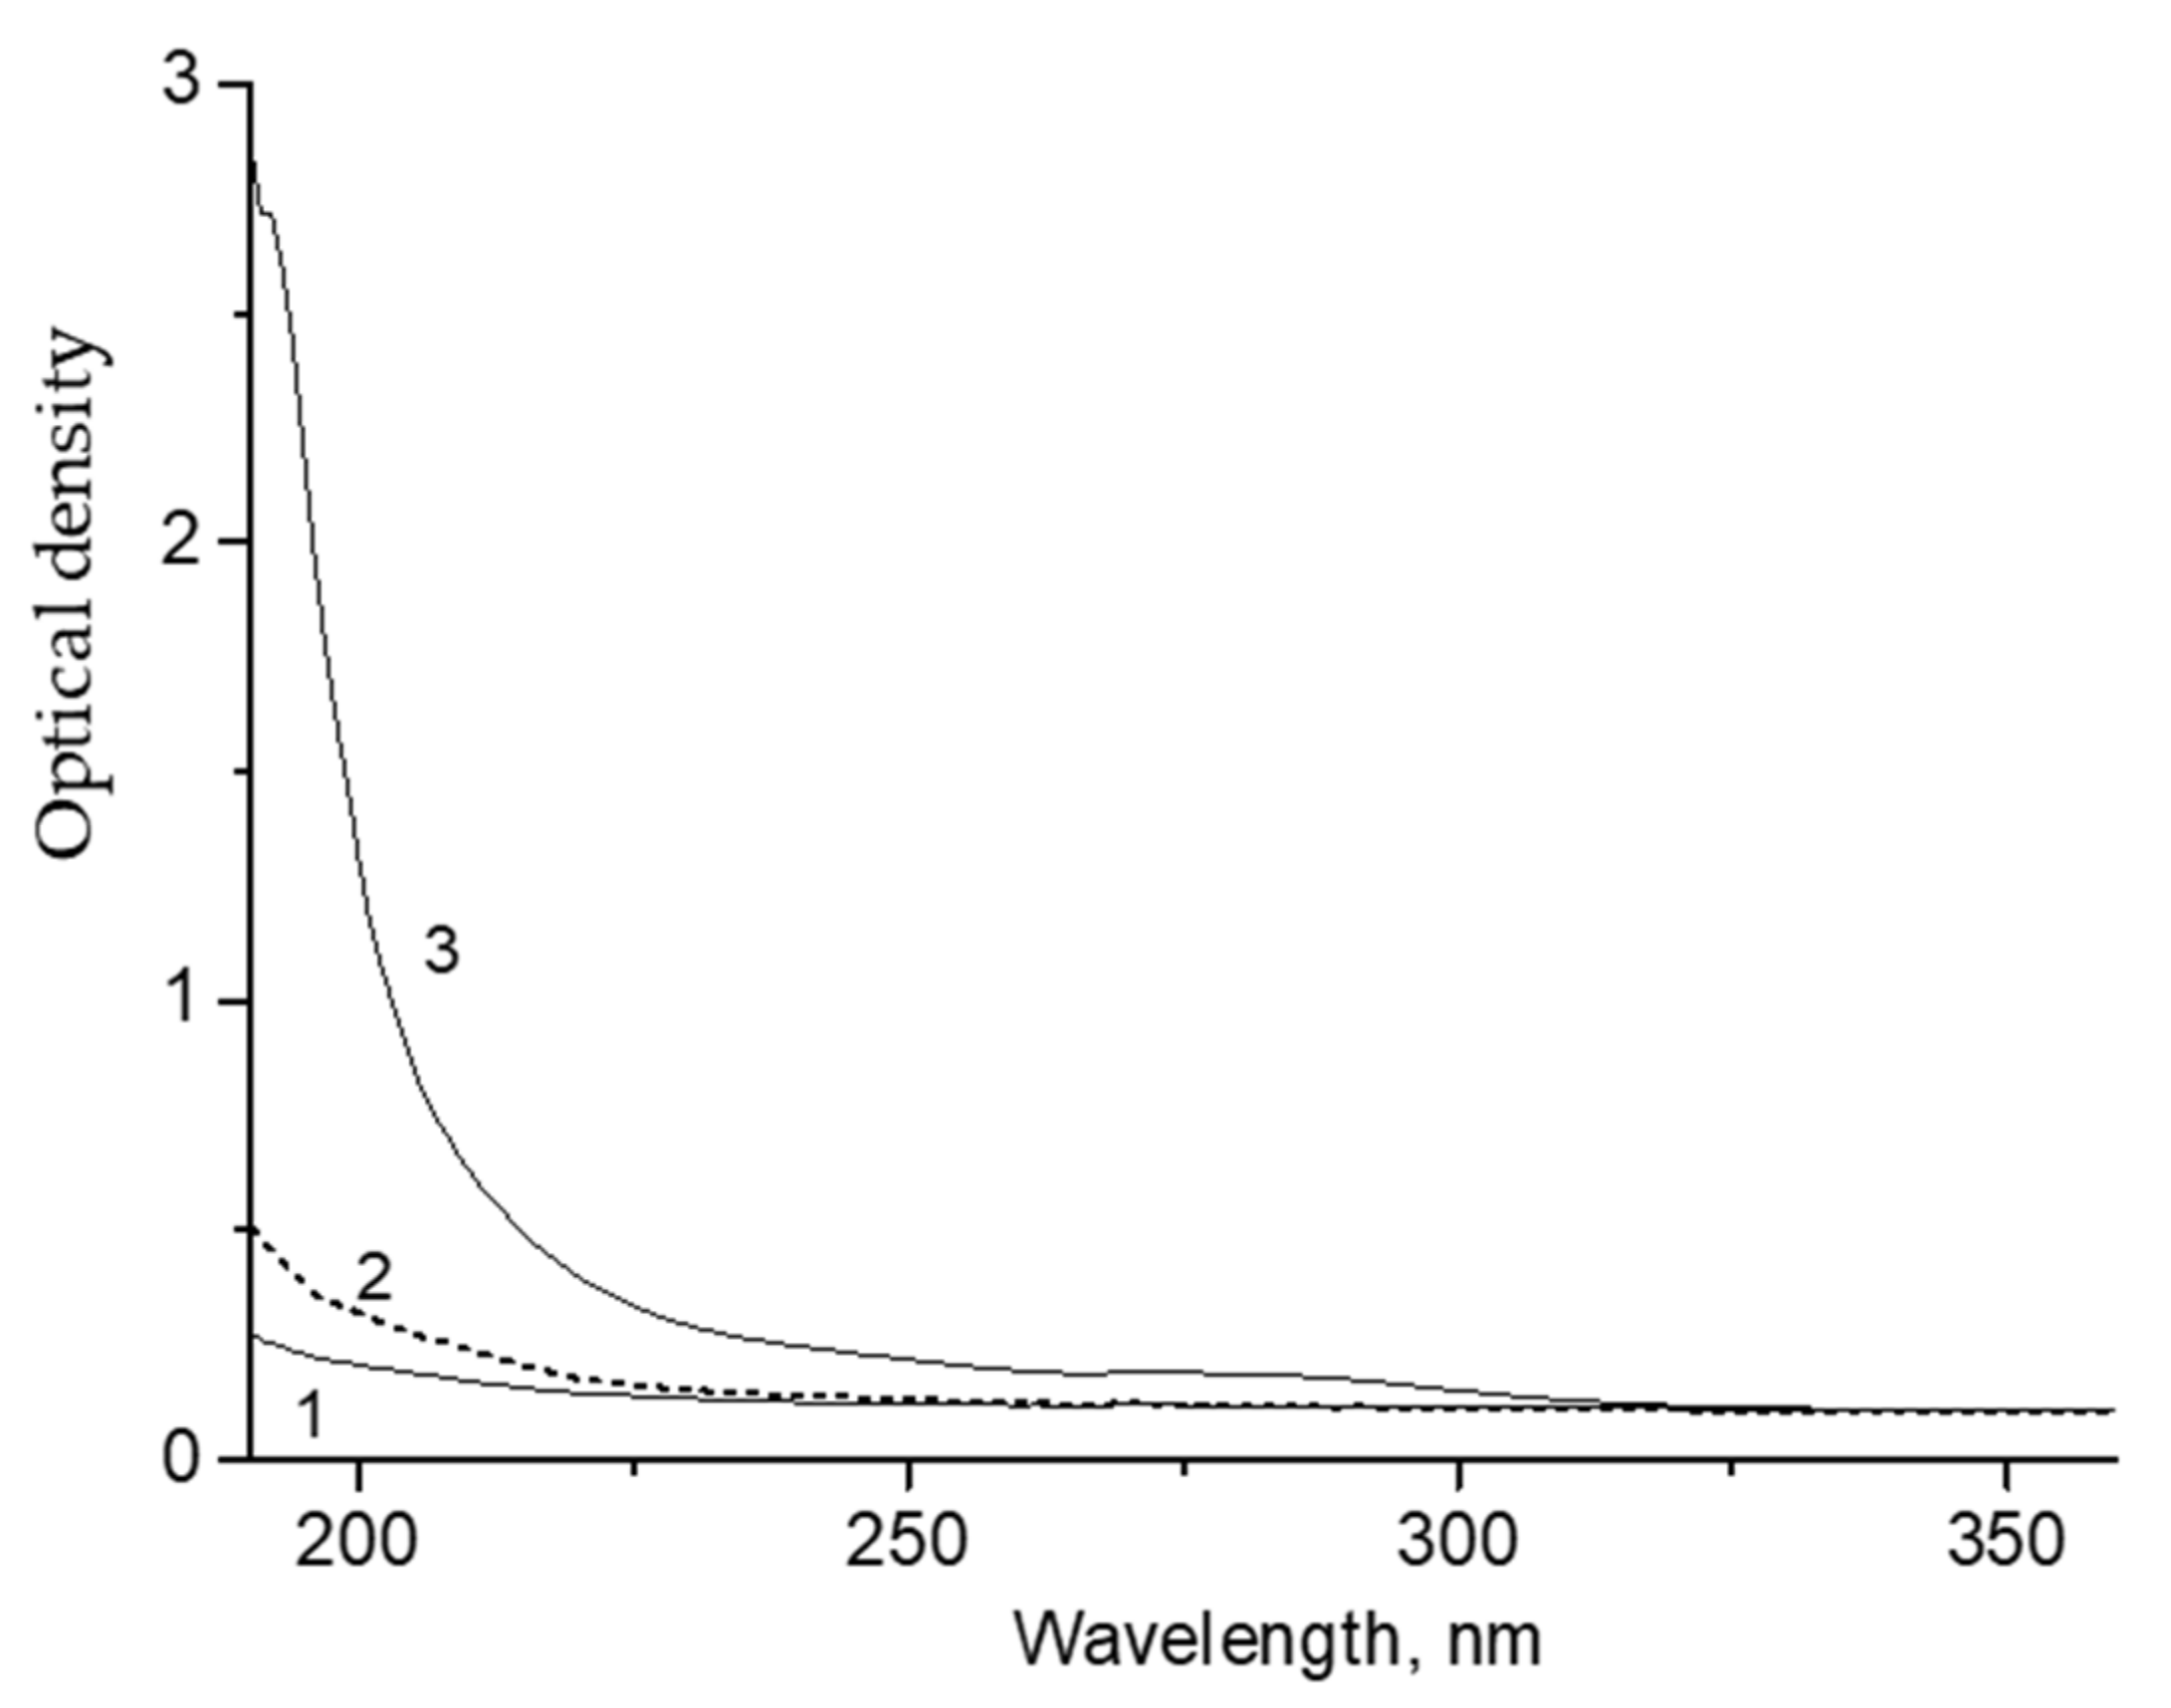
2.1. Optical Spectra
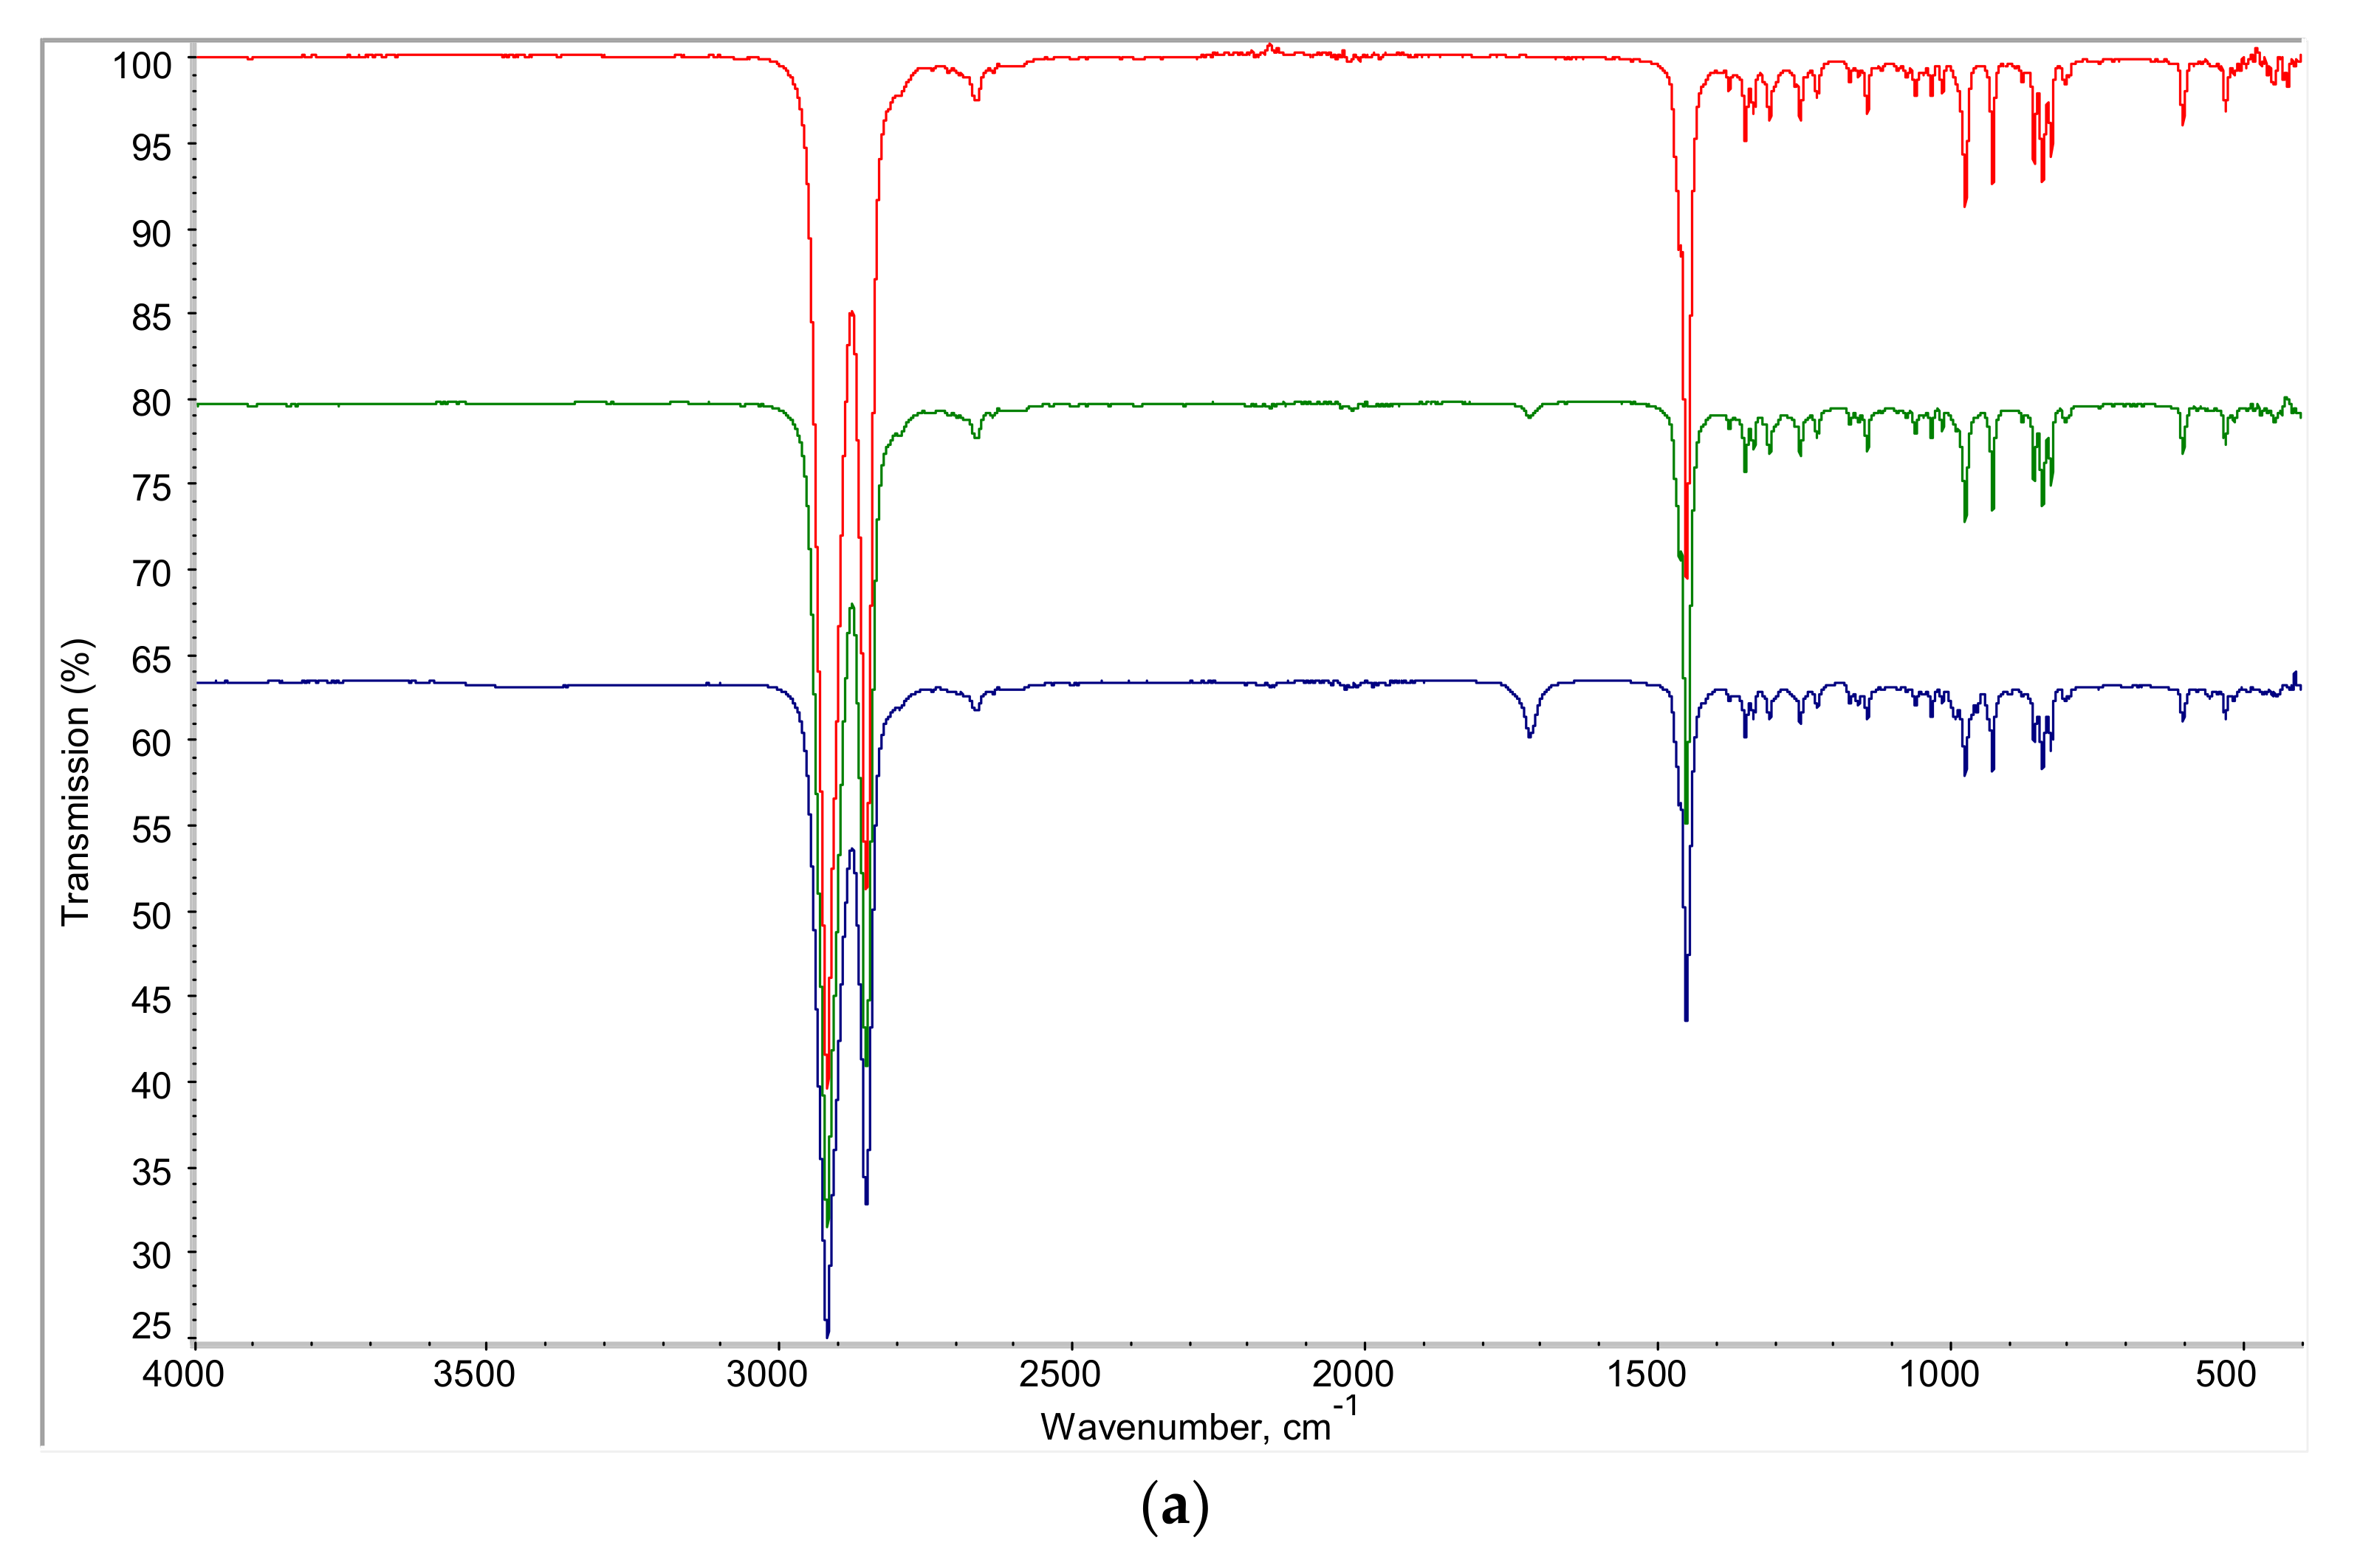
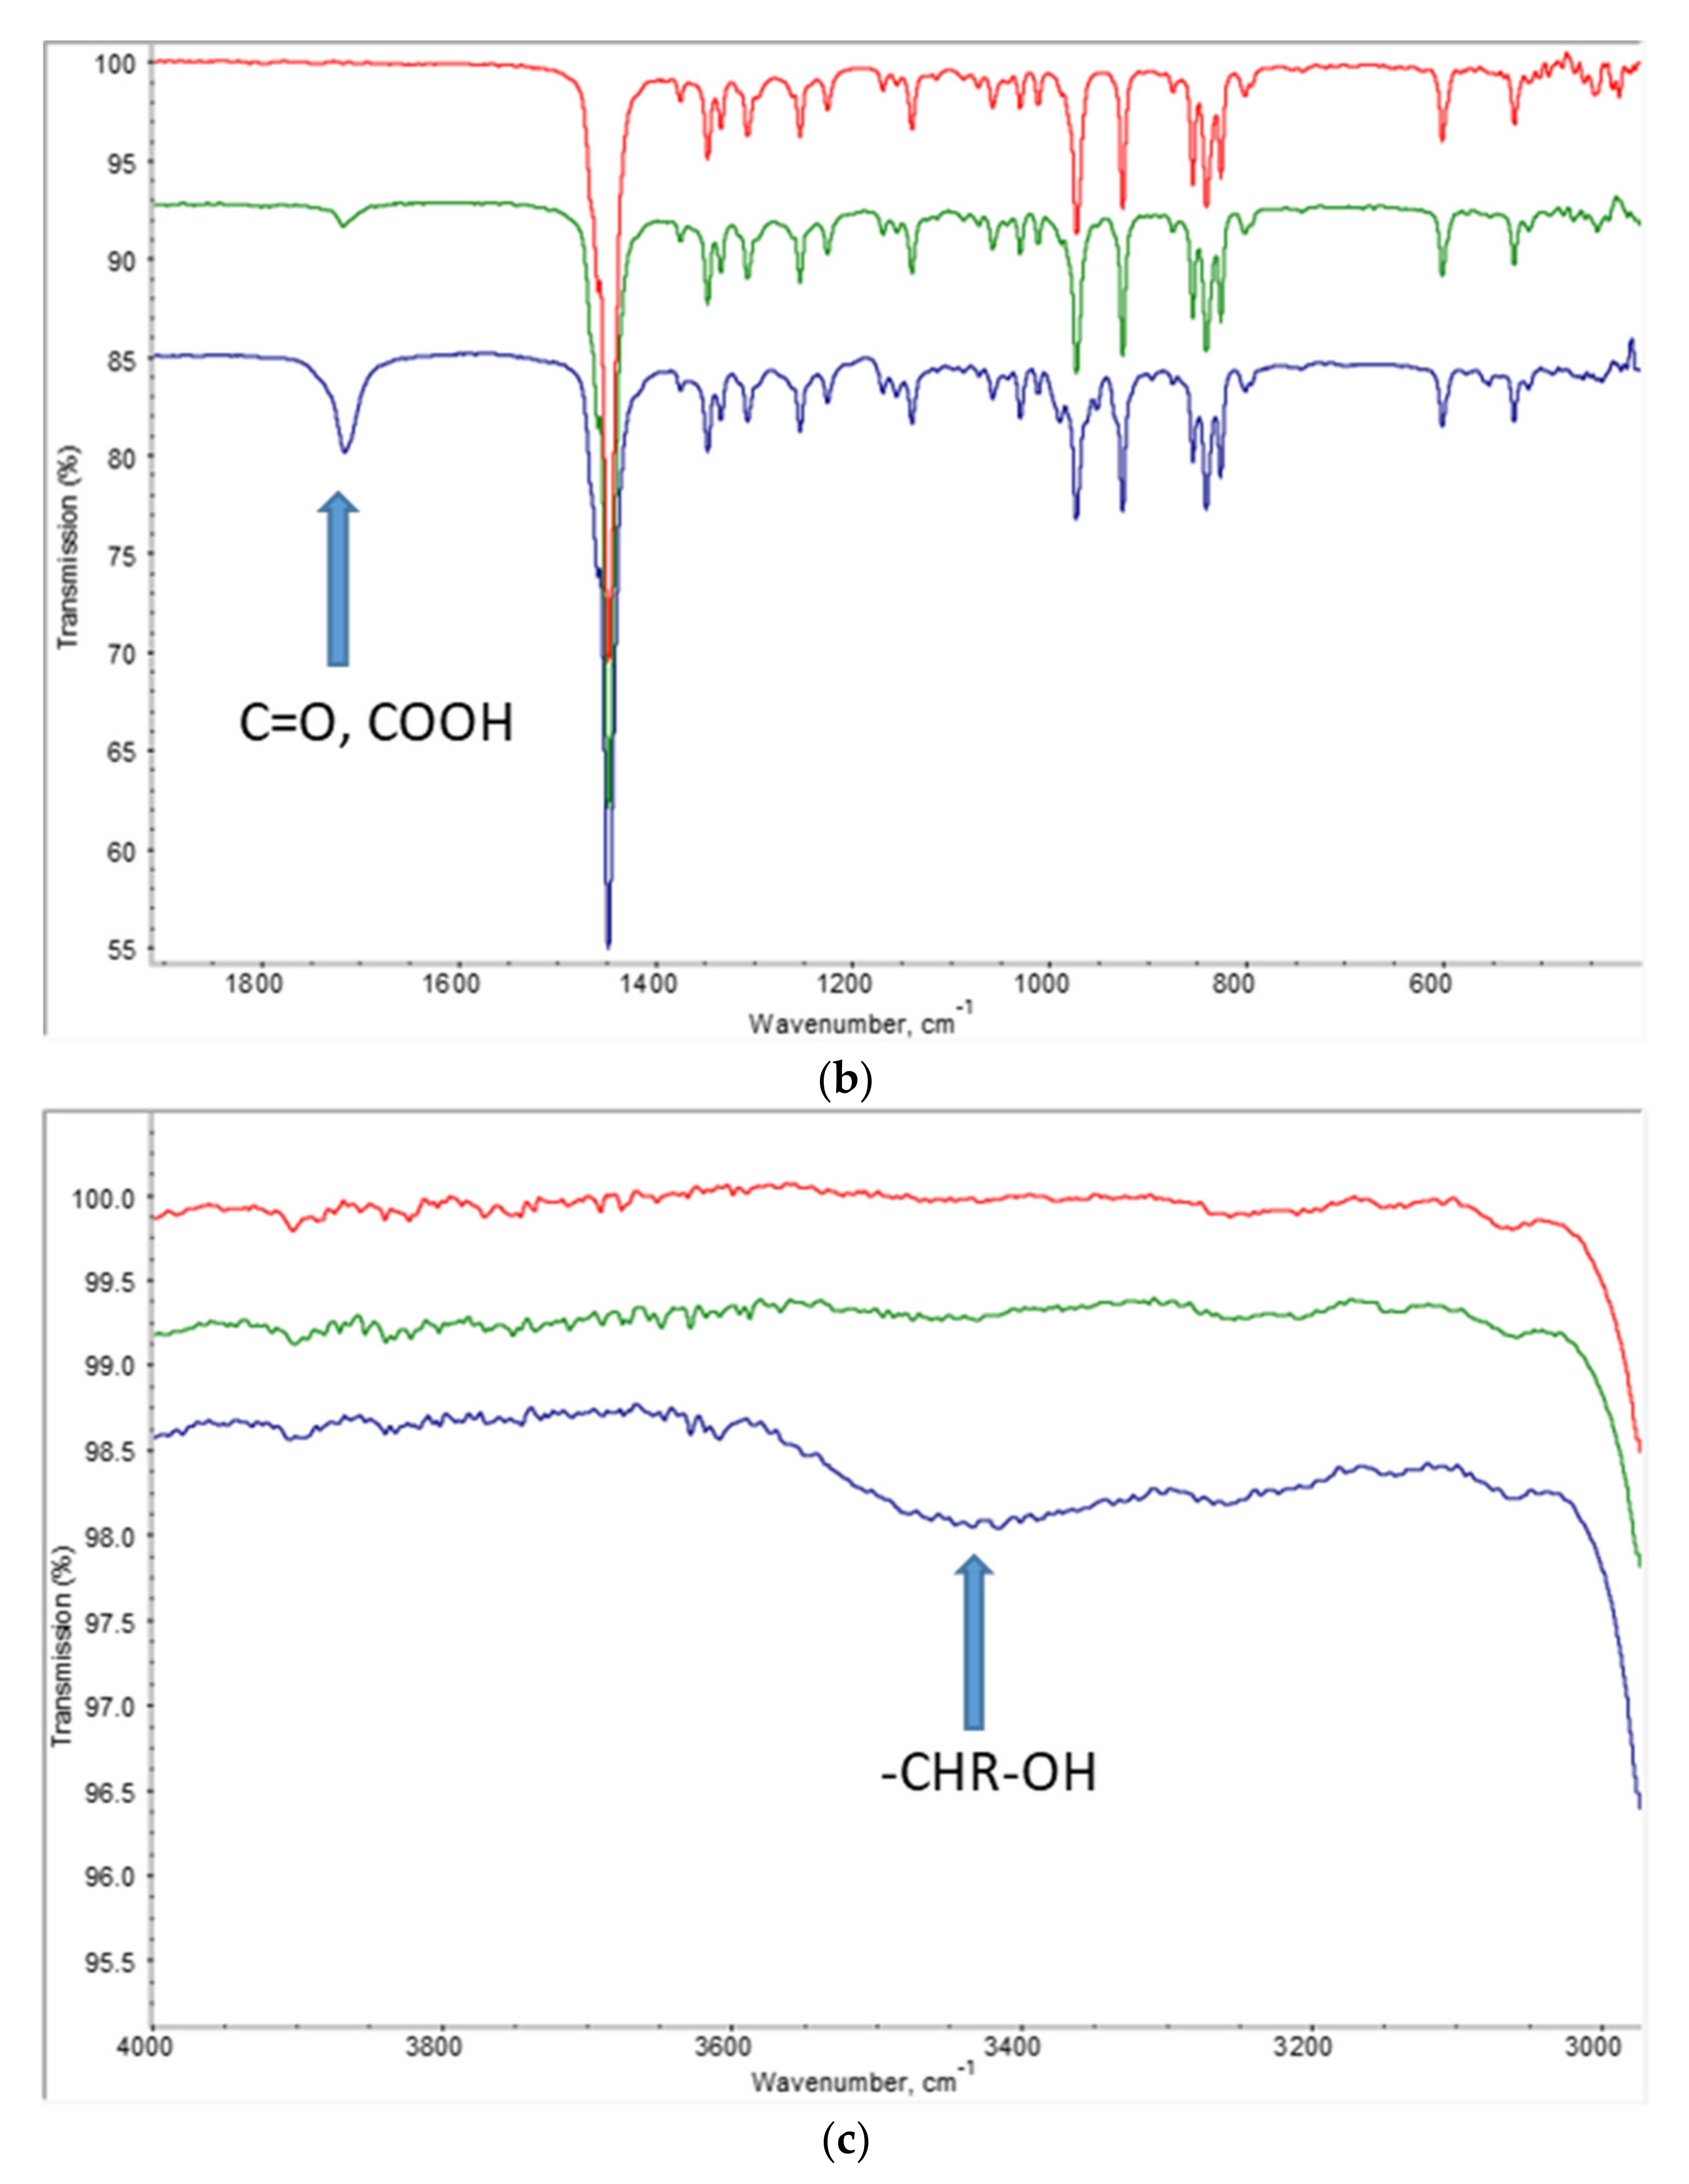
2.2. IR Spectra
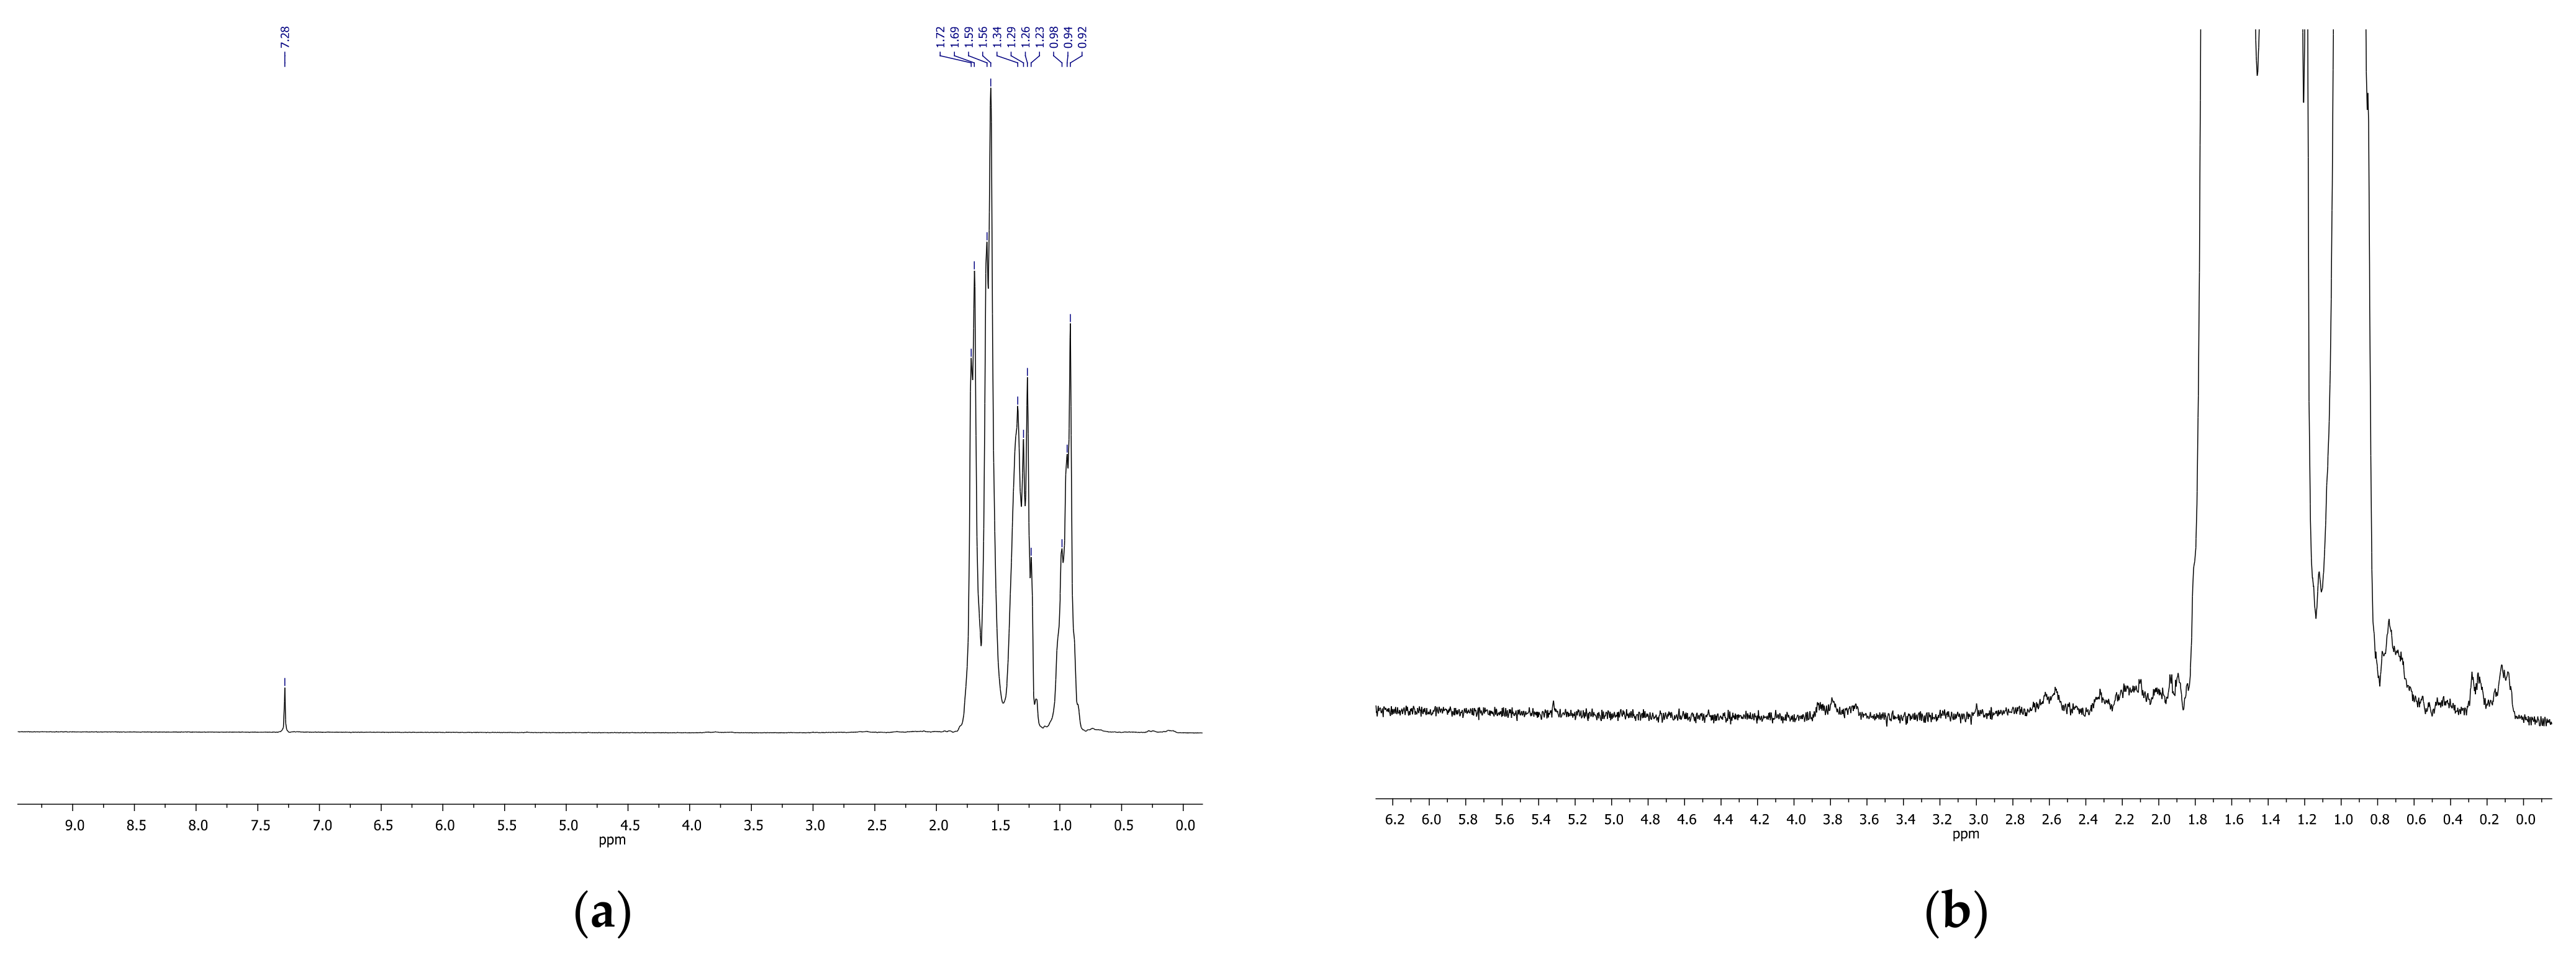
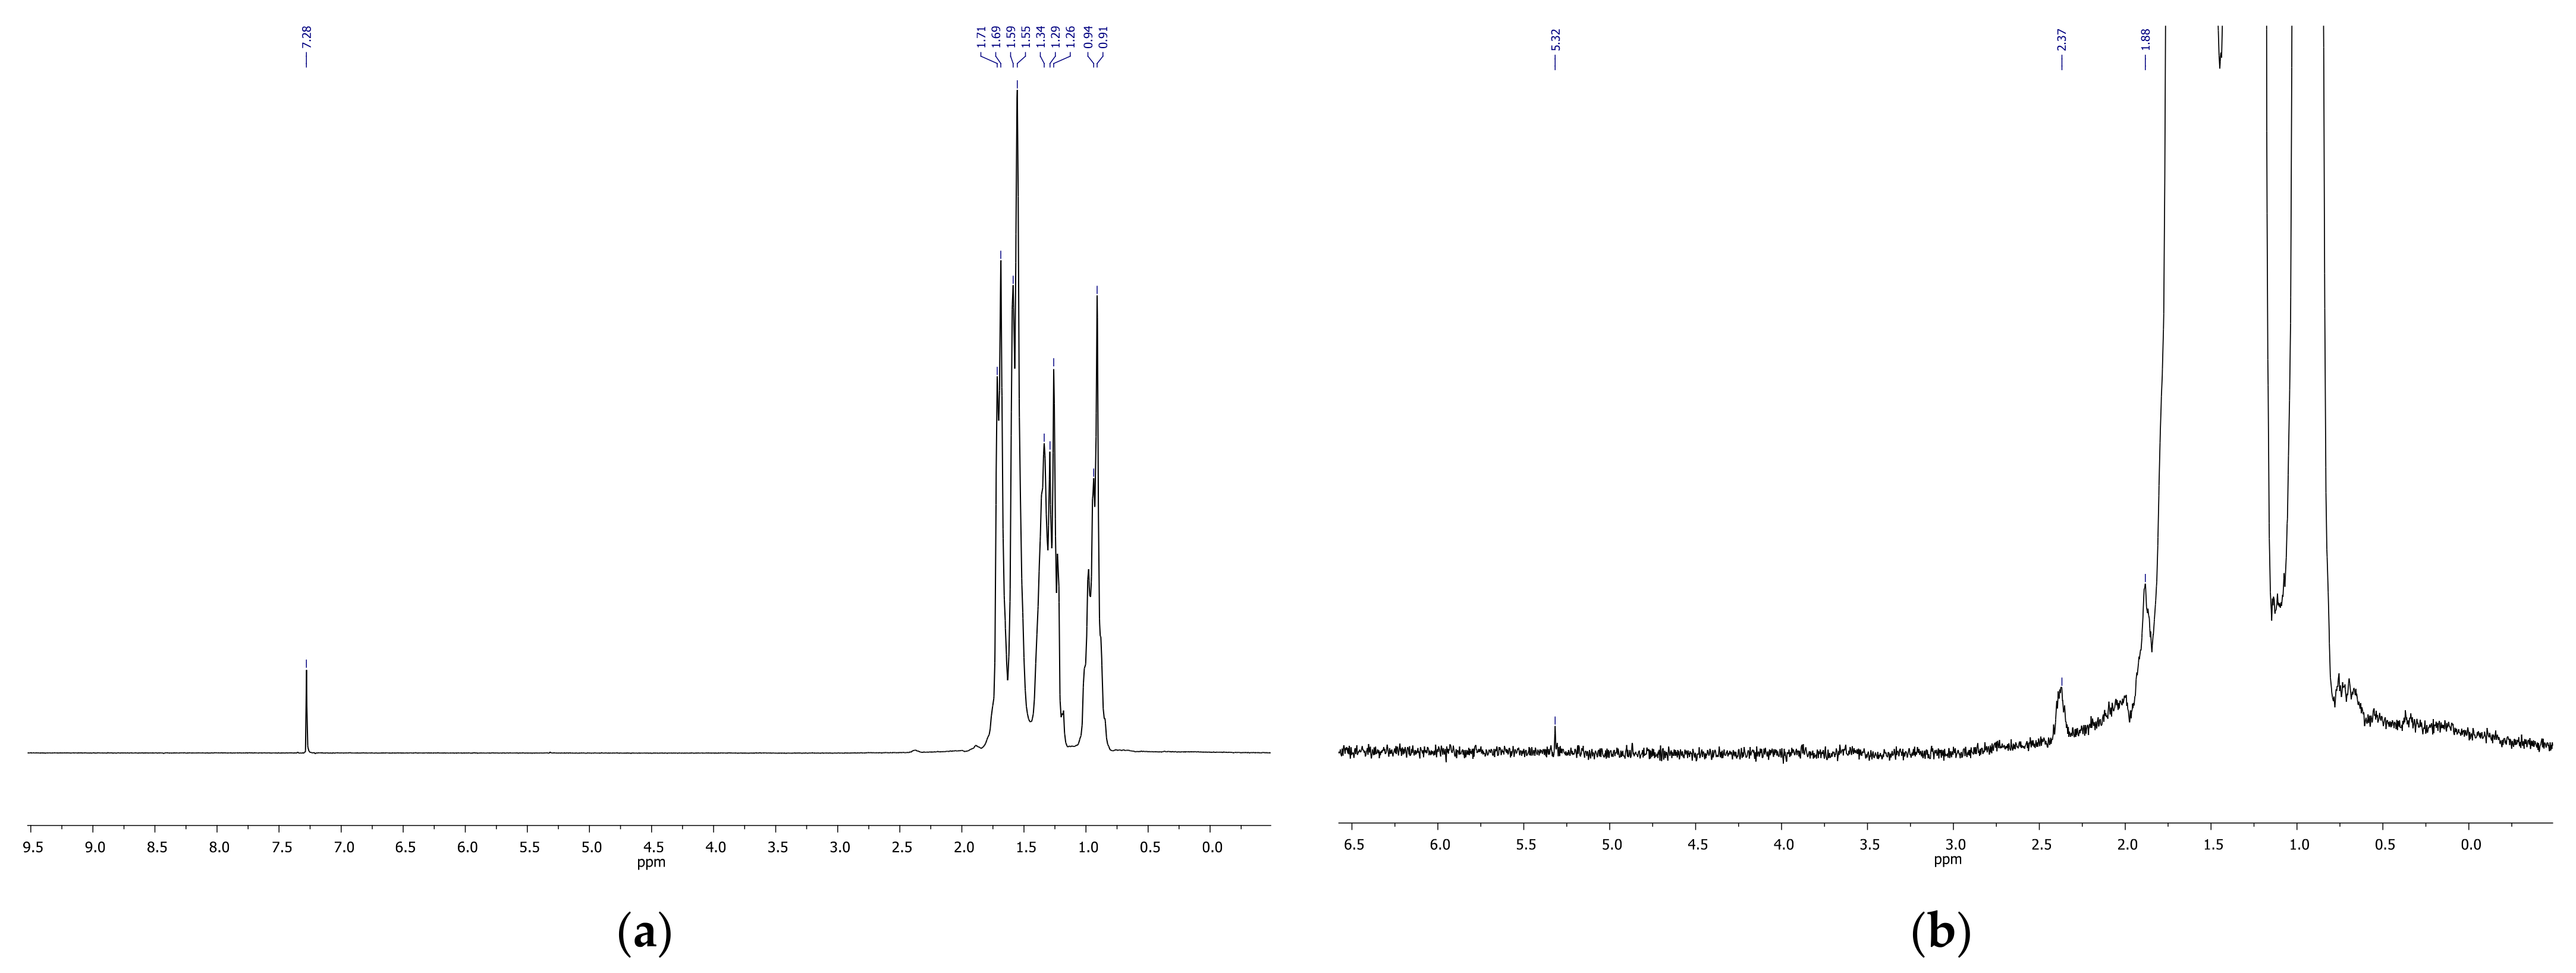
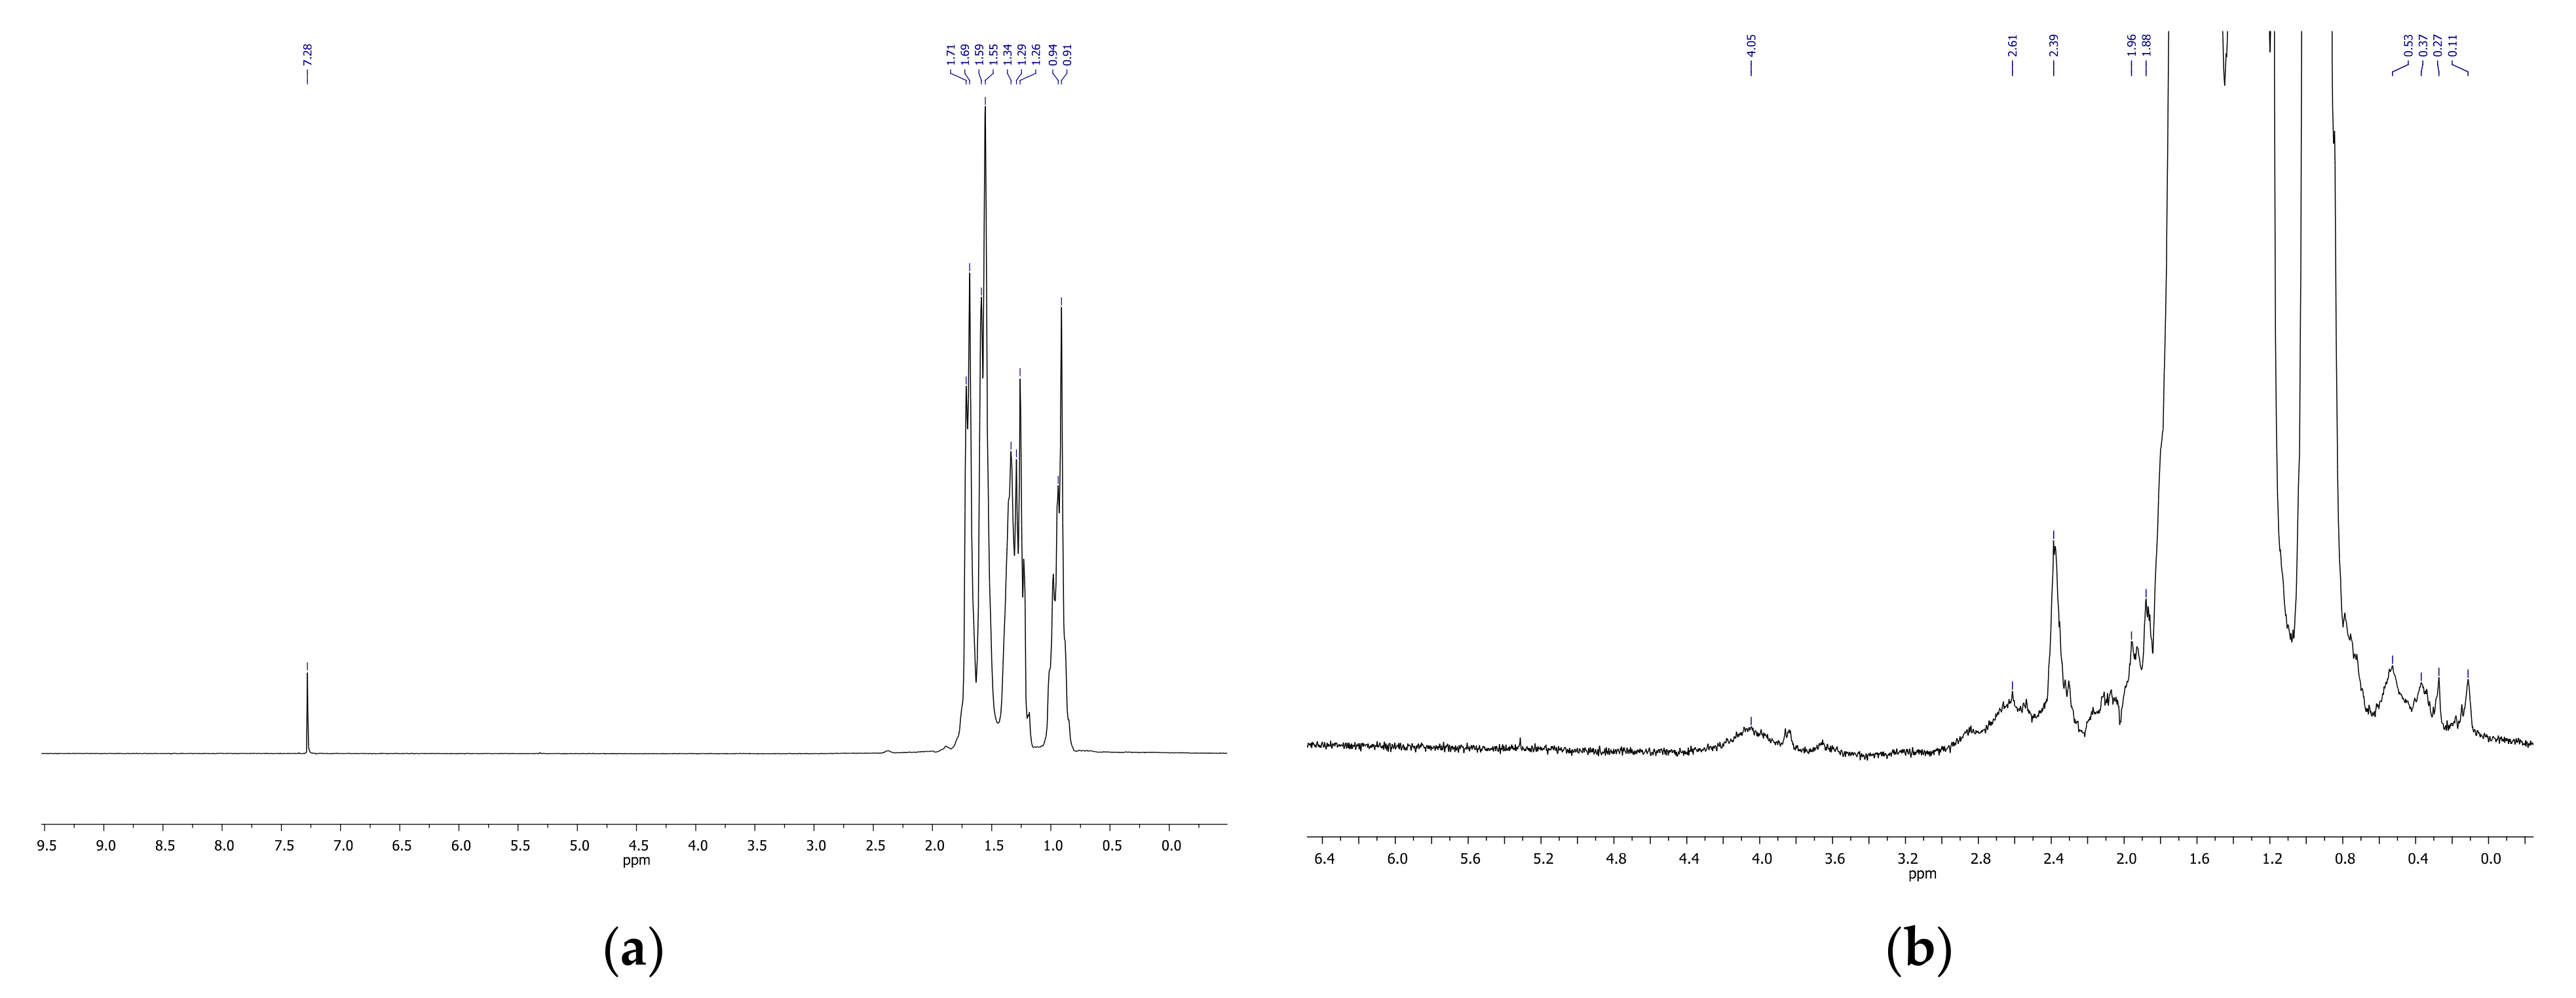
2.3. NMR Spectra
- Cleavage of the mobile hydrogen atom H* in two successive acts:
- 2.
- Formation of a peroxide radical:
3. Materials and Methods
4. Conclusions
Supplementary Materials
Author Contributions
Funding
Institutional Review Board Statement
Informed Consent Statement
Data Availability Statement
Acknowledgments
Conflicts of Interest
Sample Availability
References
- Von Sonntag, C.; Von Gunten, U. Chemistry of Ozone in Water and Wastewater Treatment; Science, IWA Publishing Alliance Haus: London, UK, 2012; Available online: https://www.iwapublishing.com/books/9781843393139/chemistry-ozone-water-and-wastewater-treatment (accessed on 10 September 2021).
- Bailey, P.S. Ozonation in Organic Chemistry; Academic Press: New York, NY, USA, 1978; Volume 2, p. 136. Available online: https://www.elsevier.com/books/ozonation-in-organic-chemistry-v1/bailey/978-0-12-073101-5 (accessed on 10 September 2021).
- Razumovsky, S.D.; Zaikov, G.E. Kinetics and Mechanism of The Reaction of Ozone with Double Bonds. Russ. Chem. Rev. 1980, 49, 1163. Available online: https://ui.adsabs.harvard.edu/abs/1980RuCRv..49.1163R/abstract (accessed on 10 September 2021). [CrossRef]
- Audran, G.; Marque, S.R.A.; Santelli, M. Ozone, chemical reactivity and biological functions. Tetrahedron 2018, 74, 6221–6261. [Google Scholar] [CrossRef]
- Cohen, Z.; Keinan, E.; Mazur, Y.; Varkony, T.H. Dry ozonation. Method for stereoselective hydroxylation of saturated compounds on silica gel. J. Org. Chem. 1975, 40, 2141–2142. [Google Scholar] [CrossRef]
- Tal, D.; Keinan, E.; Mazur, Y. Reactions in dry media. Cleavage of carbon-carbon single bonds by ozonation. J. Am. Chem. Soc. 1979, 101, 502–503. [Google Scholar] [CrossRef]
- Avzyanova, E.V.; Kabal’nova, N.N.; Shereshovets, V.V. Ozonation of adamantane on silica gel. Russ. Chem. Bull. 1996, 45, 360–362. [Google Scholar] [CrossRef]
- Gross, Z.; Nimri, S.; Simkhovich, L. Iron porphyrin catalyzed hydroxylation of ethylbenzene by ozone. J. Mol. Catal. A Chem. 1996, 113, 231–238. [Google Scholar] [CrossRef]
- Gross, Z.; Simkhovich, L. Ozone as primary oxidant in iron(III) porphyrin catalyzed hydroxylation of hydrocarbons. J. Mol. Catal. A Chem. 1997, 117, 243–248. [Google Scholar] [CrossRef]
- Neumann, R.; Khenkin, A.M. Alkane oxidation with manganese substituted polyoxometalates in aqueous media with ozone and the intermediacy of manganese ozoneide species. Chem. Commun. 1998, 1967–1968. [Google Scholar] [CrossRef]
- Brambilla, A.; Bolzacchini, E.; Orlandi, M.; Polesello, S.; Rindone, B. Reactivity of two models of non-ionic surfactants with ozone. Water Res. 1997, 31, 1839–1846. [Google Scholar] [CrossRef]
- Brambilla, A.; Rindone, B.; Polesello, S.; Galassi, S.; Balestrini, R. The fate of triazine pesticides in River Po water. Sci. Total Environ. 1993, 132, 339–348. [Google Scholar] [CrossRef]
- Brambilla, A.; Bolzacchini, E.; Orlandi, M.; Polesello, S.; Rindone, B. Reactivity of Organic Micropollutants With Ozone a Kinetic Study. Life Chem. Rep. 1995, 13, 79–84. [Google Scholar]
- Bolzacchini, E.; Brambilla, A.; Orlandi, M.; Polesello, S.; Rindone, B. Oxidative pathways in the degradation of triazine herbicides: A mechanistic approach. Water Sci. Technol. 1994, 30, 129–136. [Google Scholar] [CrossRef]
- Barletta, B.; Bolzacchini, E.; Fossati, L.; Meinardi, S.; Orlandi, M.; Rindone, B. Metal-free functionalization of the unactivated carbon-hydrogen bond: The oxidation of cycloalkanes to cycloalkanones with ozone. Ozone Sci. Eng. 1998, 20, 91–98. [Google Scholar] [CrossRef]
- Attiná, R.; Bolzacchini, E.; Orlandi, M.; Rindone, B. Green Chemistry with Ozone. Chem. Innov. 2000, 30, 21–25. Available online: https://pubsapp.acs.org/subscribe/journals/ci/30/i09/html/rindone.html (accessed on 10 September 2021).
- Hellman, T.M.; Hamilton, G.A. Mechanism of alkane oxidation by ozone in the presence and absence of iron(III) chloride. J. Am. Chem. Soc. 1974, 96, 1530–1535. [Google Scholar] [CrossRef]
- Ershov, B.G.; Panich, N.M. Spectrophotometric determination of ozone in solutions: Molar absorption coefficient in the visible region. Spectrochim. Acta Part. A Mol. Biomol. Spectrosc. 2019, 217, 39–43. [Google Scholar] [CrossRef] [PubMed]
- Akademiai, K. Absorption Spectra in the Visible Region; Physics Today: Budapest, Hungary, 1962; Available online: https://physicstoday.scitation.org/doi/10.1063/1.3058229 (accessed on 10 September 2021).
- Bell, J.M.; Kubler, D.G.; Sartwell, P.; Zepp, R.G. Acetal Formation for Ketones and Aromatic Aldehydes with Methanol. J. Org. Chem. 1965, 30, 4284–4292. [Google Scholar] [CrossRef]
- Mani, P.; Suresh, S. Vibrational Spectra and Analysis of cis-decahydronaphthalene. Asian J. Chem. 2011, 23, 4299–4302. [Google Scholar]
- Mani, P.; Suresh, S. Vibrational Spectra and Analysis of trans-decahydronaphthalene. Archives Phys. Res. 2010, 1, 211–216. [Google Scholar]
- National Institute of Advanced Industrial Science and Technology of Japan (AIST), Spectral Database for Organic Compounds (SDBS). Available online: https://sdbs.db.aist.go.jp/sdbs/cgi-bin/cre_index.cgi (accessed on 10 September 2021).
- Whiting, M.C.; Bolt, A.J.N.; Parish, J.H. The reaction between ozone and saturated compounds. In Oxidation of Organic Compounds; Advances in Chemistry: Washington DC, WA, USA, 1968; Volume 77, pp. 4–14, Chapter 59; Available online: https://pubs.acs.org/doi/abs/10.1021/ba-1968-0077.ch059 (accessed on 10 September 2021).


| Entry | Vibration Frequencies, cm−1 | ||
|---|---|---|---|
| Initial Decalin (Equilibrium Mixture of Cis- and Trans-Isomers) * | Decalin After Ozonation for 15 min | Decalin After Ozonation for 70 min | |
| 1 | - | 3450, 3250 (O-H stretching) | Broad band 3600-2900 (O-H stretching) |
| 2 | 2915 (C-H stretching) | 2915 | 2915 |
| 3 | 2848 (C-H stretching) | 2848 | 2849 |
| 4 | 2660 (C-H stretching) | 2660 | 2660 |
| 5 | - | 1717 (C=O stretching) | 1716 (C=O stretching) |
| 6 | 1458 (C-H in plane bending) | 1458 | 1458 |
| 7 | 1447 (C-H in plane bending) | 1447 | 1447 |
| 8 | 1374 (C-H in plane bending) | 1374 | 1374 |
| 9 | 1346 (C-H in plane bending) | 1346 | 1346 |
| 10 | 1332 (C-H in plane bending) | 1333 | 1333 |
| 11 | 1305 (C-H in plane bending) | 1306 | 1306 |
| 12 | 1252 (C-H in plane bending) | 1252 | 1252 |
| 13 | 1224 (C-H in plane bending) | 1224 | 1224 |
| 14 | 1168 (C-H in plane bending, C-C stretching) | 1168 | 1168 |
| 15 | 1154 (C-H in plane bending, C-C stretching) | 1154 | 1154 |
| 16 | 1138 (C-H in plane bending, C-C stretching) | 1138 | 1138 |
| 17 | 1071 (C-C stretching) | 1071 | 1071 |
| 18 | 1056 (C-C stretching) | 1056 | 1056 |
| 19 | 1028 (CCC trigonal bending) | 1028 | 1028 |
| 20 | 1010 (CCC trigonal bending) | 1010 | 1010 |
| 21 | - | - | 988, 950 (C-O stretching) |
| 22 | 971 (C-H out of plane bending) | 971 | 971 |
| 23 | 924 (C-H out of plane bending) | 924 | 924 |
| 24 | 873 (C-H out of plane bending) | 873 | 873 |
| 25 | 853 (CCC ring breathing, C-H out of plane bending) | 853 | 853 |
| 26 | 839 (C-H out of plane bending) | 839 | 839 |
| 27 | 824 (C-H out of plane bending) | 824 | 825 |
| 28 | 800 (C-H out of plane bending) | 800 | 800 |
| 29 | 599 (CCC in plane bending) | 599 | 599 |
| 30 | 526 (CCC in plane bending) | 526 | 552, 526 |
| 31 | 511 (CCC in plane bending) | 511 | 512 |
| 32 | 491 | - | - |
| 30 | 477 | 476 | |
| 33 | 465 | 466 | |
| 34 | 455 (CCC in plane bending) | ||
| 35 | 445 (CCC in plane bending) | 442 | 437 |
| 36 | 427 | - | - |
| 37 | 419 (CCC in plane bending) | - | 418 |
Publisher’s Note: MDPI stays neutral with regard to jurisdictional claims in published maps and institutional affiliations. |
© 2021 by the authors. Licensee MDPI, Basel, Switzerland. This article is an open access article distributed under the terms and conditions of the Creative Commons Attribution (CC BY) license (https://creativecommons.org/licenses/by/4.0/).
Share and Cite
Ershov, B.G.; Panich, N.M.; Bykov, G.L.; Kustov, A.L.; Krasovskiy, V.G.; Kustov, L.M. Ozonation of Decalin as a Model Saturated Cyclic Molecule: A Spectroscopic Study. Molecules 2021, 26, 5565. https://doi.org/10.3390/molecules26185565
Ershov BG, Panich NM, Bykov GL, Kustov AL, Krasovskiy VG, Kustov LM. Ozonation of Decalin as a Model Saturated Cyclic Molecule: A Spectroscopic Study. Molecules. 2021; 26(18):5565. https://doi.org/10.3390/molecules26185565
Chicago/Turabian StyleErshov, Boris G., Nadezhda M. Panich, Gennadii L. Bykov, Alexander L. Kustov, Vladimir G. Krasovskiy, and Leonid M. Kustov. 2021. "Ozonation of Decalin as a Model Saturated Cyclic Molecule: A Spectroscopic Study" Molecules 26, no. 18: 5565. https://doi.org/10.3390/molecules26185565
APA StyleErshov, B. G., Panich, N. M., Bykov, G. L., Kustov, A. L., Krasovskiy, V. G., & Kustov, L. M. (2021). Ozonation of Decalin as a Model Saturated Cyclic Molecule: A Spectroscopic Study. Molecules, 26(18), 5565. https://doi.org/10.3390/molecules26185565