
Effects of Long-Term Storage on Radical Scavenging Properties and Phenolic Content of Kombucha from Black Tea


 ,
,  ,
,  and
and 
Abstract
:1. Introduction
2. Results
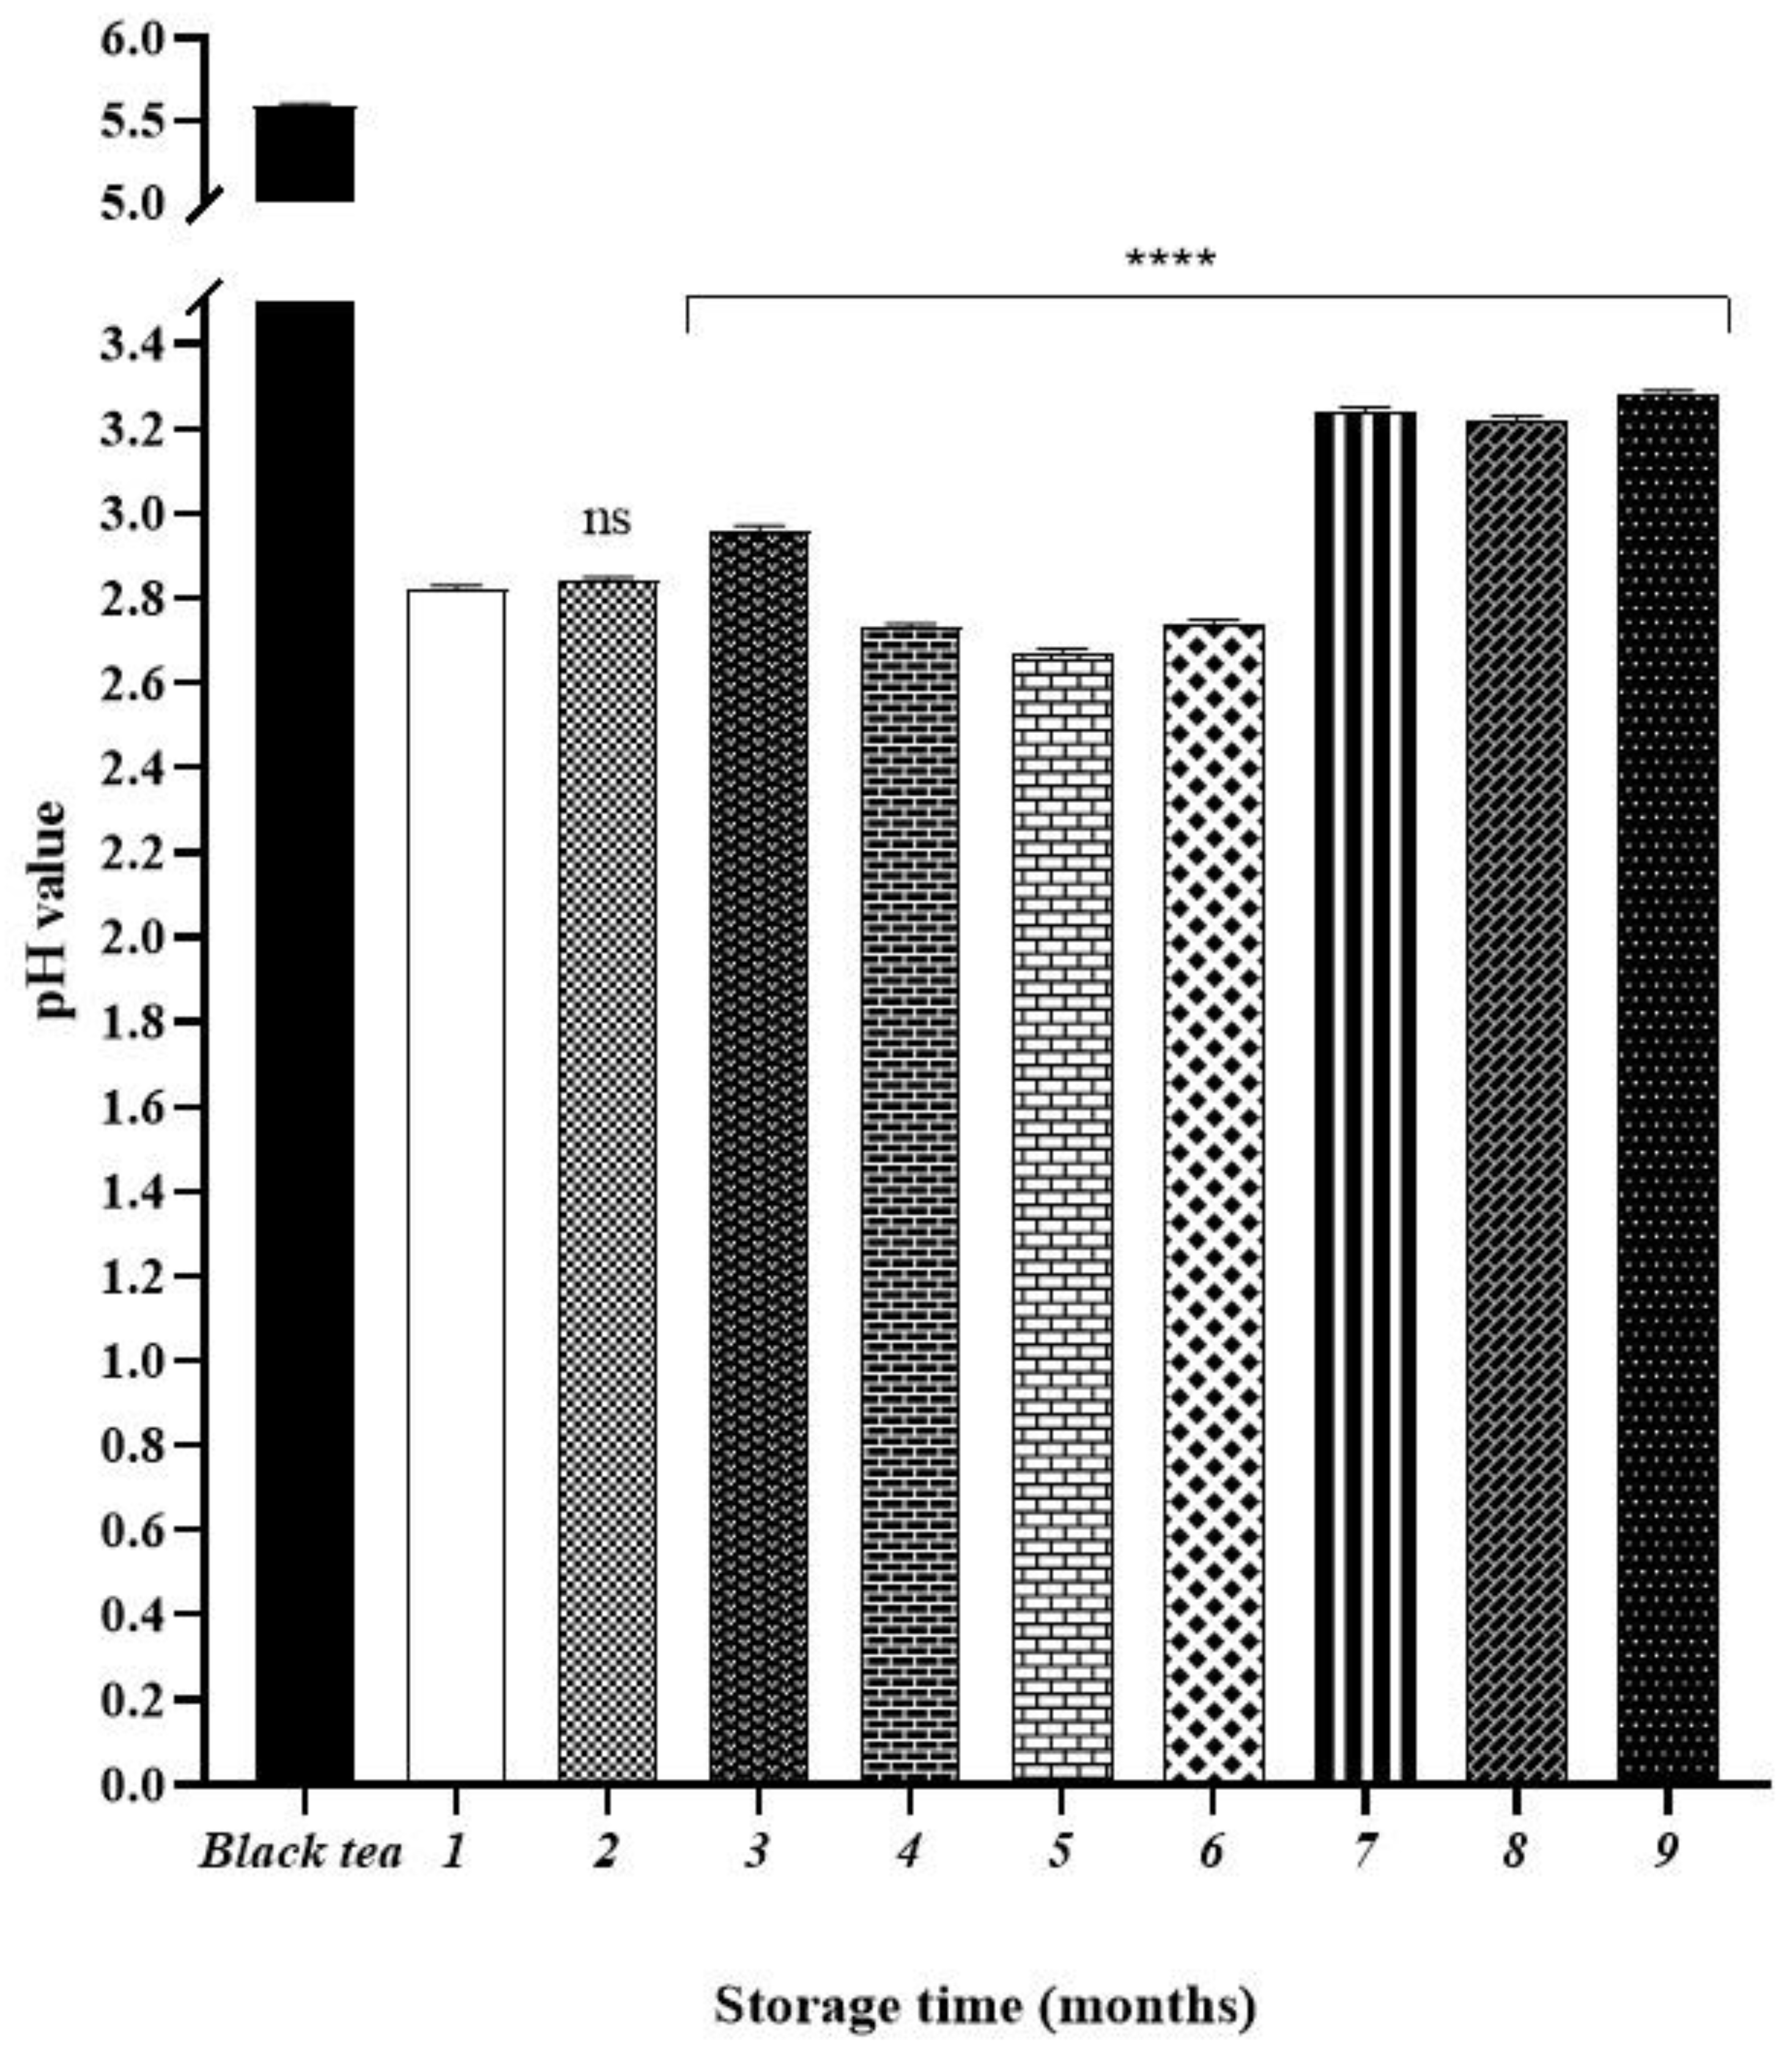
2.1. Monitoring of the pH Values of Kombucha during the Stogare Period
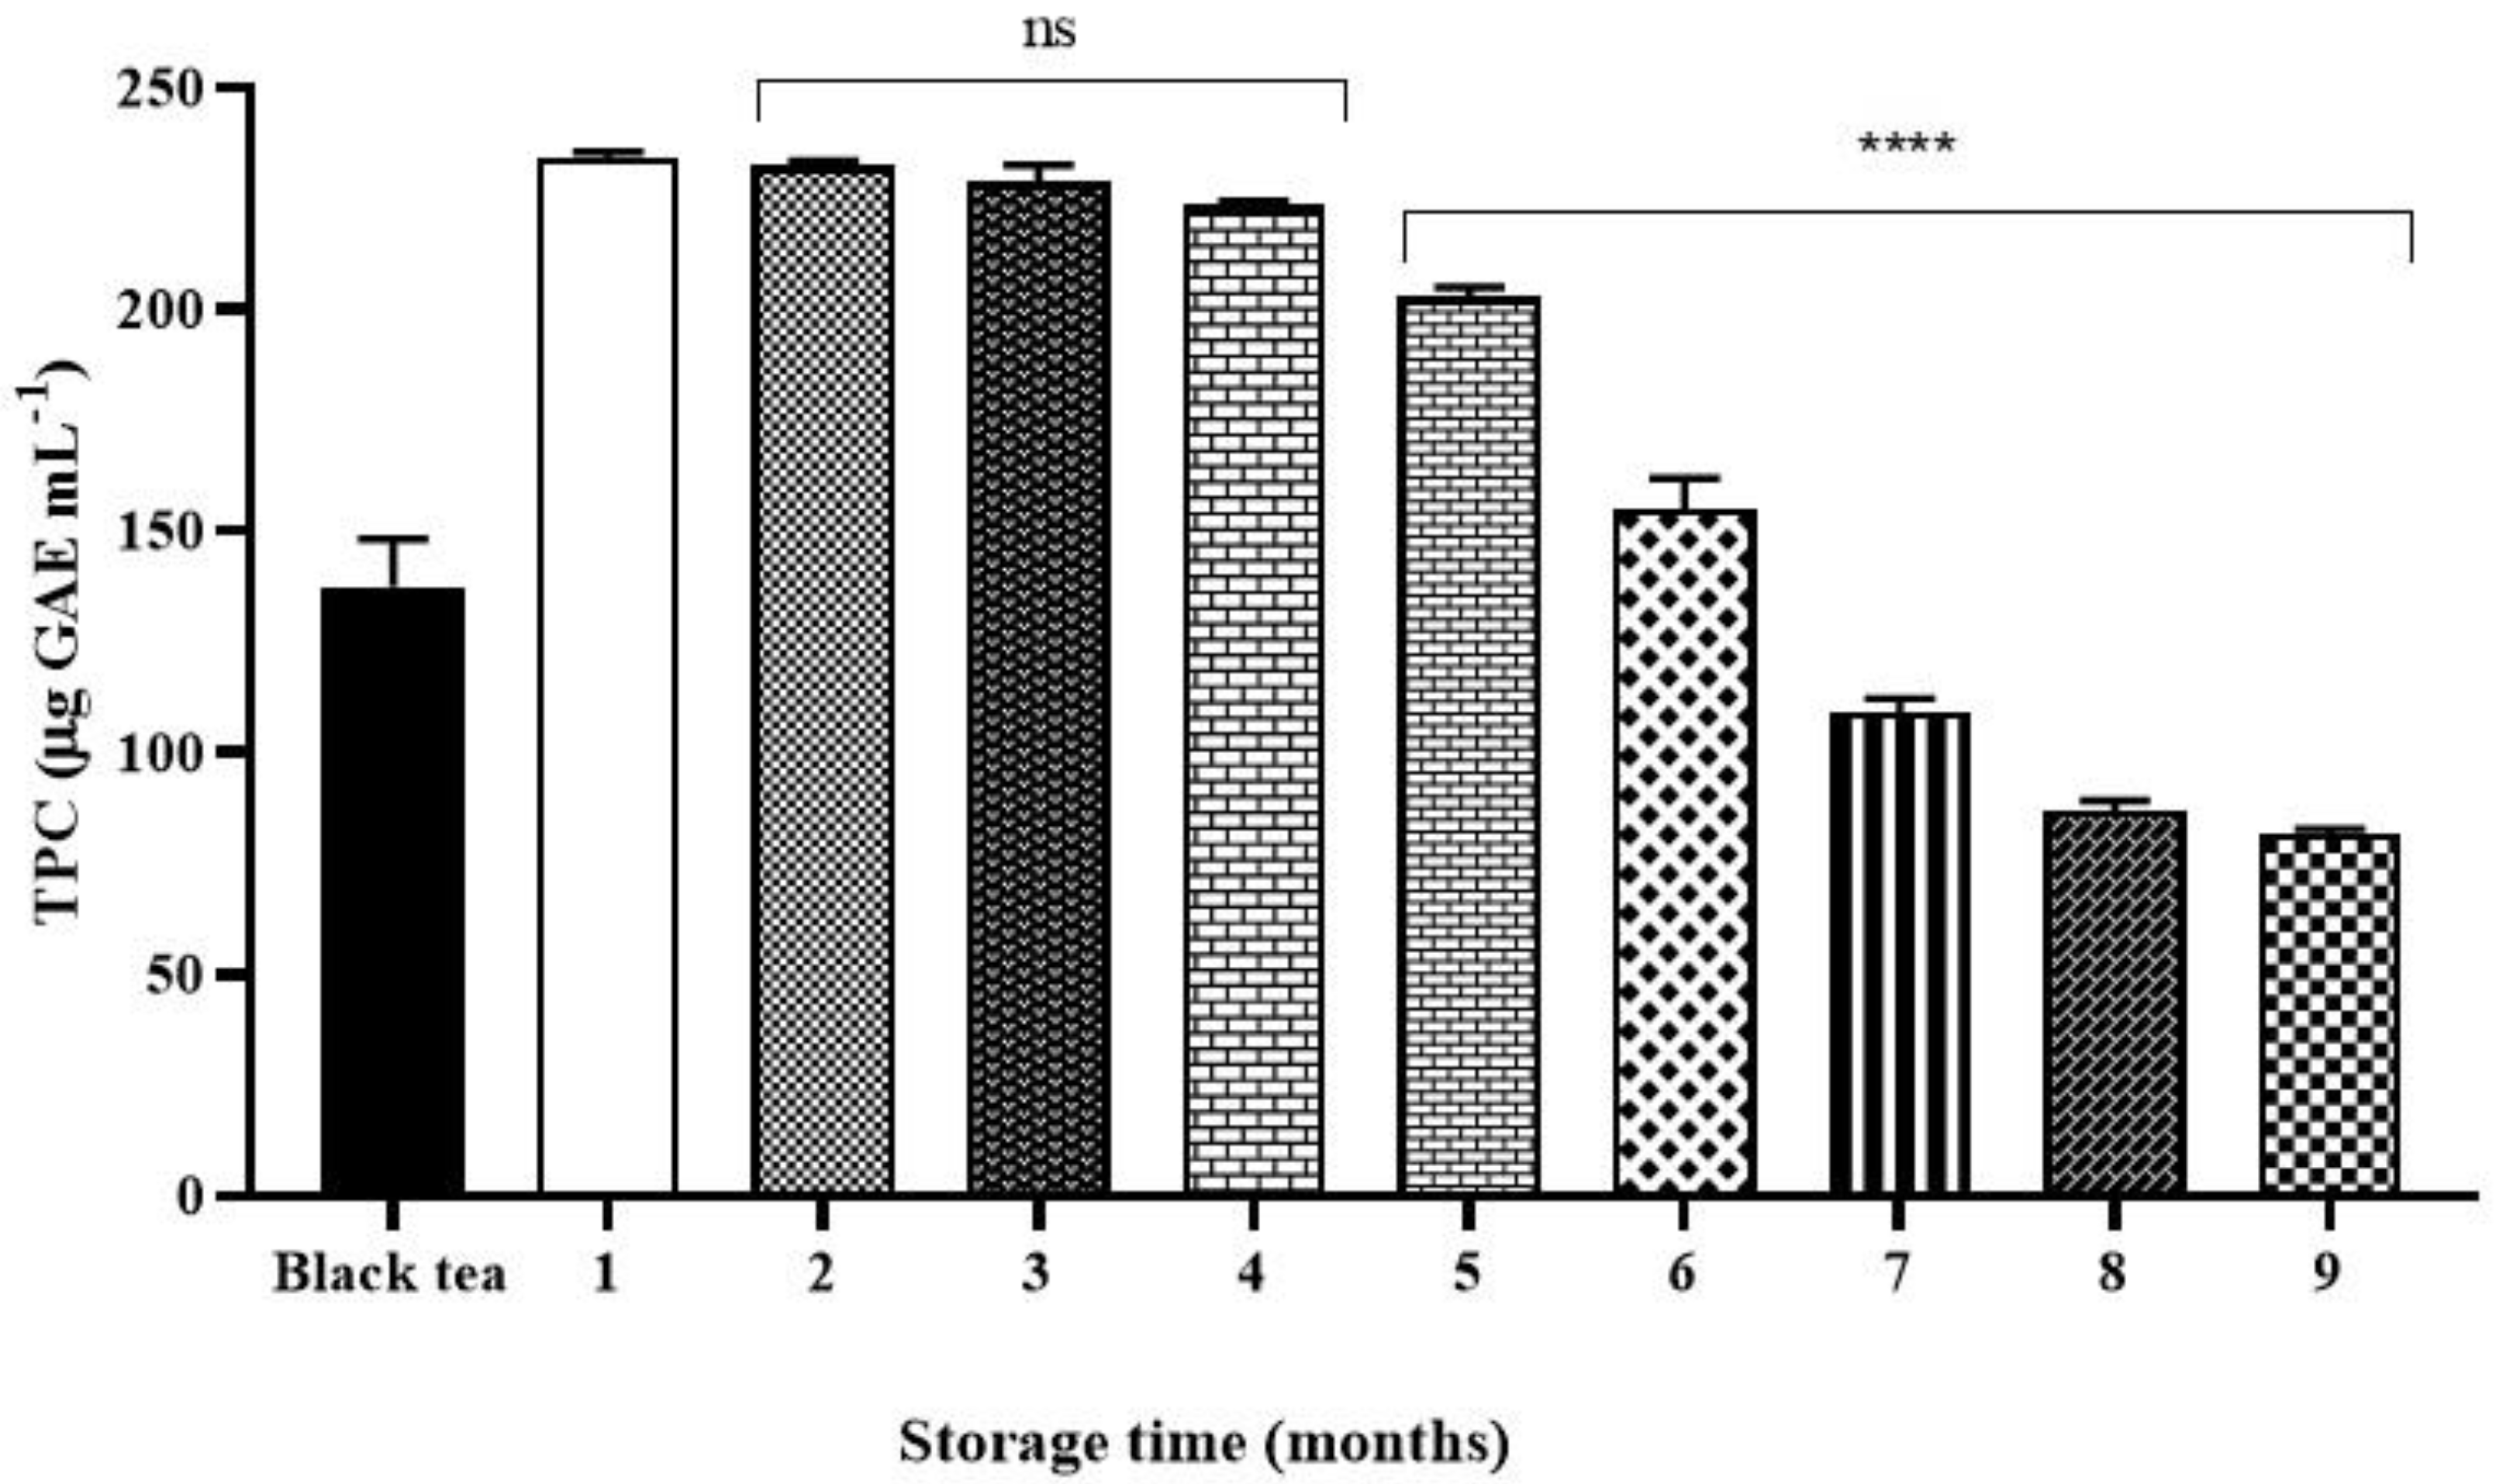
2.2. Total Phenolic Content (TPC)
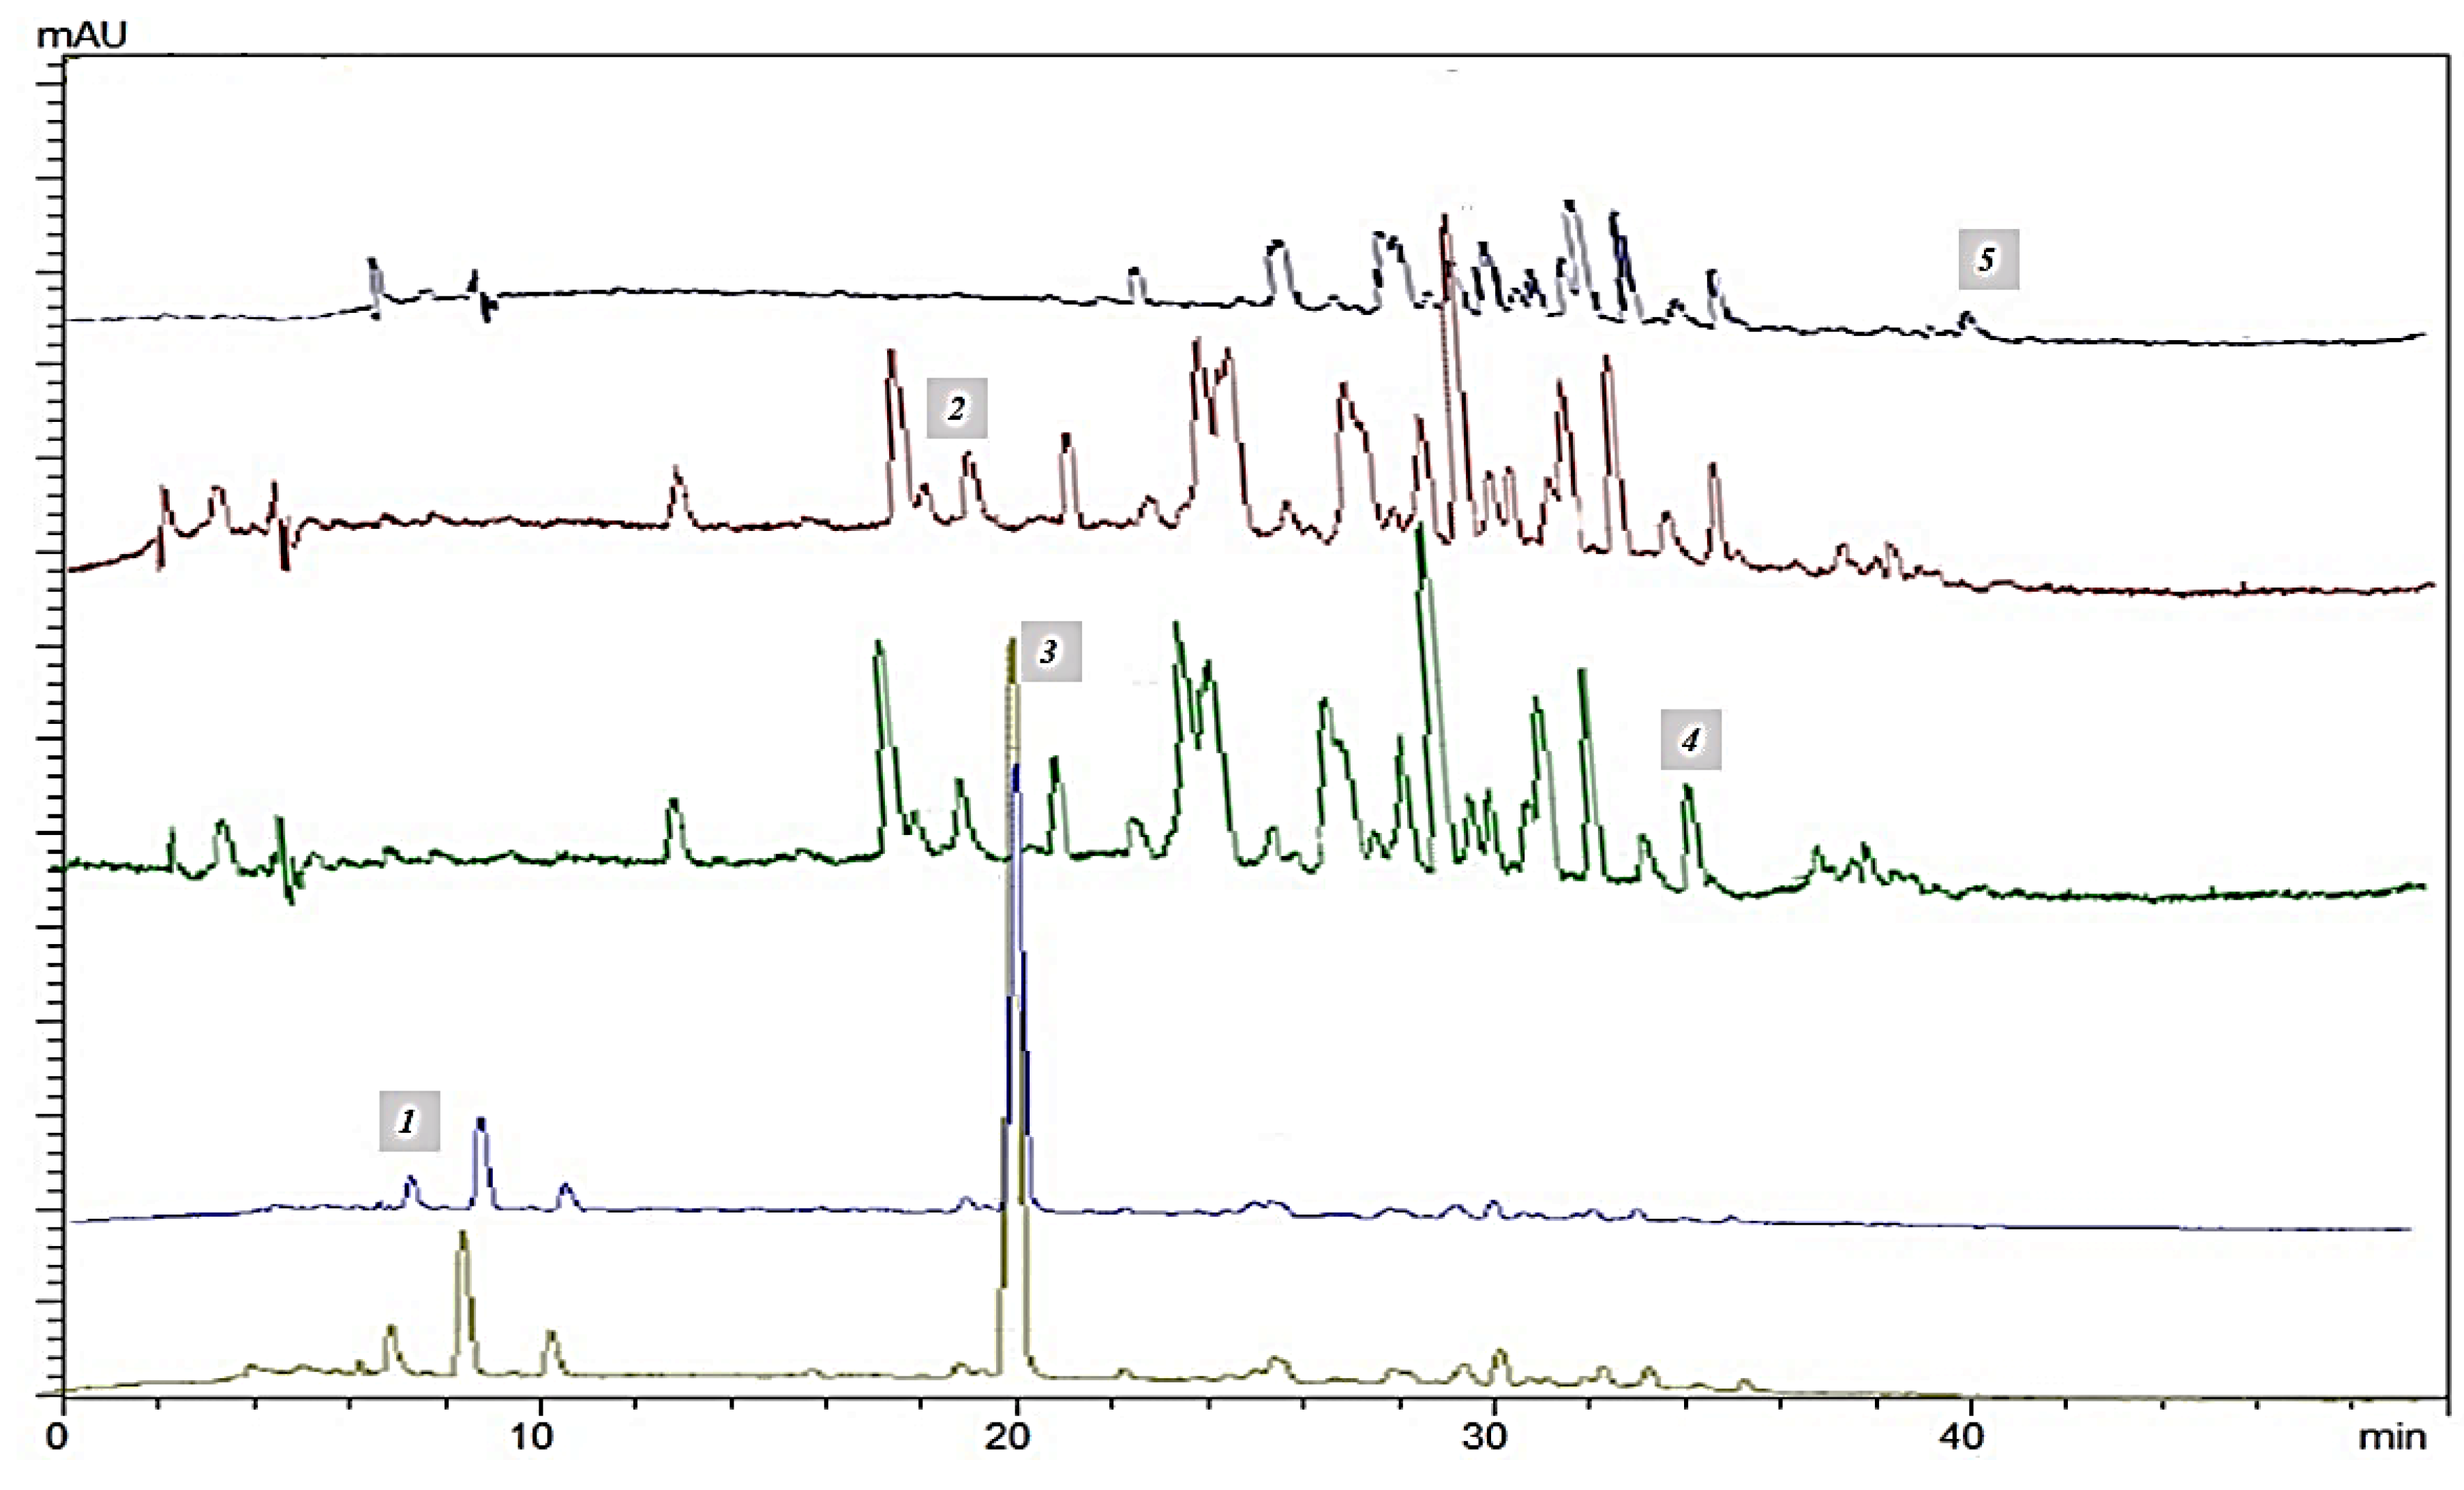
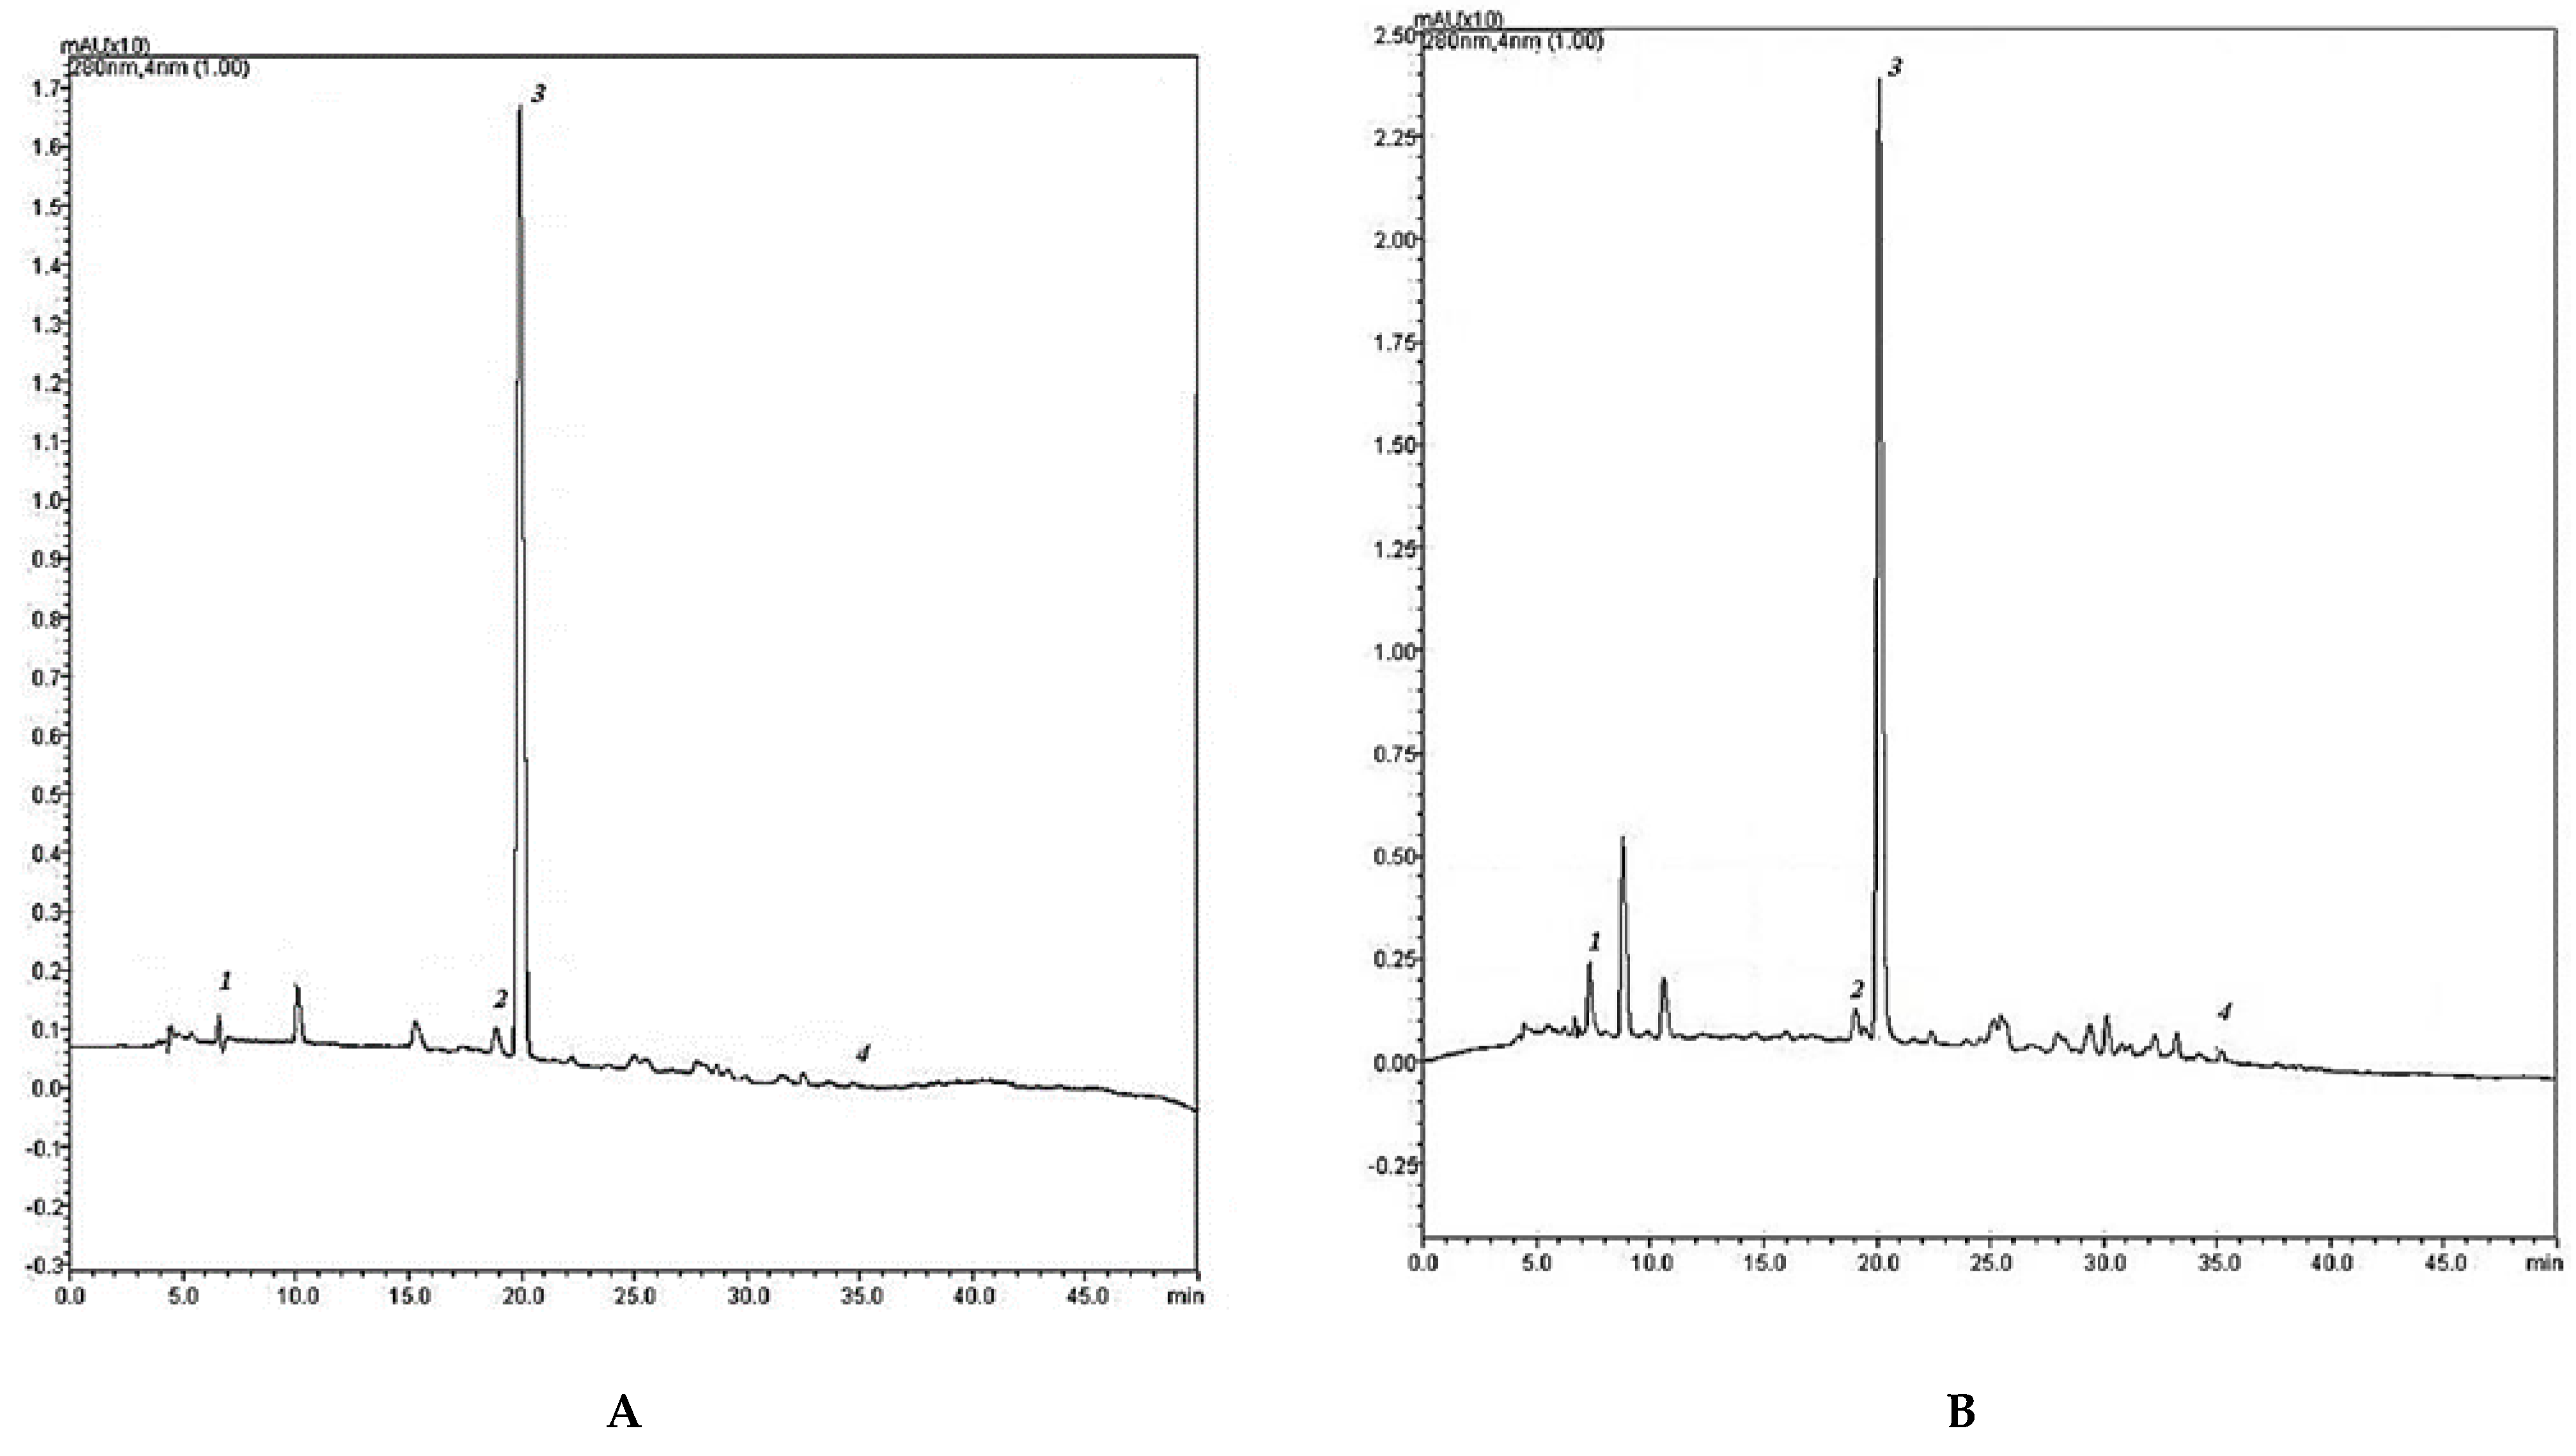
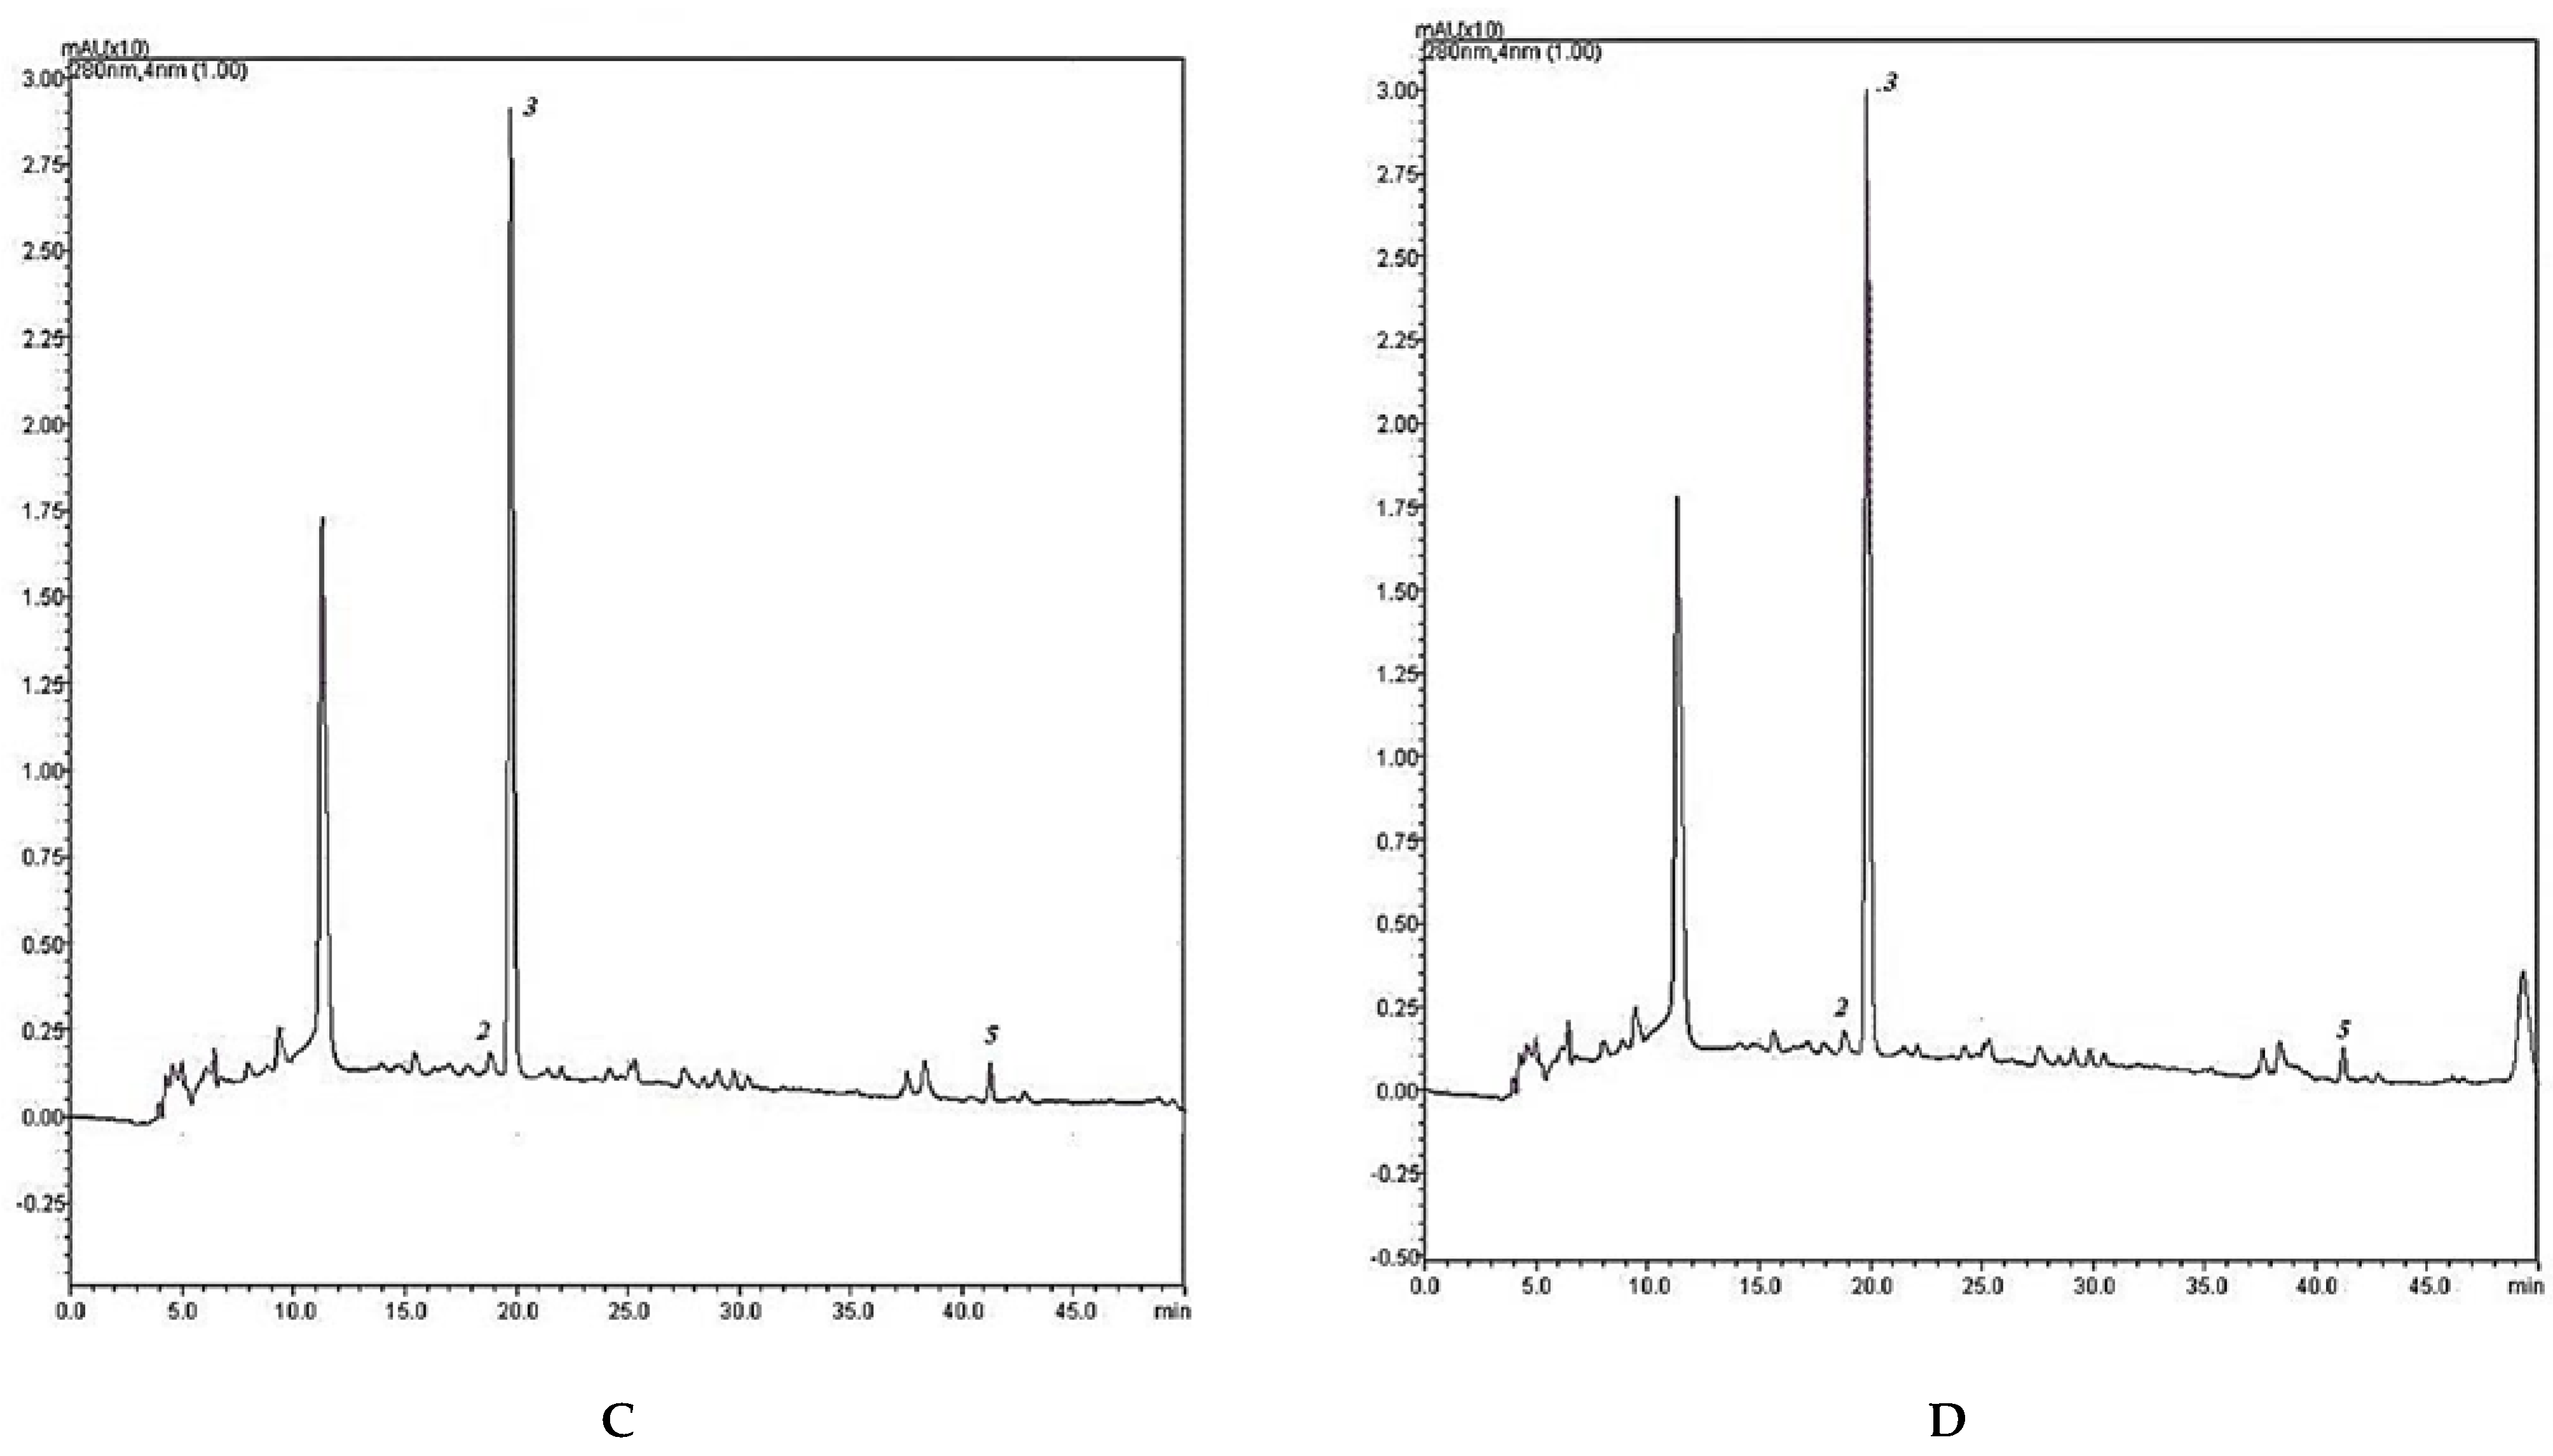
2.3. HPLC-DAD Analyses
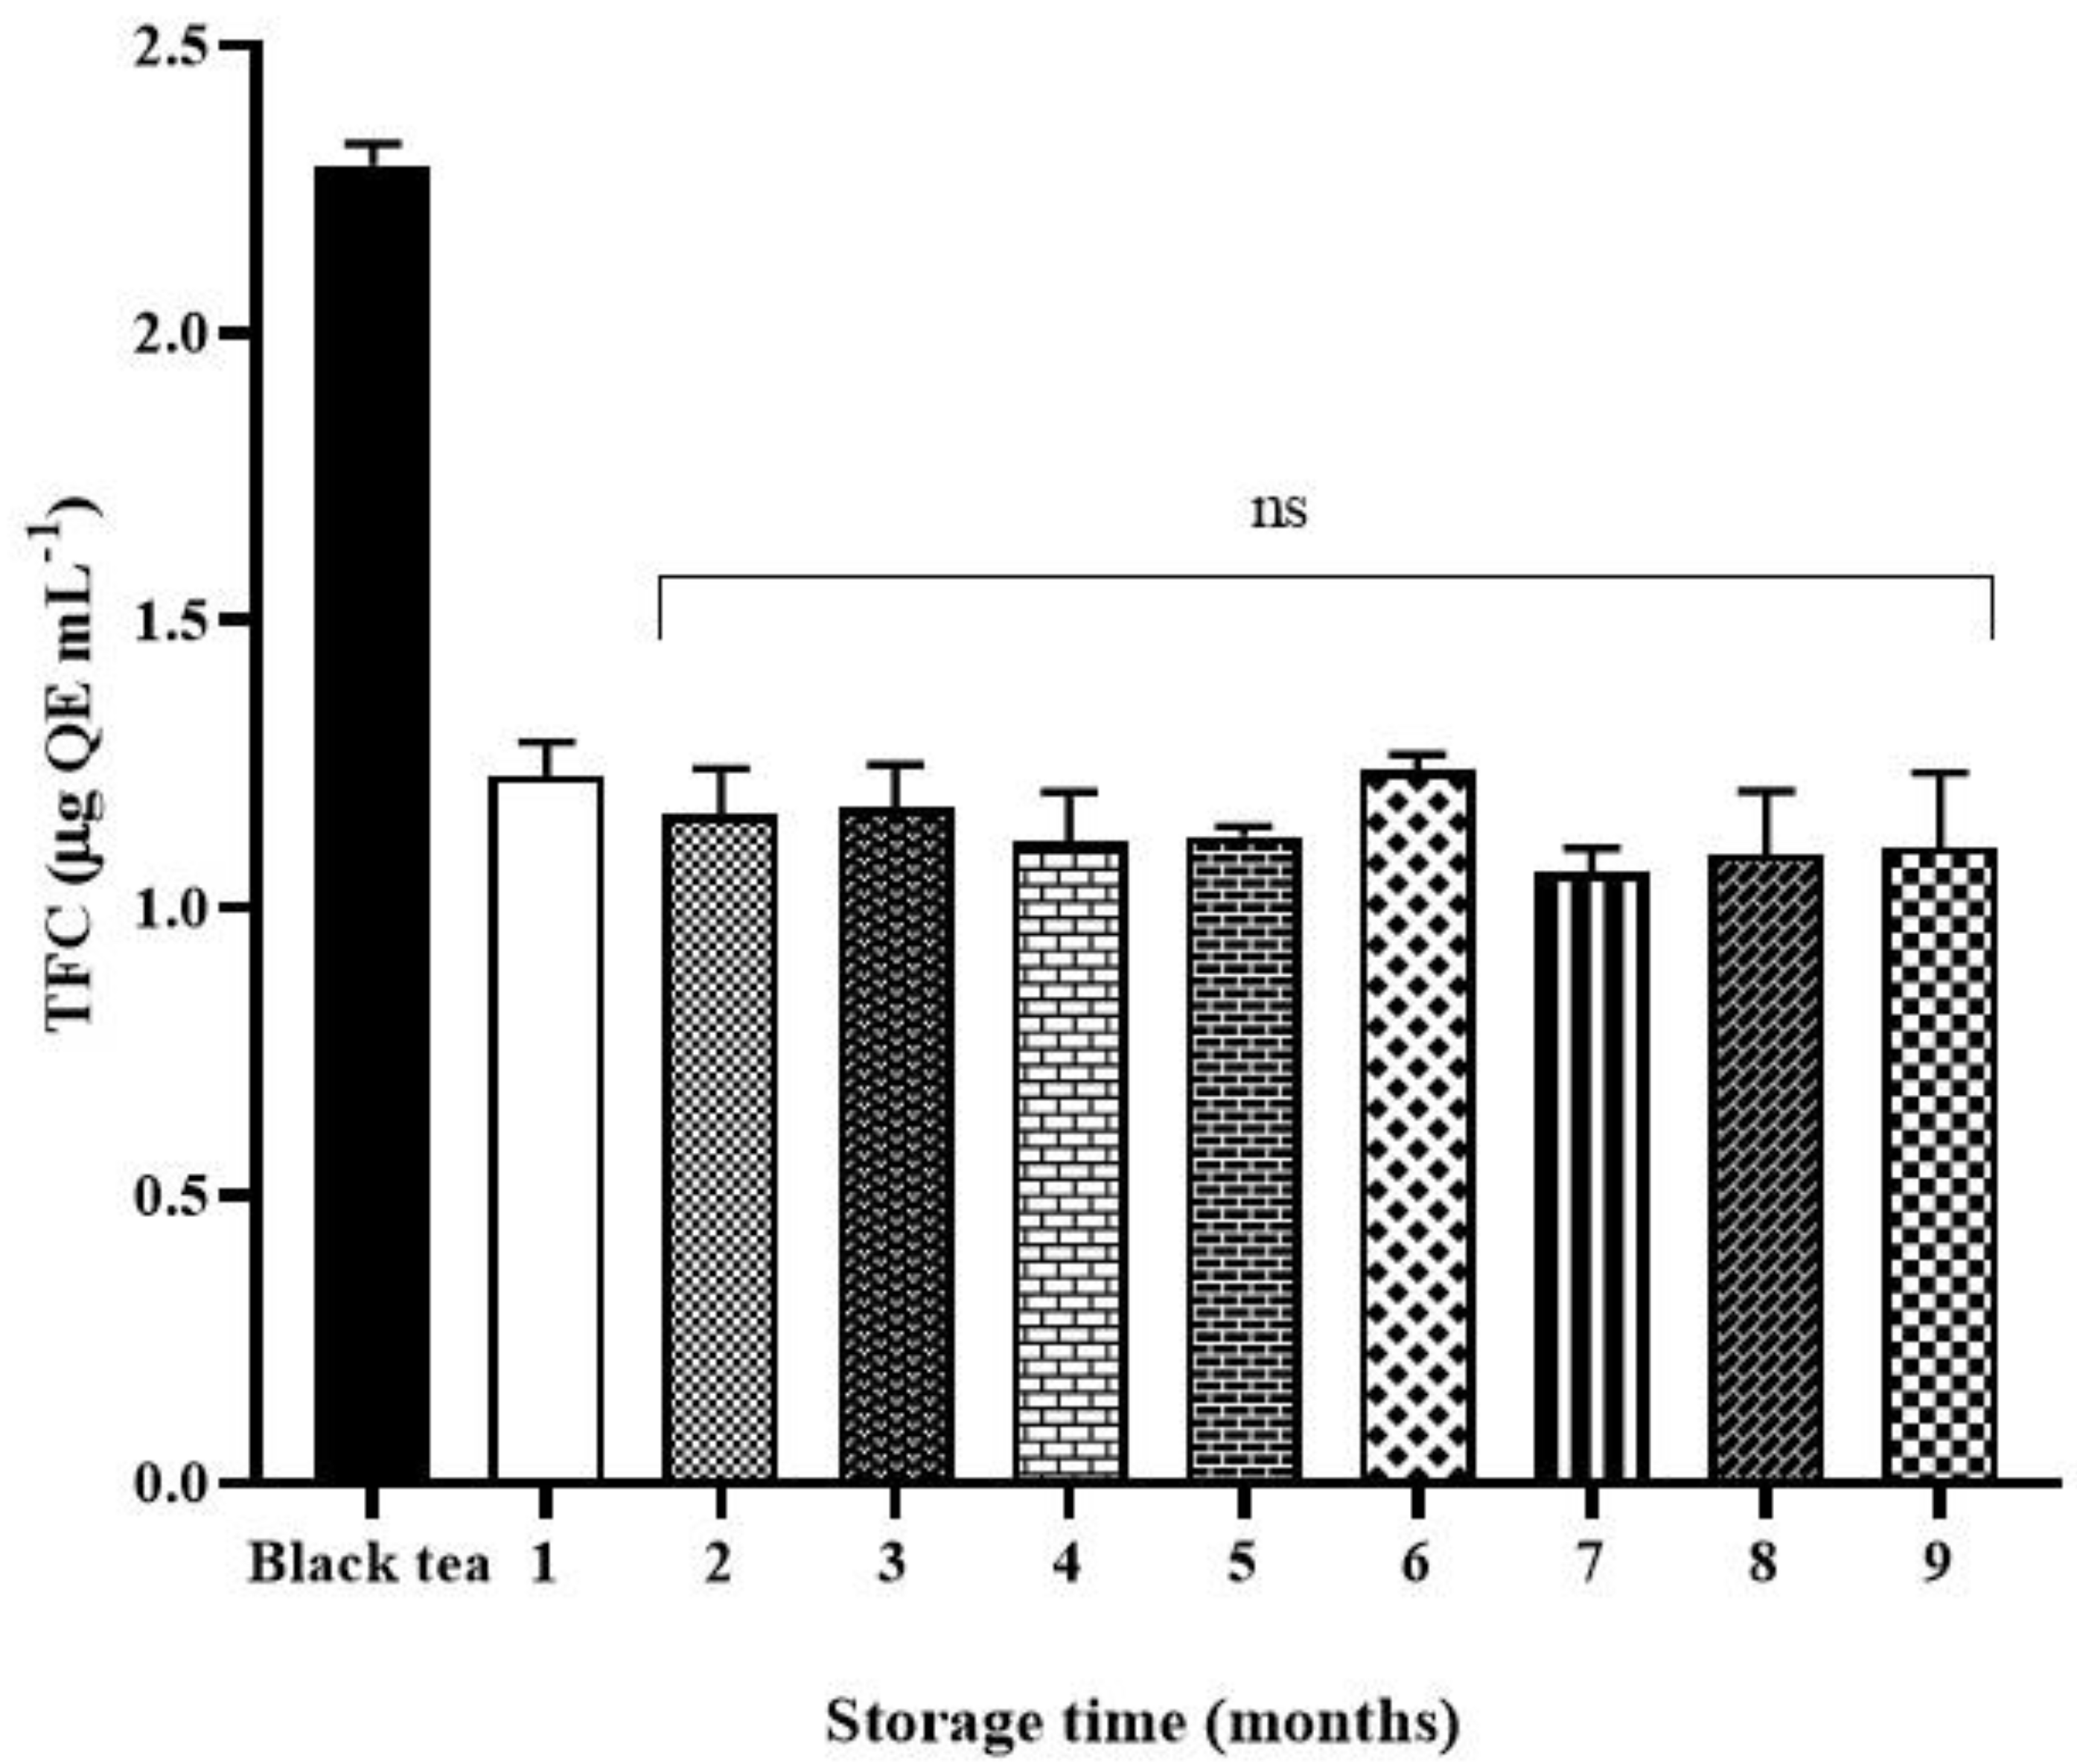
2.4. Total Flavonoid Content (TFC)
2.5. Determination of Antioxidant Activity
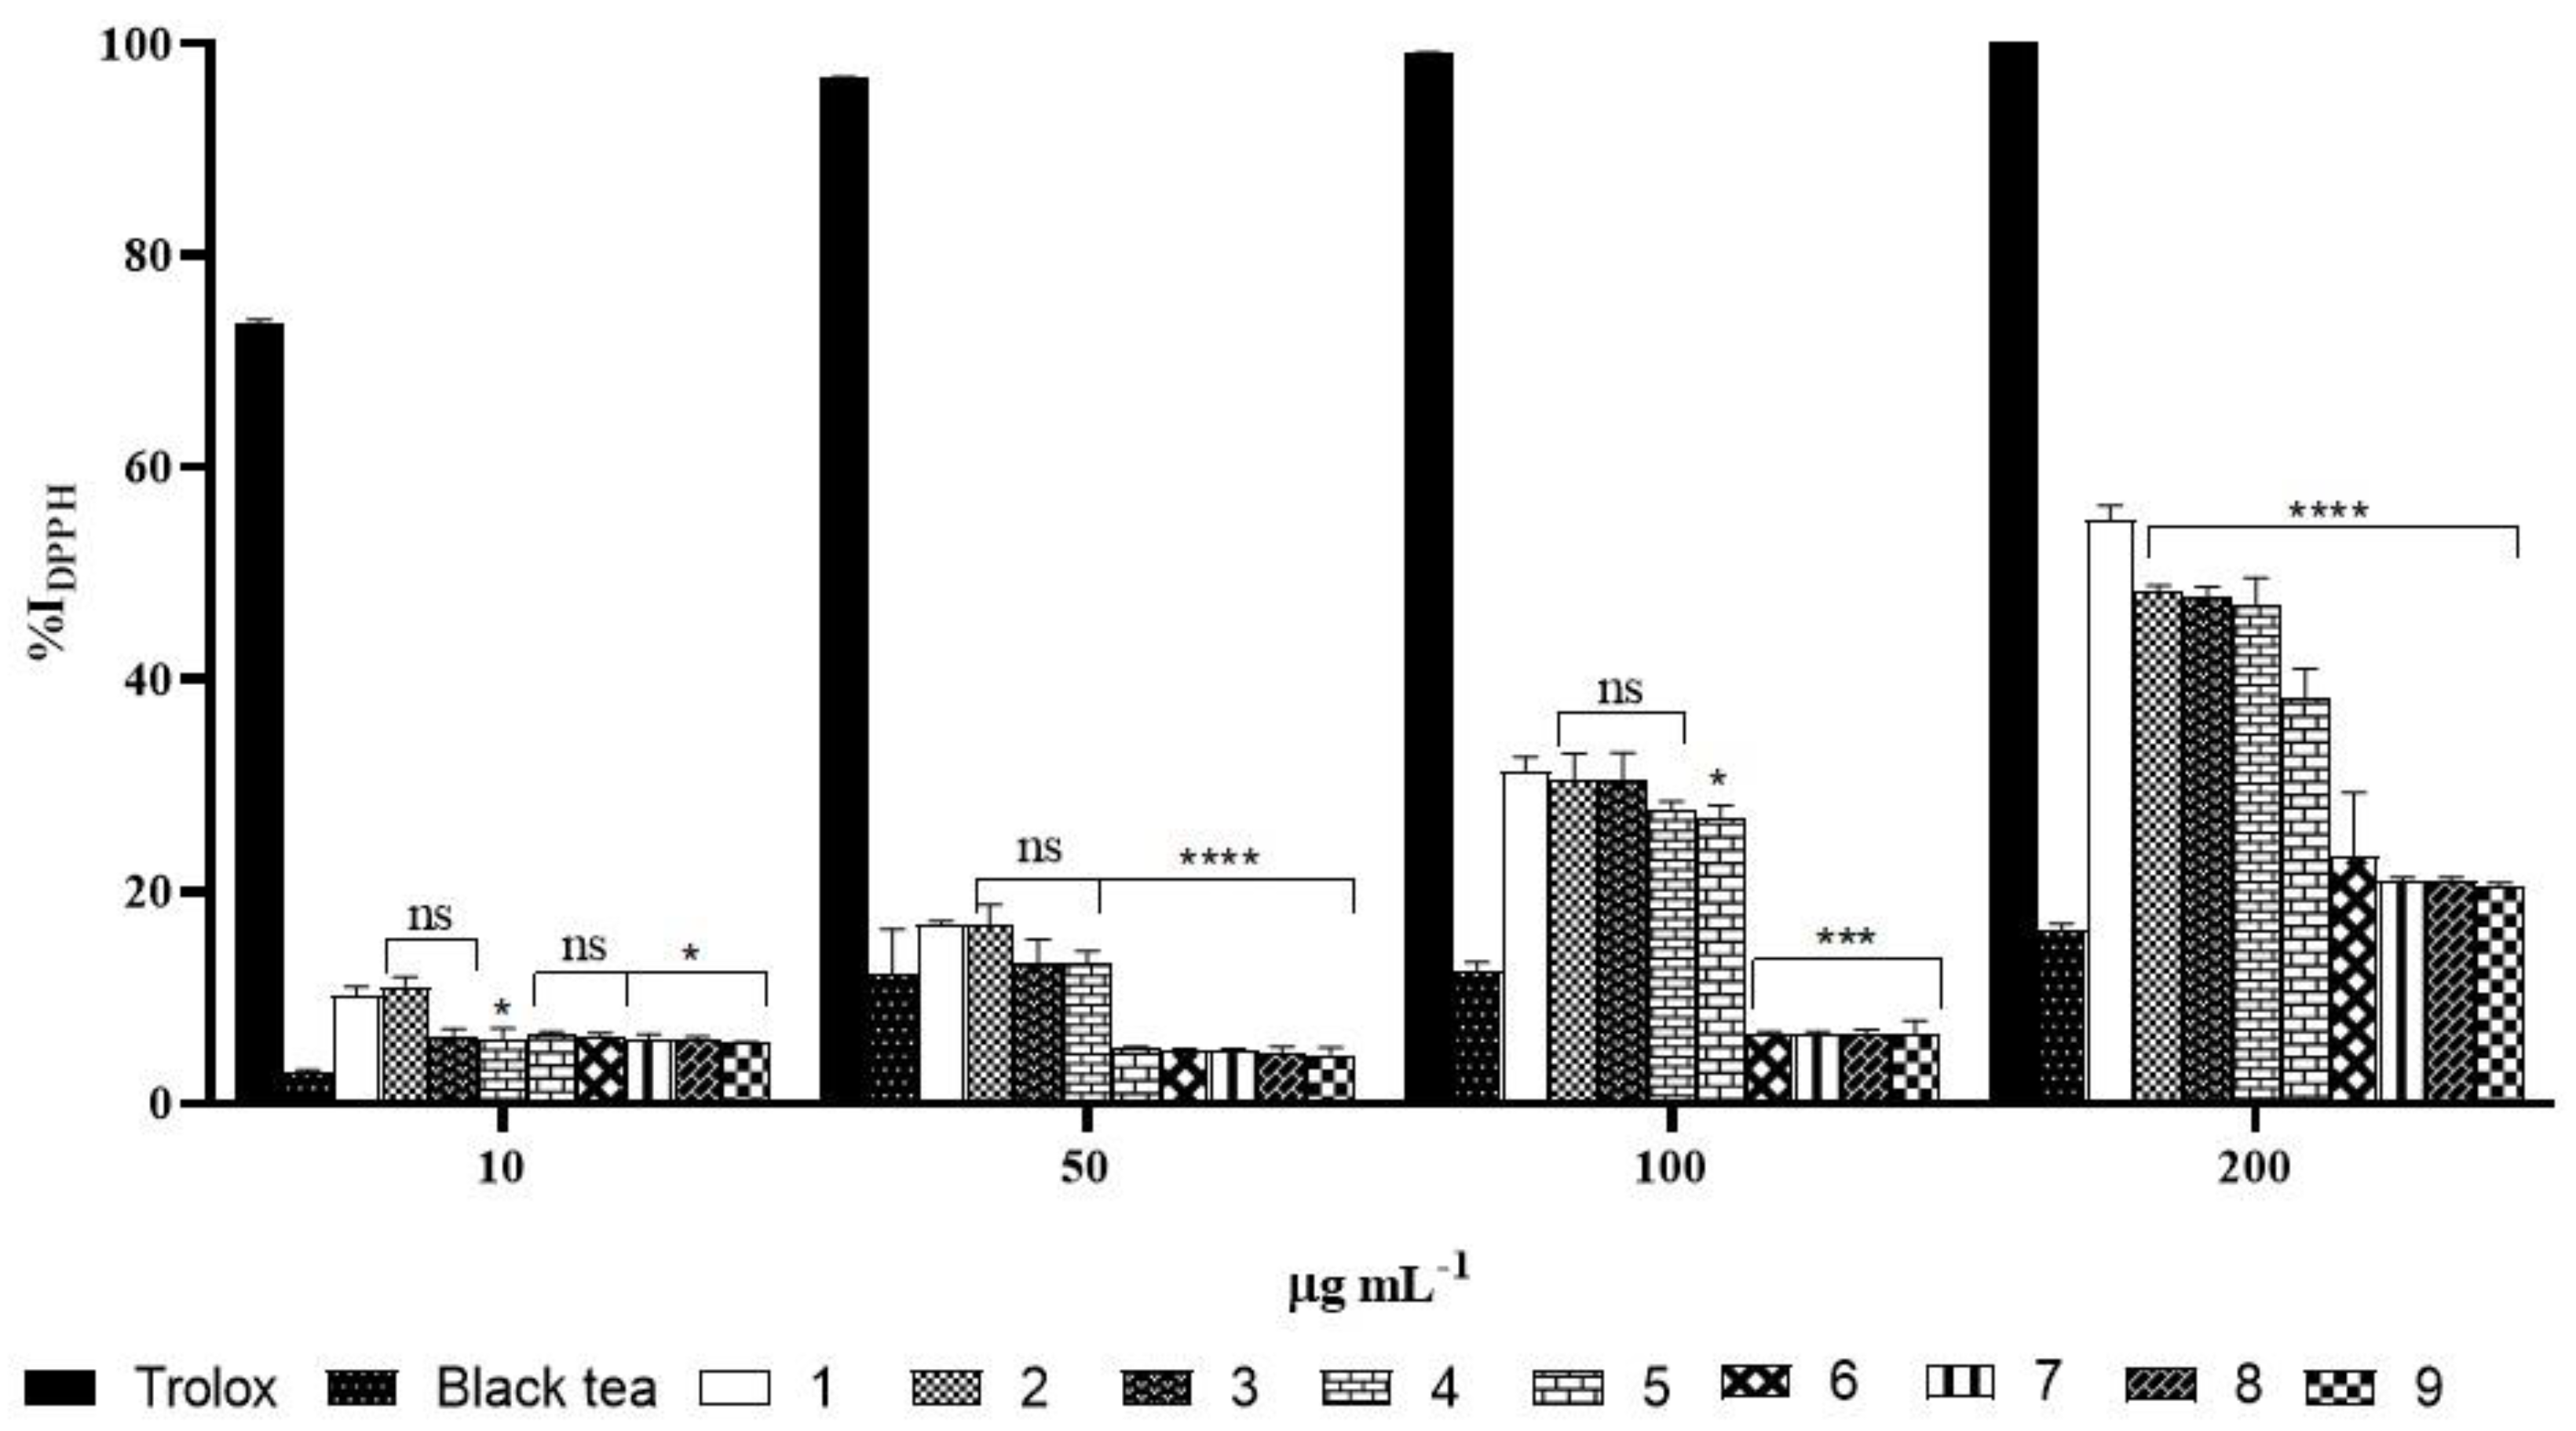
2.5.1. DPPH Assay
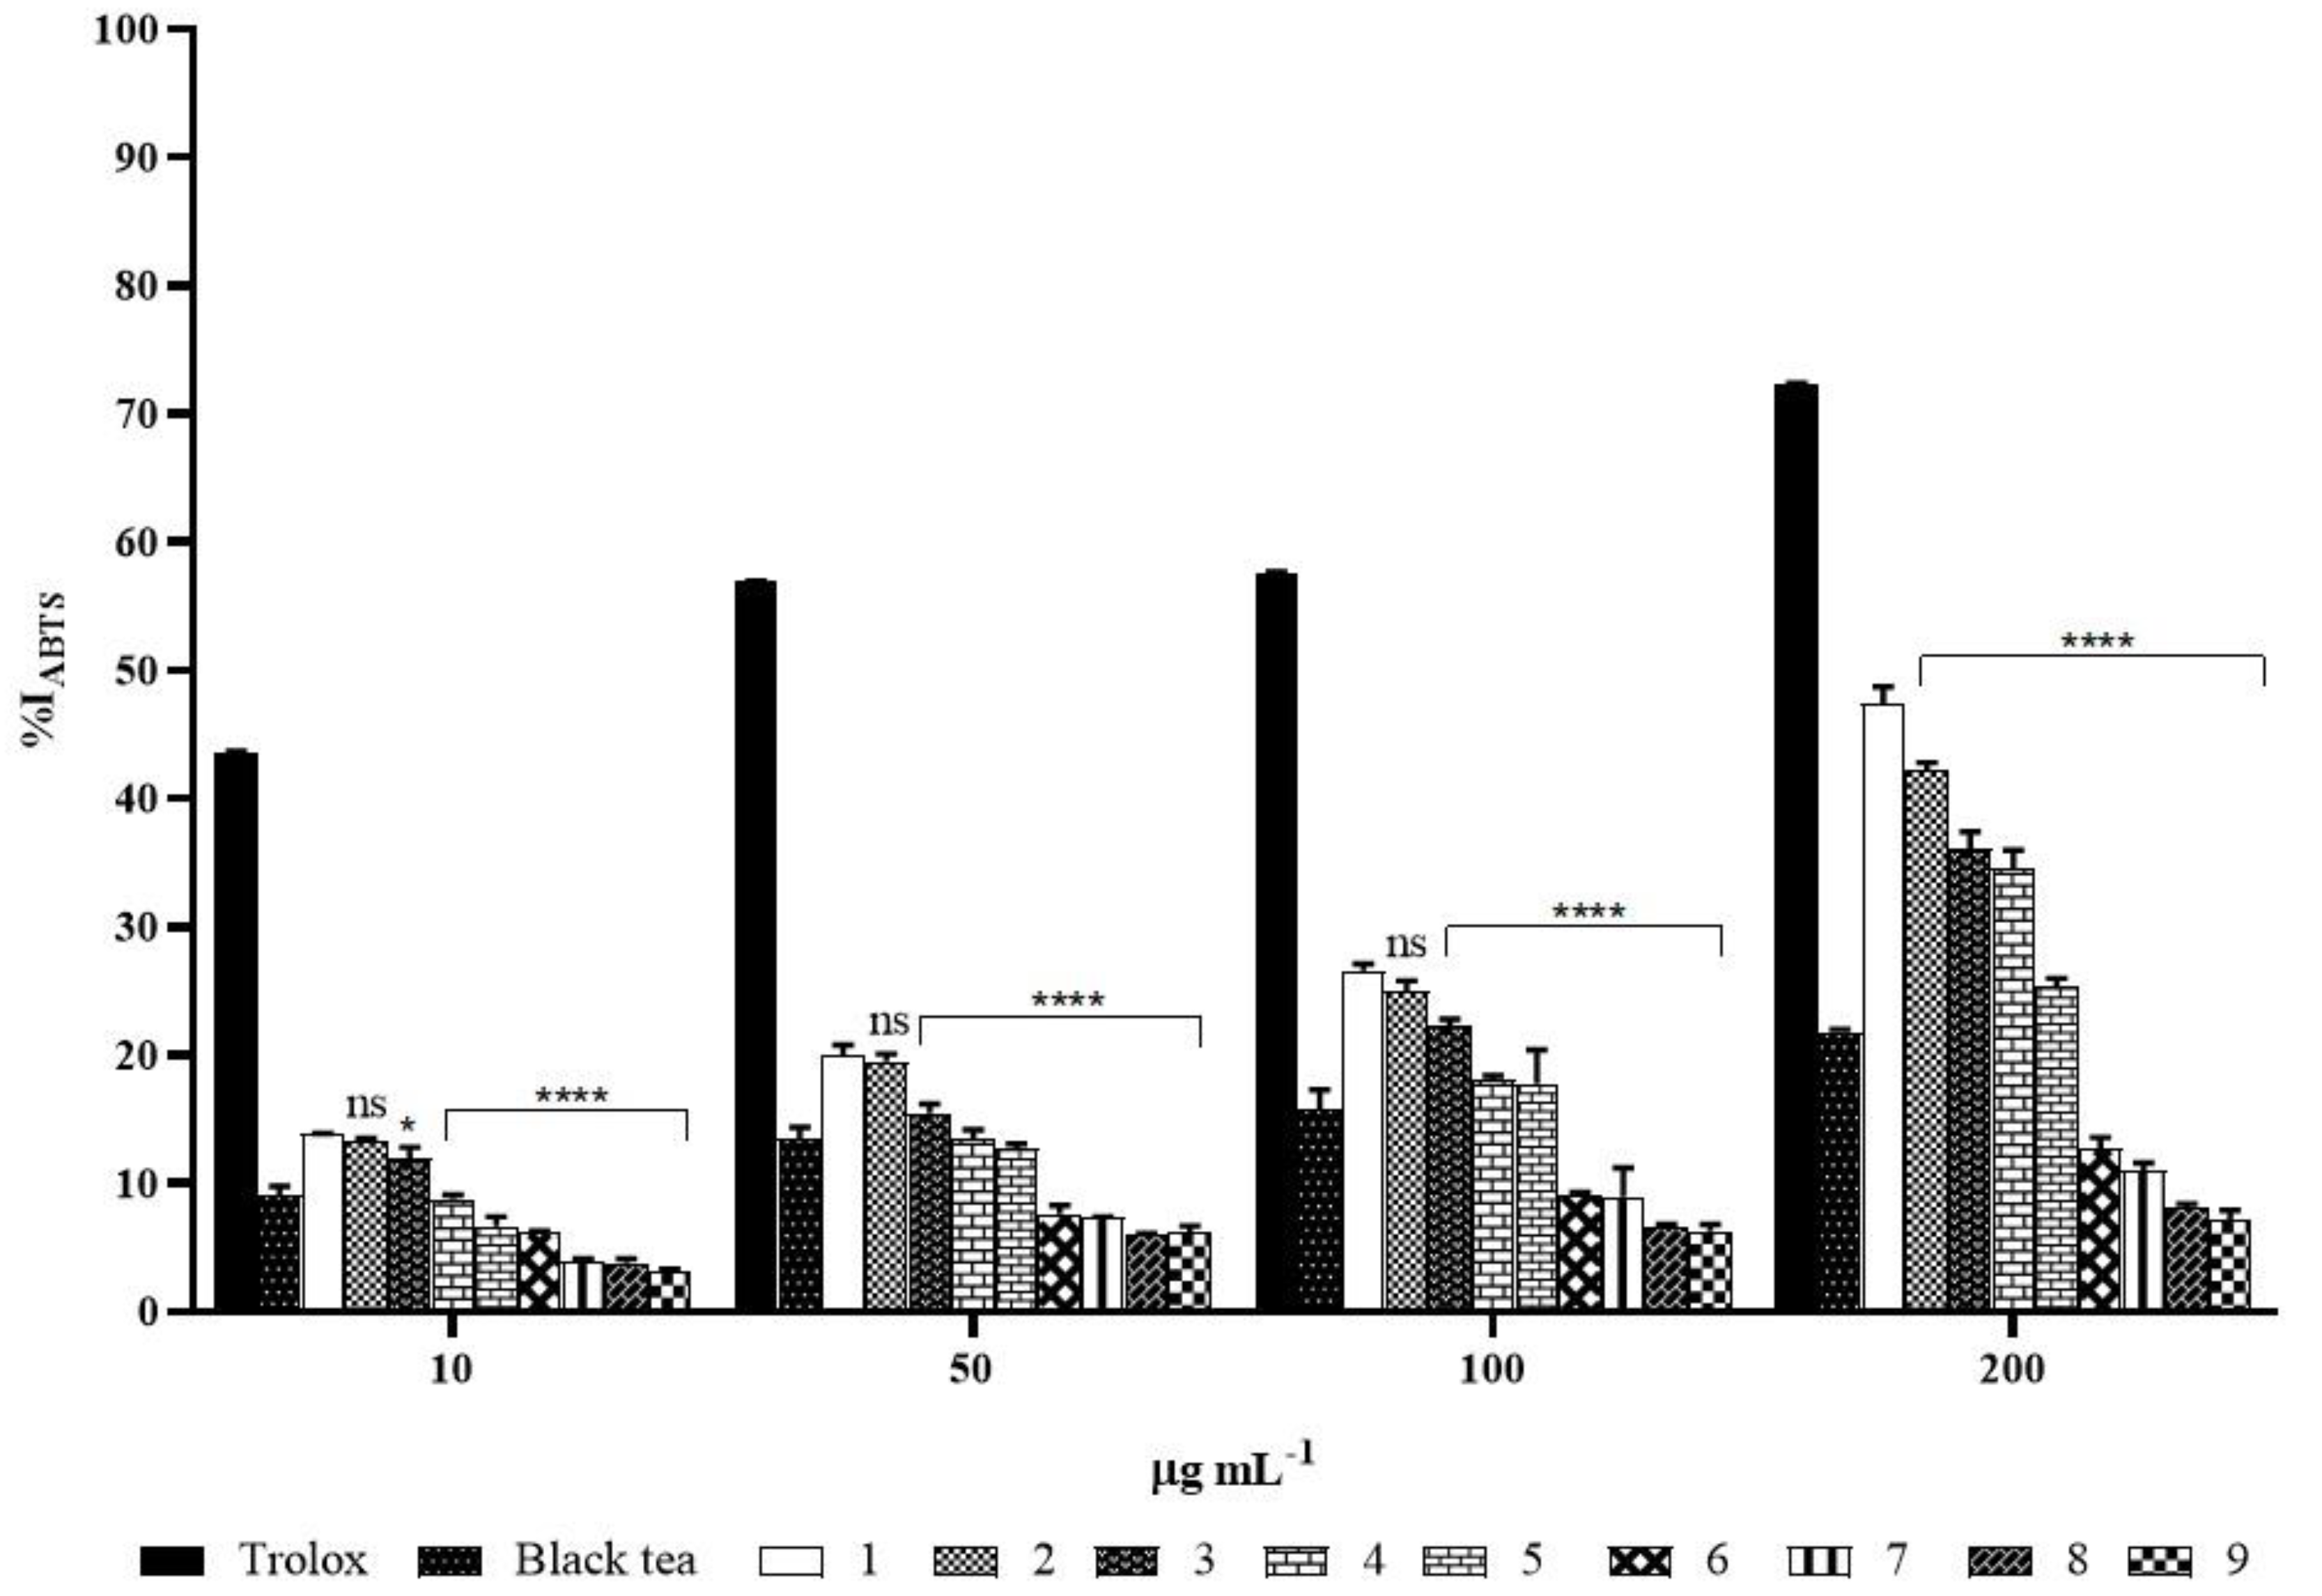
2.5.2. ABTS Assay
3. Discussion
4. Materials and Methods
4.1. Standards and Chemicals
4.2. Preparation of Kombucha Tea and Fermentation Conditions
4.3. Storage Condition
4.4. pH Values of Tea Kombucha during Storage
4.5. Total Phenolic Content (TPC)
4.6. HPLC-DAD Analyses
4.7. Total Flavonoid Content (TFC)
4.8. Radical Scavenging Activity
4.8.1. DPPH Assay
4.8.2. ABTS Assay
4.9. Statistical Analysis
5. Conclusions
Author Contributions
Funding
Institutional Review Board Statement
Informed Consent Statement
Data Availability Statement
Conflicts of Interest
Sample Availability
Abbreviations
| EtOH | Ethanol |
| MeOH | methanol |
| DMSO | dimethylsulfoxide |
| TPC | total phenolic content |
| TFC | total flavonoid content |
| DPPH | 2,2’-diphenyl-1-picrylhydrazyl |
| ABTS | 2,2’-azino-bis(3-ethylbenzothiazolin-6-sulfonic) |
| Trolox | 6-hydroxy-2,5,7,8-tetramethylcroman-2-carboxylic acid |
| HPLC | High Performance Liquid Chromatography |
| QE | quercetin equivalents |
| GAE | gallic acid equivalents |
| EGCG | epigallocatechin-3-gallate |
| ECG | epicatechin-3-gallate |
| EGC | epigallocatechin |
| EC | epicatechin |
References
- Watawana, M.I.; Jayawardena, N.; Gunawardhana, C.B.; Waisundara, V.Y. Health, wellness, and safety aspects of the consumption of kombucha. J. Chem. 2015, 2015, 591869. [Google Scholar] [CrossRef] [Green Version]
- Jayabalan, R.; Malbaša, R.V.; Lončar, E.S.; Vitas, J.S.; Sathishkumar, M. A review on kombucha tea—Microbiology, composition, fermentation, beneficial effects, toxicity, and tea fungus. Compr. Rev. Food Sci. 2014, 1, 538–550. [Google Scholar] [CrossRef]
- Jayabalan, R.; Malini, K.; Sathishkumar, M.; Swaminathan, K.; Yun, S.E. Biochemical characteristics of tea fungus produced during kombucha fermentation. Food Sci. Biotechnol. 2010, 19, 843–847. [Google Scholar] [CrossRef]
- Vīna, I.; Linde, R.; Patetko, A.; Semjonovs, P. Glucuronic acid from fermented beverages: Biochemical functions in humans and its role in health protection. Int. J. Recent Res. Appl. Stud. 2013, 14, 17–25. [Google Scholar]
- Martínez Leal, J.; Valenzuela Suárez, L.; Jayabalan, R.; Huerta Oros, J.; Escalante-Aburto, A. A review on health benefits of kombucha nutritional compounds and metabolites. CYTA J. Food 2018, 16, 390–399. [Google Scholar] [CrossRef] [Green Version]
- Fazio, A.; La Torre, C.; Caroleo, M.C.; Caputo, P.; Cannataro, R.; Plastina, P.; Cione, E. Effect of addition of pectins from jujubes (Ziziphus jujuba Mill.) on vitamin C production during heterolactic fermentation. Molecules 2020, 25, 2706. [Google Scholar] [CrossRef]
- Chu, S.C.; Chen, C. Effects of origins and fermentation time on the antioxidant activities of kombucha. Food Chem. 2006, 98, 502–507. [Google Scholar] [CrossRef]
- Sreeramulu, G.; Zhu, Y.; Knol, W. Kombucha fermentation and its antimicrobial activity. J. Agric. Food Chem. 2000, 48, 2589–2594. [Google Scholar] [CrossRef] [PubMed]
- Sreeramulu, G.; Zhu, Y.; Knol, W. Characterization of antimicrobial activity in Kombucha fermentation. Acta Biotechnol. 2001, 21, 49–56. [Google Scholar] [CrossRef]
- Santos Junior, R.J.; Batista, R.A.; Rodrigues, S.A.; Filho, L.X.; Silva Lima, A. Antimicrobial activity of broth fermented with Kombucha colonies. J. Microb. Biochem. Technol. 2009, 1, 72–78. [Google Scholar] [CrossRef]
- Kozyrovska, N.O.; Reva, O.M.; Goginyan, V.B.; De Vera, J.P. Kombucha microbiome as a probiotic: A view from the perspective of post-genomics and synthetic ecology. Biopolym. Cell 2012, 28, 103–113. [Google Scholar] [CrossRef] [Green Version]
- Cannataro, R.; Fazio, A.; La Torre, C.; Caroleo, M.C.; Cione, E. Polyphenols in the Mediterranean Diet: From Dietary Sources to microRNA Modulation. Antioxidants 2021, 10, 328. [Google Scholar] [CrossRef] [PubMed]
- Cione, E.; La Torre, C.; Cannataro, R.; Caroleo, M.C.; Plastina, P.; Gallelli, L. Quercetin, Epigallocatechin Gallate, Curcumin, and Resveratrol: From Dietary Sources to Human MicroRNA Modulation. Molecules 2019, 25, 63. [Google Scholar] [CrossRef] [Green Version]
- Jayabalan, R.; Marimuthu, S.; Thangaraj, P.; Sathishkumar, M.; Binupriya, A.R.; Swaminathan, K.; Yun, S.E. Preservation of Kombucha Tea—Effect of Temperature on Tea Components and Free Radical Scavenging Properties. J. Agric. Food Chem. 2008, 56, 9064–9071. [Google Scholar] [CrossRef] [PubMed]
- Plastina, P.; Gabriele, B.; Fazio, A. Characterizing traditional rice varieties grown in temperate region of Italy: Free and Bound phenolic and lipid compounds and in vitro antioxidant properties. Food Qual. Saf. 2018, 2, 89–95. [Google Scholar] [CrossRef] [Green Version]
- Sembiring, L.N.; Elya, B.; Sauriasari, R. Phytochemical screening, Total Flavonoid and Total Phenolic content and Antioxidant Activity of Different Parts of Caesalpinia bonduc (L.) Roxb. Pharmacogn. J. 2018, 10, 123–127. [Google Scholar] [CrossRef] [Green Version]
- Essawet, N.A.; Cvetković, D.; Velićanski, A.; Canadanović-brunet, J.; vulić, J.; Maksimović, V.; Markov, S. Polyphenols and antioxidant activities of kombucha beverage enriched with coffeeberry extract. Chem. Ind. Chem. Eng. Q 2015, 21, 399–409. [Google Scholar] [CrossRef]
- Plastina, P.; Fazio, A.; Gabriele, B. Comparison of fatty acid profile and antioxidant potential of extracts of seven Citrus rootstock seeds. Nat. Prod. Res. 2012, 26, 2182–2187. [Google Scholar] [CrossRef] [PubMed]
- Voidarou, C.; Antoniadou, Μ.; Rozos, G.; Tzora, A.; Skoufos, I.; Varzakas, T.; Lagiou, A.; Bezirtzoglou, E. Fermentative Foods: Microbiology, Biochemistry, Potential Human Health Benefits and Public Health Issues. Foods 2021, 10, 69. [Google Scholar] [CrossRef]
- Skocińska, N.; Sionek, B.; Ścibisz, I.; Kołożyn-Krajewska, D. Acid contents and the effect of fermentation condition of Kombucha tea beverages on physicochemical, microbiological and sensory properties. CyTA-J. Food 2017, 15, 601–607. [Google Scholar] [CrossRef] [Green Version]
- Cardoso, R.R.; Neto, R.O.; Dos Santos D’Almeida, C.T.; do Nascimento, T.P.; Pressete, C.G.; Azevedo, L.; Stampini Duarte Martino, H.; Cameron, L.C.; Ferreira, M.S.L.; de Barros, F.A.R. Kombuchas from green and black teas have different phenolic profile, which impacts their antioxidant capacities, antibacterial and antiproliferative activities. Food Res. Int. 2020, 128, 108782. [Google Scholar] [CrossRef]
- Jakubczyk, K.; Kałduńska, J.; Kochman, J.; Janda, K. Chemical Profile and Antioxidant Activity of the Kombucha Beverage Derived from White, Green, Black and Red Tea. Antioxidants 2020, 9, 447. [Google Scholar] [CrossRef]
- Xu, Y.Q.; Chen, J.X.; Du, Q.Z.; Yin, J.F. Improving the quality of fermented black tea juice with oolong tea infusion. J. Food Sci. Technol. 2017, 54, 3908–3916. [Google Scholar] [CrossRef]
- Ning, Y.; Wu, Z.; Li, Z.; Meng, R.; Xue, Z.; Wang, X.; Lu, X.; Zhang, X. Optimization of Fermentation Process Enhancing Quality of Dandelion Black Tea on the Functional Components, Activity and Sensory Quality. Open Access Libr. J. 2020, 7, 1–11. [Google Scholar] [CrossRef]
- Grumezescu, A.M.; Holban, A.M. The Science of Beverages. In Fermented Beverages, 1st ed.; Woodhead publishing-Elsevier: Sawston, UK, 2019; Volume 5, Chapter 10. [Google Scholar]
- Jayabalan, R.; Subathradevi, P.; Marimuthu, S.; Sathishkumar, M.; Swaminathan, K. Changes in free-radical scavenging ability of kombucha tea during fermentation. Food Chem. 2008, 109, 227–234. [Google Scholar] [CrossRef] [PubMed]
- Di Renzo, L.; Gualtieri, P.; Pivari, F.; Soldati, L.; Attinà, A.; Cinelli, G.; Leggeri, C.; Caparello, G.; Barrea, L.; Scerbo, F.; et al. Eating habits and lifestyle changes during COVID-19 lockdown: An Italian survey. J. Transl. Med. 2020, 18, 229. [Google Scholar] [CrossRef] [PubMed]
- Janssen, M.; Chang, B.P.I.; Hristov, H.; Pravst, I.; Profeta, A.; Millard, J. Changes in Food Consumption during the COVID-19 Pandemic: Analysis of Consumer Survey Data From the First Lockdown Period in Denmark, Germany, and Slovenia. Front Nutr. 2021, 8, 635859. [Google Scholar] [CrossRef] [PubMed]
- Ganatsios, V.; Nigam, P.; Plessas, S.; Terpou, A. Kefir as a Functional Beverage Gaining Momentum towards Its Health Promoting Attributes. Beverages 2021, 7, 48. [Google Scholar] [CrossRef]
- Available online: https://www.forbes.com/sites/bridgetshirvell/2020/08/13/how-hard-kombucha-became-the-drink-of-2020 (accessed on 6 September 2021).
- Katarzyna Kapp, J.M.; Sumner, W. Kombucha: A systematic review of the empirical evidence of human health benefit. Ann. Epidemiol. 2019, 30, 66–70. [Google Scholar] [CrossRef] [PubMed]
- Srinivasan, R.; Smolinske, S.; Greenbaum, D. Probable gastrointestinal toxicity of Kombucha tea: Is this beverage healthy or harmful? J. Gen. Int. Med. 1997, 12, 643–644. [Google Scholar] [CrossRef] [PubMed] [Green Version]
- SungHee Kole, A.; Jones, H.D.; Christensen, R.; Gladstein, J. A case of Kombucha tea toxicity. J. Int. Care Med. 2009, 24, 205–207. [Google Scholar] [CrossRef] [PubMed]


| Samples | Caffeine | Chlorogenic Acid | EGCG | Ferulic Acid | Quercetin |
|---|---|---|---|---|---|
| Black tea | 568.61 ± 0.84 | 29.70 ± 0.01 | 20.58 ± 0.32 | 3.15 ± 0.03 | nd a |
| Fermented Kombucha | 356.25 ± 7.17 | 29.60 ± 0.03 | 20.24 ± 0.53 | 2.97 ± 0.90 | nd |
| 1st storage month | 339.50 ± 4.15 | 29.51 ± 0.06 | 19.90 ± 0.12 | 1.21 ± 0.01 | nd |
| 2nd storage month | 310.63 ± 0.97 | 29.56 ± 0.01 | 19.96 ± 0.07 | 1.30 ± 0.20 | nd |
| 3rd storage month | 159.20 ± 0.55 | 29.24 ± 0.38 | 19.92 ± 0 | 0.82 ± 0.36 | nd |
| 4th storage month | 135.36 ± 1.63 | 29.41 ± 0.41 | nd | 0.75 ± 0 | nd |
| 5th storage month | 162.60 ± 0.26 | 29.64 ± 0.91 | nd | 0.41 ± 0.04 | 23.07 ± 0.01 |
| 6th storage month | 674.98 ± 0.49 | 29.72 ± 0.01 | nd | nd | 23.16 ± 0.59 |
| 7th storage month | 672.27 ± 0.07 | 29.58 ± 0.03 | nd | nd | 23.23 ± 0.08 |
| 8th storage month | 702.91 ± 0.71 | 29.72 ± 0.01 | nd | nd | 23.03 ± 0.07 |
| 9th storage month | 702.93 ± 0.02 | 29.60 ± 0.01 | nd | nd | 23.04 ± 0.03 |
| Samples | Concentrations | |||
|---|---|---|---|---|
| 10 µL | 50 µL | 100 µL | 200 µL | |
| Black tea | 0.8 ± 0.1 | 2.0 ± 0.6 | 2.1 ± 0.1 | 2.6 ± 0.1 |
| Fermented Kombucha | 1.2 ± 0.1 | 2.1 ± 0.1 | 3.0 ± 0.2 | 7.4 ± 0.2 |
| 1st storage month | 1.3 ± 0.4 | 2.1 ± 0.3 | 4.3 ± 0.2 | 6.3 ± 0.1 |
| 2nd storage month | 0.7 ± 0.1 | 1.5 ± 0.3 | 4.0 ± 0.2 | 6.4 ± 0.3 |
| 3rd storage month | 0.6 ± 1.0 | 1.7 ± 0.2 | 3.6 ± 0.1 | 6.3 ± 0.2 |
| 4th storage month | 0.4 ± 0.1 | 0.5 ± 0.1 | 3.4 ± 0.1 | 5.1 ± 0.4 |
| 5th storage month | 0.5 ± 0.1 | 0.5 ± 0.1 | 0.8 ± 0.1 | 3.0 ± 0.7 |
| 6th storage month | 0.6 ± 0.1 | 0.7 ± 0.1 | 0.8 ± 0.1 | 2.8 ± 0.3 |
| 7th storage month | 0.7 ± 0.1 | 1.3 ± 0.1 | 2.0 ± 0.2 | 2.7 ± 0.1 |
| 8th storage month | 0.6 ± 0.1 | 0.9 ± 0.1 | 1.0 ± 0.6 | 3.0 ± 0.3 |
| 9th storage month | 0.6 ± 0.1 | 0.9 ± 0.1 | 1.2 ± 0.1 | 2.9 ± 0.1 |
| Samples | Concentrations | |||
|---|---|---|---|---|
| 10 µL | 50 µL | 100 µL | 200 µL | |
| Black tea | 1.8 ± 0.2 | 3.0 ± 0.2 | 3.4 ± 0.2 | 4.8 ± 0.1 |
| Fermented Kombucha | 2.8 ± 0.1 | 4.5 ± 0.1 | 6.1 ± 0.1 | 9.6 ± 0.3 |
| 1st storage month | 2.8 ± 0.1 | 4.4 ± 0.1 | 5.5 ± 0.1 | 9.1 ± 0.3 |
| 2nd storage month | 2.6 ± 0.1 | 3.3 ± 0.3 | 5.1 ± 0.2 | 7.9 ± 0.2 |
| 3rd storage month | 1.9 ± 0.1 | 2.8 ± 0.2 | 4.1 ± 0.7 | 7.5 ± 0.3 |
| 4th storage month | 1.4 ± 0.2 | 2.8 ± 0.1 | 4.0 ± 0.5 | 5.7 ± 0.1 |
| 5th storage month | 1.2 ± 0.5 | 1.6 ± 0.2 | 2.3 ± 0.5 | 3.4 ± 0.2 |
| 6th storage month | 0.7 ± 0.1 | 1.6 ± 0.1 | 1.9 ± 0.1 | 3.3 ± 0.1 |
| 7th storage month | 0.5 ± 0.1 | 1.3 ± 0.1 | 1.4 ± 0.1 | 1.6 ± 0.1 |
| 8th storage month | 0.4 ± 0.1 | 1.1 ± 0.1 | 1.3 ± 0.1 | 1.5 ± 0.3 |
| 9th storage month | 0 | 0 | 1.3 ± 0.2 | 1.6 ± 0.1 |
Publisher’s Note: MDPI stays neutral with regard to jurisdictional claims in published maps and institutional affiliations. |
© 2021 by the authors. Licensee MDPI, Basel, Switzerland. This article is an open access article distributed under the terms and conditions of the Creative Commons Attribution (CC BY) license (https://creativecommons.org/licenses/by/4.0/).
Share and Cite
La Torre, C.; Fazio, A.; Caputo, P.; Plastina, P.; Caroleo, M.C.; Cannataro, R.; Cione, E. Effects of Long-Term Storage on Radical Scavenging Properties and Phenolic Content of Kombucha from Black Tea. Molecules 2021, 26, 5474. https://doi.org/10.3390/molecules26185474
La Torre C, Fazio A, Caputo P, Plastina P, Caroleo MC, Cannataro R, Cione E. Effects of Long-Term Storage on Radical Scavenging Properties and Phenolic Content of Kombucha from Black Tea. Molecules. 2021; 26(18):5474. https://doi.org/10.3390/molecules26185474
Chicago/Turabian StyleLa Torre, Chiara, Alessia Fazio, Paolino Caputo, Pierluigi Plastina, Maria Cristina Caroleo, Roberto Cannataro, and Erika Cione. 2021. "Effects of Long-Term Storage on Radical Scavenging Properties and Phenolic Content of Kombucha from Black Tea" Molecules 26, no. 18: 5474. https://doi.org/10.3390/molecules26185474
APA StyleLa Torre, C., Fazio, A., Caputo, P., Plastina, P., Caroleo, M. C., Cannataro, R., & Cione, E. (2021). Effects of Long-Term Storage on Radical Scavenging Properties and Phenolic Content of Kombucha from Black Tea. Molecules, 26(18), 5474. https://doi.org/10.3390/molecules26185474