Article

Serum Proteomic Analysis of Cannabis Use Disorder in Male Patients

1
Department of Pharmacology and Toxicology, College of Pharmacy, King Saud University, Riyadh 11451, Saudi Arabia
2
Proteomics Resource Unit, Obesity Research Center, College of Medicine, King Saud University, Riyadh 11461, Saudi Arabia
3
Department of Medicine, College of Medicine, King Saud University, Riyadh 11461, Saudi Arabia
4
National Center for Biotechnology (NCB), Life Science and Environment Research Institute, King Abdulaziz City for Science and Technology (KACST), Riyadh 11442, Saudi Arabia
5
Department of Pharmacognosy, College of Pharmacy, King Saud University, Riyadh 11451, Saudi Arabia
*
Author to whom correspondence should be addressed.
These authors contributed equally to this work.
Molecules 2021, 26(17), 5311; https://doi.org/10.3390/molecules26175311
Submission received: 27 June 2021 / Revised: 24 August 2021 / Accepted: 25 August 2021 / Published: 1 September 2021
(This article belongs to the Special Issue High Times for Cannabinoid Research)

Abstract

:
Cannabis use has been growing recently and it is legally consumed in many countries. Cannabis has a variety of phytochemicals including cannabinoids, which might impair the peripheral systems responses affecting inflammatory and immunological pathways. However, the exact signaling pathways that induce these effects need further understanding. The objective of this study is to investigate the serum proteomic profiling in patients diagnosed with cannabis use disorder (CUD) as compared with healthy control subjects. The novelty of our study is to highlight the differentially changes proteins in the serum of CUD patients. Certain proteins can be targeted in the future to attenuate the toxicological effects of cannabis. Blood samples were collected from 20 male individuals: 10 healthy controls and 10 CUD patients. An untargeted proteomic technique employing two-dimensional difference in gel electrophoresis coupled with mass spectrometry was employed in this study to assess the differentially expressed proteins. The proteomic analysis identified a total of 121 proteins that showed significant changes in protein expression between CUD patients (experimental group) and healthy individuals (control group). For instance, the serum expression of inactive tyrosine protein kinase PEAK1 and tumor necrosis factor alpha-induced protein 3 were increased in CUD group. In contrast, the serum expression of transthyretin and serotransferrin were reduced in CUD group. Among these proteins, 55 proteins were significantly upregulated and 66 proteins significantly downregulated in CUD patients as compared with healthy control group. Ingenuity pathway analysis (IPA) found that these differentially expressed proteins are linked to p38MAPK, interleukin 12 complex, nuclear factor-κB, and other signaling pathways. Our work indicates that the differentially expressed serum proteins between CUD and control groups are correlated to liver X receptor/retinoid X receptor (RXR), farnesoid X receptor/RXR activation, and acute phase response signaling.

1. Introduction

Cannabis sativa L. and Cannabis indica L. contain a variety of secondary metabolites. Cannabis plants species differ based on many factors, including the quantity of cannabinoids. Some of them are psychoactive and induce hallucinating effects such as delta-9-tetrahydrocannabinol (THC) while the others are non-psychoactive such as cannabidiol (CBD) [1]. The complexity of cannabis makes its use censorious because cannabis users may develop unexpected side effects, including central nervous system (CNS) side effects due to certain chemical ingredients. Therefore, exposure to cannabis means that the users will expose to several cannabinoids (~60) that are associated with pharmacological effects. In addition, the duration of exposure is a critical factor that significantly affects the quantity of these cannabinoids in the body.
Despite the presence of multiple compounds, cannabinoids family are the most abundant phytochemicals present in the cannabis plants [1]. Psychoactive effects resulted from cannabis exposure have been linked to THC [2]. This compound can modulate the processing of visual and auditory hallucination effects [3]. However, regulatory agencies have approved few cannabinoids to be used for certain indications. For instance, the U.S. Food and Drug Administration (FDA) has approved products containing CBD for seizures associated with Dravet syndrome and Lennox–Gastaut syndrome in one-year-old and older patients reported previously in clinical studies [4,5]. Moreover, FDA-approved synthetic products containing THC for the treatment of vomiting and nausea caused by chemotherapy treatments in patients who lack the response to conventional antiemetic treatments [6]. In addition, they can be prescribed to manage anorexia-associated with weight loss in patients diagnosed with acquired immunodeficiency syndrome [7].
Cannabis use disorder (CUD) is widespread across numerous countries [8]. The hallucination effects of cannabis use leads to drug abuse [9]. Governments and regulatory agencies set guidelines and policies to minimize the undesirable effects of cannabis [10,11]. As some countries have legalized the use of marijuana, smoking products containing marijuana are legally marketed nowadays.
Studies have documented toxicological effects in different models exposed to cannabis ingredients [12,13,14,15,16]. A recent study reported that high-grade atrioventricular block was developed in a young male following chronic exposure to marijuana [14]. Moreover, a recent case series study concluded that vaping cannabis oil was associated with acute respiratory depression [15]. It is important to consider that tachycardia and neurotoxicity were reported after acute inhalation of cannabis in humans [16]. Fivefold increase in blood carboxyhemoglobin levels were found in subjects who smoked marijuana for at least five years as compared with those who smoke tobacco cigarettes [13]. This study also noted that the burden of tar and carbon monoxide in the respiratory system has increased in marijuana smokers as compared with those who smoked a similar quantity of tobacco. On the other hand, CBD showed the ability to regulate immunological responses using in vivo and in vitro assays [17]. Moreover, CBD exhibits antioxidant and anti-inflammatory properties [18,19,20]. These anti-inflammatory effects were also found in non-psychoactive cannabinoids [20].
Several reports have determined the serum proteomic profiling of humans exposed to amphetamine analogs [21,22]. A recent study from our group identified differentially expressed proteins in the serum of individuals with amphetamine use disorder compared with a healthy control group [23]. Moreover, prior clinical proteomic studies utilized serum samples to determine the levels of proteins in patients who had developed neurodegenerative diseases [24,25], neurodevelopmental disorders [26,27,28], major depressive disorder, and bipolar disorders [29,30]. In the present study, we investigate the expression changes of CUD patients’ serum proteins compared with healthy controls, using an untargeted proteomic approach employing two-dimensional (2D) alteration in gel electrophoresis (2D-DIGE) coupled with mass spectroscopy (MS).

2. Results

2.1. Demographic Information

Demographic and clinical information of all participants included in our study has been collected. This information includes marital and employment status, age, gender, history of cannabis use disorder, and route of cannabis administration (Table 1).

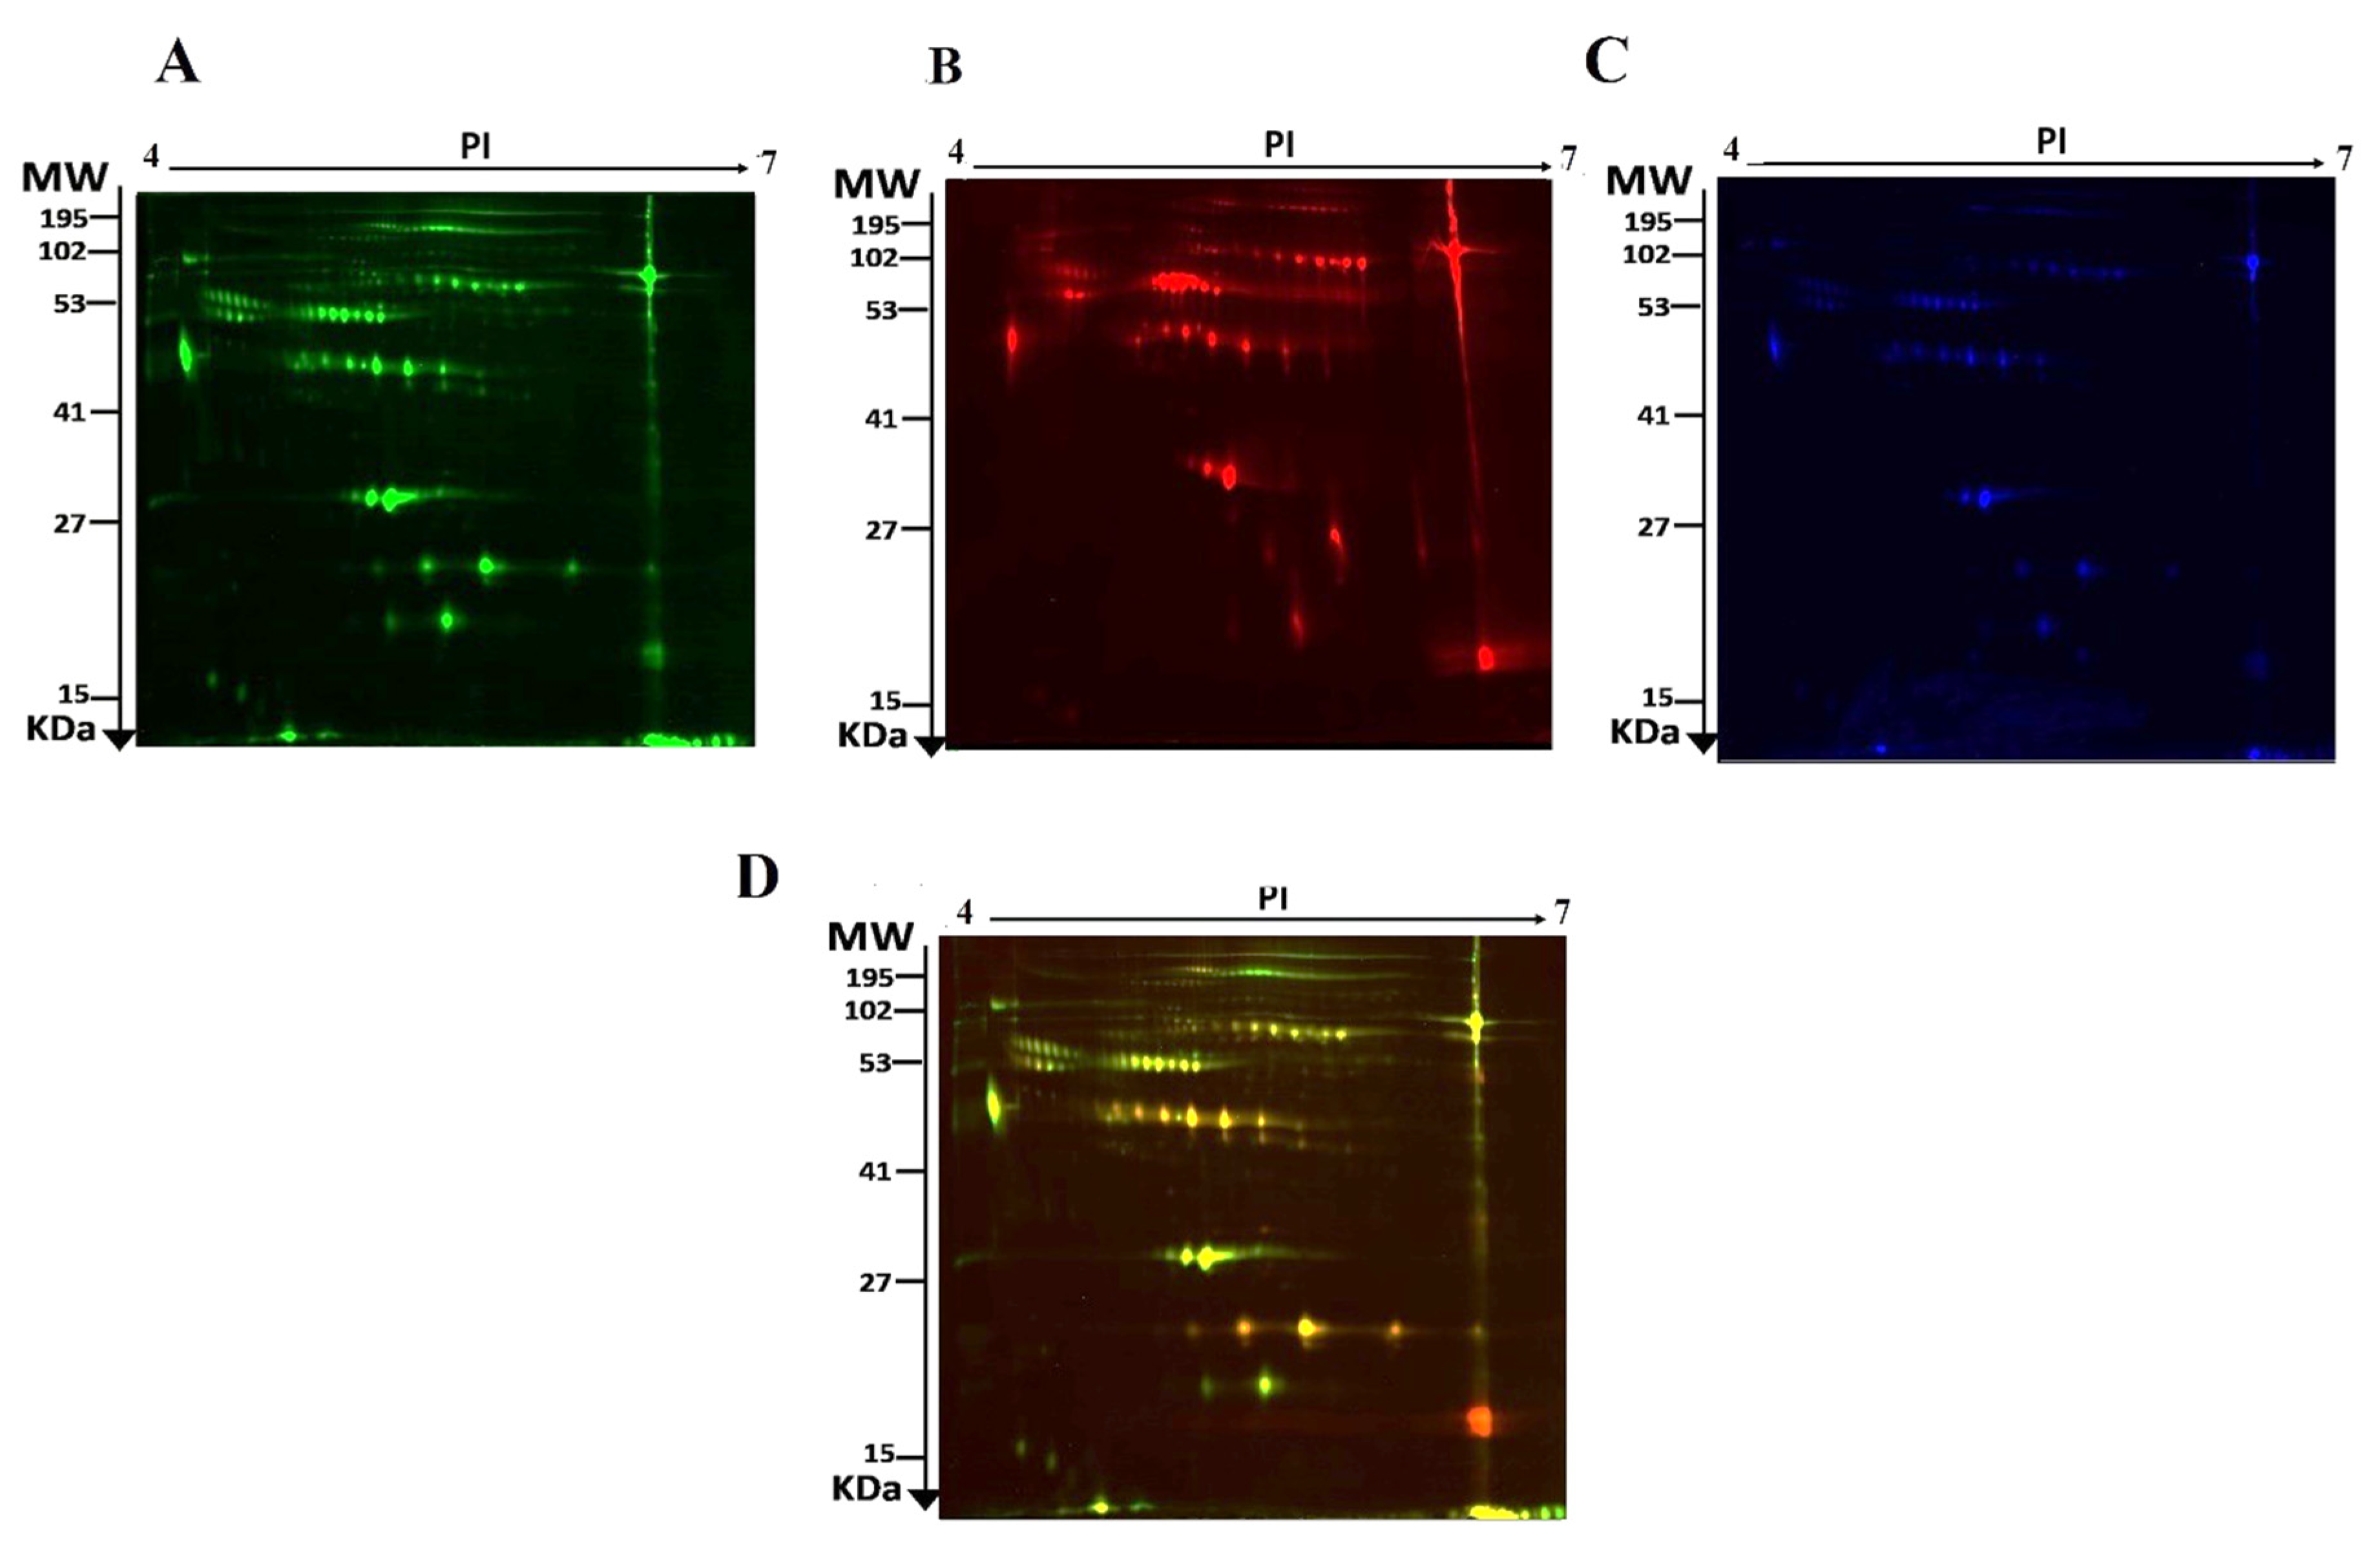
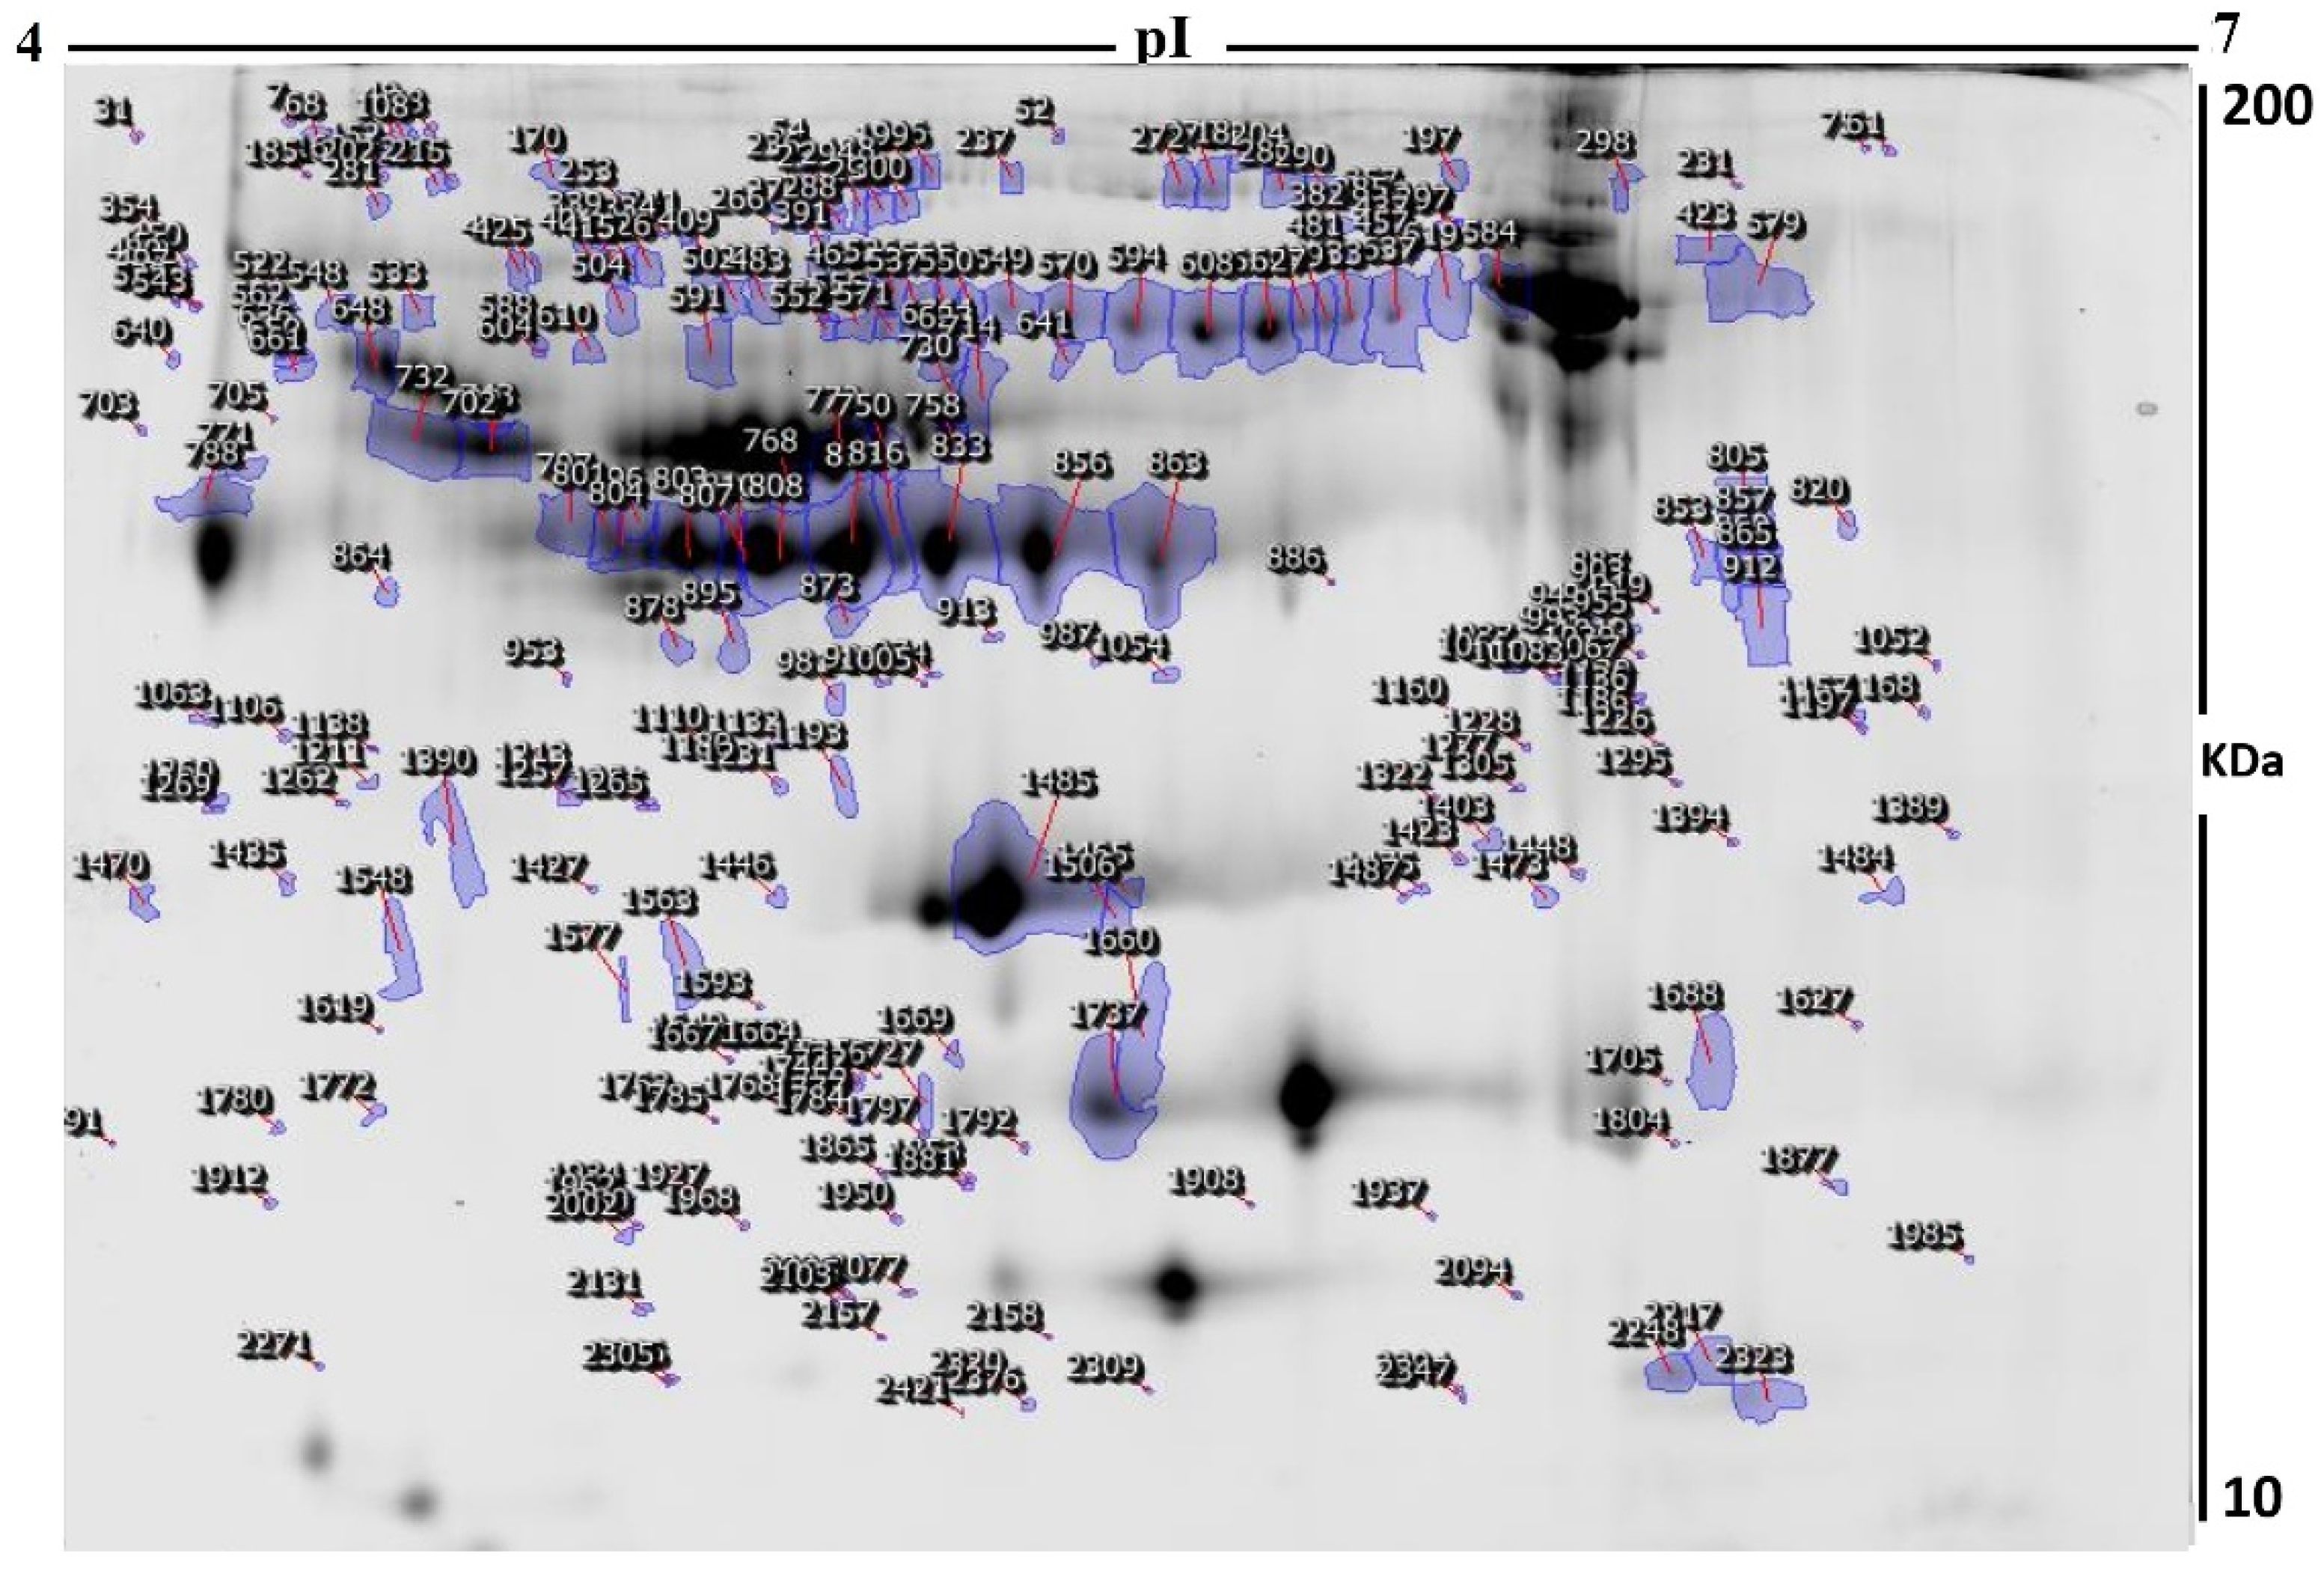
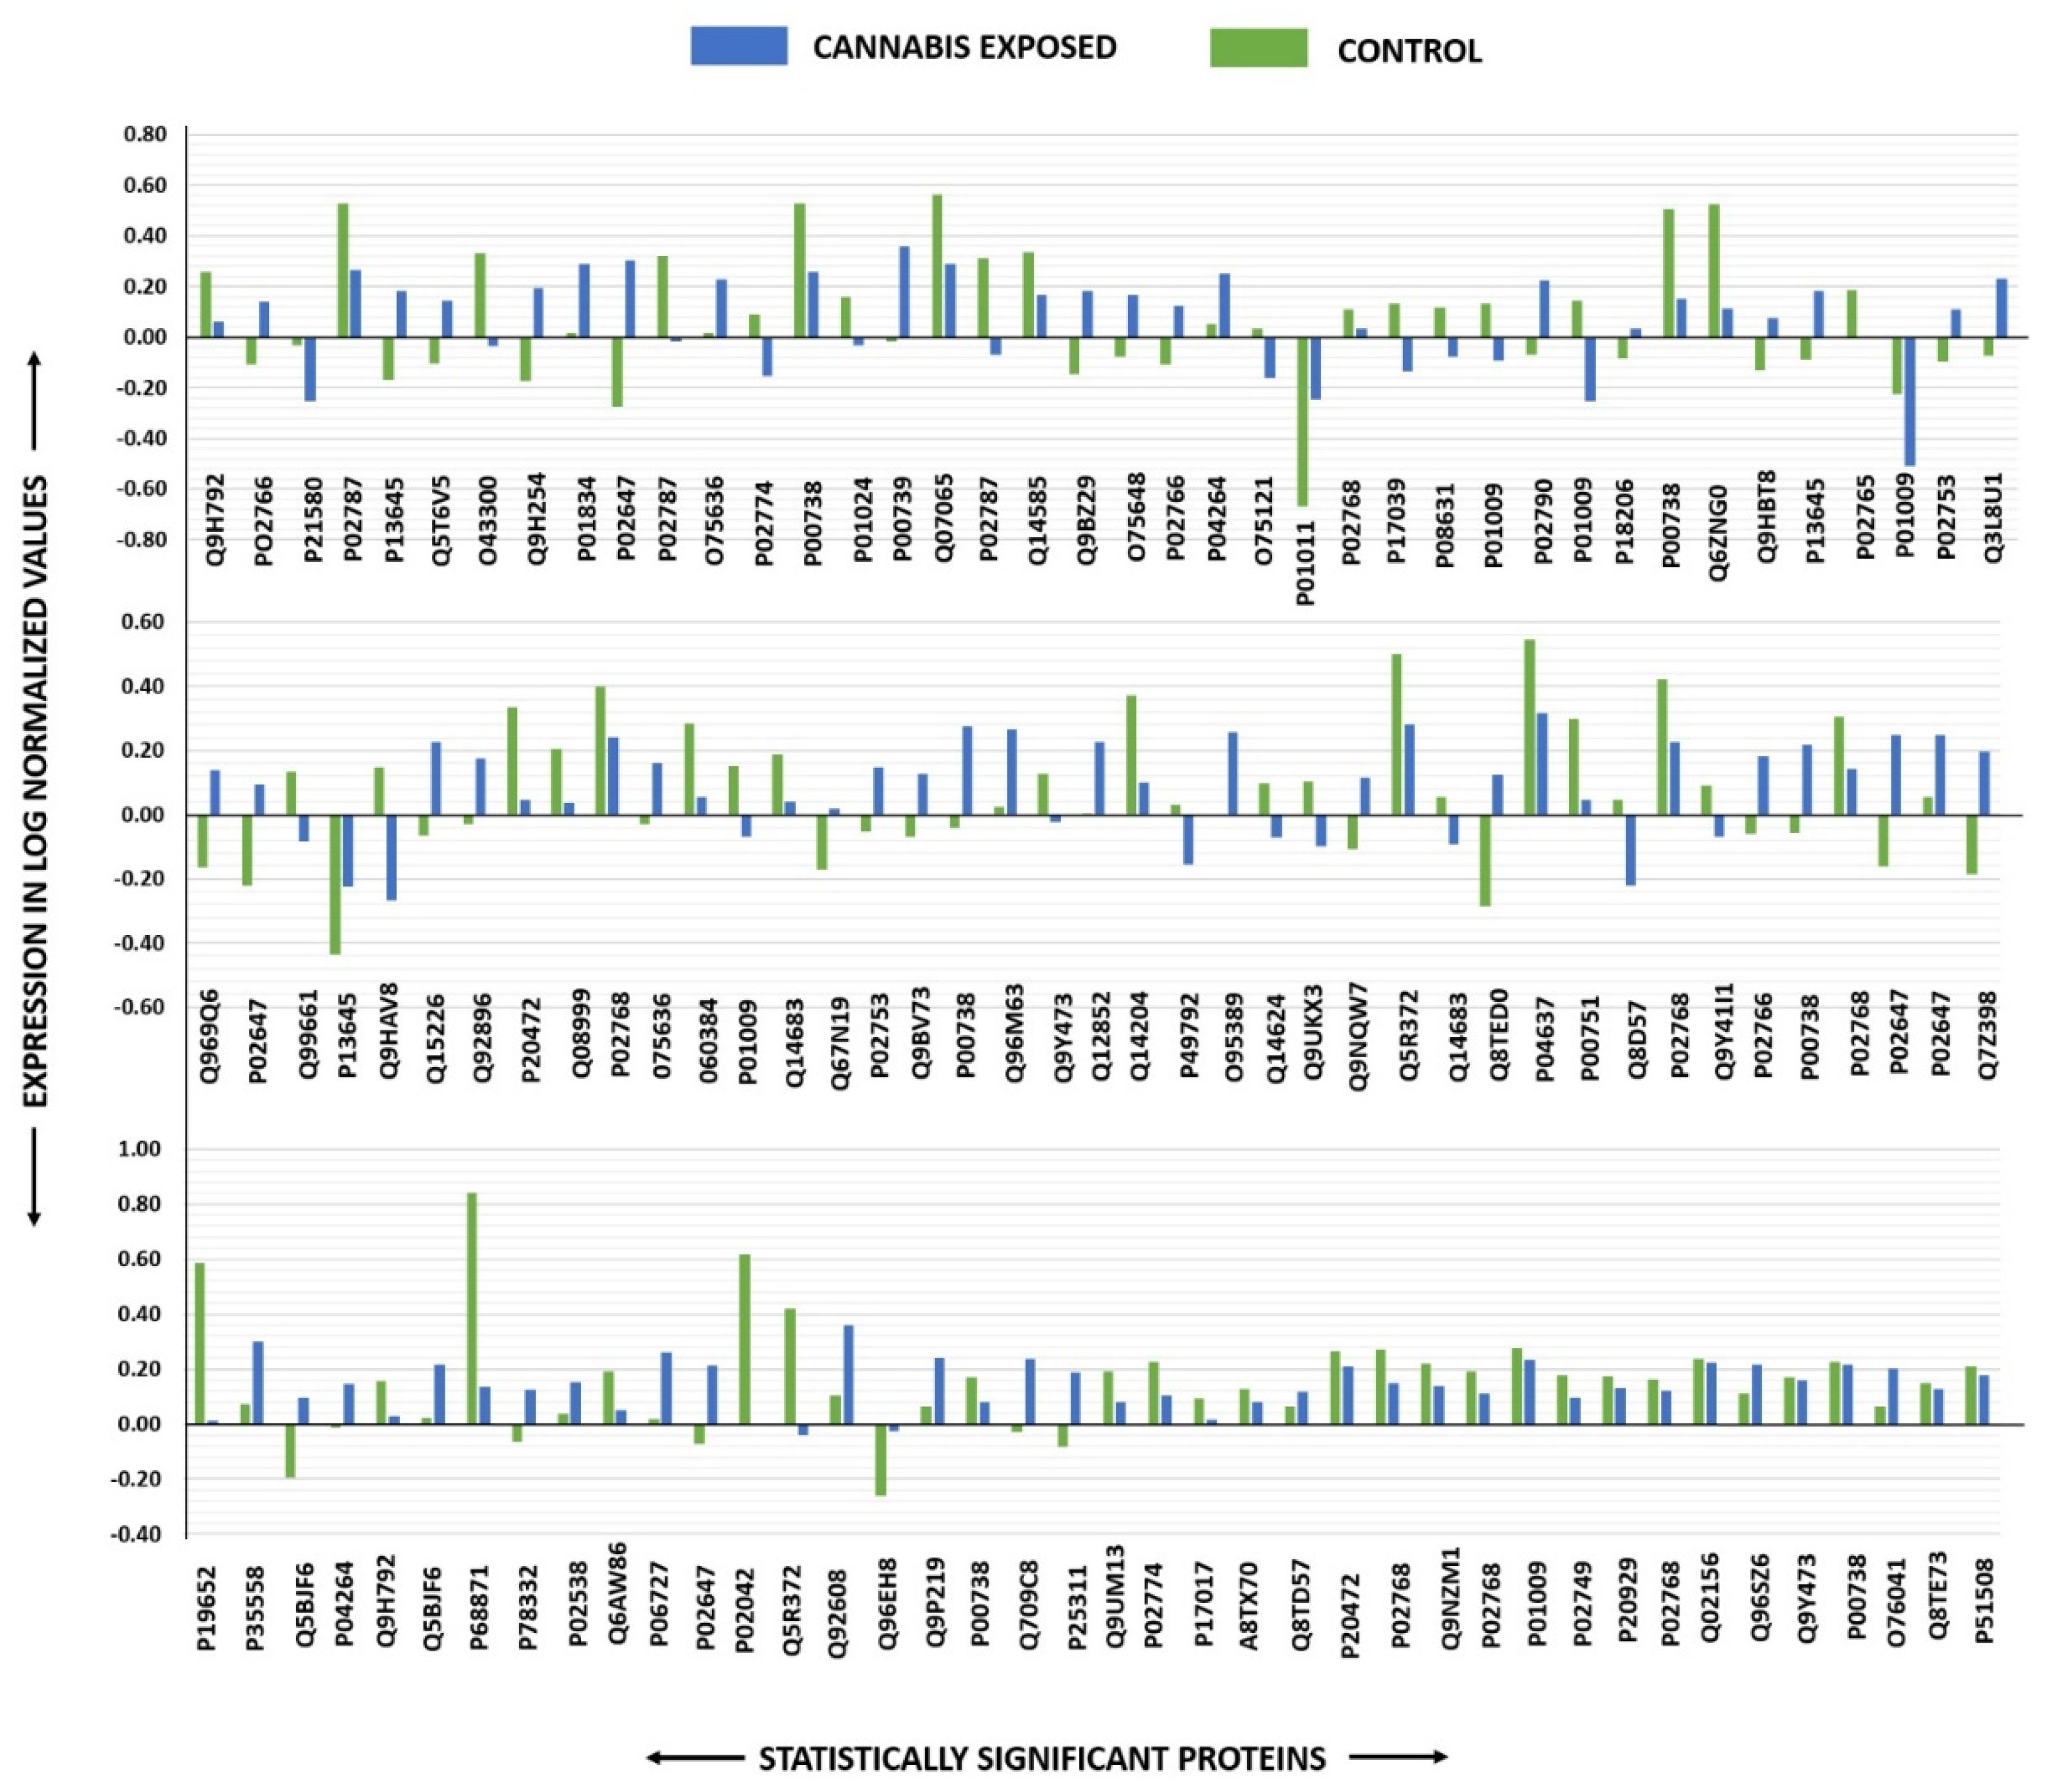
2.2. Identification of Differentially Expressed Proteins and 2D-DIGE Analysis

The current study assessed the difference in protein expression among 10 cannabis-exposed individuals and 10 controls (20 samples from 10 gels) using 2D-DIGE analysis technique before statistical analysis is performed with Progenesis software. Fluorescent protein profiles of a 2D-DIGE of control samples labelled with Cy3 are presented in Figure 1A. The CUD samples were labeled with Cy5 (Figure 1B), pooled internal control labeled with Cy2 (Figure 1C), and overlap of 2D-DIGE gels of samples labeled with Cy3/Cy5 (Figure 1D). A total of 1700 spots were identified on the gels, 156 were significantly different (ANOVA, p ≤ 0.05; fold-change ≥ 1.5) between the CUD and control groups (Figure 2). For alignment and further analysis, the spot patterns were reproducible across all 10 gels. The internal standard Cy2-labeled was included to perform normalization among the whole gels set in addition to the quantitative of the protein levels differential analysis. A total of 156 spots displayed a statistical significance among the two groups. These spots were manually excised from the preparative gel and underwent protein identification using MS.
Peptide mass fingerprints (PMFs) identified 121 out of 156 protein spots that were excised from preparative gel, MALDI-TOF. MS found 85 spots to be unique protein sequences. These sequences were matched to the SWISS-PROT database by Mascot search engine with high confidence scores (Table 2, Supplementary Table S2). The sequence coverage ranged from 4% to 85%. In few cases, the same protein variants were found at several locations on the gel (Table 2, Figure 2). Among the 121 proteins identified, 55 were upregulated and 66 were downregulated in the samples of CUD patients compared with that in the control subjects (Table 2, Figure 3). The significantly upregulated proteins included Apolipoprotein A-I (up 3.8-fold, p = 0.01), Alpha-1-antichymotrypsin (up 2.7-fold, p = 0.02), U3 small nucleolar RNA-associated protein 15 homolog (up 2.6-fold, p = 0.03), Zinc finger protein 550 (up 2.4-fold, p = 0.04), Haptoglobin-related protein (up 2.4-fold, p = 0.01), Spectrin beta chain, non-erythrocytic 4 (up 2.3-fold, p = 0.01), Keratin, type I cytoskeletal 10 (up 2.2-fold, p = 0.007), Dedicator of cytokinesis protein 9 (up 2.1-fold, p = 0.02), Haptoglobin (up 2.4-fold, p = 0.01), and Serine/threonine-protein phosphatase 2A regulatory subunit B’’ subunit gamma (up 2.0 fold, p = 0.05); a complete list is provided in Table 2. By contrast, the significantly downregulated proteins in CUD subjects included Hemoglobin subunit beta (down 5.0-fold, p = 0.05), Alpha-1-acid glycoprotein 2 (down 3.7-fold, p = 0.04), Rab GTPase-activating protein 1-like (down 2.9-fold, p = 0.02), and Ubiquitin domain-containing protein 1 (down 2.6-fold, p = 0.04) (Table 2, Supplementary Table S2). Among identified proteins: Inactive tyrosine protein kinase PEAK1, Transthyretin; Serotransferrin; Keratin, type I cytoskeletal 10; Apolipoprotein A-I; Ficolin-3; Vitamin D-binding protein; Haptoglobin; Keratin, type II cytoskeletal 1; Albumin; Alpha-1-antitrypsin; Retinol-binding protein 4, Outer dense fiber protein 2; Dynein heavy chain 3, axonemal; Parvalbumin alpha; Rab GTPase-activating protein 1-like; Structural maintenance of chromosomes protein 1A and Zinc finger protein 175 were found in ≥1 spot on the gels, which could be explained by post-translational modifications, cleavage by enzymes, or different protein species presence.

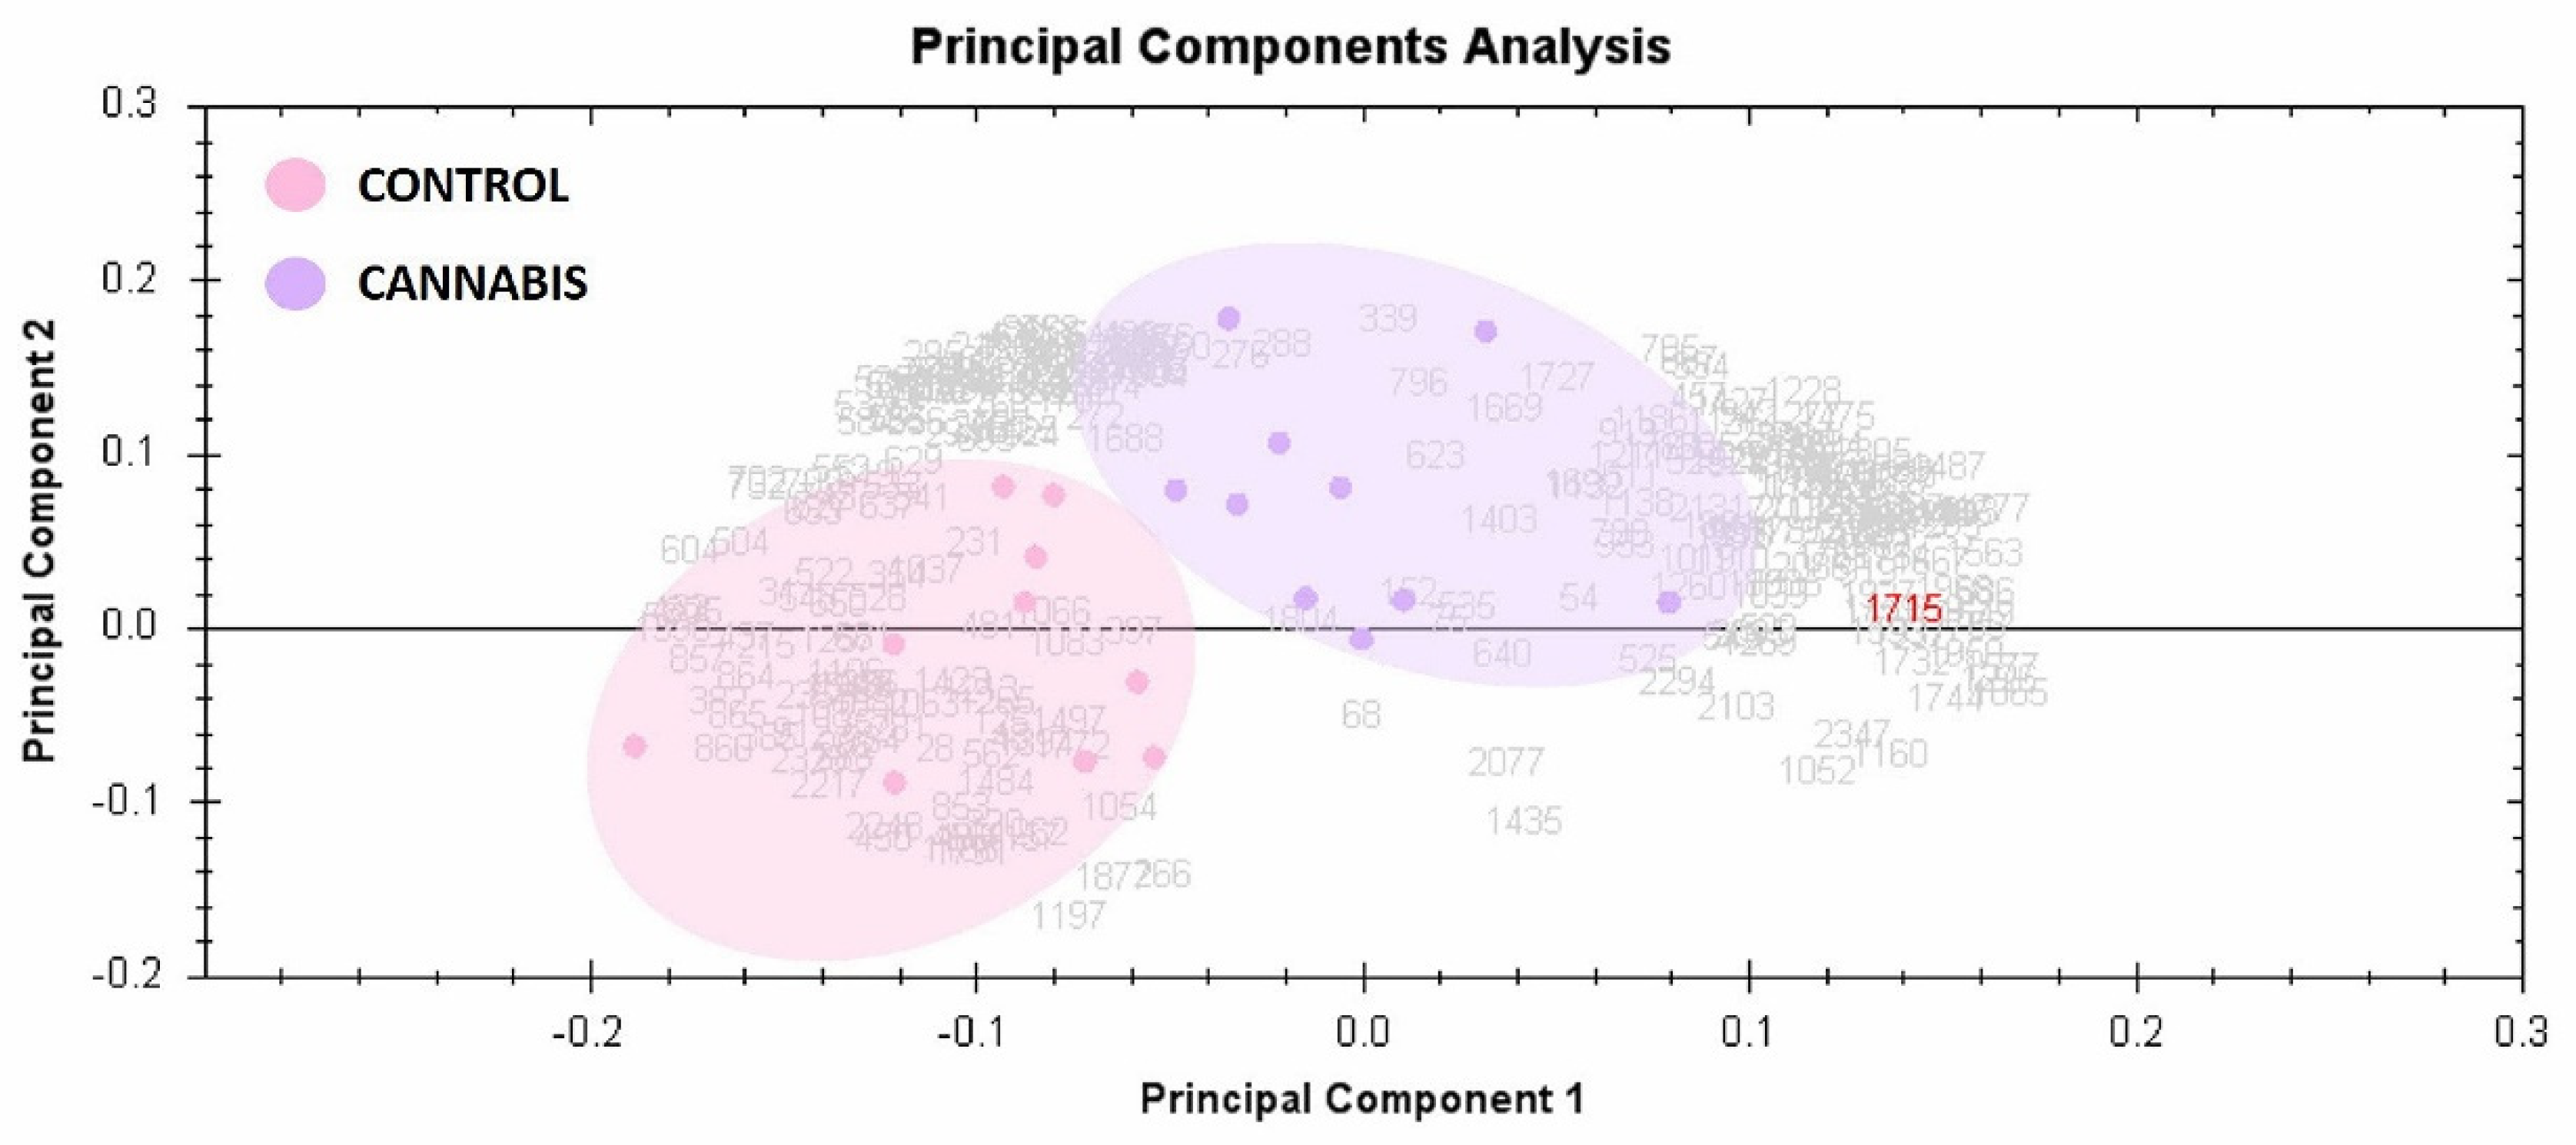
2.3. Principal Component Analysis

To determine and visualize the CUD and control subjects’ samples, the principal component analysis of the Progenesis SameSpots software was used. The analysis was made on all 121 spots that exhibited statistically significant changes in abundance identified by MS. The analysis shows that the two groups clustered distinctly based on different proteins with score of 64% (Figure 4).

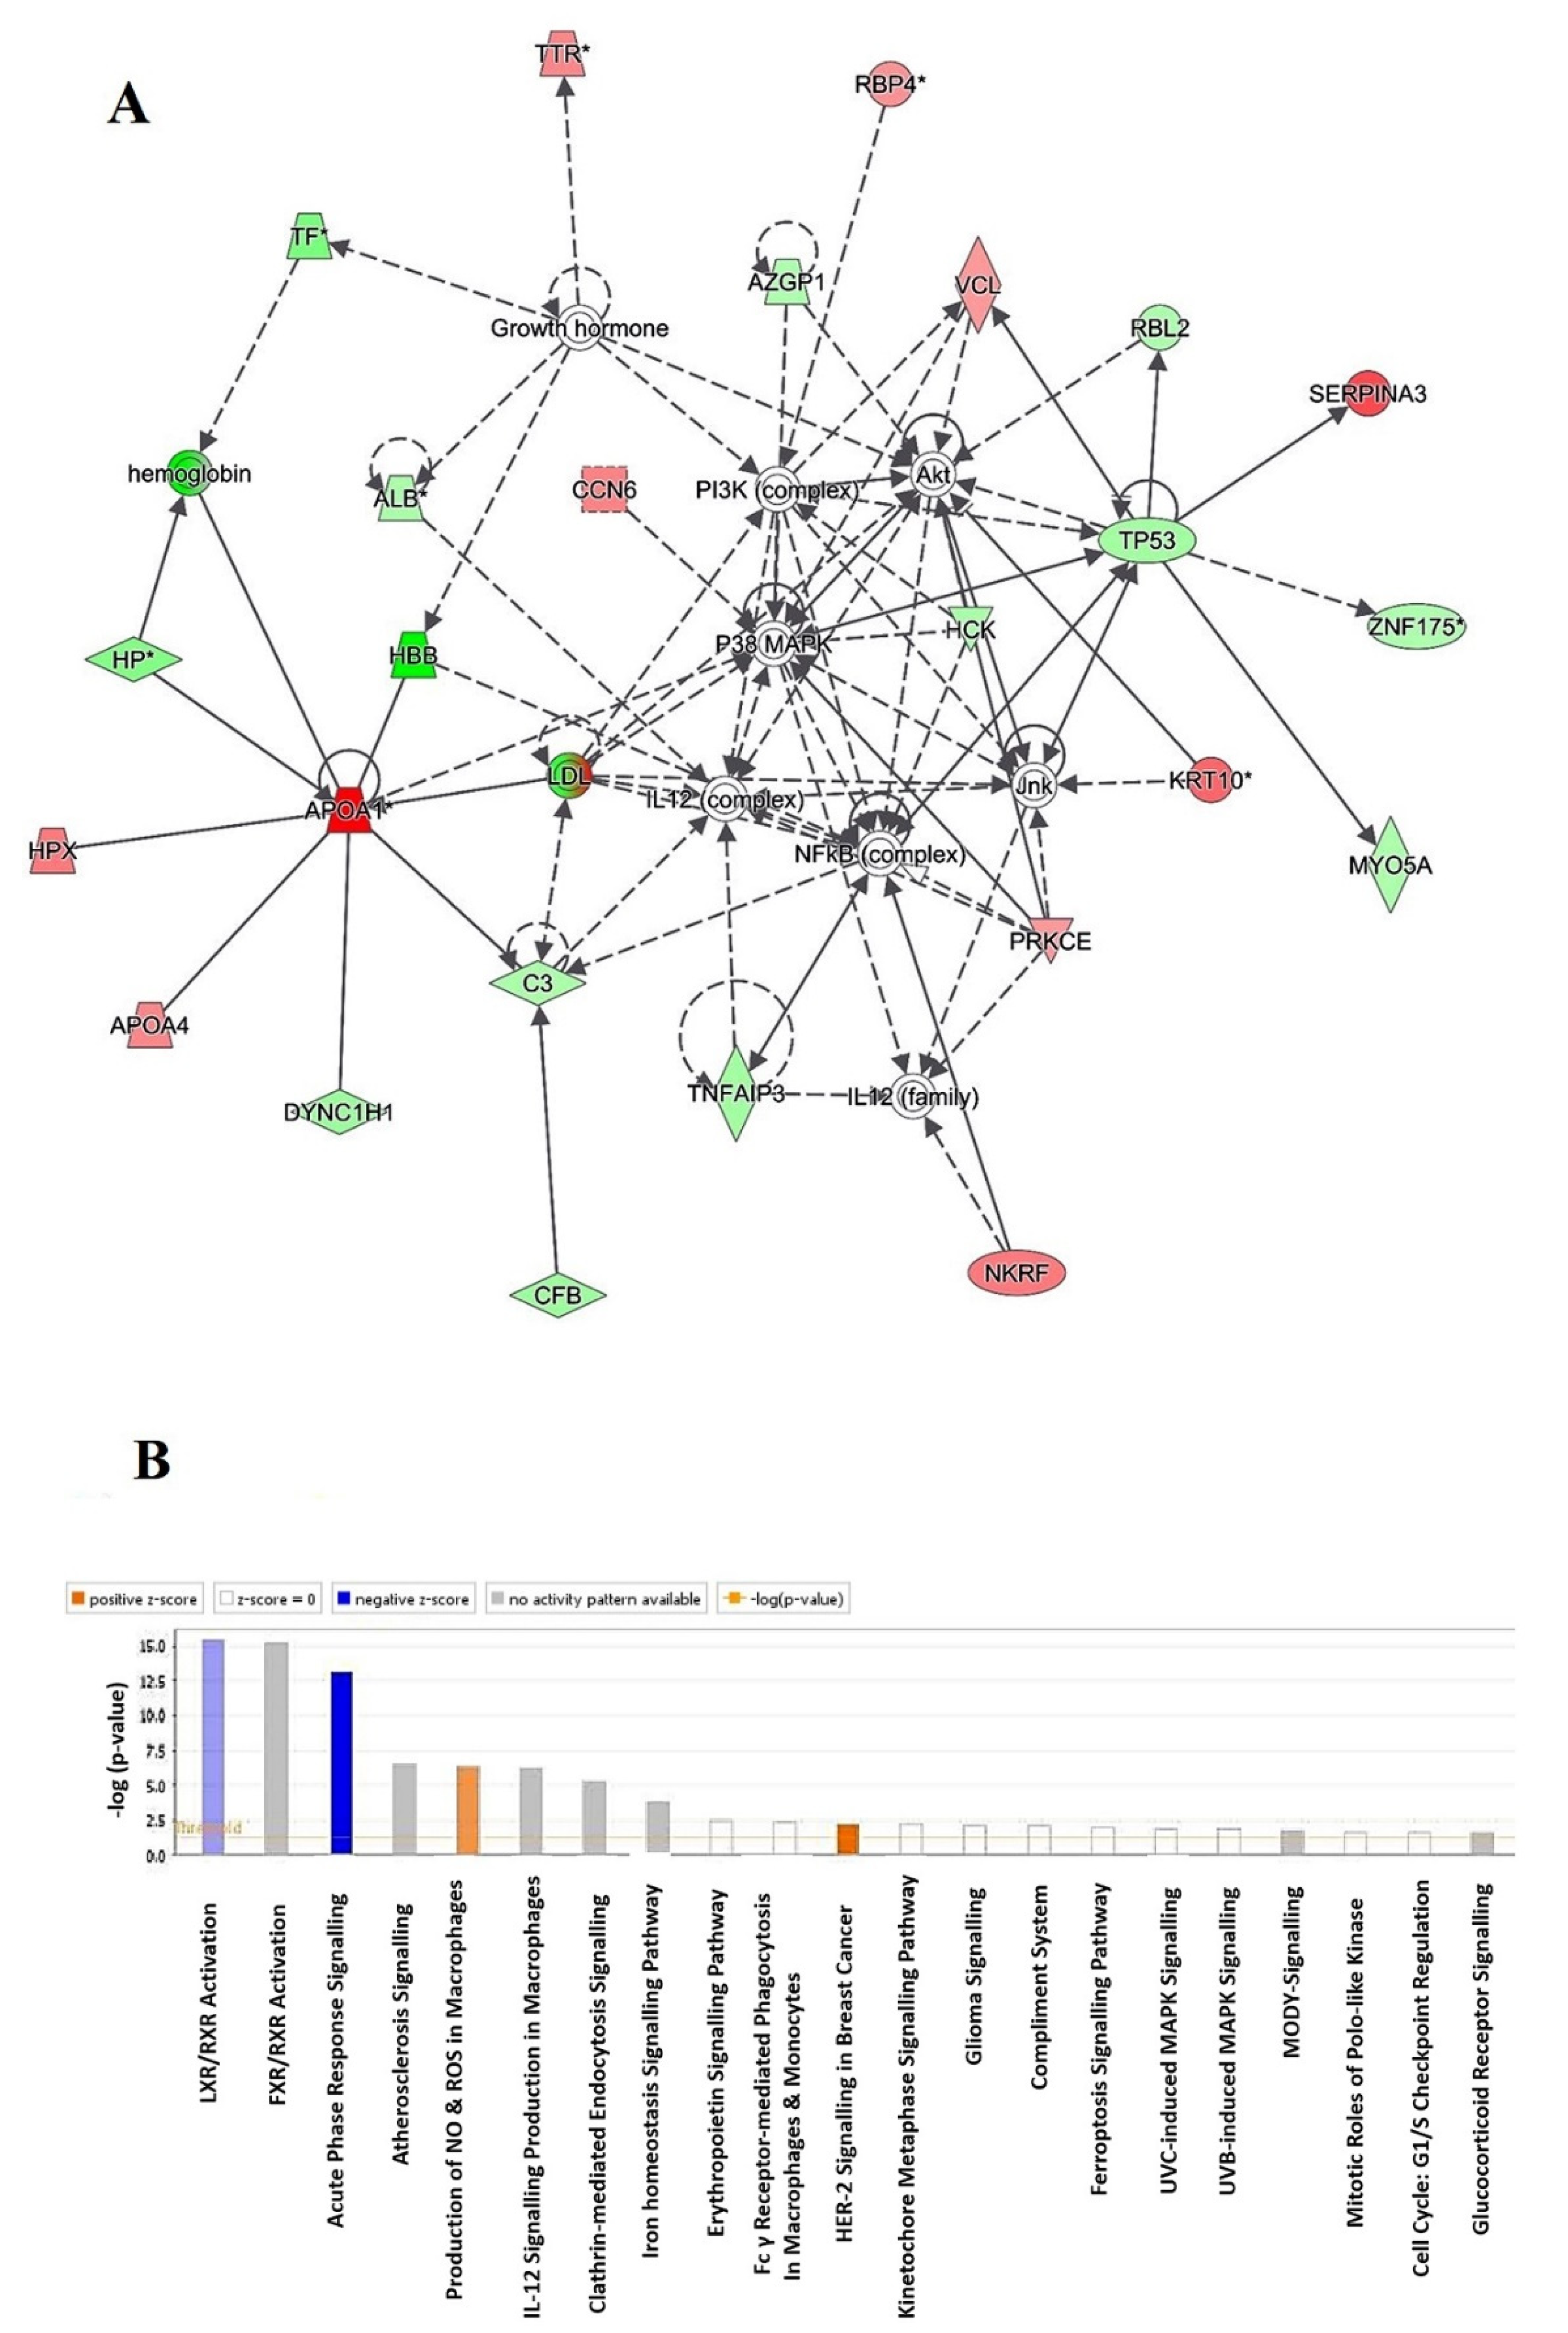
2.4. Protein–Protein Interaction Networks

Using Ingenuity Pathway Analysis (IPA), the protein–protein interaction analysis was completed for all 121 regulated proteins. The analysis demonstrated that 35 proteins interacted directly/indirectly via protein networks (Figure 5A). The software calculates the best fit score obtained from the input data set of proteins and the biological functions database in order to generate a protein–protein interactions network. The generated network is favorably enriched for proteins with extensive and specific interactions. The interacting proteins are characterized as nodes and their biological relationships as a line. Based on the resulted data, four interaction networks were recognized for the proteins exhibiting variance expression profiles. The highest scoring network (score = 52) (Figure 5, Supplementary Figure S1) incorporated 25 proteins. The proposed highest interaction network pathway was related to free radical scavenging, cellular compromise, and inflammatory response. Alone the top pathways are presented (Figure 5A). Canonical pathways that enriched in current dataset are presented in Figure 5B. The canonical pathways are sorted down to decreasing log (p-value) of enrichment. The most interesting enriched canonical pathways included liver X receptors/retinoid X receptor (LXR/RXR) activation (11% overlap, p-value: 3.7 × 10⁻¹⁶), farnesoid X receptors/retinoid X receptor activation (10.7% overlap, p-value: 5.78 × 10⁻¹⁶), acute phase response signaling (7.4% overlap, p-value: 7.15 × 10⁻¹⁴), atherosclerosis signaling (5.6% overlap, p-value: 3.87 × 10⁻⁷), and production of nitric oxide (NO) and reactive oxygen species (ROS) in macrophages (4.3% overlap, p-value: 4.24 × 10⁻⁷). More details about the identified canonical pathways are shown in supplementary files (Supplementary Figure S1).

2.5. Subcellular and Functional Characterization of the Differentially Expressed Proteins

Following MS analysis, all 121 identified proteins between the CUD and control samples were subjected to the PANTHER classification system (http://www.pantherdb.org, accessed on 1 February 2021). The classification was performed according to their molecular function (Figure 6A), biological process (Figure 6B), and cellular component (Figure 6C). The main functional categories recognized were binding proteins (47%), catalytic activity (30%), and molecular function regulatory proteins (21%). Further, the identified proteins were located in the organelle region (35%), extracellular space (24%), followed by cytoplasmic and cytoskeletal regions, and each of these two account for (19%). The majority of the identified protein was involved in cellular process, metabolic process and biological regulations.

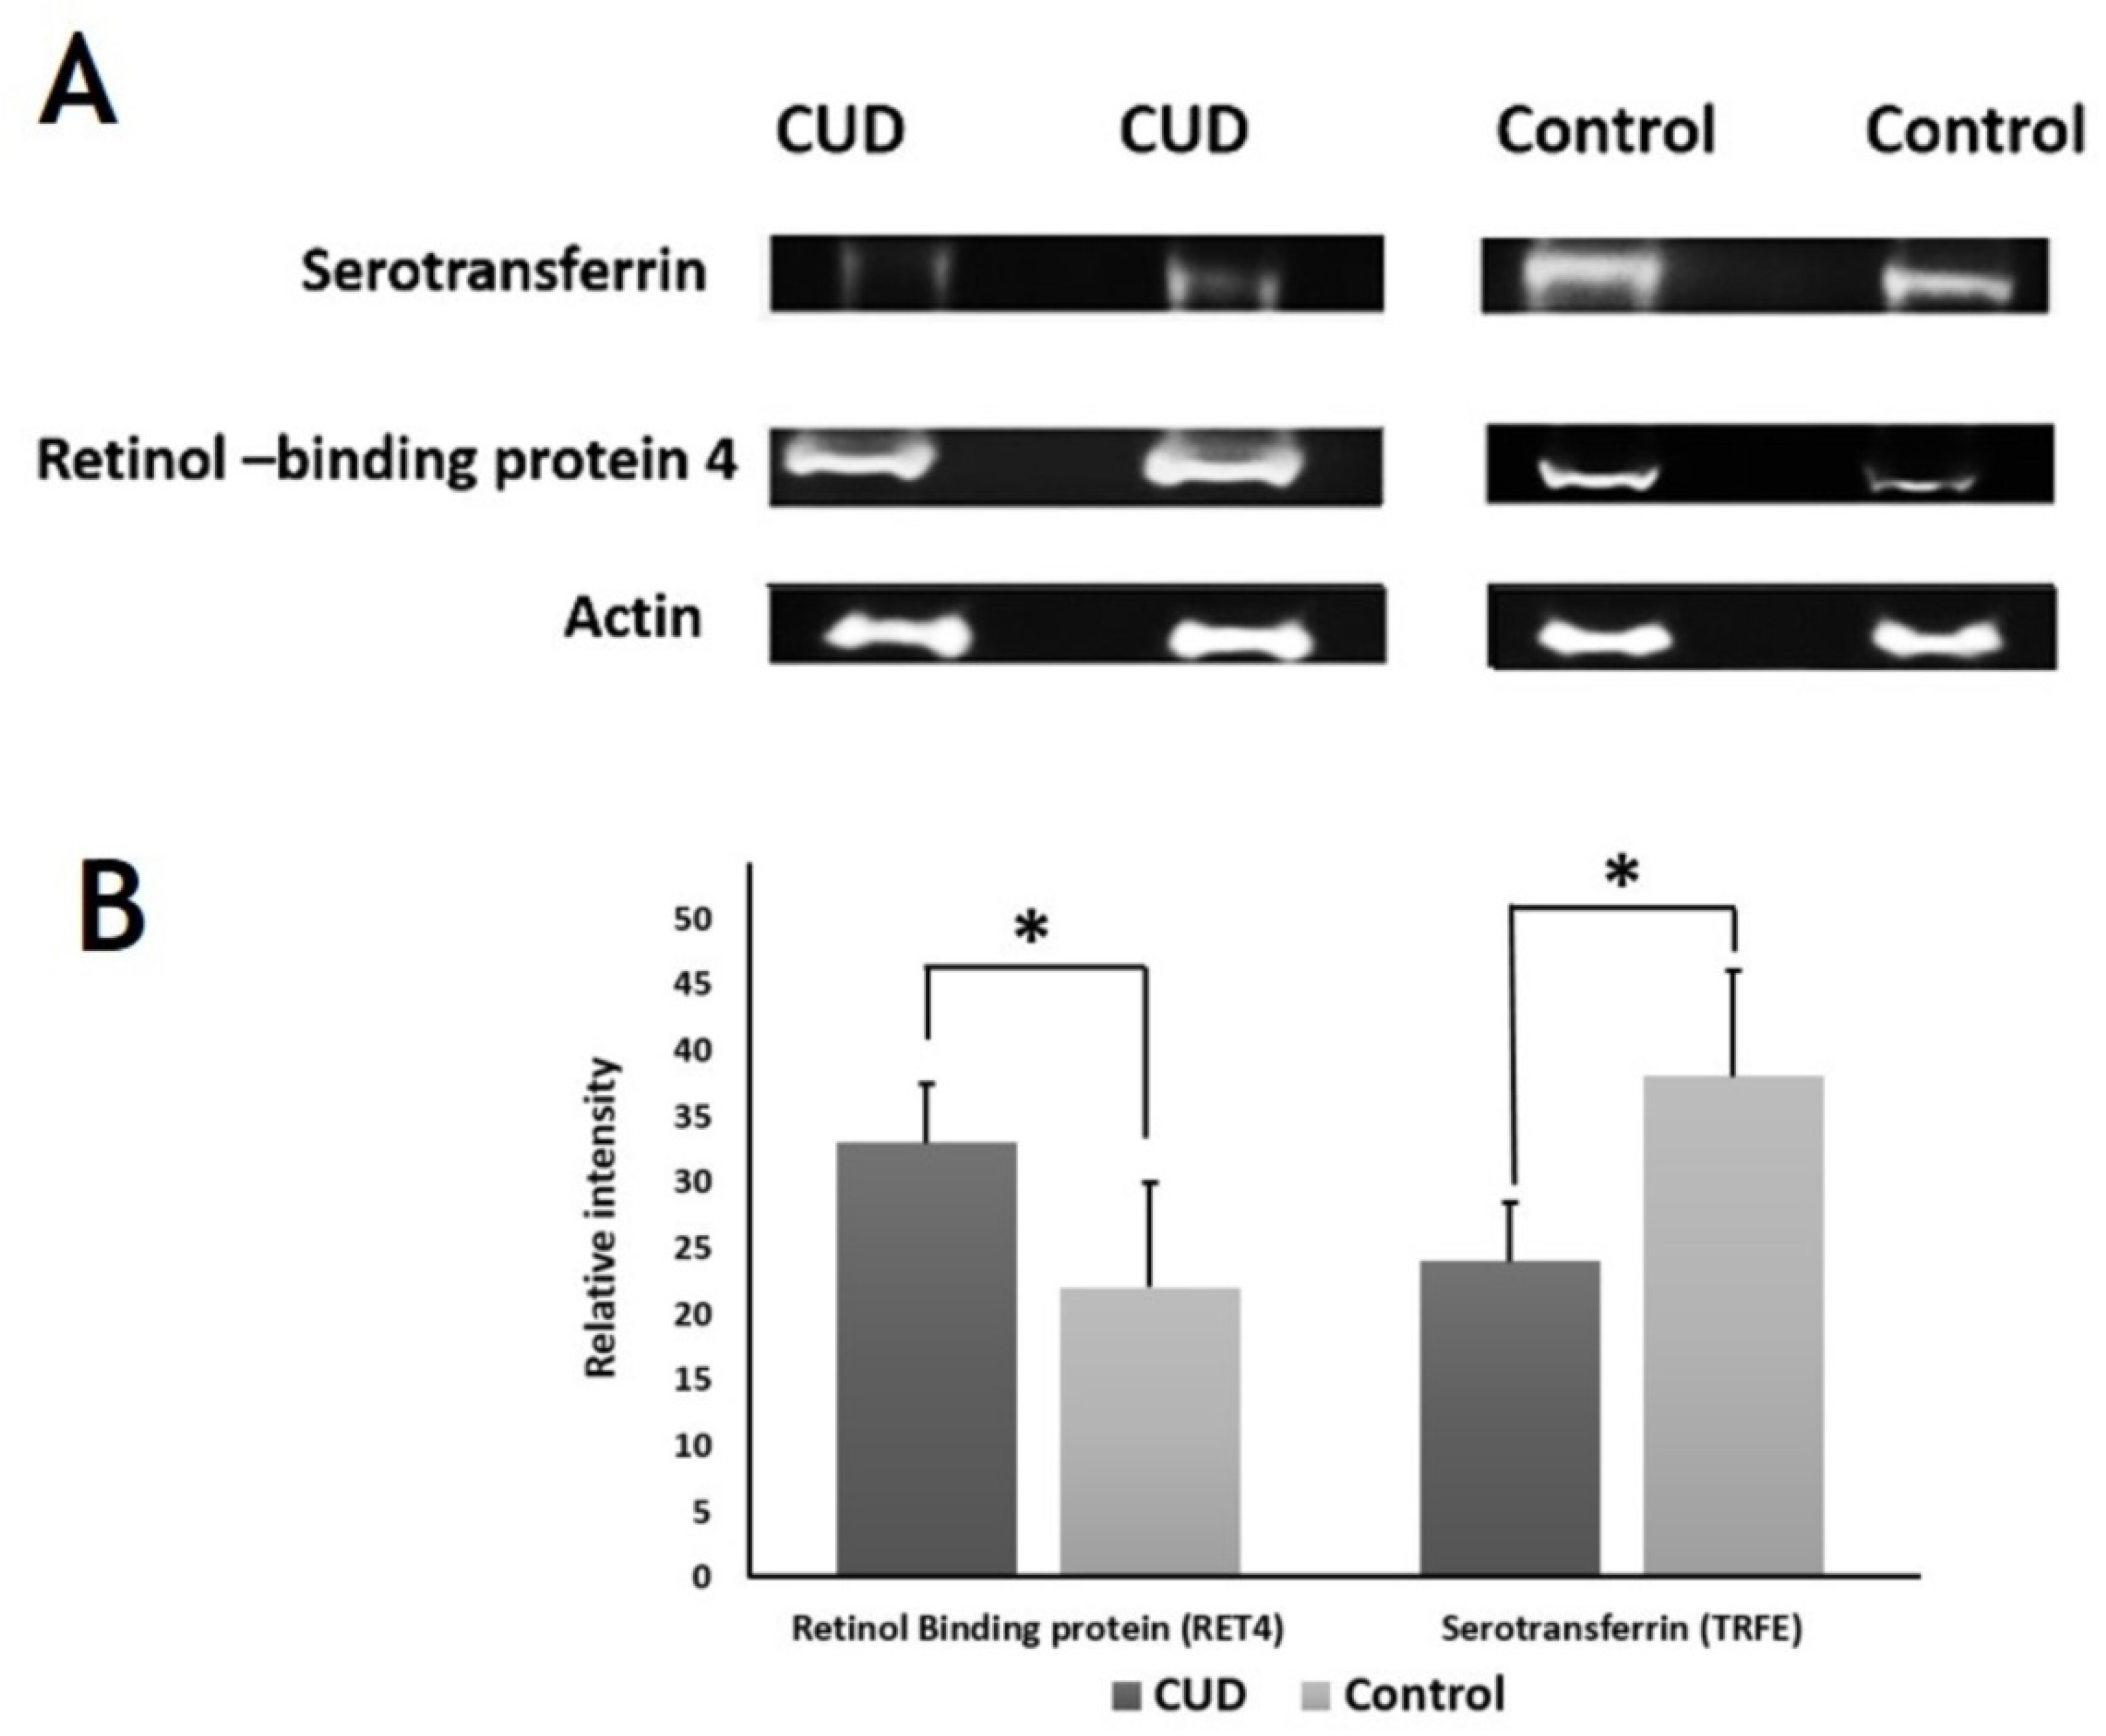
2.6. Immunoblotting Confirmation of Changes in Selected Proteins

Immunoblot assay confirmed the expression of the selected proteins that were differentially abundant by 2D-DIGE analysis (Figure 7). The proteins selected for confirmation were serotransferrin and retinol-binding protein 4. Immunoblots revealed that the serum protein expression of serotransferrin and retinol-binding protein 4 were decreased and increased, respectively, in CUD group as compared with control group (p ≤ 0.05). To normalize the immunoblot data, β-actin was used in the present study as a housekeeping protein (Figure 7A,B).

3. Discussion

3.1. Ingenuity Pathway Analysis

3.1.1. LXR/RXR Activation

IPA analysis showed that LXR/RXR is activated in humans chronically exposed to cannabis. Our prior proteomic study showed that LXR/RXR activation is observed in humans exposed to amphetamine for chronic period of time [23]. This indicates that LXR/RXR activation is highly sensitive following exposure to amphetamine and cannabinoids. A microarray study performed IPA analysis showing that THC could induce alterations on the genes, including the LXR/RXR gene, highly affected by lipopolysaccharide in BV-2 microglia cells [31]. This may suggest that LXR/RXR is highly sensitive to THC. Importantly, LXR/RXR activation is linked to signaling pathways, including apolipoproteins such as apolipoprotein AI, for cholesterol metabolism [32]. In the present study, we reported that the serum expression of apolipoprotein AI was increased in patients diagnosed with CUD as compared to healthy control group. This suggests that cannabis-modulated apolipoprotein AI and LXR/RXR may be involved in the metabolism of cholesterol. In addition, LXR activation plays a crucial role in the inhibition of inflammatory responses [33], indicating that LXR/RXR is one of the pathways mediated by cannabinoids to inhibit the formation of inflammatory reactions. For instance, LXR/RXR, PPARα/RXRα, and STAT3 signaling pathways are essential pathways to inhibit the inflammatory reactions [34]. A prior study demonstrated that LXR could play a significant role in induction protective effects against immunological responses-induced by Mycobacterium tuberculosis in mice [35]. Therefore, LXR/RXR activation is an efficient therapeutic target to modulate cholesterol metabolism, transport and absorption, inflammatory responses, and immunological reactions. Studies are warranted to explore the beneficial effects of targeting LXR/RXR by cannabinoids to modulate the inflammation, immunological reactions, and cholesterol transport. Further research may investigate the effects of cannabinoids on the diseases through acting on LXR/RXR.

3.1.2. FXR/RXR Activation

IPA analysis showed that FXR/RXR is activated in humans chronically exposed to cannabis. This is in agreement with our previous work showing that FXR/RXR activation is documented in patients diagnosed with amphetamine use disorder [23]. Therefore, FXR/RXR activation can play a critical role in the toxicological effects of abused drugs such as amphetamine and cannabis. The FXR is a bile acid binding site and has a role in the metabolism of lipids and glucose [36]. Our findings reported upregulatory effects on the serum expression of apolipoprotein AI in CUD patients as compared to healthy control group. A previous work highlighted that FXR activation might be a potential strategy for the treatment of hypertriglyceridemia and type 2 diabetes mellitus (T2DM) [37]. This study demonstrated that activation of FXR was associated with reduce plasma concentrations of triglyceride, fasting glucose, and insulin in T2DM rat models. In addition, treatment with a FXR agonist, chenodeoxycholic acid, could reverse the reduction of FXR expression in the liver of T2DM rat models. These findings were supported by another study reporting that hyperlipidemia and hyperglycemia were improved following activation of FXR in diabetic mice models [38]. It is highly recommended to explore the role of cannabinoids on modulating hyperglycemia and hyperlipidemia through modulating FXR/RXR pathways in humans. Further work should study the effects of cannabinoids on the diseases through acting on FXR/RXR.

3.1.3. Acute Phase Response Signaling

In our IPA analysis, we found that acute phase response signaling is stimulated in cannabis users. The acute phase proteins, including haptoglobin, alpha-1-antitrypsin, and complement factors, are proteins that are changed in response to the inflammatory cytokines [39,40]. Acute phase responses are correlated to various diseases, including immunological diseases [41]. The acute phase response signaling was the most interesting enriched canonical pathway involved in patients with amphetamine use disorder as shown in our previous proteomic study [23]. Interestingly, THC exposure was found to increase the mortality in mice infected with Legionella pneumophila at least in part by altering the acute phase responses of proinflammatory cytokines, an effect was not observed with cannabinol and cannabidiol as well as a synthetic cannabinoid, CP 55,940 [42]. This suggests that psychoactive cannabinoids might be more likely to modulate the acute phase responses of inflammatory biomarkers. However, cannabidiol and its synthetic analogs have been reported to exert anti-inflammatory and antioxidant effects [18]. CBD is a negative allosteric modulator of cannabinoid receptor 1 (CB1) [43]; moreover, CBD was reported to behave inverse agonist properties to CB2 receptor indicating that CBD-mediated anti-inflammatory effects through modulating CB1 and 2 receptors [44]. The anti-inflammatory properties were also documented with psychoactive cannabinoids [20]. Therefore, it is critical to elucidate the role of psychoactive and non-psychoactive compounds in modulating acute phase proteins.

3.1.4. Atherosclerosis Signaling

In our study, atherosclerosis signaling has been found to be modulated in CUD patients. Atherosclerosis signaling was one of the top canonical pathways that are involved in protein–protein interactions in amphetamine use disorder patients [23]. Note that apolipoprotein AI and inflammatory pathways interact with atherosclerosis signaling [45]. A previous review work discussed that THC might attenuate the plaques, generated from atherosclerosis, through modulating CB2 receptors [46]. Additionally, activation of CB1 receptors in the brain might be a therapeutic strategy to prevent ischemic stroke. Importantly, 2-arachidonoylglycerol (2-AG) and palmitoylethanolamide (PEA) are endocannabinoids that were found to attenuate the acute complication of atherosclerosis such as myocardial ischaemia in isolated rat hearts [47]. These effects were determined by measuring the activities of cardiac creatine kinase (CK) and lactate dehydrogenase. The beneficial effects of 2-AG and PEA on myocardial ischemia were abolished following exposure to a CB2 receptor antagonist, SR144528, indicating that the endocannabinoids might play a vital role in preventing the acute complications of atherosclerosis through acting on CB2 receptors. The significant role of CB2 receptors in preventing the myocardial ischemia was further supported by a study showing that a CB1/2 receptors agonist (WIN55212) was able to reduce the infraction size, an effect abolished with a selective CB2 receptor antagonist (AM630) but not with a selective CB1 antagonist (AM251). Moreover, treatment with a low dose of THC could reduce the progression of atherosclerosis in apolipoprotein E knockout mouse model [48]. This effect was abolished following exposure to a CB2 receptor antagonist. However, smoking cannabis with uncontrolled quantity of cannabinoids may induce adverse effects on the cardiovascular system [49]. These findings provide information about the potential therapeutic values of using cannabinoids for the treatments of atherosclerosis-related diseases.

3.1.5. Production of Nitric Oxide (NO) and Reactive Oxygen Species (ROS) in Macrophages

In our IPA analysis, we reported that NO and ROS production is significantly changed in CUD patients. Studies found that both ROS pathways/production are modulated following exposure to abused drugs [18,50,51]. These data are in agreement with our proteomic work demonstrating that production NO and ROS in macrophages was one of the top canonical pathways that are involved in protein–protein interactions in amphetamine use disorder patients [23]. Importantly, both CB1 and CB2 receptors are key proteins in regulating the productions of ROS and inflammatory cytokines by macrophages [52]. Interestingly, it was shown that activation of CB1 receptor mediated proinflammatory responses by macrophages via increased ROS production in part by inducing p38-mitogen-activated protein kinase phosphorylation [52]. This effect was attenuated through activating Ras-related protein 1, an effect mediated by CB2 receptor pathway. It is found that CBD exhibited potential antioxidant effects through direct and indirect pathways [18]. These pathways include modulating proteins such as CB1 and 2 receptors, antioxidant enzymes, adenosine A2A receptors, and other proteins. Therefore, it is recommended to test the effectiveness of CBD against many diseases associated with oxidative stress. CBD has better safety profile against psychoactive cannabinoids such as THC. Additionally, both THC and CBD could induce neuroprotective effects due to their potential antioxidant properties [53]. Alternatively, a synthetic cannabinoid exposure showed the ability to attenuate the production of NO in chondrocytes treated with IL-1 [54]. This study was supported by another study showing that a synthetic cannabinoid inhibited lipopolysaccharide-induced NO release in macrophages, an effect mediated by CB2 receptor pathway [55]. Cannabichromene, a cannabinoid TRPA1, reduced NO production by macrophages and attenuated colitis of murine [56]. Moreover, THC and CBD attenuated NO production in macrophages exposed to lipopolysaccharide, and the study found that THC was more potent than CBD in reducing the NO production [57]. Furthermore, THC exhibited ability to attenuate the gene expression of inducible NO synthase enzyme through modulating nuclear factor-κB (NF-κB) pathway in macrophages treated with lipopolysaccharide [58]. Taken together, cannabinoids might be potential compounds in modulating NO and ROS production by macrophages in various diseases.

3.2. Selected Proteins

Our work provides clinical understanding about the serum proteomic profiling in patients diagnosed with CUD. We found that there are significant alterations in the serum proteins expression and these proteins have been found to be essential in inflammations, protein binding, acute phase reactions, metabolic pathways, and other pathways. Moreover, these proteins have been found to be involved in oxidative stress, thyroid diseases, Alzheimer’s diseases, and lipid disorders. Our data indicate that cellular processes and cellular anatomy are highly affected by cannabis. For this study discussion, we selected proteins that either highly significant altered (p values) or changed at different locations in CUD patients as compared with control group.

3.2.1. Albumin

Our study investigated the serum expression of proteins that are highly involved in drug binding, including albumin [59]. Our work revealed that the serum expression of albumin was decreased in CUD patient as compared with control group. As albumin occupies high amount human serum proteins, the expression level of this protein is critical in patients who have developed other diseases and taken certain drugs. An important note that certain antipsychotic, antihypertensive, antiepileptic, antidepressant, antibiotic, and other classes of drugs have high protein binding properties and have narrow therapeutic windows [60]. Therefore, comorbidity of CUD with other diseases/disorders may result in toxicological effects of drugs that were used to treat these diseases or disorders. It is recommended here that CUD patients should be carefully monitored when they take other medicines. Drug–drug interaction between cannabinoids and other classes of drugs has been previously reported [61,62].

3.2.2. Haptoglobin

Regarding the serum haptoglobin level, our study reported a controversial result regarding the circulatory serum levels of haptoglobin in the CUD patients as compared with the control group. It is noteworthy that there is a correlation between haptoglobin and the inflammation process [63,64]. Cannabinoids were found to exert ant-inflammatory effects in animal models [65,66]. Haptoglobin was found to exert a protective effect against oxidative stress induced by an increase in the level of the hemoglobin in pre-clinical models [67]. Moreover, a proportional correlation was observed between haptoglobin and the levels of inflammatory cytokines [68]. In our study, we demonstrated that haptoglobin serum expression was upregulated in some locations and downregulated in other locations in the CUD group as compared with the control group. This differential expression of haptoglobin may result from post-translational modifications, cleavage by enzymes, or different protein species presence. Importantly, THC has been reported to induce oxidative stress, an effect associated with decreased antioxidant parameters [69]. However, CBD was found to produce antioxidant effect in neuronal cells [70,71]. Notably, exposure to C. sativa for 30 days resulted in a reduction in the total antioxidant capacity, an effect associated with an increase in the levels reactive oxygen species in male albino rats [72]. More research is required to explore the role of serum haptoglobin level in humans exposed to cannabis and its applications in medical sciences.

3.2.3. Apolipoprotein A-I

Our study found that serum circulatory levels of apolipoprotein A-I is highly abundant in CUD patients as compared with control group. Note that cholesterol levels and lipid metabolism are highly regulated by apolipoprotein A-I. A study reported that Apolipoprotein A-I interacted with high density lipoprotein particles [73]. Gene therapy using apolipoprotein A-I was shown to induce protective effects against lipid disorders [74]. A prior study found that cannabis exposure is associated with weight loss and reduced body mass index in humans [75]. Importantly, it was also found that cannabinoids could induce anorexia in part through acting on cannabinoid receptors [76]. Therefore, cannabis use may lead to an improvement in lipid metabolism and anorexia effects. These effects provide hope to develop novel therapeutic agents from C. sativa for the treatment of the lipid diseases. This is in an agreement with previous studies showing that cannabinoids improved heart diseases [77] suggesting the involvement of apolipoprotein A-I in this effect. Alternatively, prior studies found that apolipoprotein A-I had ability to reduce the beta amyloid accumulation [78,79]. This effect may lead to beneficial consequences against Alzheimer’s disease. It is critical to mention here that THC and CBD might be potential compounds for prevention and treatment Alzheimer’s disease symptoms [80]. Moreover, low levels of apolipoprotein A-I in the serum was observed in schizophrenic patients [81]. CBD may have therapeutic effects against schizophrenia [82]. However, studies found that THC exposure was associated with psychosis and schizophrenia [83,84]. The pharmacological effects of cannabis constituents against schizophrenia and Alzheimer’s disease should be further investigated.

3.2.4. Type I and Type II Keratins

Keratin is an essential component that is involved in the epithelial lining. Keratins have protective functions and provide structure to the epithelium [85]. The keratin is a protein that is a fibrous structure and localized in nails, hair, epithelial cells of the skin outer layer, and others [85]. Our study revealed that type I and type II keratins are highly abundant proteins in the serum of CUD compared with control group. Studies found that keratins are essential proteins in cell growth, differentiation, and proliferation [86,87,88]. In addition, they provide mechanical integrity as protection against external stress [89]. They also have cycloprotection properties against non-mechanical stresses [90]. These proteins have an additional role in the digestive system [91]. It is critical to figure out which constituents (cannabinoids vs. non-cannabinoids) in C. sativa are responsible for increasing both types (type I and type II) of keratins in the circulatory system in individuals who are chronically exposed to cannabis.

3.2.5. Serotransferrin

Serotransferrin is a critical protein to transport the iron from absorption sites or heme degradation to tissues for storage or utilization [92]. In our current study, we showed a downregulation of the serotransferrin serum expression in the of CUD patients as compared with control group. Additionally, serotransferrin expression was decreased in the urine of cannabis users [93], suggesting that cannabis users have downregulation in serotransferrin in the serum and urine. It is important to consider that a previous proteomic study found that serotransferrin was decreased in the lungs of smokers compared with control group [94]. However, the serum serotransferrin was found to be reduced in amphetamine use disorder patients [23]. This suggests that chronic exposure to abused drugs induces dysregulation in iron and heme balance.

3.2.6. Transthyretin

Transthyretin is an important protein to transport the thyroid hormone, thyroxine, and retinol-binding protein [95]. In this study, we found that there is an upregulation of the serum transthyretin expression in the of CUD patients as compared with control group. In addition, previous studies found that the accumulation or mutations of transthyretin was associated with amyloid diseases such as senile familial amyloid polyneuropathy, systemic amyloidosis, and familial amyloid cardiomyopathy [95]. However, transthyretin showed ability to bind to beta amyloid attenuating beta amyloid aggregation [96,97], which has beneficial consequences against Alzheimer’s disease. Therefore, it is recommended to explore the role of cannabis constituents in modulating transthyretin as a potential biomarker that is involved in many diseases.

3.2.7. Tumor Necrosis Factor Alpha-Induced Protein 3

Tumor necrosis factor alpha-induced protein 3 (TNFAIP3) was found to regulate the activity of NF-κB, especially through the receptor of TNF-alpha [27]. Importantly, NF-κB was found to be increased in the states of inflammation and activated immune cells [98]. Moreover, TNFAIP3 was found to be a negative feedback mechanism for NF-κB activation [99]. Note that a reduction in the expression of TNFAIP3 is a predictor for inflammation and increased NF-κB expression [100]. For instance, it has been found that the gene expression of TNFAIP3 was decreased in peripheral blood mononuclear cells of rheumatoid arthritis patients as compared with healthy control [101]. Moreover, the gene expression of TNFAIP3 was also reduced in peripheral blood mononuclear cells of patients with psoriasis vulgaris [102]. This study found that the gene expression level of TNFAIP3 was negatively linked to the severity of the disease. However, increased TNFAIP3 expression was linked to low survival rate of esophageal squamous cell carcinoma in a non-cancerous esophageal cell line [103]. We reported here that TNFAIP3 was less abundant protein in the circulatory serum of CUD patients as compared with control group.

3.2.8. Inactive Tyrosine Protein Kinase PEAK1

Inactive tyrosine protein kinase PEAK1 is an encoded gene and involved in the cellular response inside the cells following the activation of tyrosine kinase receptor [104]. We here found that inactive tyrosine protein kinase PEAK1 is less abundant in CUD patients as compared with healthy controls. Importantly, increased PEAK1 has been linked to the progression and metastasis of breast cancer [104,105]. We suggest that further investigation of the modulatory role of cannabinoids in the progression of breast cancer is required. PEAK1 has been found to regulate the responses of transforming growth Factor β in breast cancer models [104]. Moreover, overexpression of inactive tyrosine protein kinase PEAK1 can modulate anus kinase-2 and extracellular signal-regulated kinase-1/2, which was involved metastasis of tumors in lung cancers [106]. Previous and our findings suggest that future directions may explore the potential role of cannabis plants in cancer research focusing on the PEAK1 pathways.

4. Materials and Methods

4.1. Ethical Approval and Participate Consent

The IRB committees at the Eradah Complex for Mental Health (Riyadh, Saudi Arabia) and College of Medicine-King Saud University reviewed and approved all procedures and protocols. This study was performed according to the rules of the Declaration of Helsinki 1975 and later amendments. The written consents were acquired from all individuals involved in the study. This study was conducted at the Proteomics Unit, Obesity Research Center, College of Medicine and King Khalid University Hospital, Medical City, King Saud University, Riyadh, Saudi Arabia.

4.2. Study Design and Selection Criteria

Twenty male subjects were involved in two different groups in this study: CUD and healthy control. Ten subjects diagnosed with CUD (age of 30.4 ± 4.36 years) were enrolled at the Eradah Complex for Mental Health (Riyadh, Saudi Arabia) and compared with a control group containing 10 healthy individuals (age of 24.7 ± 3.63 years). To perform the power analysis and determine the least possible number of required biological replicates, we used Progenesis SameSpots software (Nonlinear Dynamics, Newcastle, UK). The diagnosis for CUD was performed according to the Diagnostic and Statistical Manual of Mental Disorders guidelines (DSM-5) [107]. The included participants have no history of blood disorders, diabetes mellitus, obesity, psychosis, renal diseases, or any other infectious diseases. Clinical and demographic information is shown in Table 1. The control group demographic information and gel scanning are used from our previous study [23] with respect of experimental procedures and timing. The CUD group tested positive for cannabinoids only without any detection of other abused drugs at the time of blood collection. Blood samples were collected, centrifuged for ten minutes at 1000× g. The resulting serum samples were aliquoted and stored at −80 °C for proteomic analysis.

4.3. Serum Protein Extraction

Proteins were extracted from the serum samples via centrifugation (5 min, 12,000× g) as described previously [23]. The depletion of high-abundance serum proteins (i.e., albumin, IgG) was achieved using Depletion SpinTrap for Albumin and IgG (GE Healthcare, Chicago, IL, USA) following the manufacturer’s instructions. Further, the remaining proteins were extracted by the TCA/acetone method [108]. The depleted samples were mixed with ice-cold acetone containing 10% w/v TCA (1:4), and the mixture was vortexed for 15 s to ensure uniform mixing. Next, the mixture was incubated overnight at −20 °C for protein precipitation. After incubation, the tubes were centrifuged for 15 min at 4 °C at a speed of 12,000× g, and the pellet was solubilized in labeling buffer (7 M of urea, 2 M of thiourea, 30 mM of Tris-HCl, 4% CHAPS, pH 8.5). After that, the concentration of protein samples was determined in triplicate employing the 2D-Quant Kit (GE Healthcare, Chicago, IL, USA).

4.4. Fluorescence Labeling of Samples with CyDyes and 2-Dimensional Difference in Gel Electrophoresis (2D-DIGE)

Fifty micrograms of protein from each sample of both the CUD and control groups was labeled with 400 pmol of Cy3 and Cy5 dyes. Then, the internal standard was prepared by mixing an equal amount of all samples after pooling and labelling with Cy2. A dye swapping strategy was employed during labelling in order to avoid any dye-specific bias (Supplementary Table S1). 1st-dimension analytical GE followed by 2nd-dimension sodium dodecyl sulfate (SDS)-polyacrylamide GE (SDS-PAGE) were implemented on 12.5% fixed gels as described in previous studies [23,109]. Further, the 2D-DIGE gels were scanned using the Typhoon 9400 scanner (GE Healthcare, Chicago, IL, USA) where specific excitation/emission wavelengths were used (488/520 nm) for Cy2, (532/580 nm) for Cy3, and (633/670 nm) for Cy5.

4.5. Statistical Analysis

Progenesis SameSpots software (v2.0, Nonlinear Dynamics, Newcastle, UK) was used to analyze the 2D-DIGE gel images. The image analysis was done by an automated spot detection and comparison method between the samples of CUD and control groups. Although the automatic analysis was completed to detect all the spots across all the 10 gels, each selected spot was manually edited and verified wherever necessary. The differentially expressed spots were identified by normalized volumes. The normalized volume of each spot on each gel was calculated from Cy3 (or Cy5) to Cy2 spot volume ratio using the software. To generate normal distributed data, log transformation of the spot volumes was done by the software. To calculate statistically significant differences between the two groups, one-way ANOVA was used and p < 0.05 was considered statistically significant. A cut-off ratio ≥1.5-fold was considered significant. A pre-filtration and manual check have been done on all spots before testing the statistical differences. In statistical analysis, the normalized spot volumes were applied instead of intensities of the spots. Any spots fulfil the above statistical criteria was analyzed by MS.

4.6. Protein Identification with Mass Spectrometry

Coomassie-stained gel spots from a preparatory gel were washed then digested according to methods described previously [23,109,110]. To describe briefly, total protein (1 mg) was obtained from a pool of equal protein amounts of the 20 serum samples (10 CUD and 10 control). This sample was denatured in lysis buffer and then mixed in a rehydration buffer. Then, the proteins samples were separated by first and second dimensions with the same conditions in the DIGE section. Then, the gels were fixed in 40% (v/v) ethanol containing 10% (v/v) acetic acid (overnight) and then washed (3×, 30 min each, ddH2O). The gels were incubated (1 h, 34% (v/v) CH3OH containing 17% (w/v) ammonium sulphate and 3%(v/v) phosphoric acid) prior to the addition of 0.5 g/L Coomassie G-250. After 5 days, the stained gels were briefly rinsed with Milli-Q water and stored until the spots could be picked and identified by MS. Digestion was performed by adding 15 µL of (20 ng ice-cold trypsin solution in 25 mM NH4HCO3, 5 mL CH3CN, 5 mL distilled water) and incubated 20 min at 4 °C, and digestion continued overnight at 37 °C. To extract the peptides, 1 µL of 1% Trifluoracetic acid was added on the gel pieces and placed in vortex incubator for mass spectrometric analysis (1 h, 400 rpm, 25 °C).
After that, a mixture of tryptic peptides (1 μL) was formed from each protein and spotted onto a MALDI target (384 MTP Anchorchip; 800 μm Anchorchip; Bruker Daltonics, Bremen, Germany). MALDI-MS spectra were obtained with UltraflexTerm time-of-flight (TOF) MS equipped with a LIFT-MS/MS device (Bruker Daltonics, Bremen, Germany) at a reflector (voltages of 21 kV) and detector (voltages of 17 kV), as described previously [111,112,113]. PMFs were calibrated against peptide calibration standard II (Bruker Daltonics, Bremen, Germany). The PMFs were assessed with Flex Analysis software (v2.4, Bruker Daltonics, Bremen, Germany). MS data were interpreted with BioTools v3.2 (Bruker Daltonics, Bremen, Germany). The peptide masses were searched against the Mascot search algorithm (v2.0.04, updated on 9 May 2019; Matrix Science Ltd., Bremen, UK). The identified proteins were screened for a Mascot score >56 and p < 0.05.

4.7. Network Pathway and Functional Analysis

The IPA Software program (Version: 42012434, Ingenuity Systems, Redwood City, CA, USA, http://www.ingenuity.com, accessed on 2 February 2021) was used to analyze the identified proteins and to annotate them with related functions and pathways. The annotations involved overlaying the proteins with their most significant networks and biochemical pathways based on previous publications on the proteins. The identified proteins were classified into different categories according to their biological process, cellular components, and molecular function using protein analysis through evolutionary relationships (PANTHER) classification system (http://www.pantherdb.org, accessed 1 February 2021).

4.8. Immunoblotting

Immunoblotting assay was performed in the current study to further confirm the findings of the proteomic study. Two differential abundance proteins with statistically significant were chosen and determined by immunoblotting. Primary monoclonal antibodies against transferrin (mouse, cat # SC-365871), retinol-binding protein (RBP, mouse, cat # SC-69795), and β-actin (goat, N-18, cat # SC-1616) were bought from Santa Cruz Biotechnology (Santa Cruz, TX, USA). One-dimensional discontinuous slab gel electrophoresis (12% sodium dodecyl sulfate (SDS)-polyacrylamide gel) was used to separate an equal amount of protein from each sample (50 μg). A mini trans-blot electrotransfer cell (BioRad, California, CA, USA) was employed to transfer proteins from the run gels to an Immobilon-P, polyvinylidene difluoride (PVDF) transfer membrane (Millipore, Massachusetts, MA, USA) To test the efficiency of the transfer, the membranes were stained with Ponceau-S. Subsequently, the membranes were blocked with tris-buffered saline (TBS)-containing 5% fat-free milk (FFM), for one hour at room temperature, and then the membranes were rinsed three times with TBS-T in 10 mM Tris–HCl, 150 mM NaCl, 0.1% Tween 20 buffer. After rinsing, the membranes were incubated with the selected primary antibodies at dilution of (1:200) using a blocking buffer. Membranes were then incubated with the matched immunoglobulin G (IgG)-horseradish peroxidase (HRP)-conjugated secondary antibody, and the enhanced chemiluminescence (ECL, Thermo Fisher Scientific, Massachusetts, MA, USA) was used to detect the immunoreactive bands. These bands were visualized by scanning with Sapphire Biomolecular Imager (Azure Bio systems, Dublin, OH, USA) and digitalized via the image analysis software Sapphire Capture system (Azure Biosystems, Dublin, OH, USA).

5. Conclusions

Our findings provide clinical insight about the potential effects of cannabis abuse on the circulatory protein expression. These proteins are highly involved in different applications and diseases/disorders. The present study highlighted that drug discovery research can further investigate the effects of cannabis ingredients on immunological and inflammatory responses as well as the diseases involved, e.g., atherosclerosis. This will prove a novel direction to discover and develop potential compounds for the prevention or treatments of these diseases. These researches might target acute phase proteins, NO and ROS pathways, atherosclerosis signaling, or LXR/RXR and FXR/RXR pathways. One of applications obtained from the current work is the drug–drug interaction since our present study showed that the serum expression of albumin, which is a major serum protein binding, is decreased in CUD patients. Our study also found that cannabis abuse might modulate several diseases and disorders. However, the quantity of cannabis inside the humans were not controlled; therefore, this hypothesis needs more investigations with controlled doses. In addition, cannabis include cannabinoids and non-cannabinoids where the cannabinoids are either psychoactive or non-psychoactive. Thus, future studies should further investigate our findings using a specific cannabis constituent. This will provide a clear understanding about the responsible compound for a specific effect. A limitation in our study is the age variation in both groups. More research is required to exclude any age variation and also investigate the serum proteomic profiling of female CUD patients.

Supplementary Materials

The following are available online, Figure S1: Pathways and canonical pathways identified in the IPA functional analysis, Figure S2: Gel images, Figure S3: Example of the full western blots (not truncated), Table S1: Experimental design, Table S2: Mass spectrometry list of significant differentially abundant proteins, Table S3: List of 25 proteins with accession numbers depicted in IPA network pathway, and Table S4: List of proteins with accession numbers for the top 5 canonical pathways.

Author Contributions

F.A. (Fawaz Alasmari), S.A., H.B., A.M. and A.A.A. conceived the idea and designed the study. F.A. (Fawaz Alasmari), S.A., F.A. (Faleh Alqahtani), O.I.F. and A.F.A., were involved in patient recruitment. H.B., A.M., I.O.A. and M.M. performed the proteomics lab work. F.A. (Fawaz Alasmari), S.A., H.B., A.M., M.M. and A.A.A. did data analysis and wrote the manuscript. S.A., F.A. (Faleh Alqahtani) and O.I.F. edited the manuscript. All authors have read and agreed to the published version of the manuscript.

Funding

This work was funded by the National Plan for Science, Technology and Innovation (MAARIFAH), King Abdulaziz City for Science and Technology, Kingdom of Saudi Arabia (Project No. 08-MED513-02).

Institutional Review Board Statement

All procedures and protocols, including were reviewed and approved by The IRB at the Eradah Complex for Mental Health (Riyadh, Saudi Arabia) and College of Medicine-King Saud University, Riyadh, Saudi Arabia.

Informed Consent Statement

Informed consent was obtained from all subjects involved in the study.

Data Availability Statement

All data generated or analyzed in the current study are included in this article. The mass lists obtained from the MALDI-TOF-MS analysis of the 121 spots in this study are openly available in FigShare at doi:10.6084/m9.figshare.15131253.

Acknowledgments

The authors extend their appreciation to the National Plan for Science, Technology and Innovation (MAARIFAH), King Abdulaziz City for Science and Technology, Kingdom of Saudi Arabia (Project No. 08-MED513-02) for financial support. We thank Shahid Nawaz and Othman Othman for their assistance in laboratory work.

Conflicts of Interest

The authors declare no conflict of interest.

Sample Availability

Samples of the compounds are not available from the authors.

References

  1. Atakan, Z. Cannabis, a complex plant: Different compounds and different effects on individuals. Ther. Adv. Psychopharmacol. 2012, 2, 241–254. [Google Scholar] [CrossRef] [PubMed] [Green Version]
  2. Casajuana Kögel, C.; López-Pelayo, H.; Balcells-Olivero, M.M.; Colom, J.; Gual, A. Psychoactive constituents of cannabis and their clinical implications: A systematic review. Adicciones 2018, 30, 140–151. [Google Scholar]
  3. Winton-Brown, T.T.; Allen, P.; Bhattacharrya, S.; Borgwardt, S.J.; Fusar-Poli, P.; Crippa, J.A.; Seal, M.L.; Martin-Santos, R.; Ffytche, D.; Zuardi, A.W. Modulation of auditory and visual processing by delta-9-tetrahydrocannabinol and cannabidiol: An FMRI study. Neuropsychopharmacology 2011, 36, 1340–1348. [Google Scholar] [CrossRef] [PubMed]
  4. Hussain, S.A.; Zhou, R.; Jacobson, C.; Weng, J.; Cheng, E.; Lay, J.; Hung, P.; Lerner, J.T.; Sankar, R. Perceived efficacy of cannabidiol-enriched cannabis extracts for treatment of pediatric epilepsy: A potential role for infantile spasms and Lennox–Gastaut syndrome. Epilepsy Behav. 2015, 47, 138–141. [Google Scholar] [CrossRef] [PubMed]
  5. Laux, L.C.; Bebin, E.M.; Checketts, D.; Chez, M.; Flamini, R.; Marsh, E.D.; Miller, I.; Nichol, K.; Park, Y.; Segal, E. Long-term safety and efficacy of cannabidiol in children and adults with treatment resistant Lennox-Gastaut syndrome or Dravet syndrome: Expanded access program results. Epilepsy Res. 2019, 154, 13–20. [Google Scholar] [CrossRef] [PubMed]
  6. Slatkin, N.E. Cannabinoids in the treatment of chemotherapy-induced nausea and vomiting: Beyond prevention of acute emesis. J. Support Oncol. 2007, 5, 1–9. [Google Scholar]
  7. Badowski, M.E.; Yanful, P.K. Dronabinol oral solution in the management of anorexia and weight loss in AIDS and cancer. Ther. Clin. Risk Manag. 2018, 14, 643. [Google Scholar] [CrossRef] [Green Version]
  8. Hasin, D.S.; Kerridge, B.T.; Saha, T.D.; Huang, B.; Pickering, R.; Smith, S.M.; Jung, J.; Zhang, H.; Grant, B.F. Prevalence and correlates of DSM-5 cannabis use disorder, 2012–2013: Findings from the National Epidemiologic Survey on Alcohol and Related Conditions–III. Am. J. Psychiatry 2016, 173, 588–599. [Google Scholar] [CrossRef]
  9. Henquet, C.; Rosa, A.; Delespaul, P.; Papiol, S.; Faňanás, L.; Van Os, J.; Myin-Germeys, I. COMT Val158Met moderation of cannabis-induced psychosis: A momentary assessment study of ‘switching on’hallucinations in the flow of daily life. Acta Psychiatr. Scand. 2009, 119, 156–160. [Google Scholar] [CrossRef]
  10. Lee, C.-R.; Lee, A.; Goodman, S.; Hammond, D.; Fischer, B. The Lower-Risk Cannabis Use Guidelines’(LRCUG) recommendations: How are Canadian cannabis users complying? Prev. Med. Rep. 2020, 20, 101187. [Google Scholar] [CrossRef]
  11. Fischer, B.; Russell, C.; Sabioni, P.; Van Den Brink, W.; Le Foll, B.; Hall, W.; Rehm, J.; Room, R. Lower-risk cannabis use guidelines: A comprehensive update of evidence and recommendations. Am. J. Public Health 2017, 107, e1–e12. [Google Scholar] [CrossRef]
  12. Ashton, C.H. Pharmacology and effects of cannabis: A brief review. Br. J. Psychiatry 2001, 178, 101–106. [Google Scholar] [CrossRef] [Green Version]
  13. Wu, T.-C.; Tashkin, D.P.; Djahed, B.; Rose, J.E. Pulmonary hazards of smoking marijuana as compared with tobacco. N. Engl. J. Med. 1988, 318, 347–351. [Google Scholar] [CrossRef]
  14. Malviya, A.; Khan, S.A.; Gupta, A.; Mishra, A. Chronic Marijuana Consumption Leading to High-Grade Atrioventricular Block in a Young Male. Cureus 2021, 13, e16202. [Google Scholar]
  15. Adapa, S.; Gayam, V.; Konala, V.M.; Annangi, S.; Raju, M.P.; Bezwada, V.; McMillan, C.; Dalal, H.; Mandal, A.; Naramala, S. Cannabis Vaping–Induced Acute Pulmonary Toxicity: Case Series and Review of Literature. J. Investig. Med. High Impact Case Rep. 2020, 8, 2324709620947267. [Google Scholar] [CrossRef]
  16. Noble, M.J.; Hedberg, K.; Hendrickson, R.G. Acute cannabis toxicity. Clin. Toxicol. 2019, 57, 735–742. [Google Scholar] [CrossRef] [PubMed]
  17. Nichols, J.M.; Kaplan, B.L. Immune responses regulated by cannabidiol. Cannabis Cannabinoid Res. 2020, 5, 12–31. [Google Scholar] [CrossRef] [PubMed] [Green Version]
  18. Atalay, S.; Jarocka-Karpowicz, I.; Skrzydlewska, E. Antioxidative and anti-inflammatory properties of cannabidiol. Antioxidants 2020, 9, 21. [Google Scholar] [CrossRef] [PubMed] [Green Version]
  19. Costa, B.; Colleoni, M.; Conti, S.; Parolaro, D.; Franke, C.; Trovato, A.E.; Giagnoni, G. Oral anti-inflammatory activity of cannabidiol, a non-psychoactive constituent of cannabis, in acute carrageenan-induced inflammation in the rat paw. Naunyn-Schmiedeberg’s Arch. Pharmacol. 2004, 369, 294–299. [Google Scholar] [CrossRef]
  20. Izzo, A.A.; Capasso, R.; Aviello, G.; Borrelli, F.; Romano, B.; Piscitelli, F.; Gallo, L.; Capasso, F.; Orlando, P.; Di Marzo, V. Inhibitory effect of cannabichromene, a major non-psychotropic cannabinoid extracted from Cannabis sativa, on inflammation-induced hypermotility in mice. Br. J. Pharmacol. 2012, 166, 1444–1460. [Google Scholar] [CrossRef] [Green Version]
  21. Pottiez, G.; Jagadish, T.; Yu, F.; Letendre, S.; Ellis, R.; Duarte, N.A.; Grant, I.; Gendelman, H.E.; Fox, H.S.; Ciborowski, P. Plasma proteomic profiling in HIV-1 infected methamphetamine abusers. PLoS ONE 2012, 7, e31031. [Google Scholar] [CrossRef] [Green Version]
  22. Shi, W.-L.; Zhao, X.; Liu, Z.-M.; Zhang, M.; Zhou, B.-Y.; Pu, X.-P. Serum proteomics of methamphetamine addicts and up-regulation of complement factor H related to methamphetamine addiction. Neurosci. Lett. 2012, 525, 23–28. [Google Scholar] [CrossRef] [PubMed]
  23. Alasmari, F.; Alsanea, S.; Masood, A.; Alhazzani, K.; Alanazi, I.O.; Musambil, M.; Alfadda, A.A.; Alshammari, M.A.; Alasmari, A.F.; Benabdelkamel, H. Serum proteomic profiling of patients with amphetamine use disorder. Drug Alcohol. Depend. 2020, 214, 108157. [Google Scholar] [CrossRef] [PubMed]
  24. Lopez, M.F.; Mikulskis, A.; Kuzdzal, S.; Bennett, D.A.; Kelly, J.; Golenko, E.; DiCesare, J.; Denoyer, E.; Patton, W.F.; Ediger, R. High-resolution serum proteomic profiling of Alzheimer disease samples reveals disease-specific, carrier-protein–bound mass signatures. Clin. Chem. 2005, 51, 1946–1954. [Google Scholar] [CrossRef] [PubMed] [Green Version]
  25. Jiang, R.; Rong, C.; Ke, R.; Meng, S.; Yan, X.; Ke, H.; Wu, S. Differential proteomic analysis of serum exosomes reveals alterations in progression of Parkinson disease. Medicine 2019, 98, e17478. [Google Scholar] [CrossRef]
  26. Corbett, B.; Kantor, A.; Schulman, H.; Walker, W.; Lit, L.; Ashwood, P.; Rocke, D.M.; Sharp, F.R. A proteomic study of serum from children with autism showing differential expression of apolipoproteins and complement proteins. Mol. Psychiatry 2007, 12, 292–306. [Google Scholar] [CrossRef]
  27. Das, T.; Chen, Z.; Hendriks, R.W.; Kool, M. A20/Tumor necrosis factor α-induced protein 3 in immune cells controls development of autoinflammation and autoimmunity: Lessons from mouse models. Front. Immunol. 2018, 9, 104. [Google Scholar] [CrossRef] [Green Version]
  28. Taurines, R.; Dudley, E.; Conner, A.C.; Grassl, J.; Jans, T.; Guderian, F.; Mehler-Wex, C.; Warnke, A.; Gerlach, M.; Thome, J. Serum protein profiling and proteomics in autistic spectrum disorder using magnetic bead-assisted mass spectrometry. Eur. Arch. Psychiatry Clin. Neurosci. 2010, 260, 249–255. [Google Scholar] [CrossRef]
  29. Bot, M.; Chan, M.K.; Jansen, R.; Lamers, F.; Vogelzangs, N.; Steiner, J.; Leweke, F.M.; Rothermundt, M.; Cooper, J.; Bahn, S. Serum proteomic profiling of major depressive disorder. Transl. Psychiatry 2015, 5, e599. [Google Scholar] [CrossRef] [Green Version]
  30. Smirnova, L.; Seregin, A.; Boksha, I.; Dmitrieva, E.; Simutkin, G.; Kornetova, E.; Savushkina, O.; Letova, A.; Bokhan, N.; Ivanova, S. The difference in serum proteomes in schizophrenia and bipolar disorder. BMC Genom. 2019, 20, 1–14. [Google Scholar] [CrossRef]
  31. Juknat, A.; Pietr, M.; Kozela, E.; Rimmerman, N.; Levy, R.; Gao, F.; Coppola, G.; Geschwind, D.; Vogel, Z. Microarray and pathway analysis reveal distinct mechanisms underlying cannabinoid-mediated modulation of LPS-induced activation of BV-2 microglial cells. PLoS ONE 2013, 8, e61462. [Google Scholar] [CrossRef] [Green Version]
  32. Maqdasy, S.; Trousson, A.; Tauveron, I.; Volle, D.H.; Baron, S.; Lobaccaro, J.-M.A. Once and for all, LXRα and LXRβ are gatekeepers of the endocrine system. Mol. Asp. Med. 2016, 49, 31–46. [Google Scholar] [CrossRef]
  33. Zelcer, N.; Tontonoz, P. Liver X receptors as integrators of metabolic and inflammatory signaling. J. Clin. Investig. 2006, 116, 607–614. [Google Scholar] [CrossRef] [Green Version]
  34. Mukwaya, A.; Lennikov, A.; Xeroudaki, M.; Mirabelli, P.; Lachota, M.; Jensen, L.; Peebo, B.; Lagali, N. Time-dependent LXR/RXR pathway modulation characterizes capillary remodeling in inflammatory corneal neovascularization. Angiogenesis 2018, 21, 395–413. [Google Scholar] [CrossRef] [Green Version]
  35. Korf, H.; Vander Beken, S.; Romano, M.; Steffensen, K.R.; Stijlemans, B.; Gustafsson, J.-Å.; Grooten, J.; Huygen, K. Liver X receptors contribute to the protective immune response against Mycobacterium tuberculosis in mice. J. Clin. Investig. 2009, 119, 1626–1637. [Google Scholar] [CrossRef] [Green Version]
  36. Claudel, T.; Staels, B.; Kuipers, F. The Farnesoid X receptor: A molecular link between bile acid and lipid and glucose metabolism. Arterioscler. Thromb. Vasc. Biol. 2005, 25, 2020–2030. [Google Scholar] [CrossRef]
  37. Zhang, H.M.; Wang, X.; Wu, Z.H.; Liu, H.L.; Chen, W.; Zhang, Z.Z.; Chen, D.; Zeng, T.S. Beneficial effect of farnesoid X receptor activation on metabolism in a diabetic rat model. Mol. Med. Rep. 2016, 13, 2135–2142. [Google Scholar] [CrossRef] [PubMed]
  38. Zhang, Y.; Lee, F.Y.; Barrera, G.; Lee, H.; Vales, C.; Gonzalez, F.J.; Willson, T.M.; Edwards, P.A. Activation of the nuclear receptor FXR improves hyperglycemia and hyperlipidemia in diabetic mice. Proc. Natl. Acad. Sci. USA 2006, 103, 1006–1011. [Google Scholar] [CrossRef] [Green Version]
  39. Nishimoto, N.; Yoshizaki, K.; Tagoh, H.; Monden, M.; Kishimoto, S.; Hirano, T.; Kishimoto, T. Elevation of serum interleukin 6 prior to acute phase proteins on the inflammation by surgical operation. Clin. Immunol. Immunopathol. 1989, 50, 399–401. [Google Scholar] [CrossRef]
  40. Pini, M.; Rhodes, D.H.; Fantuzzi, G. Hematological and acute-phase responses to diet-induced obesity in IL-6 KO mice. Cytokine 2011, 56, 708–716. [Google Scholar] [CrossRef] [Green Version]
  41. Sander, L.E.; Sackett, S.D.; Dierssen, U.; Beraza, N.; Linke, R.P.; Müller, M.; Blander, J.M.; Tacke, F.; Trautwein, C. Hepatic acute-phase proteins control innate immune responses during infection by promoting myeloid-derived suppressor cell function. J. Exp. Med. 2010, 207, 1453–1464. [Google Scholar] [CrossRef] [PubMed] [Green Version]
  42. Smith, M.S.; Yamamoto, Y.; Newton, C.; Friedman, H.; Klein, T. Psychoactive cannabinoids increase mortality and alter acute phase cytokine responses in mice sublethally infected with Legionella pneumophila. Proc. Soc. Exp. Biol. Med. 1997, 214, 69–75. [Google Scholar] [CrossRef] [PubMed]
  43. Laprairie, R.; Bagher, A.; Kelly, M.; Denovan-Wright, E. Cannabidiol is a negative allosteric modulator of the cannabinoid CB1 receptor. Br. J. Pharmacol. 2015, 172, 4790–4805. [Google Scholar] [CrossRef] [PubMed] [Green Version]
  44. Pertwee, R. The diverse CB1 and CB2 receptor pharmacology of three plant cannabinoids: Δ9-tetrahydrocannabinol, cannabidiol and Δ9-tetrahydrocannabivarin. Br. J. Pharmacol. 2008, 153, 199–215. [Google Scholar] [CrossRef] [Green Version]
  45. Van Stijn, C.M.; Kim, J.; Barish, G.D.; Tietge, U.J.; Tangirala, R.K. Adiponectin expression protects against angiotensin II-mediated inflammation and accelerated atherosclerosis. PLoS ONE 2014, 9, e86404. [Google Scholar] [CrossRef] [Green Version]
  46. Mach, F.; Montecucco, F.; Steffens, S. Cannabinoid receptors in acute and chronic complications of atherosclerosis. Br. J. Pharmacol. 2008, 153, 290–298. [Google Scholar] [CrossRef] [Green Version]
  47. Lépicier, P.; Bouchard, J.F.; Lagneux, C.; Lamontagne, D. Endocannabinoids protect the rat isolated heart against ischaemia. Br. J. Pharmacol. 2003, 139, 805–815. [Google Scholar] [CrossRef] [Green Version]
  48. Steffens, S.; Veillard, N.R.; Arnaud, C.; Pelli, G.; Burger, F.; Staub, C.; Zimmer, A.; Frossard, J.-L.; Mach, F. Low dose oral cannabinoid therapy reduces progression of atherosclerosis in mice. Nature 2005, 434, 782–786. [Google Scholar] [CrossRef]
  49. Chetty, K.; Lavoie, A.; Dehghani, P. A literature review of cannabis and myocardial infarction–what clinicians may not be aware of. CJC Open 2020, 3, 12–21. [Google Scholar] [CrossRef]
  50. Zhu, W.; Wang, H.; Wei, J.; Sartor, G.C.; Bao, M.M.; Pierce, C.T.; Wahlestedt, C.R.; Dykxhoorn, D.M.; Dong, C. Cocaine exposure increases blood pressure and aortic stiffness via the miR-30c-5p–malic enzyme 1–reactive oxygen species pathway. Hypertension 2018, 71, 752–760. [Google Scholar] [CrossRef] [PubMed]
  51. Shrivastava, A.; Kuzontkoski, P.M.; Groopman, J.E.; Prasad, A. Cannabidiol induces programmed cell death in breast cancer cells by coordinating the cross-talk between apoptosis and autophagy. Mol. Cancer Ther. 2011, 10, 1161–1172. [Google Scholar] [CrossRef] [Green Version]
  52. Han, K.H.; Lim, S.; Ryu, J.; Lee, C.-W.; Kim, Y.; Kang, J.-H.; Kang, S.-S.; Ahn, Y.K.; Park, C.-S.; Kim, J.J. CB1 and CB2 cannabinoid receptors differentially regulate the production of reactive oxygen species by macrophages. Cardiovasc. Res. 2009, 84, 378–386. [Google Scholar] [CrossRef]
  53. Hampson, A.; Grimaldi, M.; Axelrod, J.; Wink, D. Cannabidiol and (−) Δ9-tetrahydrocannabinol are neuroprotective antioxidants. Proc. Natl. Acad. Sci. USA 1998, 95, 8268–8273. [Google Scholar] [CrossRef] [PubMed] [Green Version]
  54. Mbvundula, E.C.; Bunning, R.A.; Rainsford, K. Effects of cannabinoids on nitric oxide production by chondrocytes and proteoglycan degradation in cartilage. Biochem. Pharmacol. 2005, 69, 635–640. [Google Scholar] [CrossRef] [PubMed]
  55. Ross, R.A.; Brockie, H.C.; Pertwee, R.G. Inhibition of nitric oxide production in RAW264. 7 macrophages by cannabinoids and palmitoylethanolamide. Eur. J. Pharmacol. 2000, 401, 121–130. [Google Scholar] [CrossRef]
  56. Romano, B.; Borrelli, F.; Fasolino, I.; Capasso, R.; Piscitelli, F.; Cascio, M.; Pertwee, R.; Coppola, D.; Vassallo, L.; Orlando, P. The cannabinoid TRPA1 agonist cannabichromene inhibits nitric oxide production in macrophages and ameliorates murine colitis. Br. J. Pharmacol. 2013, 169, 213–229. [Google Scholar] [CrossRef]
  57. Coffey, R.G.; Yamamoto, Y.; Snella, E.; Pross, S. Tetrahydrocannabinol inhibition of macrophage nitric oxide production. Biochem. Pharmacol. 1996, 52, 743–751. [Google Scholar] [CrossRef]
  58. Jeon, Y.J.; Yang, K.-H.; Pulaski, J.T.; Kaminski, N.E. Attenuation of inducible nitric oxide synthase gene expression by delta 9-tetrahydrocannabinol is mediated through the inhibition of nuclear factor-kappa B/Rel activation. Mol. Pharmacol. 1996, 50, 334–341. [Google Scholar]
  59. Bohnert, T.; Gan, L.-S. Plasma protein binding: From discovery to development. J. Pharm. Sci. 2013, 102, 2953–2994. [Google Scholar] [CrossRef]
  60. Eichel, E.A.; Ellingrod, V.L. Protein binding changes and drug interactions: What do we know. Curr. Psychiatry 2018, 17, 38–41. [Google Scholar]
  61. Vázquez, M.; Guevara, N.; Maldonado, C.; Guido, P.C.; Schaiquevich, P. Potential Pharmacokinetic Drug-Drug Interactions between Cannabinoids and Drugs Used for Chronic Pain. BioMed Res. Int. 2020, 2020, 1–9. [Google Scholar] [CrossRef]
  62. Brown, J.D. Potential adverse drug events with tetrahydrocannabinol (THC) due to drug–drug interactions. J. Clin. Med. 2020, 9, 919. [Google Scholar] [CrossRef] [Green Version]
  63. Wang, Y.; Kinzie, E.; Berger, F.G.; Lim, S.-K.; Baumann, H. Haptoglobin, an inflammation-inducible plasma protein. Redox Rep. 2001, 6, 379–385. [Google Scholar] [CrossRef]
  64. Sharpe-Timms, K.; Nabli, H.; Zimmer, R.; Birt, J.; Davis, J. Inflammatory cytokines differentially up-regulate human endometrial haptoglobin production in women with endometriosis. Hum. Reprod. 2010, 25, 1241–1250. [Google Scholar] [CrossRef] [Green Version]
  65. Formukong, E.; Evans, A.; Evans, F. Analgesic and antiinflammatory activity of constituents of Cannabis sativa L. Inflammation 1988, 12, 361–371. [Google Scholar] [CrossRef] [PubMed]
  66. Mechoulam, R.; Sumariwalla, P.F.; Feldmann, M.; Gallily, R. Cannabinoids in models of chronic inflammatory conditions. Phytochem. Rev. 2005, 4, 11–18. [Google Scholar] [CrossRef]
  67. Schaer, C.; Deuel, J.; Bittermann, A.; Rubio, I.; Schoedon, G.; Spahn, D.; Wepf, R.; Vallelian, F.; Schaer, D. Mechanisms of haptoglobin protection against hemoglobin peroxidation triggered endothelial damage. Cell Death Differ. 2013, 20, 1569–1579. [Google Scholar] [CrossRef] [PubMed] [Green Version]
  68. Jelena, A.; Mirjana, M.; Desanka, B.; Svetlana, I.-M.; Aleksandra, U.; Goran, P.; Ilijana, G. Haptoglobin and the inflammatory and oxidative status in experimental diabetic rats: Antioxidant role of haptoglobin. J. Physiol. Biochem. 2013, 69, 45–58. [Google Scholar] [CrossRef] [PubMed]
  69. Wolff, V.; Schlagowski, A.-I.; Rouyer, O.; Charles, A.-L.; Singh, F.; Auger, C.; Schini-Kerth, V.; Marescaux, C.; Raul, J.-S.; Zoll, J. Tetrahydrocannabinol induces brain mitochondrial respiratory chain dysfunction and increases oxidative stress: A potential mechanism involved in cannabis-related stroke. BioMed Res. Int. 2015, 2015, 1–7. [Google Scholar] [CrossRef] [PubMed] [Green Version]
  70. Raja, A.; Ahmadi, S.; de Costa, F.; Li, N.; Kerman, K. Attenuation of Oxidative Stress by Cannabinoids and Cannabis Extracts in Differentiated Neuronal Cells. Pharmaceuticals 2020, 13, 328. [Google Scholar] [CrossRef] [PubMed]
  71. Valvassori, S.S.; Elias, G.; de Souza, B.; Petronilho, F.; Dal-Pizzol, F.; Kapczinski, F.; Trzesniak, C.; Tumas, V.; Dursun, S.; Nisihara Chagas, M.H. Effects of cannabidiol on amphetamine-induced oxidative stress generation in an animal model of mania. J. Psychopharmacol. 2011, 25, 274–280. [Google Scholar] [CrossRef] [PubMed]
  72. Alagbonsi, I.A.; Olayaki, L.A. Role of oxidative stress in Cannabis sativa-associated spermatotoxicity: Evidence for ameliorative effect of combined but not separate melatonin and vitamin C. Middle East Fertil. Soc. J. 2017, 22, 136–144. [Google Scholar] [CrossRef]
  73. Nguyen, D.; Nickel, M.; Mizuguchi, C.; Saito, H.; Lund-Katz, S.; Phillips, M.C. Interactions of apolipoprotein AI with high-density lipoprotein particles. Biochemistry 2013, 52, 1963–1972. [Google Scholar] [CrossRef]
  74. Wacker, B.K.; Dronadula, N.; Bi, L.; Stamatikos, A.; Dichek, D.A. Apo AI (Apolipoprotein AI) vascular gene therapy provides durable protection against atherosclerosis in hyperlipidemic rabbits. Arterioscler. Thromb. Vasc. Biol. 2018, 38, 206–217. [Google Scholar] [CrossRef] [PubMed] [Green Version]
  75. Clark, T.M.; Jones, J.M.; Hall, A.G.; Tabner, S.A.; Kmiec, R.L. Theoretical explanation for reduced body mass index and obesity rates in cannabis users. Cannabis Cannabinoid Res. 2018, 3, 259–271. [Google Scholar] [CrossRef] [PubMed] [Green Version]
  76. Verty, A.N.; Evetts, M.J.; Crouch, G.J.; McGregor, I.S.; Stefanidis, A.; Oldfield, B.J. The cannabinoid receptor agonist THC attenuates weight loss in a rodent model of activity-based anorexia. Neuropsychopharmacology 2011, 36, 1349–1358. [Google Scholar] [CrossRef] [Green Version]
  77. Mendizábal, V.E.; Adler-Graschinsky, E. Cannabinoids as therapeutic agents in cardiovascular disease: A tale of passions and illusions. Br. J. Pharmacol. 2007, 151, 427–440. [Google Scholar] [CrossRef]
  78. Robert, J.; Button, E.B.; Yuen, B.; Gilmour, M.; Kang, K.; Bahrabadi, A.; Stukas, S.; Zhao, W.; Kulic, I.; Wellington, C.L. Clearance of beta-amyloid is facilitated by apolipoprotein E and circulating high-density lipoproteins in bioengineered human vessels. Elife 2017, 6, e29595. [Google Scholar] [CrossRef]
  79. Button, E.B.; Boyce, G.K.; Wilkinson, A.; Stukas, S.; Hayat, A.; Fan, J.; Wadsworth, B.J.; Robert, J.; Martens, K.M.; Wellington, C.L. ApoA-I deficiency increases cortical amyloid deposition, cerebral amyloid angiopathy, cortical and hippocampal astrogliosis, and amyloid-associated astrocyte reactivity in APP/PS1 mice. Alzheimer’s Res. Ther. 2019, 11, 1–18. [Google Scholar] [CrossRef] [Green Version]
  80. Kim, S.H.; Yang, J.W.; Kim, K.H.; Kim, J.U.; Yook, T.H. A Review on Studies of Marijuana for Alzheimer’s Disease–Focusing on CBD, THC. J. Pharmacopunct. 2019, 22, 225. [Google Scholar]
  81. Boiko, A.S.; Mednova, I.A.; Kornetova, E.G.; Semke, A.V.; Bokhan, N.A.; Loonen, A.J.; Ivanova, S.A. Apolipoprotein serum levels related to metabolic syndrome in patients with schizophrenia. Heliyon 2019, 5, e02033. [Google Scholar] [CrossRef] [PubMed] [Green Version]
  82. Schoevers, J.; Leweke, J.E.; Leweke, F.M. Cannabidiol as a treatment option for schizophrenia: Recent evidence and current studies. Curr. Opin. Psychiatry 2020, 33, 185–191. [Google Scholar] [CrossRef] [PubMed]
  83. Bhattacharyya, S.; Crippa, J.A.; Allen, P.; Martin-Santos, R.; Borgwardt, S.; Fusar-Poli, P.; Rubia, K.; Kambeitz, J.; O’Carroll, C.; Seal, M.L. Induction of psychosis byδ9-tetrahydrocannabinol reflects modulation of prefrontal and striatal function during attentional salience processing. Arch. Gen. Psychiatry 2012, 69, 27–36. [Google Scholar] [CrossRef] [Green Version]
  84. Cortes-Briones, J.A.; Cahill, J.D.; Skosnik, P.D.; Mathalon, D.H.; Williams, A.; Sewell, R.A.; Roach, B.J.; Ford, J.M.; Ranganathan, M.; D’Souza, D.C. The psychosis-like effects of Δ9-tetrahydrocannabinol are associated with increased cortical noise in healthy humans. Biol. Psychiatry 2015, 78, 805–813. [Google Scholar] [CrossRef] [Green Version]
  85. Bragulla, H.H.; Homberger, D.G. Structure and functions of keratin proteins in simple, stratified, keratinized and cornified epithelia. J. Anat. 2009, 214, 516–559. [Google Scholar] [CrossRef] [PubMed]
  86. Dmello, C.; Srivastava, S.S.; Tiwari, R.; Chaudhari, P.R.; Sawant, S.; Vaidya, M.M. Multifaceted role of keratins in epithelial cell differentiation and transformation. J. Biosci. 2019, 44, 1–16. [Google Scholar] [CrossRef]
  87. Pan, X.; Hobbs, R.P.; Coulombe, P.A. The expanding significance of keratin intermediate filaments in normal and diseased epithelia. Curr. Opin. Cell Biol. 2013, 25, 47–56. [Google Scholar] [CrossRef] [Green Version]
  88. Alam, H.; Sehgal, L.; Kundu, S.T.; Dalal, S.N.; Vaidya, M.M. Novel function of keratins 5 and 14 in proliferation and differentiation of stratified epithelial cells. Mol. Biol. Cell 2011, 22, 4068–4078. [Google Scholar] [CrossRef] [PubMed]
  89. Ramms, L.; Fabris, G.; Windoffer, R.; Schwarz, N.; Springer, R.; Zhou, C.; Lazar, J.; Stiefel, S.; Hersch, N.; Schnakenberg, U. Keratins as the main component for the mechanical integrity of keratinocytes. Proc. Natl. Acad. Sci. USA 2013, 110, 18513–18518. [Google Scholar] [CrossRef] [Green Version]
  90. Gu, L.-H.; Coulombe, P.A. Keratin function in skin epithelia: A broadening palette with surprising shades. Curr. Opin. Cell Biol. 2007, 19, 13–23. [Google Scholar] [CrossRef]
  91. Yi, H.; Yoon, H.-N.; Kim, S.; Ku, N.-O. The role of keratins in the digestive system: Lessons from transgenic mouse models. Histochem. Cell Biol. 2018, 150, 351–359. [Google Scholar] [CrossRef]
  92. Tolosano, E. Increasing serum transferrin to reduce tissue iron overload due to ineffective erythropoiesis. Haematologica 2015, 100, 565. [Google Scholar] [CrossRef] [PubMed] [Green Version]
  93. Nedumaran, B.; Rudra, P.; Gaydos, J.; Kumar, S.; Meacham, R.B.; Burnham, E.L.; Malykhina, A.P. Impact of regular Cannabis use on biomarkers of lower urinary tract function. Urology 2017, 109, 223.e9–223.e16. [Google Scholar] [CrossRef]
  94. Kelsen, S.G.; Duan, X.; Ji, R.; Perez, O.; Liu, C.; Merali, S. Cigarette smoke induces an unfolded protein response in the human lung: A proteomic approach. Am. J. Respir. Cell Mol. Biol. 2008, 38, 541–550. [Google Scholar] [CrossRef] [PubMed]
  95. Richardson, S.J.; Wijayagunaratne, R.C.; D’Souza, D.G.; Darras, V.M.; Van Herck, S.L. Transport of thyroid hormones via the choroid plexus into the brain: The roles of transthyretin and thyroid hormone transmembrane transporters. Front. Neurosci. 2015, 9, 66. [Google Scholar] [CrossRef] [Green Version]
  96. Ghadami, S.A.; Chia, S.; Ruggeri, F.S.; Meisl, G.; Bemporad, F.; Habchi, J.; Cascella, R.; Dobson, C.M.; Vendruscolo, M.; Knowles, T.P. Transthyretin inhibits primary and secondary nucleations of amyloid-β peptide aggregation and reduces the toxicity of its oligomers. Biomacromolecules 2020, 21, 1112–1125. [Google Scholar] [CrossRef]
  97. Li, X.; Zhang, X.; Ladiwala, A.R.A.; Du, D.; Yadav, J.K.; Tessier, P.M.; Wright, P.E.; Kelly, J.W.; Buxbaum, J.N. Mechanisms of transthyretin inhibition of β-amyloid aggregation in vitro. J. Neurosci. 2013, 33, 19423–19433. [Google Scholar] [CrossRef]
  98. Dorrington, M.G.; Fraser, I.D. NF-κB signaling in macrophages: Dynamics, crosstalk, and signal integration. Front. Immunol. 2019, 10, 705. [Google Scholar] [CrossRef] [PubMed]
  99. Vereecke, L.; Beyaert, R.; van Loo, G. Genetic relationships between A20/TNFAIP3, chronic inflammation and autoimmune disease. Biochem. Soc. Trans. 2011, 39, 1086–1091. [Google Scholar] [CrossRef] [Green Version]
  100. Majumdar, I.; Ahuja, V.; Paul, J. Altered expression of tumor necrosis factor alpha-induced protein 3 correlates with disease severity in ulcerative colitis. Sci. Rep. 2017, 7, 1–13. [Google Scholar] [CrossRef] [PubMed]
  101. Wang, Z.; Zhang, Z.; Yuan, J.; Li, L. Altered TNFAIP3 mRNA expression in peripheral blood mononuclear cells from patients with rheumatoid arthritis. Biomed. Rep. 2015, 3, 675–680. [Google Scholar] [CrossRef] [Green Version]
  102. Jiang, X.; Tian, H.; Fan, Y.; Chen, J.; Song, Y.; Wang, S.; Zhu, F.; Guo, C.; Zhang, L.; Shi, Y. Expression of tumor necrosis factor alpha-induced protein 3 mRNA in peripheral blood mononuclear cells negatively correlates with disease severity in psoriasis vulgaris. Clin. Vaccine Immunol. 2012, 19, 1938–1942. [Google Scholar] [CrossRef] [Green Version]
  103. Hadisaputri, Y.E.; Miyazaki, T.; Yokobori, T.; Sohda, M.; Sakai, M.; Ozawa, D.; Hara, K.; Honjo, H.; Kumakura, Y.; Kuwano, H. TNFAIP3 overexpression is an independent factor for poor survival in esophageal squamous cell carcinoma. Int. J. Oncol. 2017, 50, 1002–1010. [Google Scholar] [CrossRef] [PubMed]
  104. Agajanian, M.; Campeau, A.; Hoover, M.; Hou, A.; Brambilla, D.; Kim, S.L.; Klemke, R.L.; Kelber, J.A. PEAK1 acts as a molecular switch to regulate context-dependent TGFβ responses in breast cancer. PLoS ONE 2015, 10, e0135748. [Google Scholar] [CrossRef]
  105. Croucher, D.R.; Hochgräfe, F.; Zhang, L.; Liu, L.; Lyons, R.J.; Rickwood, D.; Tactacan, C.M.; Browne, B.C.; Ali, N.; Chan, H. Involvement of Lyn and the atypical kinase SgK269/PEAK1 in a basal breast cancer signaling pathway. Cancer Res. 2013, 73, 1969–1980. [Google Scholar] [CrossRef] [PubMed] [Green Version]
  106. Ding, C.; Tang, W.; Fan, X.; Wang, X.; Wu, H.; Xu, H.; Xu, W.; Gao, W.; Wu, G. Overexpression of PEAK1 contributes to epithelial–mesenchymal transition and tumor metastasis in lung cancer through modulating ERK1/2 and JAK2 signaling. Cell Death Dis. 2018, 9, 1–13. [Google Scholar] [CrossRef] [PubMed] [Green Version]
  107. American Psychiatric Association. Diagnostic and Statistical Manual of Mental Disorders (DSM-5®); American Psychiatric Pub.: Washington, DC, USA, 2013. [Google Scholar]
  108. Chen, Y.Y.; Lin, S.Y.; Yeh, Y.Y.; Hsiao, H.H.; Wu, C.Y.; Chen, S.T.; Wang, A.H.J. A modified protein precipitation procedure for efficient removal of albumin from serum. Electrophoresis 2005, 26, 2117–2127. [Google Scholar] [CrossRef] [PubMed]
  109. Alfadda, A.A.; Benabdelkamel, H.; Masood, A.; Jammah, A.A.; Ekhzaimy, A.A. Differences in the plasma proteome of patients with hypothyroidism before and after thyroid hormone replacement: A proteomic analysis. Int. J. Mol. Sci. 2018, 19, 88. [Google Scholar] [CrossRef] [PubMed] [Green Version]
  110. Shevchenko, A.; Wilm, M.; Vorm, O.; Mann, M. Mass spectrometric sequencing of proteins from silver-stained polyacrylamide gels. Anal. Chem. 1996, 68, 850–858. [Google Scholar] [CrossRef] [PubMed]
  111. Masood, A.; Benabdelkamel, H.; Ekhzaimy, A.A.; Alfadda, A.A. Plasma-Based Proteomics Profiling of Patients with Hyperthyroidism after Antithyroid Treatment. Molecules 2020, 12, 2831. [Google Scholar] [CrossRef]
  112. Benabdelkamel, H.; Masood, A.; Almidani, G.M.; Alsadhan, A.A.; Bassas, A.F.; Duncan, M.W.; Alfadda, A.A. Mature adipocyte proteome reveals differentially altered protein abundances between lean, Overweight and morbidly obese human subjects. Mol. Cell Endocrinol. 2015, 401, 142–154. [Google Scholar] [CrossRef] [PubMed]
  113. Alfadda, A.A.; Benabdelkamel, H.; Masood, A.; Moustafa, A.; Sallam, R.; Bassas, A.; Duncan, M. Proteomic analysis of mature adipocytes from obese patients in relation to aging. Exp. Gerontol. 2013, 48, 1196–1203. [Google Scholar] [CrossRef] [PubMed]
Figure 1. Representative fluorescent proteins of a two-dimensional difference in gel electrophoresis (2D-DIGE) containing serum sample from Control labeled with Cy3 (A), Cannabis labeled with Cy5 (B), Pooled internal control labeled with Cy2 (C), and merged image (D).
Molecules 26 05311 g001
Figure 2. Fluorescence labeled (CyDyes)-2D-DIGE numbered spots indicate those proteins that were identified to be differentially abundant (defined as fold-change >1.5, p < 0.05) between the two groups (controls and CUD). These were successfully identified with matrix-assisted laser desorption/ionization time of flight (MALDI-TOF) mass spectrometry (MS). MW, protein molecular weight; pI, isoelectric point.
Molecules 26 05311 g002
Figure 3. Differential expression of statistically significant protein spots from controls and cannabis-exposed samples.
Molecules 26 05311 g003
Figure 4. Principal component analysis of the proteomic dataset. Principal component analysis is presented in the figure where purple dots are the plasma samples from cannabis group and pink dots are from control group. Together, these explained 64% of the selected spot’s variability values. Colored dots and numbers are represented of the gels and spots, respectively.
Molecules 26 05311 g004
Figure 5. The most enriched interaction network of the differentially expressed proteins in control group as compared with the CUD group. Red nodes indicate upregulated; green nodes indicate downregulated. The central nodes of the pathway are involved in the signaling of the P38 MAPK, NFkB (complex), and Akt, and found to be deregulated between the two groups. Nodes that are not colored are analyzed by IPA and indicate potential targets that were functionally matched with the differentially expressed proteins. Direct molecular interactions are highlighted with solid lines, while indirect interactions are highlighted with dashed lines (A). The diagram shows the 21 top canonical pathways ranked by the p-values obtained by the IPA (B).
Molecules 26 05311 g005
Figure 6. Comparative analysis (%) of identified proteins of interest classified into different groups according to their molecular function (A), biological process (B), and cellular components (C).
Molecules 26 05311 g006
Figure 7. Western blot assay of the chosen proteins identified by 2D-DIGE analysis. Samples from CUD patients and controls were pooled together and used for western blot analysis. The results of Western blot study were similar to the findings of 2D-DIGE (A). Graphical analysis of the relative expression data of normalized protein blots between the control and CUD. The presented data are shown as histograms of the mean ± SD and * p > 0.05 (B).
Molecules 26 05311 g007
Table 1. Clinical and demographic information of the CUD and control groups recruited in the present study. HIV: Human immunodeficiency virus; HPC: Hepatitis C virus; TB: Tuberculosis.
CUD GroupControl Group
Number of patients 1010
Gender10 Male, 0 Female 10 Male, 0 Female
Age in years (Mean ± SD)24.7 ± 3.63 30.4 ± 4.36
Infectious diseases (HIV, HCV, TB)NegativeNegative
Cannabis dosage formSmokingNone
Cannabis use history
2–5 years4 PatientsNone
6–10 years3 PatientsNone
≥11 years3 PatientsNone
Table 2. Identified proteins with changes in abundance between CUD and control samples. The table displays average ratio values for control and treated samples with their corresponding levels of fold changes and p-values for one-way ANOVA (p-value < 0.05) using 2D-DIGE. Analysis type: MALDI-TOF; database: SwissProt; taxonomy: Homo sapiens. a Protein accession number for SWISSPROT Database. b p-Value (ANOVA). c Ratio between the groups d Protein expression between the groups.
Sl No:Spot No aAccession NoProtein NameMascot IDp-Value b
(ANOVA)
Ratio CB/C cExp d
Upregulated Proteins
84990Q5BJF6Outer dense fiber protein 2ODFP2_HUMAN0.052UP
101470P02647Apolipoprotein A-IAPOA1_HUMAN0.013.8UP
25185P01011Alpha-1-antichymotrypsinAACT_HUMAN0.022.7UP
791627P02647Apolipoprotein A-IAPOA1_HUMAN0.042.6UP
701180Q8TED0U3 small nucleolar RNA-associated protein 15 homologUTP15_HUMAN0.032.6UP
161322P00739Haptoglobin-related proteinHPTR_HUMAN0.012.4UP
81993Q7Z398Zinc finger protein 550ZN550_HUMAN0.042.4UP
81226Q9H254Spectrin beta chain, non-erythrocytic 4SPTN4_HUMAN0.012.3UP
51797P13645Keratin, type I cytoskeletal 10K1C10_HUMAN0.0072.2UP
421260P02647Apolipoprotein A-IAPOA1_HUMAN0.042.1UP
201427Q9BZ29Dedicator of cytokinesis protein 9DOCK9_HUMAN0.022.1UP
58886P00738HaptoglobinHPT_HUMAN0.022.1UP
112676P02749Beta-2-glycoprotein 1APOH_HUMAN0.052UP
401475Q3L8U1Chromodomain-helicase-DNA-binding protein 9CHD9_HUMAN0.042.0UP
30334P02790HemopexinHEMO_HUMAN0.042UP
461705O15226NF-kappa-B-repressing factorNKRF_HUMAN0.02UP
411295Q969Q6Serine/threonine-protein phosphatase 2A regulatory subunit B’’ subunit gammaP2R3C_HUMAN0.052.0UP
931908P02647Apolipoprotein A-IAPOA1_HUMAN0.031.9UP
64903O95389Cellular communication network factor 6WISP3_HUMAN0.031.9UP
77953P00738HaptoglobinHPT_HUMAN0.041.9UP
99796P00738HaptoglobinHPT_HUMAN0.021.9UP
91487P01834Immunoglobulin kappa constantIGKC_HUMAN0.011.9UP
361231P13645Keratin, type I cytoskeletal 10K1C10_HUMAN0.041.9UP
100987Q709C8Vacuolar protein sorting-associated protein 13CVP13C_HUMAN0.031.9UP
92981P06727Apolipoprotein A-IVAPOA4_HUMAN0.041.8UP
96623Q92608Dedicator of cytokinesis protein 2DOCK2_HUMAN0.021.8UP
211120O75648Mitochondrial tRNA-specific 2-thiouridylase 1MTU1_HUMAN0.021.8UP
61937Q5T6V5Queuosine salvage proteinCI064_HUMAN0.0081.8UP
21792P02766TransthyretinTTHY_HUMAN0.0051.8UP
761865P02766TransthyretinTTHY_HUMAN0.041.8UP
59457Q96M63Coiled-coil domain-containing protein 114CC114_HUMAN0.051.7UP
611305Q12852Mitogen-activated protein kinase kinase kinase 12M3K12_HUMAN0.031.7UP
83974P35558Phosphoenolpyruvate carboxykinase, cytosolic [GTP]PCKGC_HUMAN0.051.7UP
115714Q02156Protein kinase C epsilon typeKPCE_HUMAN0.041.7UP
221759P02766TransthyretinTTHY_HUMAN0.021.7UP
671067Q9NQW7Xaa-Pro aminopeptidase 1XPP1_HUMAN0.031.7UP
801659P02647Apolipoprotein A-IAPOA1_HUMAN0.041.6UP
571446Q9BV73Centrosome-associated protein CEP250CP250_HUMAN0.031.6UP
121136O75636Ficolin-3FCN3_HUMAN0.021.6UP
511277O75636Ficolin-3FCN3_HUMAN0.051.6UP
471132Q92896Golgi apparatus protein 1GSLG1_HUMAN0.051.6UP
118797P00738HaptoglobinHPT_HUMAN0.041.6UP
441962P13645Keratin, type I cytoskeletal 10K1C10_HUMAN0.041.6UP
231193P04264Keratin, type II cytoskeletal 1K2C1_HUMAN0.021.6UP
87955Q5BJF6Outer dense fiber protein 2ODFP2_HUMAN0.051.6UP
391784P02753Retinol-binding protein 4RET4_HUMAN0.041.6UP
561669P02753Retinol-binding protein 4RET4_HUMAN0.021.6UP
351473Q9HBT8Zinc finger protein 286AZ286A_HUMAN0.041.6UP
551138Q6ZN19Zinc finger protein 841ZN841_HUMAN0.021.6UP
105788A8TX70Collagen alpha-5(VI) chainCO6A5_HUMAN0.041.5UP
97771Q96EH8E3 ubiquitin-protein ligase NEURL3LINCR_HUMAN0.051.5UP
851211P04264Keratin, type II cytoskeletal 1K2C1_HUMAN0.051.5UP
90913P02538Keratin, type II cytoskeletal 6AK2C6A_HUMAN0.041.5UP
891039P78332RNA-binding protein 6RBM6_HUMAN0.051.5UP
321563P18206VinculinVINC_HUMAN0.041.5UP
Downregulated Proteins
882217P68871Hemoglobin subunit betaHBB_HUMAN0.05−5.0DOWN
942323P02042Hemoglobin subunit deltaHBD_HUMAN0.03−4.2DOWN
82562P19652Alpha-1-acid glycoprotein 2A1AG2_HUMAN0.04−3.7DOWN
95481Q5R372Rab GTPase-activating protein 1-likeRBG1L_HUMAN0.02−2.9DOWN
341448Q6ZNG0Zinc finger protein 620ZN620_HUMAN0.04−2.6DOWN
45456Q9HAC8Ubiquitin domain-containing protein 1UBTD1_HUMAN0.04−2.6DOWN
31450P01009Alpha-1-antitrypsinA1AT_HUMAN0.04−2.5DOWN
18385P02787SerotransferrinTRFE_HUMAN0.02−2.4DOWN
71082O43300Leucine-rich repeat transmembrane neuronal protein 2LRRT2_HUMAN0.009−2.3DOWN
11382P02787SerotransferrinTRFE_HUMAN0.01−2.2DOWN
33853P00738HaptoglobinHPT_HUMAN0.04−2.2DOWN
4860P02787SerotransferrinTRFE_HUMAN0.006−1.9DOWN
14865P00738HaptoglobinHPT_HUMAN0.01−1.9DOWN
17857Q07065Cytoskeleton-associated protein 4CKAP4_HUMAN0.01−1.9DOWN
27235P17039Zinc finger protein 30ZNF30_HUMAN0.026−1.9DOWN
38497P01009Alpha-1-antitrypsinA1AT_HUMAN0.04−1.9DOWN
481877P20472Parvalbumin alphaPRVA_HUMAN0.05−1.9DOWN
621394Q14204Cytoplasmic dynein 1 heavy chain 1DYHC1_HUMAN0.03−1.9DOWN
731106Q8TD57Dynein heavy chain 3, axonemalDYH3_HUMAN0.04−1.9DOWN
137P02774Vitamin D-binding proteinVTDB_HUMAN0.02−1.8DOWN
72388P00751Complement factor BCFAB_HUMAN0.03−1.8DOWN
3202P21580Tumor necrosis factor alpha-induced protein 3TNAP3_HUMAN0.005−1.7DOWN
29661P01009Alpha-1-antitrypsinA1AT_HUMAN0.04−1.7DOWN
43636Q99661Kinesin-like protein KIF2CKIF2C_HUMAN0.04−1.7DOWN
52354O60384Putative zinc finger protein 861YS022_HUMAN0.05−1.7DOWN
53650P01009Alpha-1-antitrypsinA1AT_HUMAN0.05−1.7DOWN
68423Q5R372Rab GTPase-activating protein 1-likeRBG1L_HUMAN0.03−1.7DOWN
71805P04637Cellular tumor antigen p53P53_HUMAN0.03−1.7DOWN
98341Q9P219Protein DapleDAPLE_HUMAN0.05−1.7DOWN
1041465P17017Zinc finger protein 14ZNF14_HUMAN0.03−1.7DOWN
15864P01024Complement C3CO3_HUMAN0.01−1.6DOWN
24108O75121Microfibrillar-associated protein 3-likeMFA3L_HUMAN0.02−1.6DOWN
26266P02768AlbuminALBU_HUMAN0.03−1.6DOWN
28357P08631Tyrosine protein kinase HCKHCK_HUMAN0.03−1.6DOWN
37548P02765Alpha-2-HS-glycoproteinFETUA_HUMAN0.04−1.6DOWN
541037Q14683Structural maintenance of chromosomes protein 1ASMC1A_HUMAN0.05−1.6DOWN
661083Q9UKX3Myosin-13MYH13_HUMAN0.03−1.6DOWN
74579P02768AlbuminALBU_HUMAN0.04−1.6DOWN
861054Q9H792Inactive tyrosine protein kinase PEAK1SG269_HUMAN0.05−1.6DOWN
102702Q9UM13Anaphase-promoting complex subunit 10APC10_HUMAN0.03−1.6DOWN
103533P02774Vitamin D-binding proteinVTDB_HUMAN0.03−1.6DOWN
108633P02768AlbuminALBU_HUMAN0.05−1.6DOWN
114537P02768AlbuminALBU_HUMAN0.05−1.6DOWN
120550Q8TE73Dynein heavy chain 5, axonemalDYH5_HUMAN0.05−1.6DOWN
1253Q9H792Inactive tyrosine protein kinase PEAK1SG269_HUMAN0.004−1.5DOWN
19820Q14585Zinc finger protein 345ZN345_HUMAN0.02−1.5DOWN
49504Q08999Retinoblastoma-like protein 2RBL2_HUMAN0.05−1.5DOWN
501484P02768AlbuminALBU_HUMAN0.05−1.5DOWN
60522Q9Y473Zinc finger protein 175ZN175_HUMAN0.03−1.5DOWN
6348P49792E3 SUMO-protein ligase RanBP2RBP2_HUMAN0.03−1.5DOWN
6528Q14624Inter-alpha-trypsin inhibitor heavy chain H4ITIH4_HUMAN0.03−1.5DOWN
691213Q14683Structural maintenance of chromosomes protein 1ASMC1A_HUMAN0.03−1.5DOWN
75215Q9Y4I1Unconventional myosin-VaMYO5A_HUMAN0.04−1.5DOWN
78528P02768AlbuminALBU_HUMAN0.04−1.5DOWN
91604Q6AW86Zinc finger protein 324BZ324B_HUMAN0.04−1.5DOWN
101732P25311Zinc-alpha-2-glycoproteinZA2G_HUMAN0.03−1.5DOWN
106584Q8TD57Dynein heavy chain 3, axonemalDYH3_HUMAN0.04−1.5DOWN
1071688P20472Parvalbumin alphaPRVA_HUMAN0.04−1.5DOWN
109709Q9NZM1MyoferlinMYOF_HUMAN0.05−1.5DOWN
110198P02768AlbuminALBU_HUMAN0.05−1.5DOWN
111743P01009Alpha-1-antitrypsinA1AT_HUMAN0.05−1.5DOWN
113556P20929NebulinNEBU_HUMAN0.05−1.5DOWN
116588Q96SZ6Mitochondrial tRNA methylthiotransferase CDK5RAP1CK5P1_HUMAN0.04−1.5DOWN
117275Q9Y473Zinc finger protein 175ZN175_HUMAN0.05−1.5DOWN
119768O76041NebuletteNEBL_HUMAN0.04−1.5DOWN
121549P51508Zinc finger protein 81ZNF81_HUMAN0.03−1.5DOWN
Publisher’s Note: MDPI stays neutral with regard to jurisdictional claims in published maps and institutional affiliations.

