
An Efficient Strategy for Enhancing the Adsorption of Antibiotics and Drugs from Aqueous Solutions Using an Effective Limestone-Activated Carbon–Alginate Nanocomposite

 , ,
, ,
Abstract
:1. Introduction
2. Results and Discussion
2.1. LS–AC–SG Structure and Characteristics
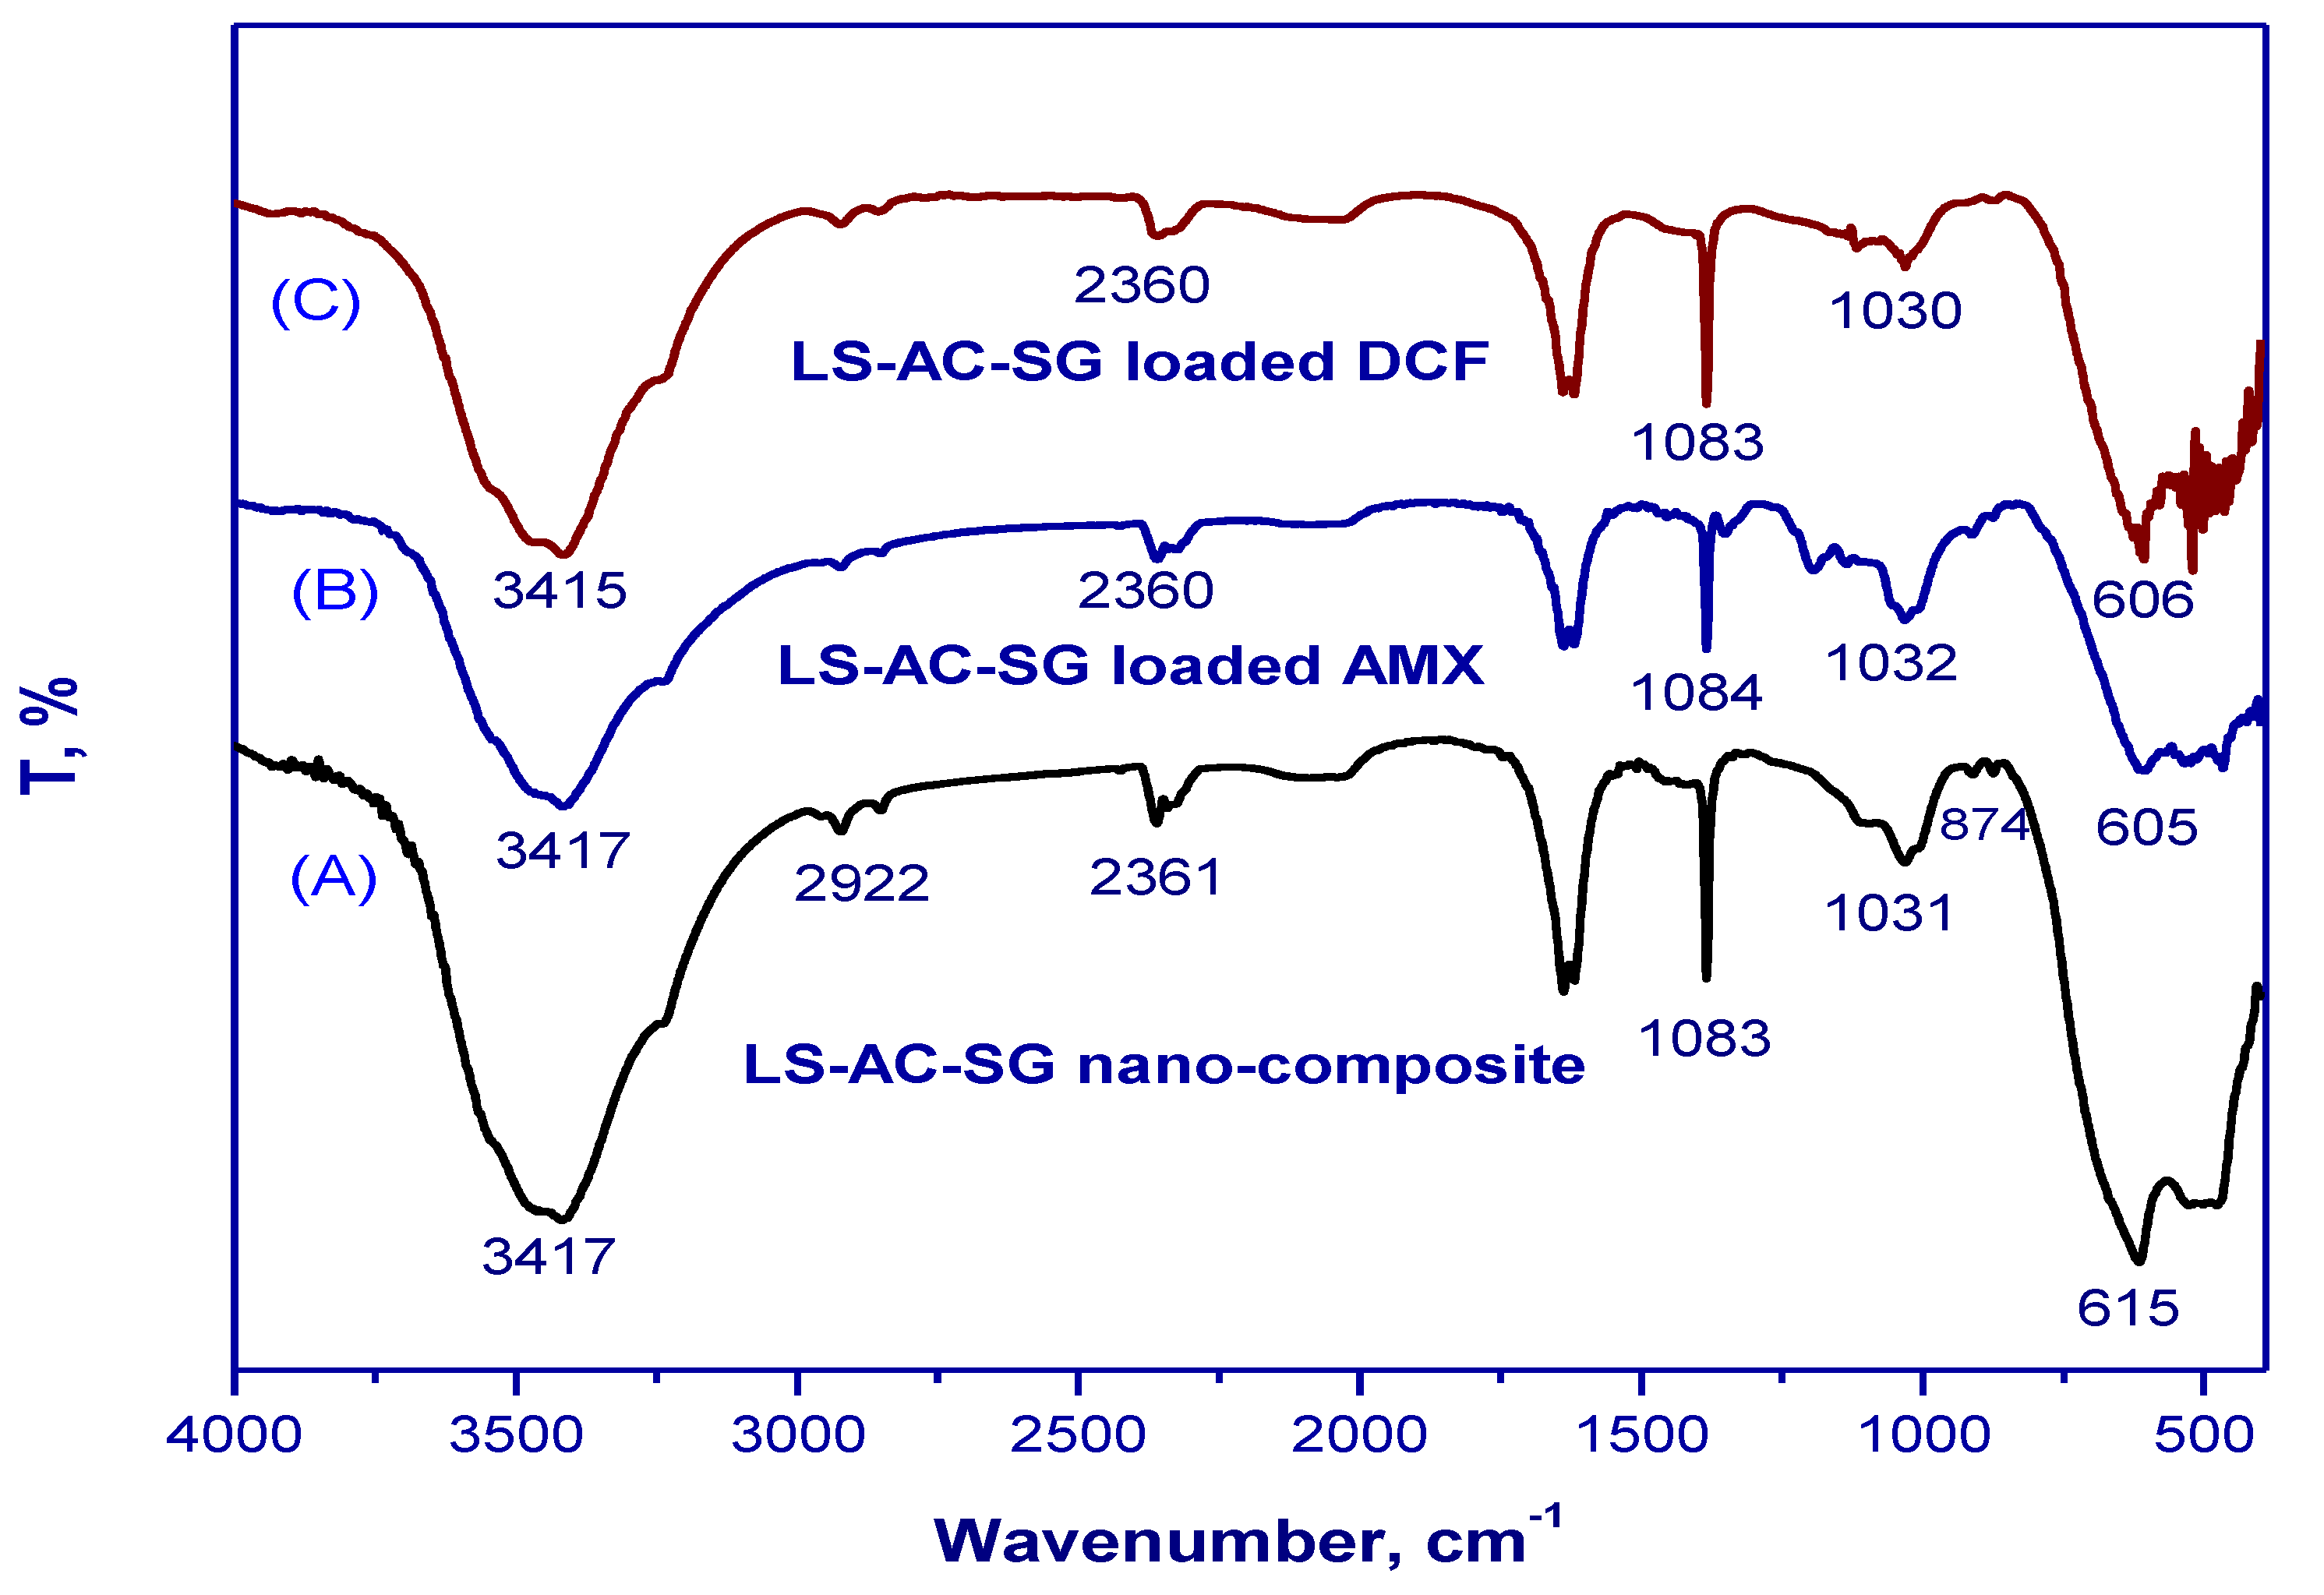
2.1.1. FTIR Study
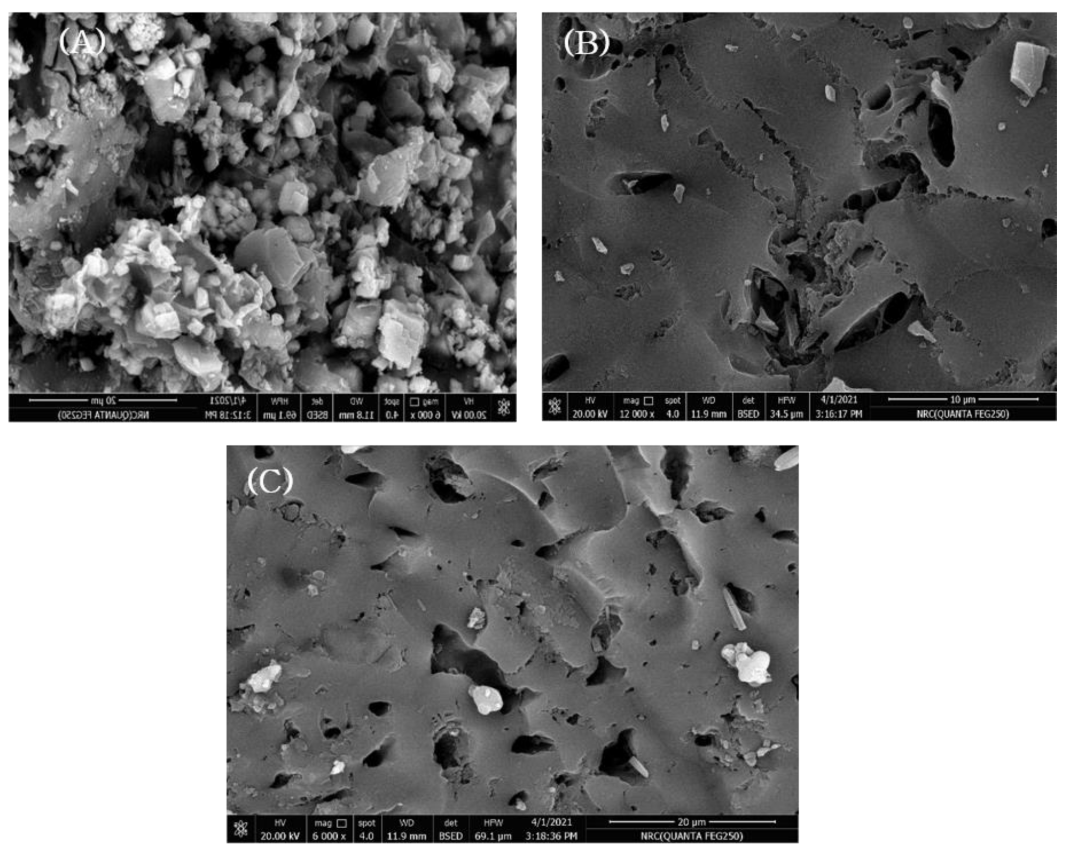
2.1.2. SEM Study
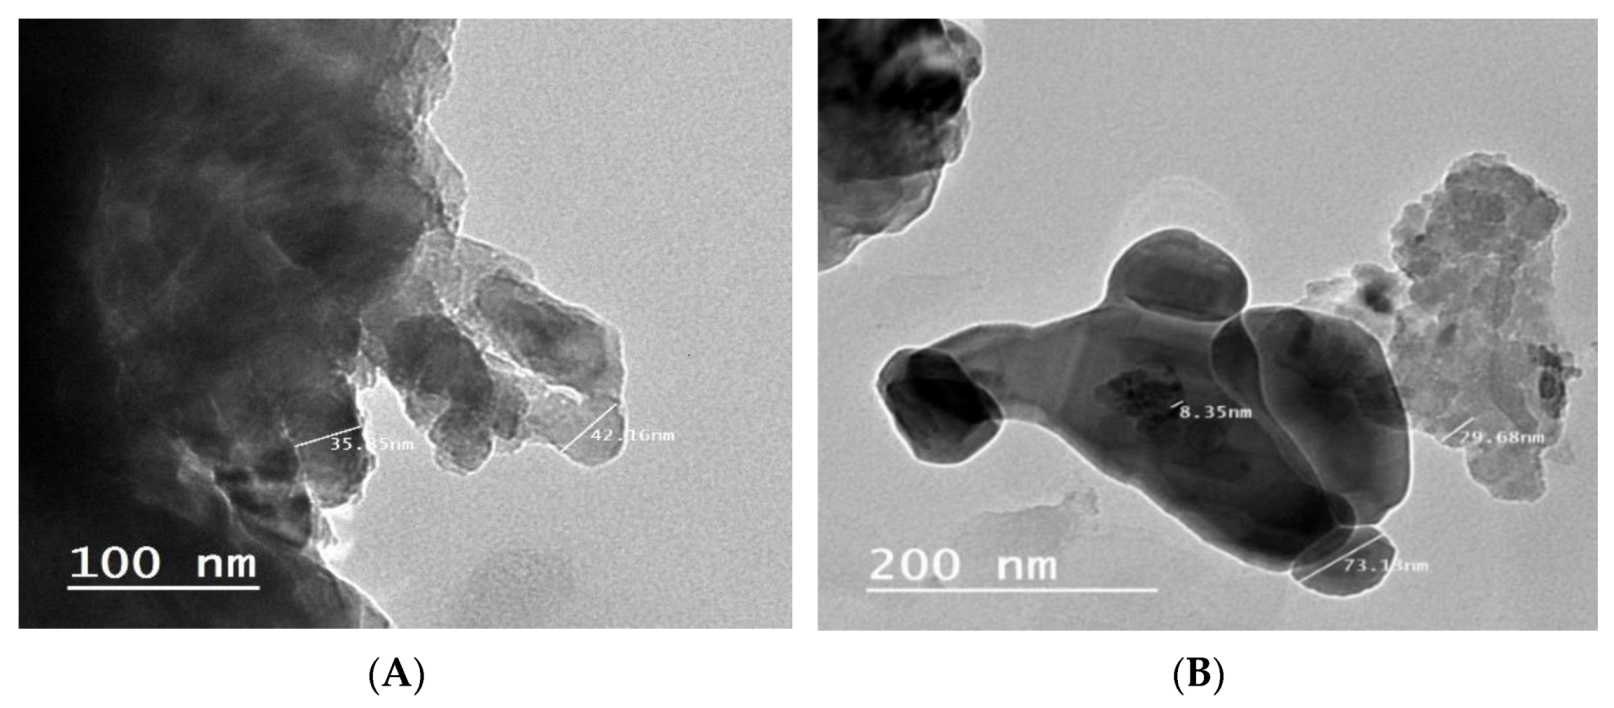
2.1.3. Transmission Electron Microscopy Study
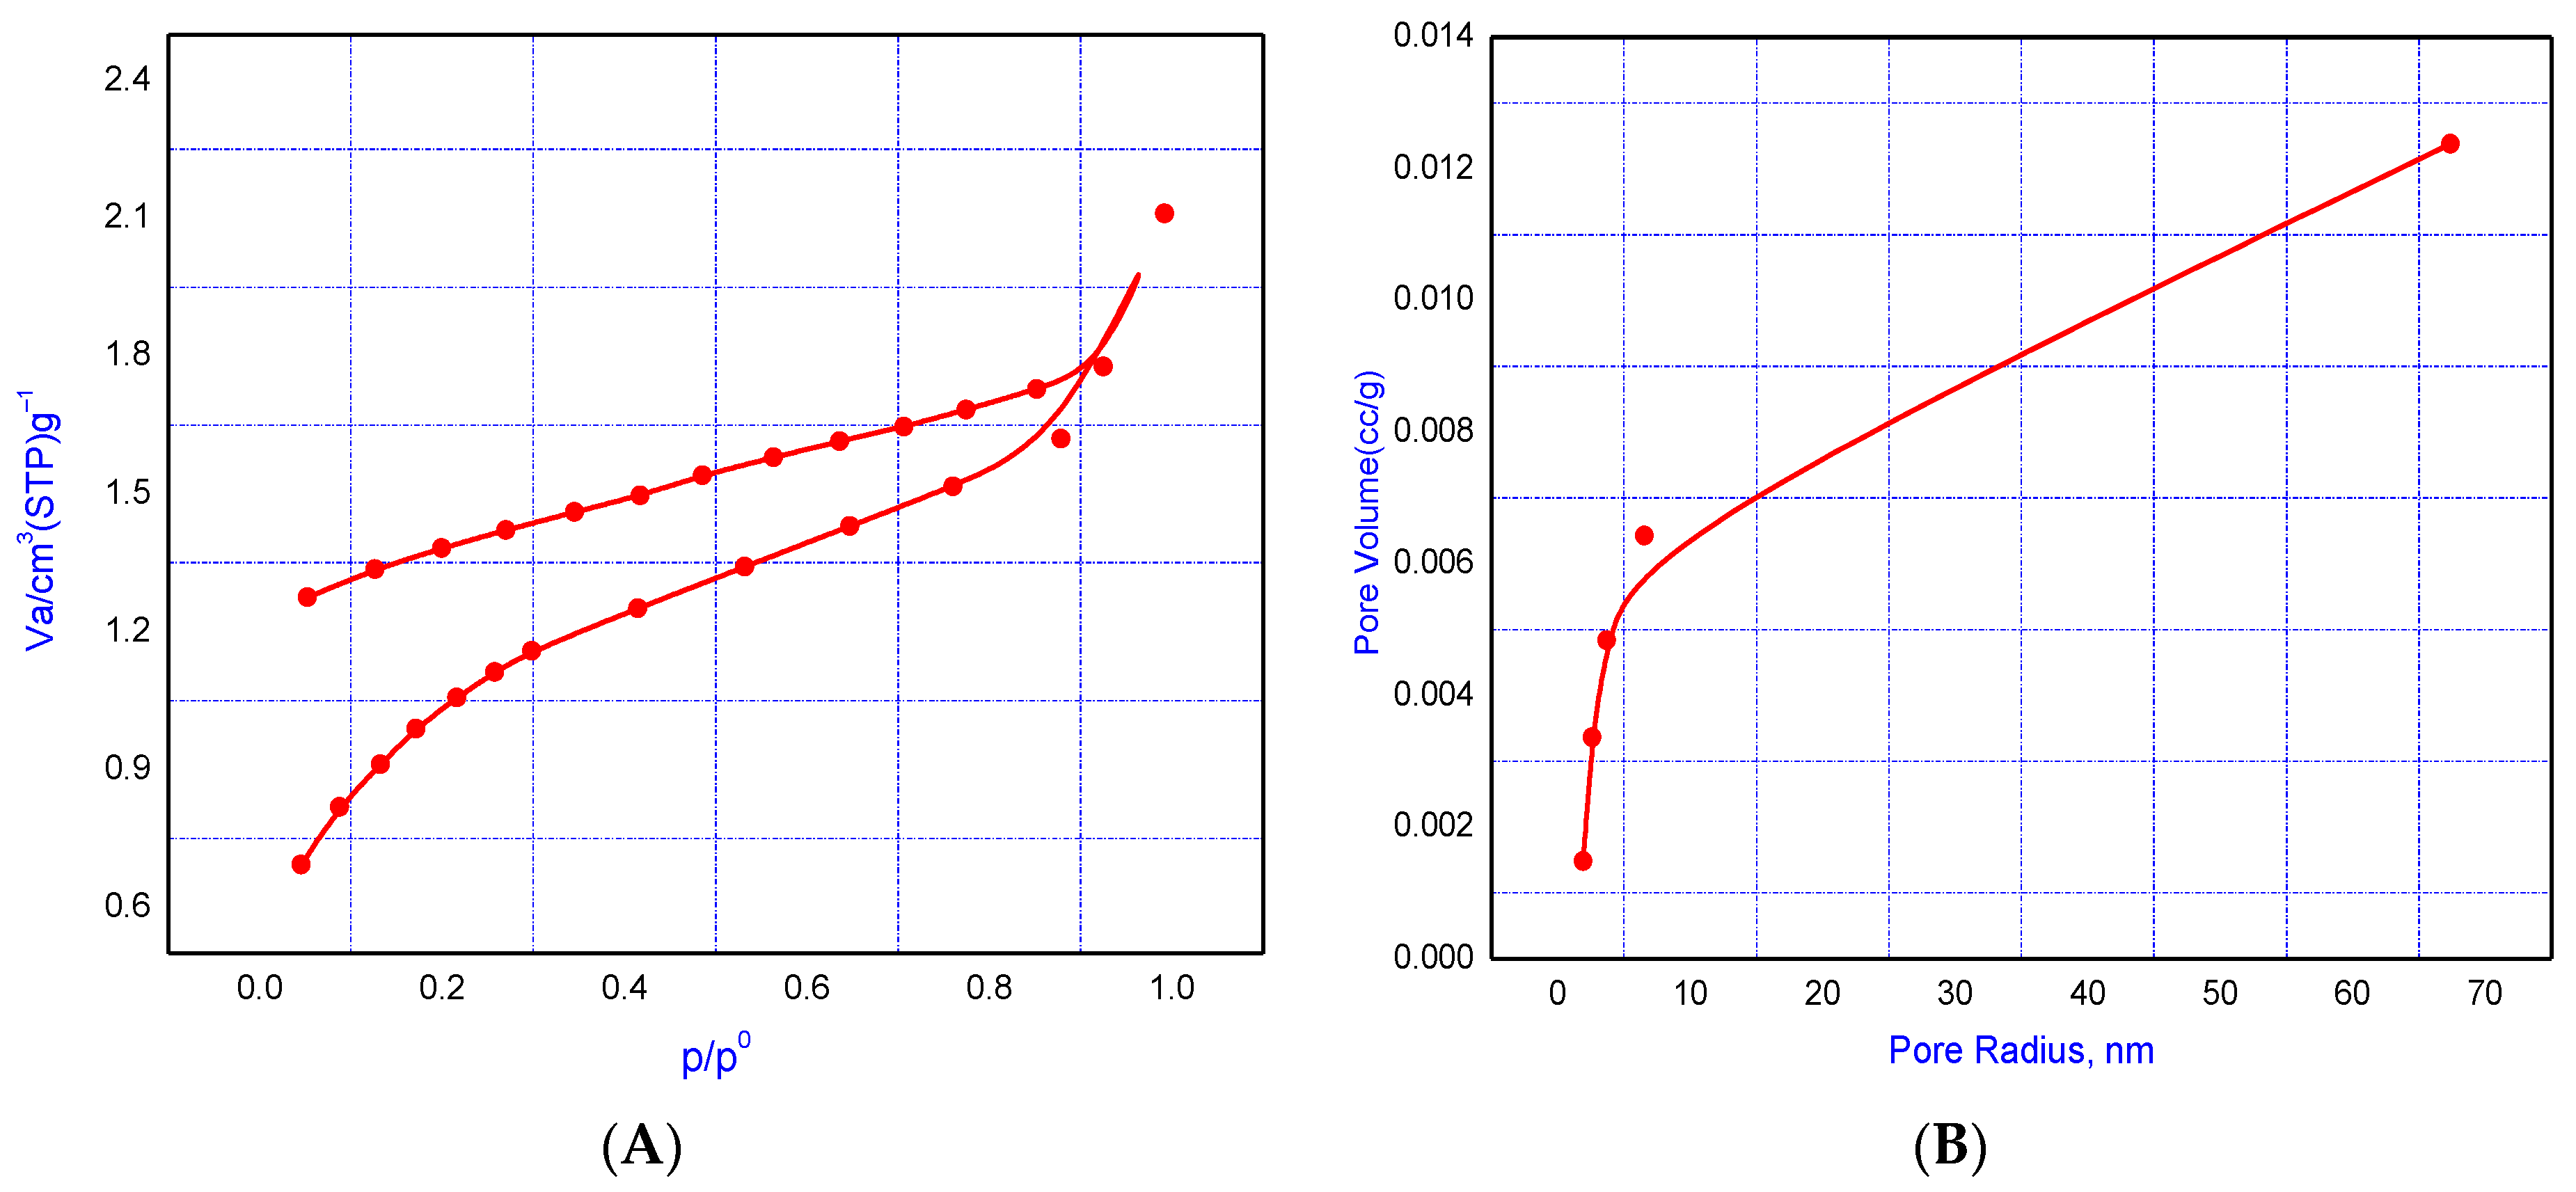
2.1.4. Adsorption–Desorption Measurements
2.2. Performance of the LS–AC–SG Nanocomposite
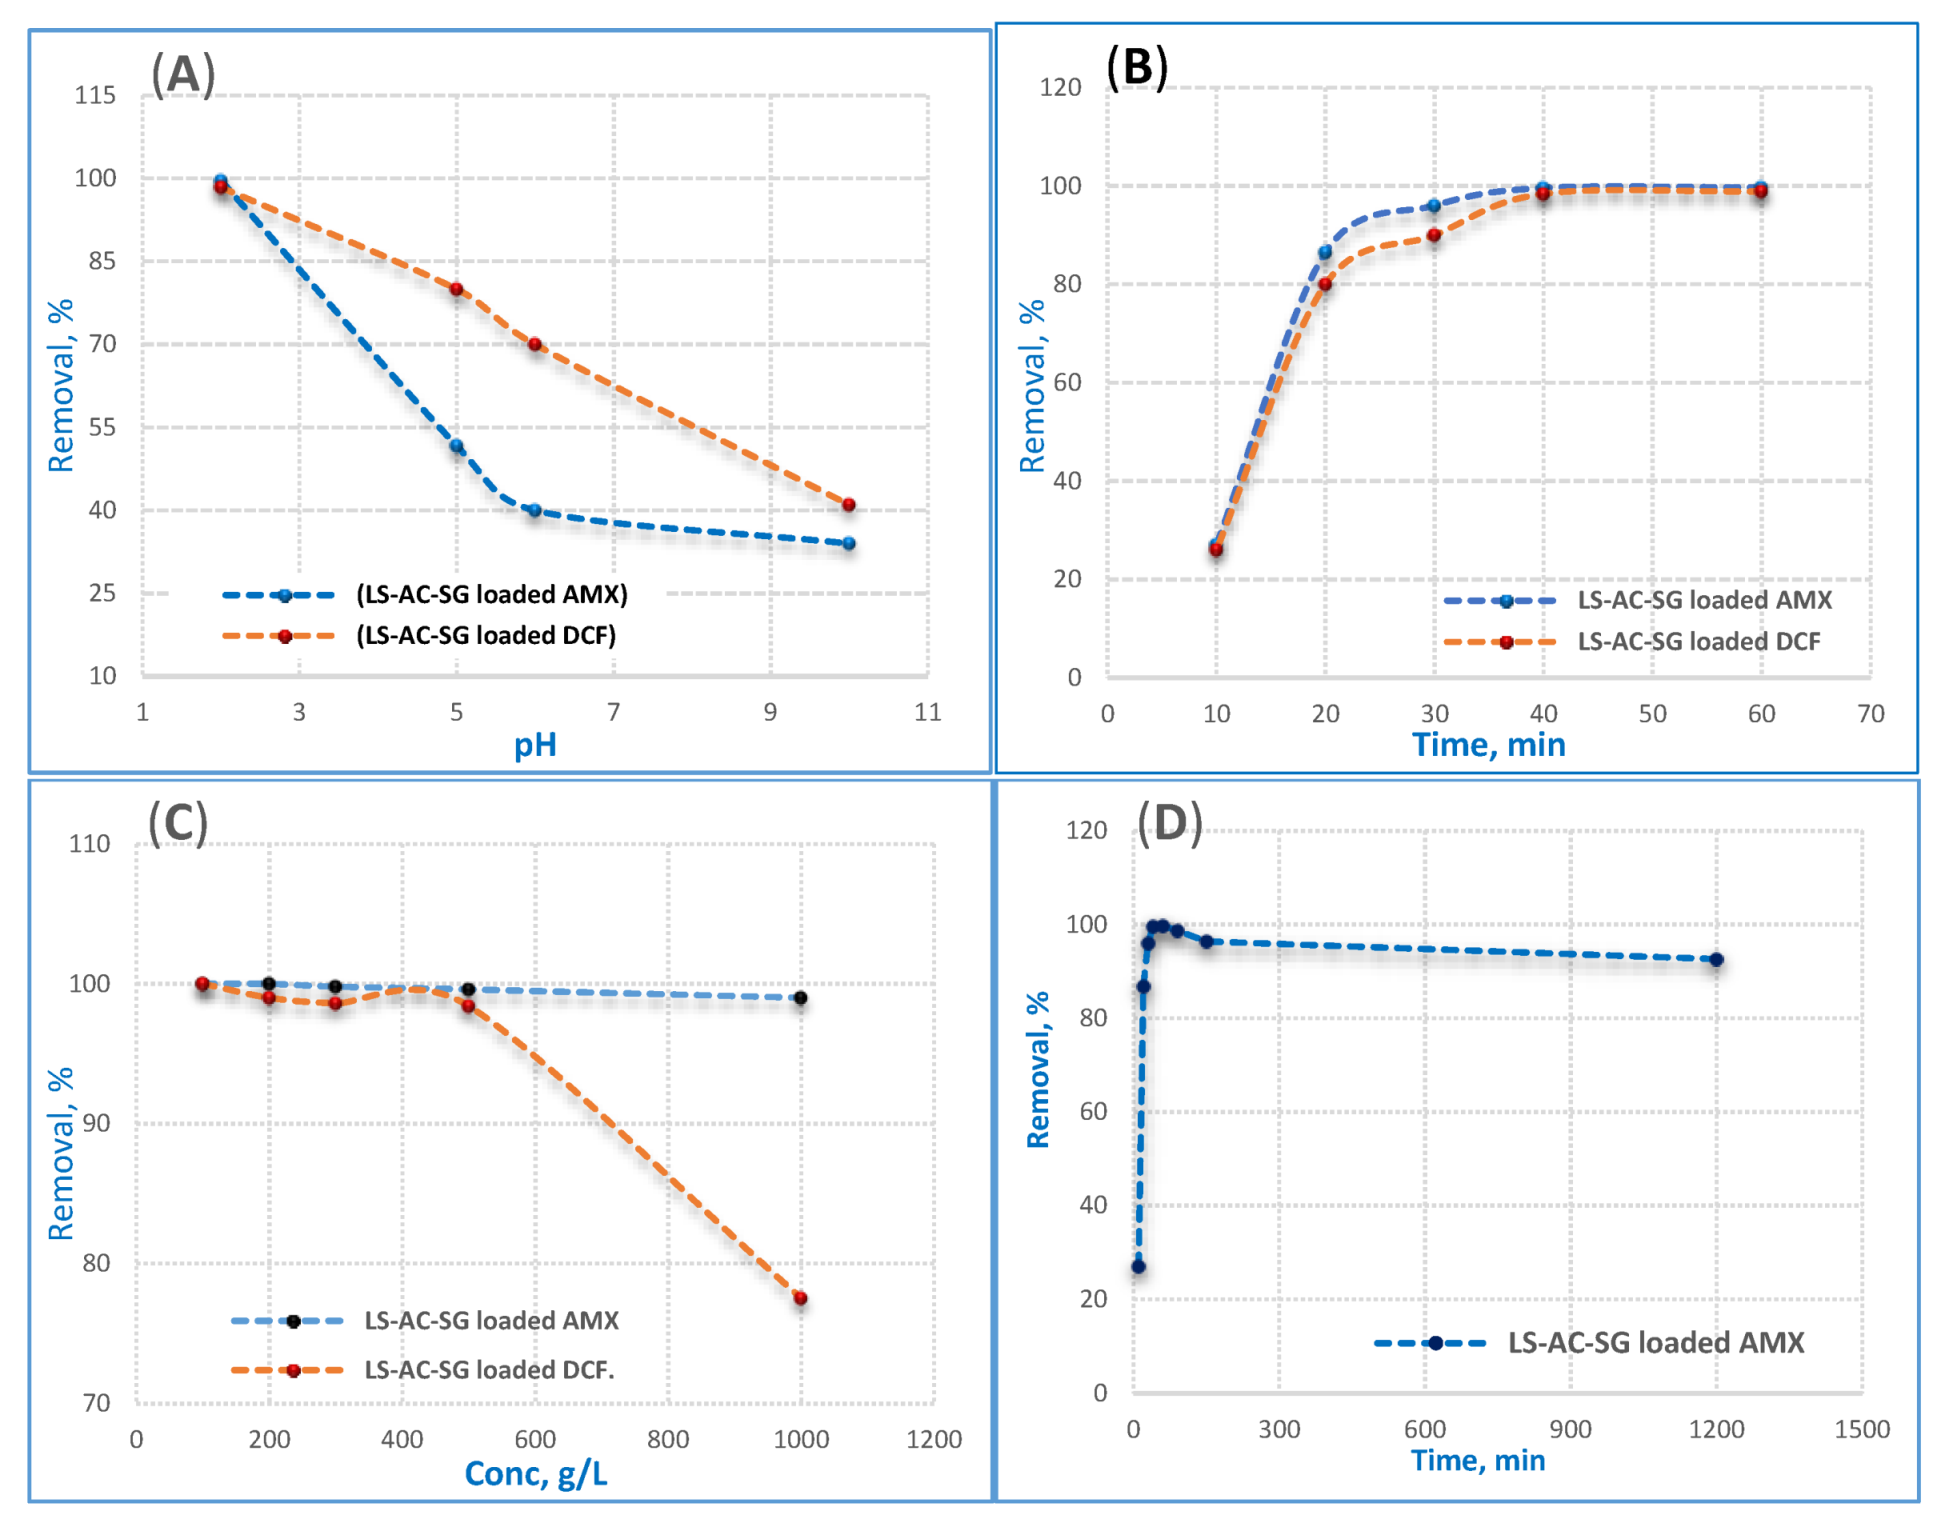
2.2.1. Effect of pH
2.2.2. Contact Time Effect
2.2.3. Effect of the AMX and DCF Concentrations
2.2.4. Long-Term pH Stability
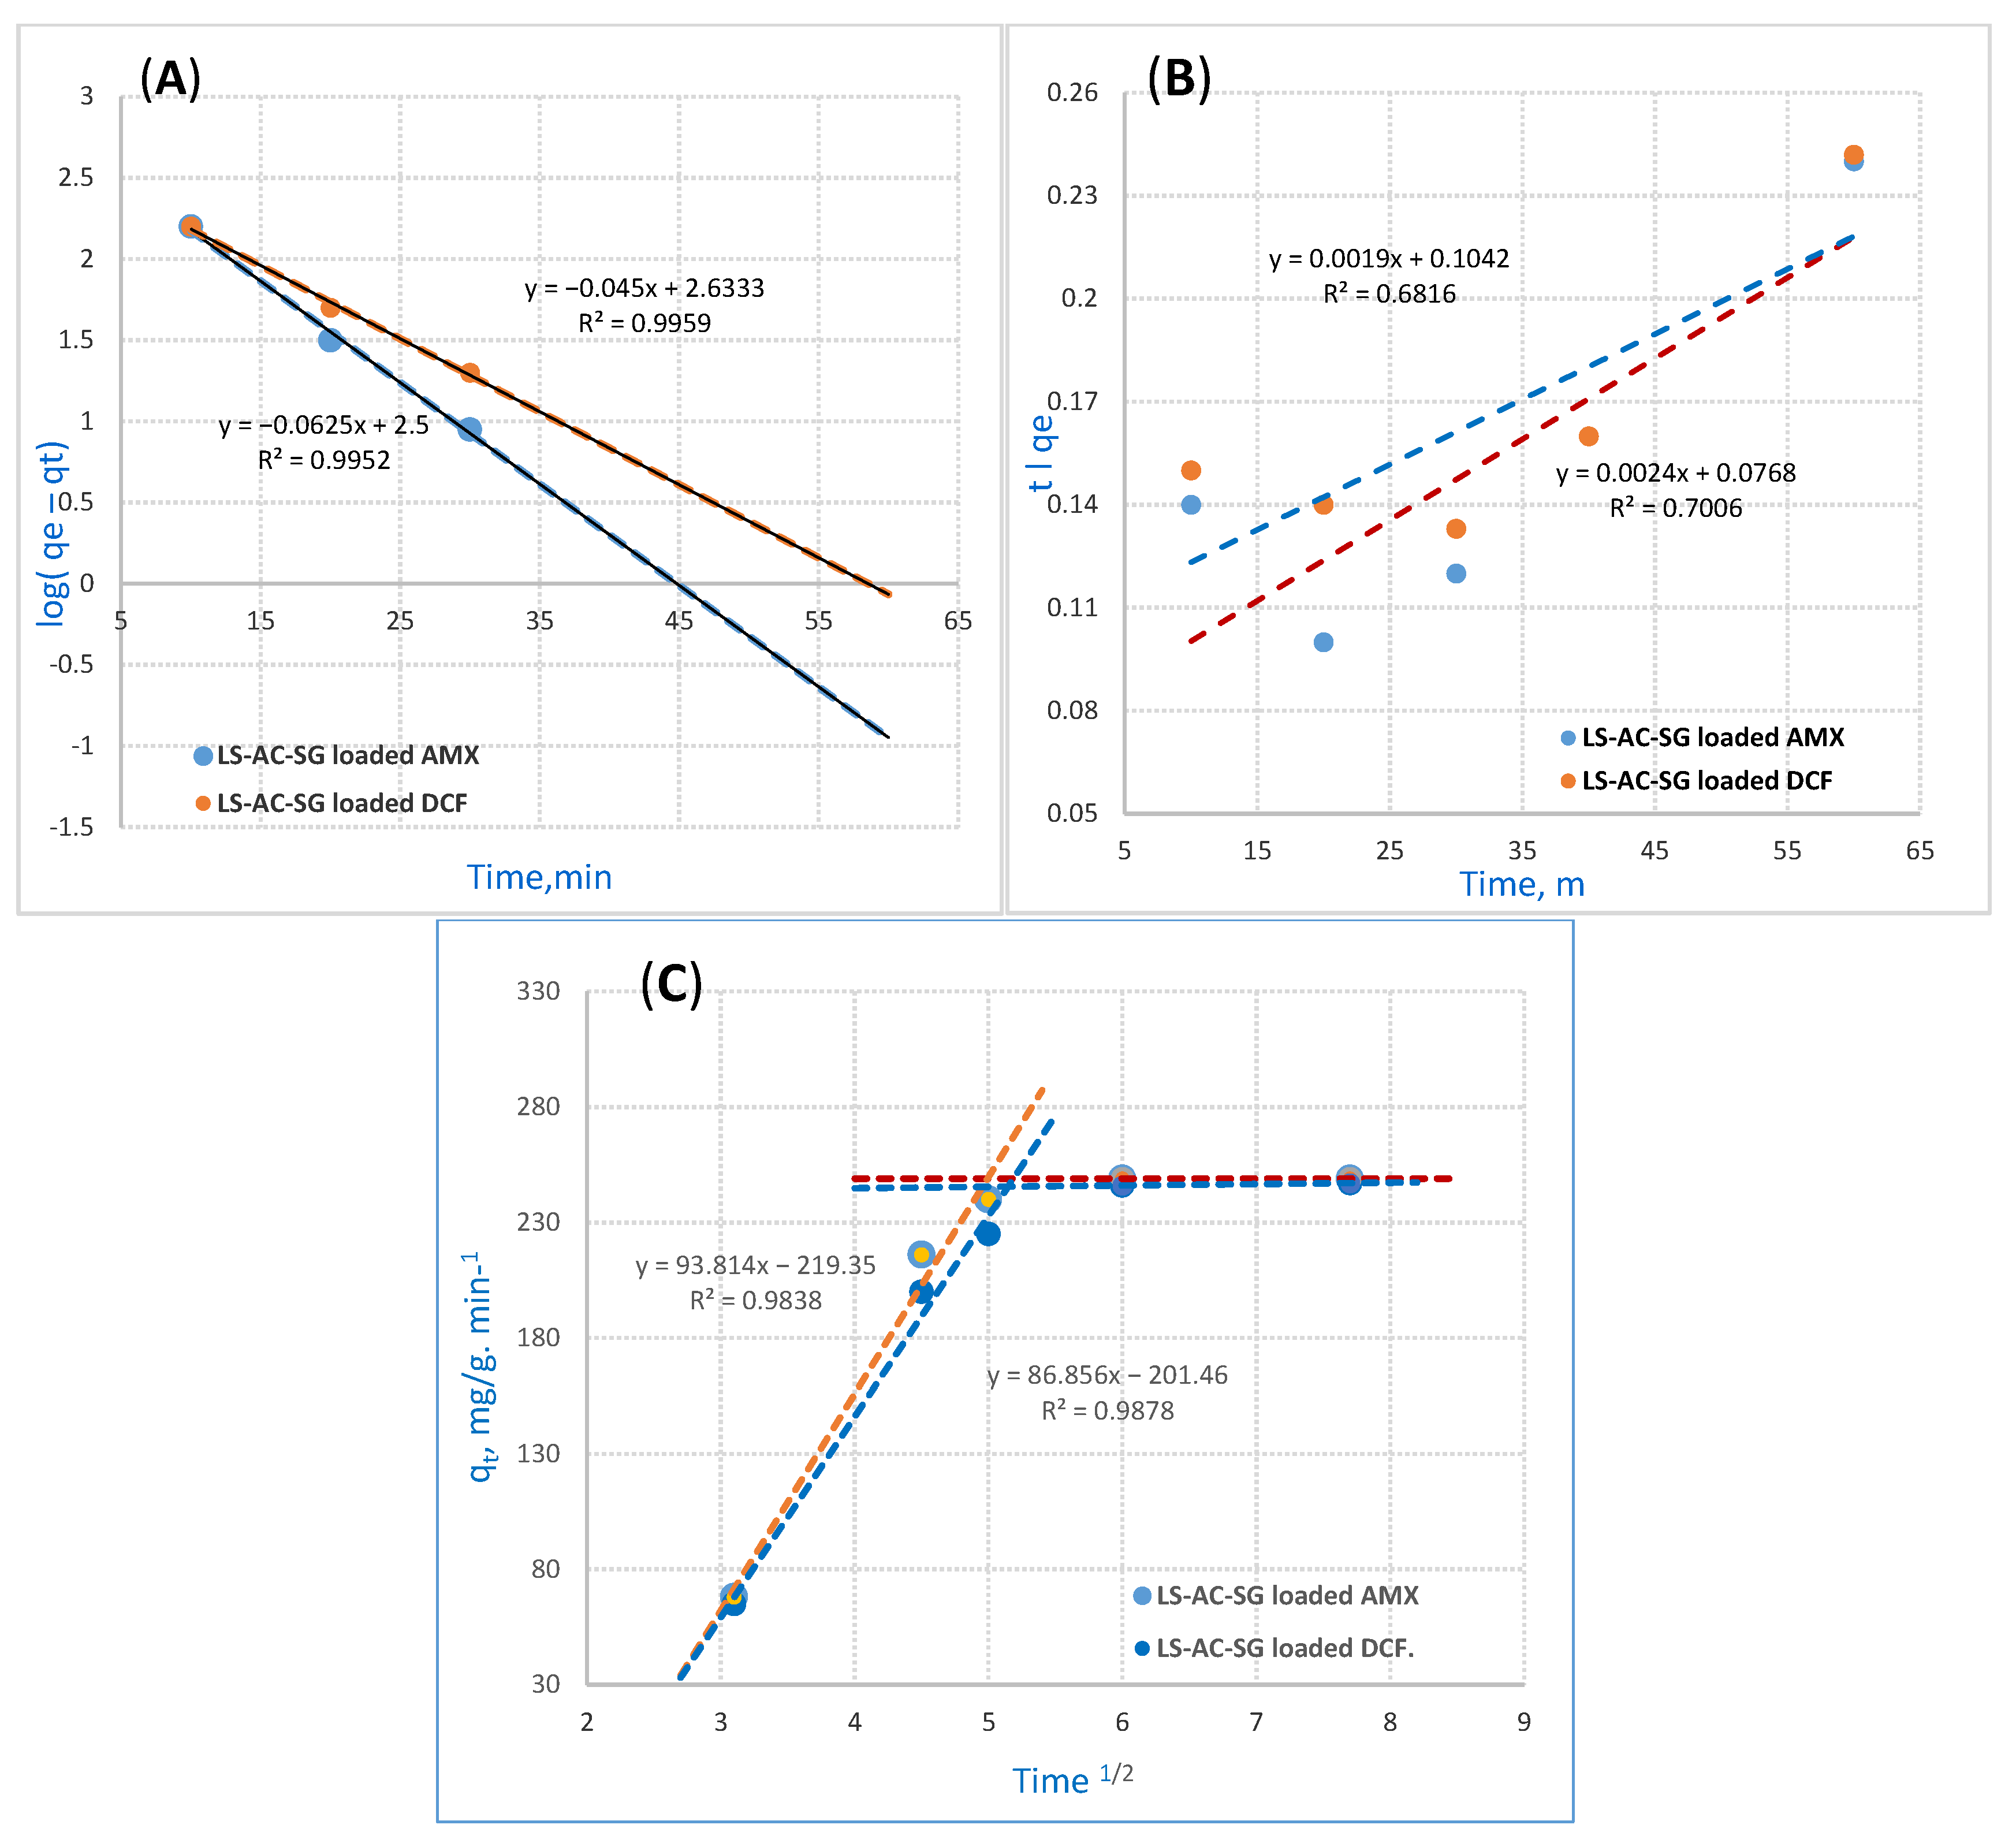
2.3. Kinetic Models
2.3.1. Pseudo-First-Order Reaction Kinetics
2.3.2. Pseudo-Second-Order Reaction
2.3.3. Mories–Weber Kinetic Equation
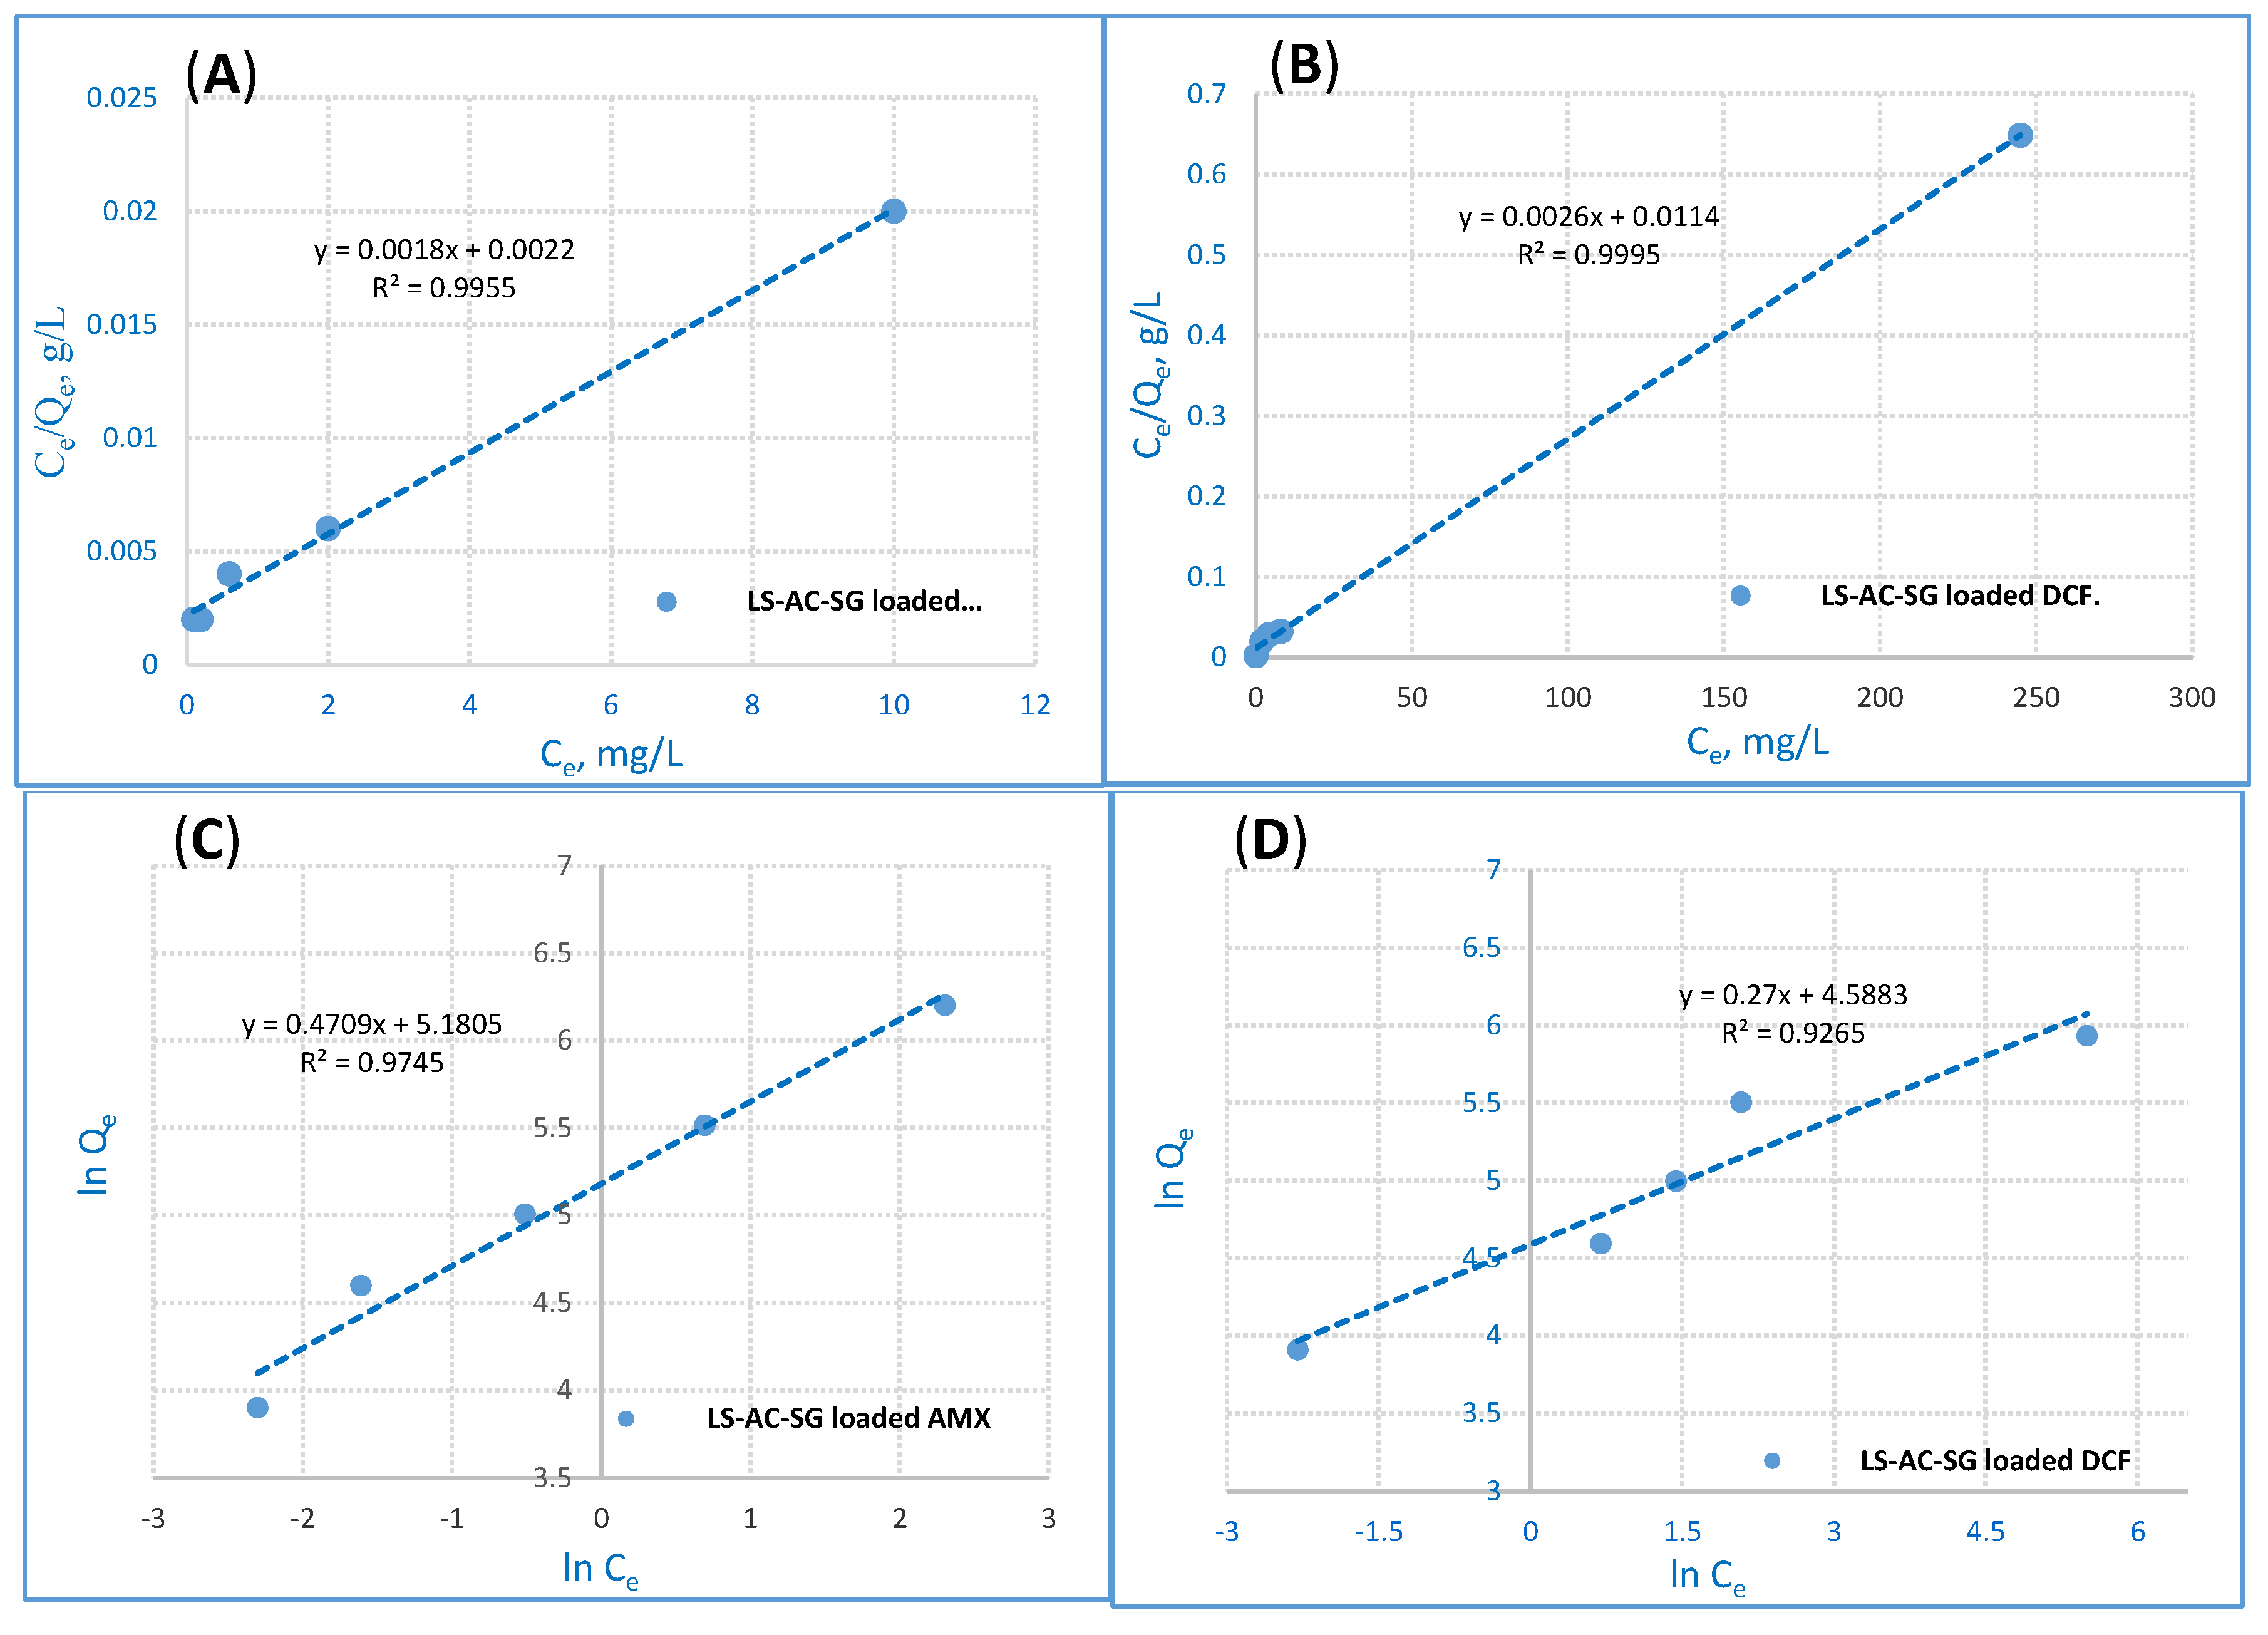
2.4. Isotherm Model
Dubinin–Radusekevisch–Kanager Isotherm
2.5. Sorption Thermodynamics
3. Experimental Procedures
3.1. Materials
3.2. Preparation of LS–AC–SG Nanocomposites
3.3. Surface Characterization of the Nanocomposites
3.3.1. Instruments
3.3.2. Adsorption Studies
4. Conclusions
Author Contributions
Funding
Data Availability Statement
Acknowledgments
Conflicts of Interest
Sample Availability
References
- Landers, T.F.; Cohen, B.; Wittum, T.E.; Larson, E.L. A review of antibiotic use in food animals: Perspective, policy, and potential. Public Health Rep. 2012, 127, 4–22. [Google Scholar] [CrossRef] [PubMed] [Green Version]
- Mathers, J.J.; Flick, S.C.; Cox, L.A. Longer-duration uses of tetracyclines and penicillins in U.S. food-producing animals: Indications and microbiologic effects. Environ. Int. 2011, 37, 991–1004. [Google Scholar] [CrossRef] [PubMed]
- Mohammed, N.A.; Omar, A.A. Removal of Antibiotics from Water by Polymer of Intrinsic Microporosity: Isotherms, Kinetics, Thermodynamics, and Adsorption Mechanism. Sci. Rep. 2020, 10, 794. [Google Scholar]
- Kümmerer, K. Antibiotics in the aquatic environment—A review—Part I. Chemosphere 2009, 75, 417–434. [Google Scholar] [CrossRef] [PubMed]
- Glassmeyer, S.T.; Hinchey, E.K.; Boehme, S.E.; Daughton, C.G.; Ruhoy, I.S.; Conerly, O.; Daniels, R.L.; Lauer, L.; McCarthy, M.; Nettesheim, T.G.; et al. Disposal practices for unwanted residential medications in the United States. Environ. Int. 2009, 35, 566–572. [Google Scholar] [CrossRef]
- Yan, C.; Yang, Y.; Zhou, J.; Liu, M.; Nie, M.; Shi, H.; Gu, L. Antibiotics in the surface water of the Yangtze Estuary: Occurrence, distribution and risk assessment. Environ. Pollut. 2013, 175, 22–29. [Google Scholar] [CrossRef]
- Lee, B. Removal of Antibiotics from Contaminated Waters Using Natural Zeolite. Master’s Thesis, The City University of New York, New York, NY, USA, August 2012. [Google Scholar]
- Karthikeyan, K.G.; Meyer, M.T. Occurrence of antibiotics in wastewater treatment facilities in Wisconsin, USA. Sci. Total Environ. 2006, 361, 196–207. [Google Scholar] [CrossRef]
- Watkinson, A.J.; Murby, E.J.; Kolpin, D.W.; Costanzo, S.D. The occurrence of antibiotics in an urban watershed: From wastewater to drinking water. Sci. Total Environ. 2009, 407, 2711–2723. [Google Scholar] [CrossRef]
- Xu, W.; Zhang, G.; Zou, S.; Li, X.; Liu, Y. Determination of selected antibiotics in the Victoria Harbour and the Pearl River, South China using high-performance liquid chromatography-electrospray ionization tandem mass spectrometry. Environ. Pollut. 2007, 145, 672–679. [Google Scholar] [CrossRef] [Green Version]
- Maichin, F.; Freitas, L.C.; Ortiz, N. The use of converter slag—Magnetite to decompose amoxicillin by Fenton Oxidation process. Orbital Electron. J. Chem. 2013, 5, 213–217. [Google Scholar]
- Mohammadi, A.; Kazemipour, M.; Ranjbar, H.; Walker, R.B.; Ansari, M. Amoxicillin removal from aqueous media using multi-walled carbon nanotubes. Fuller. Nanotub. Carbon Nanostruct. 2015, 23, 165–169. [Google Scholar] [CrossRef]
- Pezoti, O.; Cazetta, A.L.; Bedin, K.C.; Souza, L.S.; Martins, A.C.; Silva, T.L.; Júnior, O.O.S.; Visentainer, J.V.; Almeida, V.C. NaOH-activated carbon of high surface area produced from guava seeds as a high-efficiency adsorbent for amoxicillin removal: Kinetic, isotherm and thermodynamic studies. Chem. Eng. J. 2016, 288, 778–788. [Google Scholar] [CrossRef]
- Boukhelkhal, A.; Benkortbi, O.; Hamadeche, M.; Hanini, S.; Amrane, A. Removal of amoxicillin antibiotic from aqueous solution using an anionic surfactant. Water Air Soil Pollut. 2015, 226, 323–334. [Google Scholar] [CrossRef]
- McGettigan, P.; Henry, D. Use of Non-Steroidal Anti-Inflammatory Drugs That Elevate Cardiovascular Risk:An Examination of Sales and Essential Medicines Lists in Low-, Middle-, and High-Income Countries. PLoS Med. 2013, 10, e1001388. [Google Scholar] [CrossRef] [PubMed]
- Rivera-Utrilla, J.; Sanchez-Polo, M.; Ferro-Garcia, M.A.; Prados-Joya, G.; Ocampo-Perez, R. Pharmaceuticals as emerging contaminants and their removal from water. A review. Chemosphere 2013, 93, 1268–1287. [Google Scholar] [CrossRef]
- Näslund, J.; Fick, J.; Asker, N.; Ekman, E.; Larsson, D.G.J.; Norrgren, L. Diclofenac aects kidney histology in the three-spined stickleback (Gasterosteus aculeatus) at low g/L concentrations. Aquat. Toxicol. 2017, 189, 87–96. [Google Scholar] [CrossRef]
- Grandclément, C.; Piram, A.; Petit, M.E.; Seyssiecq, I.; Laont-Schwob, I.; Vanot, G.; Tiliacos, N.; Roche, N.; Doumenq, P. Biological removal and fate assessment of diclofenac using Bacillus subtilis and Brevibacillus laterosporus strains and ecotoxicological effects of diclofenac and 40-hydroxy-diclofenac. J. Chem. 2020, 2020, 9789420. [Google Scholar] [CrossRef]
- Binkley, C.E.; Cinti, S.; Simeone, D.M.; Colletti, L.M. Bacillus anthracis as an agent of bioterrorism: A review emphasizing surgical treatment. Ann. Surg. 2002, 236, 9–16. [Google Scholar] [CrossRef]
- Ding, S.; Huang, W.; Yang, S.; Mao, D.; Yuan, J.; Dai, Y.; Kong, J.; Sun, C.; He, H.; Li, S.; et al. Degradation of Azo dye direct black BN based on adsorption and microwave-induced catalytic reaction. Front. Environ. Sci. Eng. 2018, 12, 5. [Google Scholar] [CrossRef]
- Andreozzi, R.; Canterino, M.; Marotta, R.; Paxeus, N. Antibiotic removal from wastewaters: The ozonation of amoxicillin. J. Hazard. Mater. 2005, 122, 243–250. [Google Scholar] [CrossRef] [PubMed]
- Cunningham, J.H.; Lin, L.S. Fate of amoxicillin in mixedculture bioreactors and its effects on microbial growth and resistance to silver ions. Environ. Sci. Technol. 2010, 44, 1827–1832. [Google Scholar] [CrossRef]
- Feng, Z.; Zhu, L. Sorption of phenanthrene to biochar modified by base. Front. Environ. Sci. Eng. 2018, 12, 1. [Google Scholar] [CrossRef]
- Ikehata, K.; Jodeiri Naghashkar, N.; Gamal El-Din, M. Degradation of aqueous pharmaceuticals by ozonation and advanced oxidation processes: A review. Ozone Sci. Eng. 2006, 28, 353–414. [Google Scholar] [CrossRef]
- Abidin, N.A.Z.; Puganeshwary, P.; Mohd, S.Y.; Salem, S.A. Activated Carbon-Limestone-Alginate Beads for the Simultaneous Removal of Color and Turbidity of Kerian River. Int. J. Integr. Eng. 2019, 11, 32–39. [Google Scholar]
- Halim, A.A.; Aziz, H.A.; Johari, M.A.M.; Ariffin, K.S.; Adlan, M.N. Ammoniacal nitrogen and COD removal from semi-aerobic landfill leachate using a composite adsorbent: Fixed bed column adsorption performance. J. Hazard. Mater. 2010, 175, 960–964. [Google Scholar] [CrossRef]
- Thomas, B.N.; George, S.C. Production of Activated Carbon from Natural Sources. iMedPub J. 2015, 1, 1–5. [Google Scholar] [CrossRef]
- Devi, R.R.; Umlong, I.M.; Das, B.; Borah, K.; Thakur, A.J.; Raul, P.K.; Banerjee, S.; Singh, L. Removal of iron and arsenic (III) from drinking water using iron oxide-coated sand and limestone. Appl. Water Sci. 2014, 4, 175–182. [Google Scholar] [CrossRef] [Green Version]
- Varajic, B. Effective and Affordable Novel Arsenic Removal Technology. Honors College Capstone Experience/Thesis Projects. Bachelor’s Thesis, Western Kentucky University, Bowling Green, KY, USA, 2011. Paper 318. [Google Scholar]
- Eldin, M.S.M.; Soliman, E.A.; Elzatahry, A.A.F.; Elaassar, M.R.; Elkady, M.F.; Rahman, A.M.A.; Yossef, M.E.; Eweida, B.Y. Preparation and characterization of imino diacetic acid functionalized alginate beads for removal of contaminants from waste water: I. methylene blue cationic dye model. Desalin. Water Treat. 2012, 40, 15–23. [Google Scholar] [CrossRef]
- Benhouria, A.; Islam, M.A.; Zaghouane-Boudiaf, H.; Boutahala, M.; Hameed, B.H. Calcium alginate-bentonite-activated carbon composite beads as highly effective adsorbent for methylene blue. Chem. Eng. Sci. 2015, 270, 621–630. [Google Scholar] [CrossRef]
- Hameed, B.H.; Salman, J.M.; Ahmad, A.L. Adsorption isotherm and kinetic modeling of 2,4-D pesticide on activated carbon derived from date stones. J. Hazard. Mater. 2009, 163, 121–126. [Google Scholar] [CrossRef]
- Kamaruddin, M. Development of Carbon Mineral Composite Adsorbent. Ph.D. Thesis, Universiti Sains Malaysia, Gelugor, Malaysia, 2015. [Google Scholar]
- Wang, F.; Jiang, J.; Sun, F.; Sun, L.; Wang, T.; Liu, Y.; Li, M. Flexible wearable graphene/alginate composite non-woven fabric temperature sensor with high sensitivity and anti-interference. Cellulose 2020, 27, 2369–2380. [Google Scholar] [CrossRef]
- Moussavi, G.M. Removal of azo and anthraquinone reactive dyes from industrial wastewaters using MgO nanoparticles. J. Hazard. Mater. 2009, 168, 806–812. [Google Scholar] [CrossRef]
- Lionel, L.; Imen, G.; Abdelmottaleb, O.; Mejdi, J. Amoxicillin removal from aqueous solution using activated carbon prepared by chemical activation of olive stone. Environ. Sci. Pollut. Res. 2017, 24, 9993–10004. [Google Scholar]
- Lagergren, S. Zurtheorie der sogenannten adsorption gel sterstoffe. Sven. Vetensk. Handl. 1898, 24, 1–39. [Google Scholar]
- Ho, Y.; McKay, G. Pseudo-second order model for sorption processes. Process. Biochem. 1999, 34, 451–465. [Google Scholar] [CrossRef]
- Aljeboree, M.; Alshirifi, N.; Alkaim, F. Kinetics and equilibrium study for the adsorption of textile dyes on coconut shell activated carbon. Arab. J. Chem. 2017, 10, 3381. [Google Scholar] [CrossRef] [Green Version]
- Elwakeel, K.; El-Bindary, A.; Kouta, E.; Guibal, E. Functionalization of polyacrylonitrile/Na-Y-zeolite composite with amidoxime groups for the sorption of Cu(II), Cd(II) and Pb(II) metal ions. Chem. Eng. J. 2018, 332, 727–736. [Google Scholar] [CrossRef]
- Ho, Y.S.; McKay, G. The Kinetics of Sorption of Divalent Metal Ions onto Sphagnum Moss Peat. Water Res. 2000, 34, 735–742. [Google Scholar] [CrossRef]
- Meenakshi, S.; Viswanathan, N. Identification of selective ion-exchange resin for fluoride sorption. J. Colloid Interface Sci. 2007, 308, 438–450. [Google Scholar] [CrossRef] [PubMed]
- Israa, I.N.; Hilal, W.S. Adsorption of Eriochrom Black T Azo Dye onto Nanosized Anatase TiO2. J. Environ. Eng. Sci. 2015, 2, 86–92. [Google Scholar]
- Ho, Y.-S. Effect of pH on lead removal from water using tree fern as the sorbent. Bioresour. Technol. 2005, 96, 1292–1296. [Google Scholar] [CrossRef]
- Veliev, E.V.; Öztürk, T.; Veli, S.; Fatullayev, A.G. Application of diffusion model for adsorption of azo reactrive dye on pumice. Pol. J. Environ. Stud. 2006, 15, 347–353. [Google Scholar]
- Daneshvar, N.; Salari, D.; Aber, S. Chromium adsorption and Cr(VI) reduction to trivalent chromium in aqueous solutions by soya cake. J. Hazard. Mater. 2002, 94, 49–61. [Google Scholar] [CrossRef]
- Freundlich, H.M.F. Uber die adsorption in losungen. Z. Phys. Chem. 1906, 57, 385–470. [Google Scholar] [CrossRef]
- Langmuir, I. The adsorption of gases on plane surfaces of glass, mica and platinum. J. Am. Chem. Soc. 1918, 40, 1361–1403. [Google Scholar] [CrossRef] [Green Version]
- Özcan, A.; Öncü, E.M.; Özcan, A.S. Kinetics, isotherm and thermodynamic studies of adsorption of Acid Blue 193 from aqueous solutions onto natural sepiolite. Colloids Surf. A 2006, 277, 90–97. [Google Scholar] [CrossRef]
- Elgarahy, A.M.; Elwakeel, K.Z.; Elshoubaky, G.A.; Mohammad, S.H. Microwave-accelerated sorption of cationic dyes onto green marine algal biomass. Environ. Sci. Pollut. Res. 2019, 26, 22704–22722. [Google Scholar] [CrossRef] [PubMed]
- Salvestrini, S.; Leone, V.; Iovino, P.; Canzano, S.; Capasso, S. Considerations about the correct evaluation of sorption thermodynamic parameters from equilibrium isotherms. J. Chem. Thermodyn. 2014, 68, 310–316. [Google Scholar] [CrossRef]
- Zhao, W.; Zhu, J.; Wei, W.; Ma, L.; Zhua, J.; Xie, J. Comparative study of modified/non-modified aluminum and silica aerogels for anionic dye adsorption performance. RSC Adv. 2018, 8, 29129. [Google Scholar] [CrossRef] [Green Version]
- Haleemat, I.; Folahan, A.; Olalekan, S.F.; Bhekumusa, J.X. Adsorption of Cr (VI) on synthetic hematite (α-Fe2O3) nanoparticles of different morphologies. Korean J. Chem. Eng. 2014, 31, 142–154. [Google Scholar]
- Shujauddin, K.; Zhang, L.; Aimin, L.; Muhammad, I.; Zhang, X. Microwave-assisted hydrothermal carbonization of furfural residue for adsorption of Cr(VI): Adsorption and kinetic study. Pol. J. Environ. Stud. 2020, 29, 1671–1681. [Google Scholar]
- Ihsanullah; Al-Khaldi, F.A.; Abu-Sharkh, B.; Abulkibash, A.M.; Qureshi, M.I.; Laoui, T.; Atieh, M.A. Effect of acid modification on adsorption of hexavalent chromium (Cr(VI)) from aqueous solution by activated carbon and carbon nanotubes. Desalin. Water Treat. 2016, 57, 7232–7244. [Google Scholar] [CrossRef]
- Devrimci, H.A.; Yuksel, A.M.; Sanin, F.D. Algal alginate: A potential coagulant for drinking water treatment. Desalination 2012, 299, 16–21. [Google Scholar] [CrossRef]
- Aly-Eldeen, M.A.; Abeer El-Sayed, A.M.; Dalia, M.S.A.; El Zokm, G.M. The uptake of Eriochrome Black T dye from aqueous solutions utilizing waste activated sludge: Adsorption process optimization using factorial design. Egypt. J. Aquat. Res. 2018, 44, 179–186. [Google Scholar] [CrossRef]
- Chaba, J.M.; Philiswa, N.N. Effective adsorptive removal of amoxicillin from aqueous solutions and wastewater samples using zinc oxide coated carbon nanofiber composite. Emerg. Contam. 2019, 5, 143–149. [Google Scholar] [CrossRef]
- Acero, J.L.; Benitez, F.J.; Real, F.J.; Teva, F. Micropollutants removal from retentates generated in ultrafiltration and nanofiltration treatments of municipal secondary effluents by means of coagulation, oxidation, and adsorption processes. Chem. Eng. J. 2016, 289, 48–58. [Google Scholar] [CrossRef]


| Sample | Surface Area (m2 g−1) | Pore Volume (cm3 g−1) | Pore Radius (nm) |
|---|---|---|---|
| LS–AC–SG | 27.859 | 2.469 | 1.772 |
| Kinetic Models | Parameter | Amoxicillin (AMX) | Diclofenac (DFC) |
|---|---|---|---|
| qe, exp (mg·g−1) | 249 | 246 | |
| PFOR | qe, cal (mg·g−1) | 316.2 | 398.1 |
| Kads (min−1) | 0.00104 | 0.00075 | |
| R2 | 0.9952 | 0.9959 | |
| PSOR | qe, cal (mg·g−1) | 416 | 526 |
| K2 (g mg−1 min−1) | 0.00007 | 0.00003 | |
| R2 | 0.7006 | 0.6816 | |
| Mories–Weber | Kd (mg·g−1 min0.5) | 93.6 | 86.8 |
| R2 | 0.9838 | 0.9878 |
| Kinetic Isotherm | Parameter | Amoxicillin (AMX) | Diclofenac (DFC) |
|---|---|---|---|
| Langmuir | qe, exp (mg·g−1) | 249 | 246 |
| KL (L mg−1) | 0.8182 | 0.2284 | |
| R2 | 0.9955 | 0.9995 | |
| Freundlich | KF (moln−1 Ln g−1) | 177.7 | 98.327 |
| n | 2.123 | 3.703 | |
| R2 | 0.9745 | 0.9265 | |
| D–R model | E (kJ mol−1) | 0.7150 | 1.265 |
| q(D-R) (mg·g−1) | 306.4 | 316.6 | |
| R2 | 0.9535 | 0.9955 |
| Parameter | T (K) | A% | ln KL | ∆H° (kJ·mol−1) | ∆S° (J·mol−1·K−1) | ∆G° (kJ·mol−1) | R2 |
|---|---|---|---|---|---|---|---|
| Amoxicillin (AMX) | 298 | 99.6 | 4.8 | −90.01 | −257.3 | −11.89 | 0.9904 |
| 313 | 97 | 2.7 | −7.02 | ||||
| 323 | 94 | 2.3 | −6.17 | ||||
| 333 | 91 | 1.6 | −4.42 | ||||
| Diclofenac (DFC) | 298 | 98.4 | 3.4 | −52.78 | −145.9 | −8.42 | 0.9952 |
| 313 | 95 | 2.2 | −5.72 | ||||
| 323 | 92 | 2 | −5.37 | ||||
| 333 | 90 | 1.5 | −4.15 |
| Diclofenac (Sodium Salt) [56] | Amoxicillin (AMX) [57] | |
|---|---|---|
| Structure | 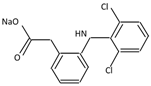 |  |
| Molecular formula | C14H10Cl2NNaO2 | C16H19N3O5S·3H2O |
| Usage | Analgesic, anti-inflammatory | Antibiotic |
| Molecular weight (gmol−1) | 318.13 | 419.45 |
| pKa | 4.3 | 2.4, 7.4, 9.6 |
| Water solubility (gL−1) at 25 °C | 2.37 | 1–3 |
Publisher’s Note: MDPI stays neutral with regard to jurisdictional claims in published maps and institutional affiliations. |
© 2021 by the authors. Licensee MDPI, Basel, Switzerland. This article is an open access article distributed under the terms and conditions of the Creative Commons Attribution (CC BY) license (https://creativecommons.org/licenses/by/4.0/).
Share and Cite
H. Ragab, A.; Hussein, H.S.; Ahmed, I.A.; Abualnaja, K.M.; AlMasoud, N. An Efficient Strategy for Enhancing the Adsorption of Antibiotics and Drugs from Aqueous Solutions Using an Effective Limestone-Activated Carbon–Alginate Nanocomposite. Molecules 2021, 26, 5180. https://doi.org/10.3390/molecules26175180
H. Ragab A, Hussein HS, Ahmed IA, Abualnaja KM, AlMasoud N. An Efficient Strategy for Enhancing the Adsorption of Antibiotics and Drugs from Aqueous Solutions Using an Effective Limestone-Activated Carbon–Alginate Nanocomposite. Molecules. 2021; 26(17):5180. https://doi.org/10.3390/molecules26175180
Chicago/Turabian StyleH. Ragab, Ahmed, Hala S. Hussein, Inas A. Ahmed, Khamael M. Abualnaja, and Najla AlMasoud. 2021. "An Efficient Strategy for Enhancing the Adsorption of Antibiotics and Drugs from Aqueous Solutions Using an Effective Limestone-Activated Carbon–Alginate Nanocomposite" Molecules 26, no. 17: 5180. https://doi.org/10.3390/molecules26175180
APA StyleH. Ragab, A., Hussein, H. S., Ahmed, I. A., Abualnaja, K. M., & AlMasoud, N. (2021). An Efficient Strategy for Enhancing the Adsorption of Antibiotics and Drugs from Aqueous Solutions Using an Effective Limestone-Activated Carbon–Alginate Nanocomposite. Molecules, 26(17), 5180. https://doi.org/10.3390/molecules26175180