
Neuroprotective Ability of Apocynin Loaded Nanoparticles (APO-NPs) as NADPH Oxidase (NOX)-Mediated ROS Modulator for Hydrogen Peroxide-Induced Oxidative Neuronal Injuries

 , , ,
, , ,
Abstract
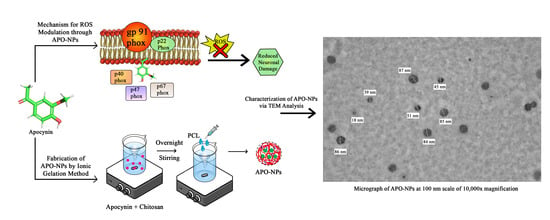
1. Introduction
2. Results
2.1. Optimisation and Statistical Analysis of Prepared APO-Loaded Nanoparticles (APO-NPs)
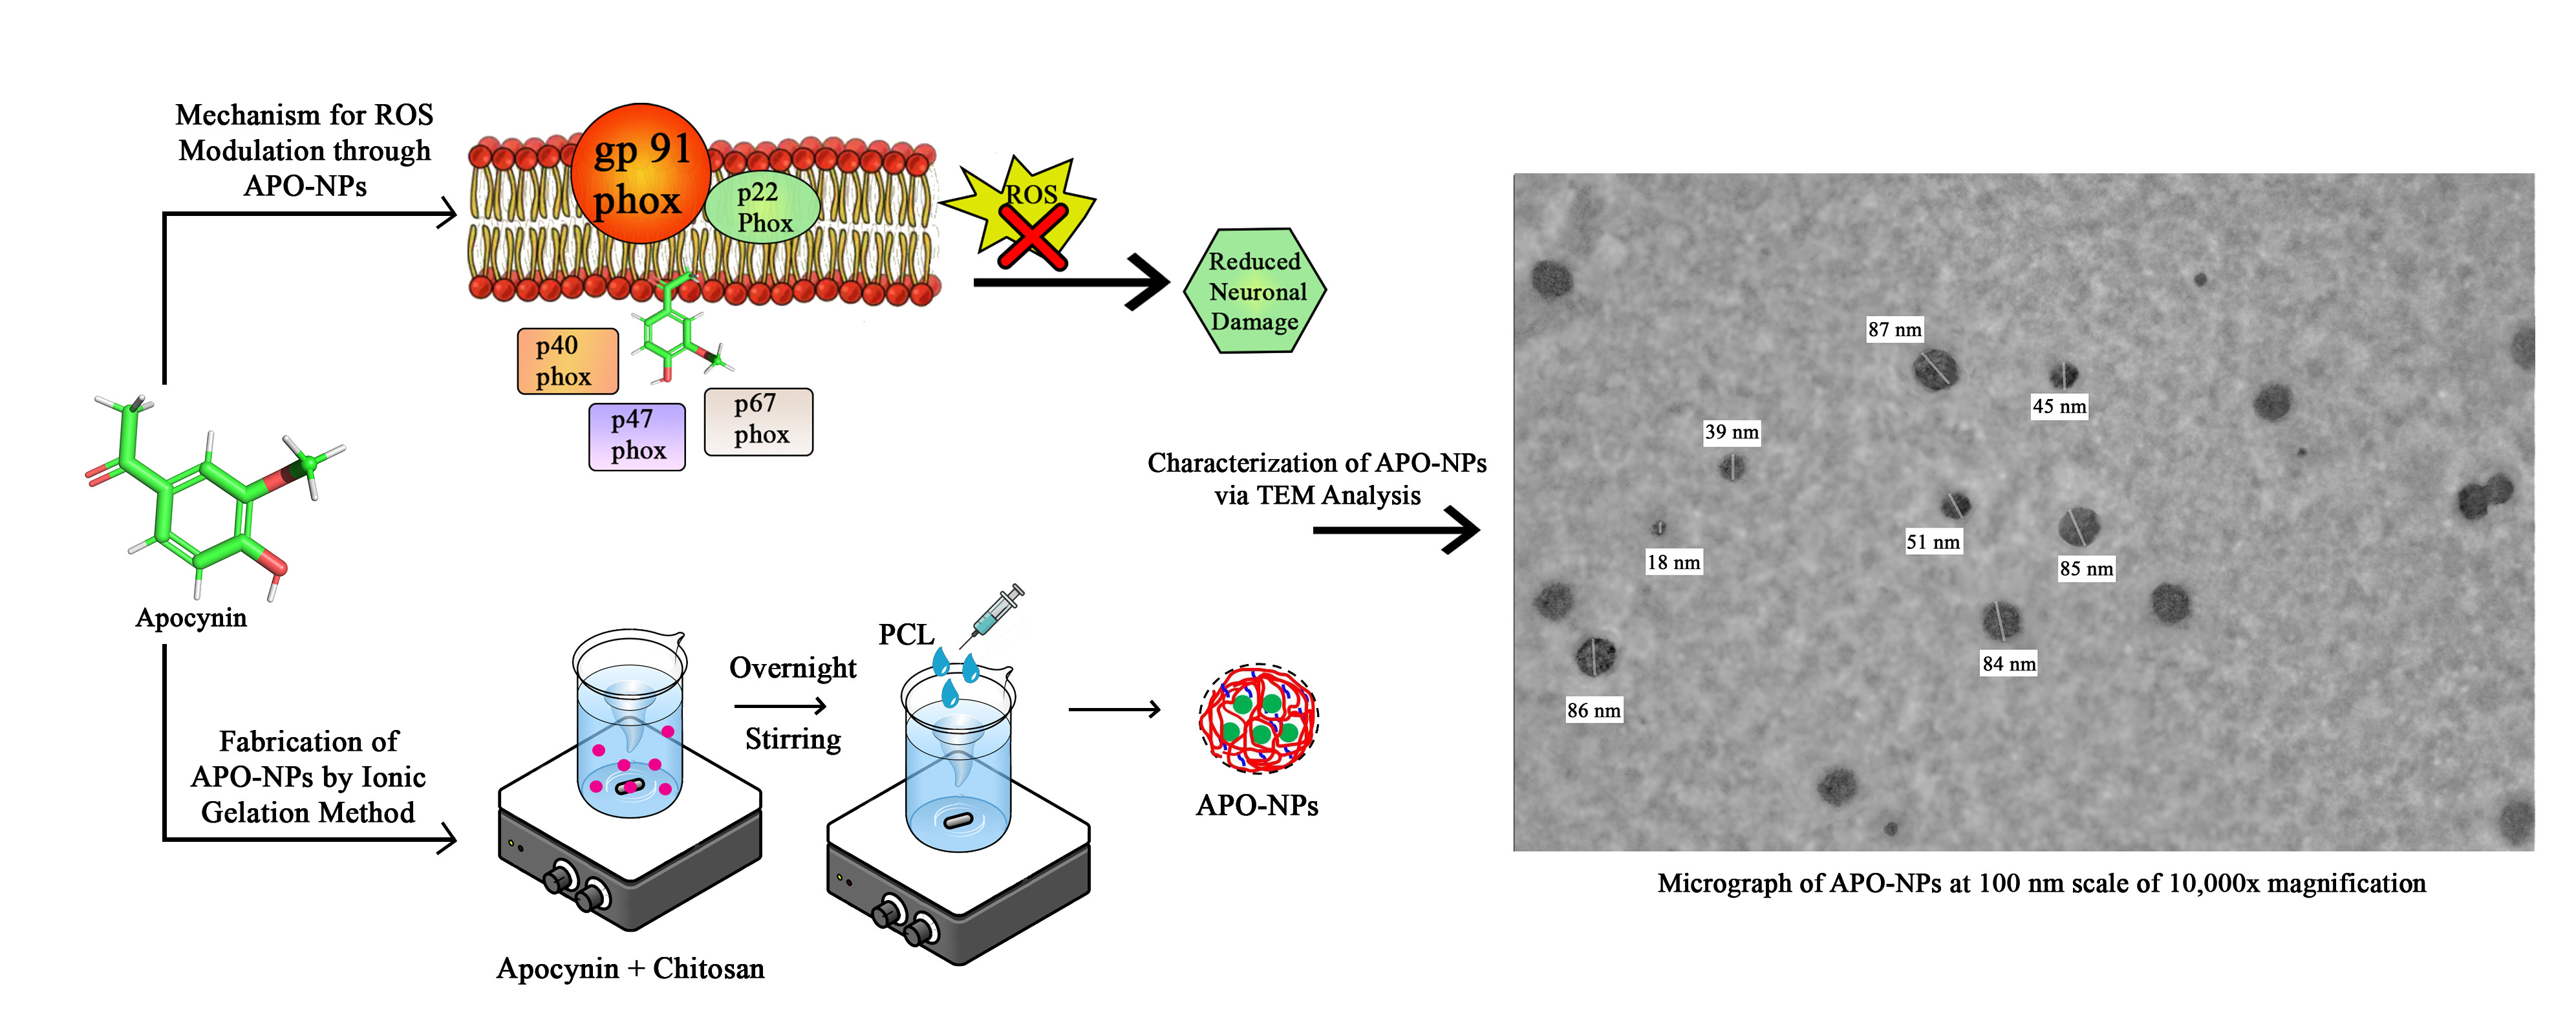
2.2. Particle Size (PSA) and Zeta Potential (ZP) Analysis
2.3. FT-IR Analysis
2.4. Transmission Electron Microscopy (TEM)
2.5. Physicochemical Parameters
2.6. In Vitro Drug Release Kinetics Analysis
2.7. In Vitro Cytotoxicity: Qualitative and Quantitative Analysis
2.7.1. Fluorescence Microscopic
2.7.2. Quantitative Analysis—MTT Assay
2.8. Antioxidant (AO) Analysis—DPPH and NO Assays
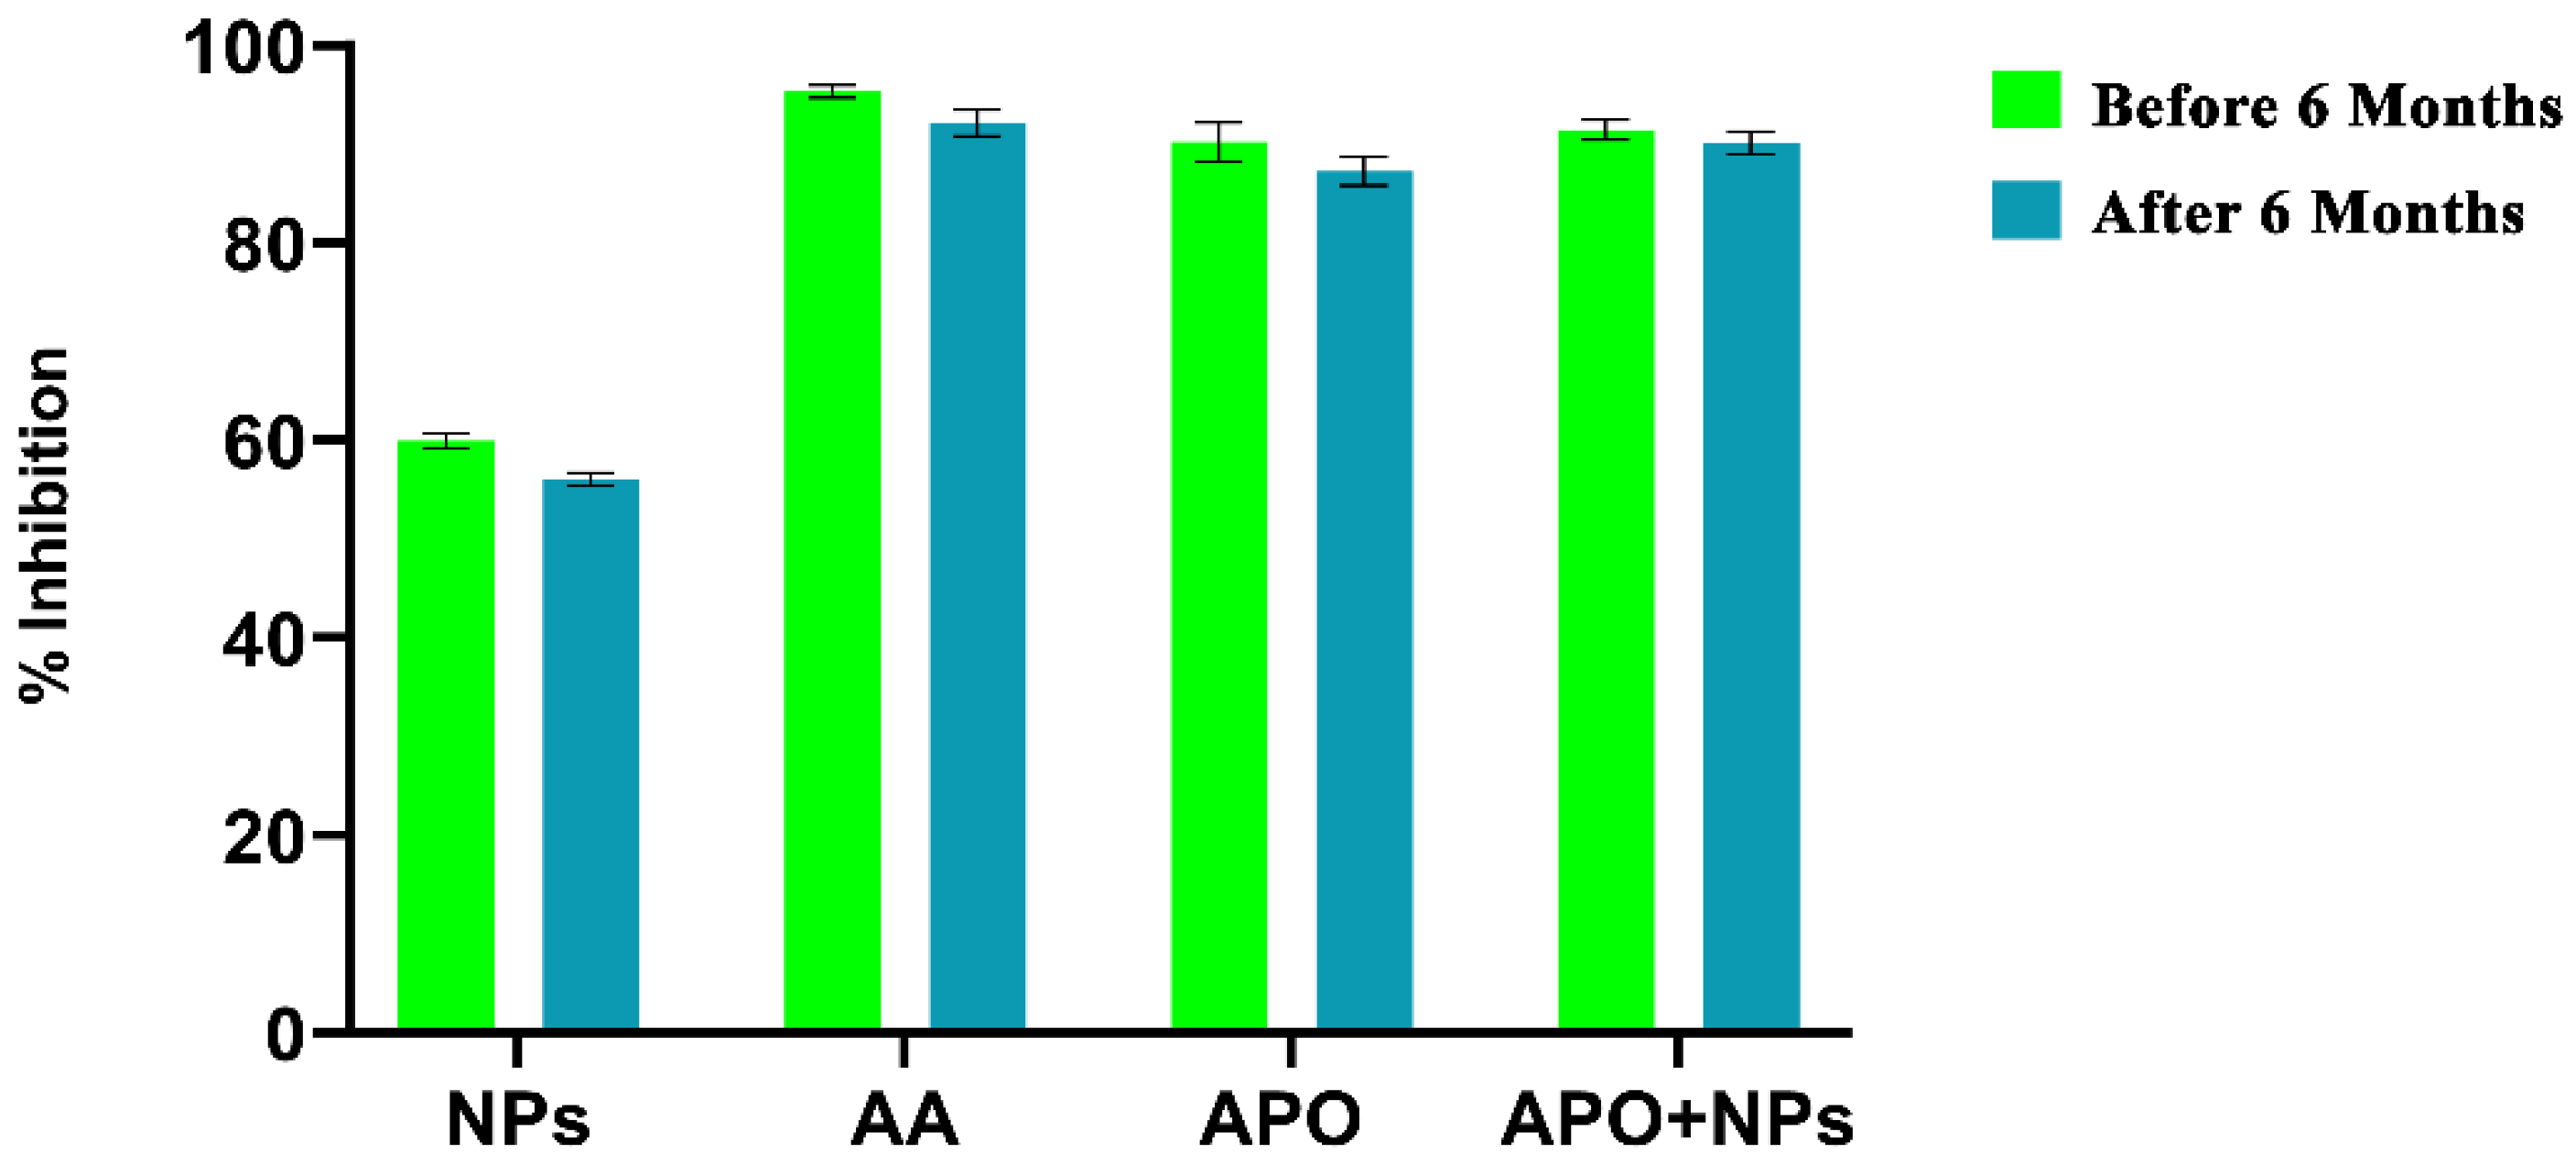
2.9. Stability Studies
3. Discussion
4. Materials and Methods
4.1. Quantitative Analysis of Apocynin (APO) by the HPLC Method
4.2. Synthesis of APO-Loaded Polymeric Nanoparticles
Preparation of APO-NPs
4.3. Statistical Optimization of APO-NPs
4.4. Characterization of the Optimized APO-NPs
4.4.1. Particle Size Analysis (PSA) and Zeta Potential (ZP)
4.4.2. Fourier-Transform Infrared Spectroscopy (FT-IR)
4.4.3. Transmission Electron Microscopy (TEM)
4.4.4. Physiochemical Parameters
4.5. In Vitro Drug Release Kinetics Studies
4.6. In Vitro Cytotoxicity Evaluation
4.6.1. Fluorescence Microscopy Analysis—Acridine Orange/Ethidium Bromide (AO/EB) Dye
4.6.2. Quantitative Cell Viability Estimation—MTT Assay
4.7. Antioxidant (AO) Analysis
4.7.1. DPPH Assay
4.7.2. Antioxidant (AO) Analysis—Nitric Oxide Assay (NO)
4.7.3. Stability Studies of APO-NPs
4.8. Statistical Analysis
5. Conclusions
Author Contributions
Funding
Institutional Review Board Statement
Informed Consent Statement
Acknowledgments
Conflicts of Interest
References
- Uttara, B.; Singh, A.V.; Zamboni, P.; Mahajan, R.T. Oxidative Stress and Neurodegenerative Diseases: A Review of Upstream and Downstream Antioxidant Therapeutic Options. Curr. Neuropharmacol. 2009, 7, 65–74. [Google Scholar] [CrossRef]
- Pacher, P.; Beckman, J.S.; Liaudet, L. Nitric Oxide and Peroxynitrite in Health and Disease. Physiol. Rev. 2007, 87, 315–424. [Google Scholar] [CrossRef]
- Panday, A.; Sahoo, M.K.; Osorio, D.; Batra, S. NADPH Oxidases: An Overview from Structure to Innate Immunity-Associated Pathologies. Cell. Mol. Immunol. 2014, 12, 5–23. [Google Scholar] [CrossRef]
- Zorov, D.B.; Juhaszova, M.; Sollott, S.J. Mitochondrial Reactive Oxygen Species (ROS) And ROS-Induced ROS Release. Physiol. Rev. 2014, 94, 909–950. [Google Scholar] [CrossRef]
- t Hart, B.A.; Copray, S.; Philippens, I. Apocynin, A Low Molecular Oral Treatment for Neurodegenerative Disease. BioMed Res. Int. 2014, 2014, 1–6. [Google Scholar] [CrossRef] [PubMed]
- Lalkovicová, M.; Danielisová, V. Neuroprotection and Antioxidants. Neural Regen. Res. 2016, 11, 865. [Google Scholar] [CrossRef]
- Minnerup, J.; Sutherland, B.A.; Buchan, A.M.; Kleinschnitz, C. Neuroprotection for Stroke: Current Status and Future Perspectives. Int. J. Mol. Sci. 2012, 13, 11753–11772. [Google Scholar] [CrossRef] [PubMed]
- Chakraborty, P.; Dey, S.; Parcha, V.; Bhattacharya, S.S.; Ghosh, A. Design Expert Supported Mathematical Optimization and Predictability Study of Buccoadhesive Pharmaceutical Wafers of Loratadine. BioMed Res. Int. 2013, 2013, 1–12. [Google Scholar] [CrossRef]
- Aman, R.M.; Abu Hashim, I.I.A.; Meshali, M.M. Novel Chitosan-Based Solid-Lipid Nanoparticles to Enhance the Bio-Residence of the Miraculous Phytochemical “Apocynin”. Eur. J. Pharm. Sci. 2018, 124, 304–318. [Google Scholar] [CrossRef]
- Vandervoort, J.; Ludwig, A. Biocompatible Stabilizers in the Preparation of PLGA Nanoparticles: A Factorial Design Study. Int. J. Pharm. 2002, 238, 77–92. [Google Scholar] [CrossRef]
- Kamnev, A.A.; Dyatlova, Y.A.; Kenzhegulov, O.A.; Vladimirova, A.A.; Mamchenkova, P.V.; Tugarova, A.V. Fourier Transform Infrared (FTIR) Spectroscopic Analyses of Microbiological Samples and Biogenic Selenium Nanoparticles of Microbial Origin: Sample Preparation Effects. Molecules 2021, 26, 1146. [Google Scholar] [CrossRef]
- Wang, X.; Li, J.; Ha, H.D.; Dahl, J.C.; Ondry, J.C.; Moreno-Hernandez, I.; Head-Gordon, T.; Alivisatos, A.P. Autodetect-Mnp: An Unsupervised Machine Learning Algorithm for Automated Analysis of Transmission Electron Microscope Images of Metal Nanoparticles. JACS Au 2021, 1, 316–327. [Google Scholar] [CrossRef]
- Shah, B.; Khunt, D.; Misra, M. Comparative Evaluation of Intranasally Delivered Quetiapine Loaded Mucoadhesive Microemulsion and Polymeric Nanoparticles for Brain Targeting: Pharmacokinetic and Gamma Scintigraphy Studies. Future J. Pharm. Sci. 2021, 7, 1–12. [Google Scholar]
- Bashir, S.; Aamir, M.; Sarfaraz, R.M.; Hussain, Z.; Sarwer, M.U.; Mahmood, A.; Akram, M.R.; Qaisar, M.N. Fabrication, Characterization and In Vitro Release Kinetics of Tofacitinib-Encapsulated Polymeric Nanoparticles: A Promising Implication in the Treatment of Rheumatoid Arthritis. Int. J. Polym. Mater. Polym. Biomater. 2020, 70, 449–458. [Google Scholar] [CrossRef]
- Yussef, A.; Fayez, S.; Sakran, W. Formulation and Evaluation of Baclofen Polymeric Nanoparticles for Transdermal Delivery In-Vitro and Ex-Vivo Optimization. J. Adv. Pharm. Res. 2021, 5, 285–296. [Google Scholar] [CrossRef]
- Altenhöfer, S.; Radermacher, K.A.; Kleikers, P.W.; Wingler, K.; Schmidt, H.H. Evolution of NADPH Oxidase Inhibitors: Selectivity and Mechanisms for Target Engagement. Antioxid. Redox Signal. 2015, 23, 406–427. [Google Scholar] [CrossRef] [PubMed]
- Tarafdar, A.; Pula, G. The Role of NADPH Oxidases and Oxidative Stress in Neurodegenerative Disorders. Int. J. Mol. Sci. 2018, 19, 3824. [Google Scholar] [CrossRef] [PubMed]
- Yu, H.; Nguyen, M.H.; Cheow, W.S.; Hadinoto, K. A New Bioavailability Enhancement Strategy of Curcumin via Self-Assembly Nano-Complexation of Curcumin and Bovine Serum Albumin. Mater. Sci. Eng. C 2017, 75, 25–33. [Google Scholar] [CrossRef] [PubMed]
- Brenza, T.M.; Ghaisas, S.; Ramirez, J.E.V.; Harischandra, D.; Anantharam, V.; Kalyanaraman, B.; Kanthasamy, A.; Narasimhan, B. Neuronal Protection Against Oxidative Insult by Polyanhydride Nanoparticle-Based Mitochondria-Targeted Antioxidant Therapy. Nanomed. Nanotechnol. Biol. Med. 2017, 13, 809–820. [Google Scholar] [CrossRef] [PubMed]
- Ben Mansour, R.; Wided, M.K.; Cluzet, S.; Krisa, S.; Richard, T.; Ksouri, R. LC-MS Identification and Preparative HPLC Isolation of Frankenia Pulverulenta Phenolics with Antioxidant and Neuroprotective Capacities in PC12 Cell Line. Pharm. Biol. 2017, 55, 880–887. [Google Scholar] [CrossRef] [PubMed]
- Lim, S.M.; Kim, T.H.; Jiang, H.H.; Park, C.W.; Lee, S.; Chen, X.; Lee, K.C. Improved Biological Half-Life and Anti-Tumor Activity of TNF-Related Apoptosis-Inducing Ligand (TRAIL) Using PEG-Exposed Nanoparticles. Biomaterials 2011, 32, 3538–3546. [Google Scholar] [CrossRef] [PubMed]
- de Oliveira, J.K.; Ronik, D.F.V.; Ascari, J.; Mainardes, R.M.; Khalil, N.M. A Stability-Indicating High Performance Liquid Chromatography Method to Determine Apocynin in Nanoparticles. J. Pharm. Anal. 2017, 7, 129–133. [Google Scholar] [CrossRef] [PubMed]
- Petrônio, M.S.; Zeraik, M.L.; Fonseca, L.M.D.; Ximenes, V.F. Apocynin: Chemical and Biophysical Properties of A NADPH Oxidase Inhibitor. Molecules 2013, 18, 2821–2839. [Google Scholar] [CrossRef]
- Elttayef, A.K.; Mohammad, R.K.; Hammdi, R.N.; Khudhair, B.K. Preparation and Characterization of Zns: Mn Nanoparticles with Theoretical Analysis. Neuroquantology 2020, 18, 17–20. [Google Scholar] [CrossRef]
- Wurm, F.R.; Weiss, C.K. Nanoparticles from Renewable Polymers. Front. Chem. 2014, 2, 49. [Google Scholar] [CrossRef]
- Wang, X.; Hall, J.E.; Warren, S.; Krom, J.; Magistrelli, J.M.; Rackaitis, M.; Bohm, G.G. Synthesis, Characterization, and Application of Novel Polymeric Nanoparticles. Macromolecules 2007, 40, 499–508. [Google Scholar] [CrossRef]
- Derman, S.; Katmıs, A.; Fide, S.; Karaismailoglu, S. Synthesis and Characterization Methods of Polymeric Nanoparticles. Character. Appl. Nanomater. 2019. [Google Scholar] [CrossRef]
- Tao, X.; Li, Y.; Hu, Q.; Zhu, L.; Huang, Z.; Yi, J.; Yang, X.; Hu, J.; Feng, X. Preparation and Drug Release Study of Novel Nanopharmaceuticals with Polysorbate 80 Surface Adsorption. J. Nanomater. 2018, 2018, 1–11. [Google Scholar] [CrossRef]
- Xiao, K.; Li, Y.; Lee, J.S.; Gonik, A.M.; Dong, T.; Fung, G.; Sanchez, E.; Xing, L.; Cheng, H.R.; Luo, J.; et al. “OA02” Peptide Facilitates the Precise Targeting of Paclitaxel-Loaded Micellar Nanoparticles to Ovarian Cancer In Vivo. Cancer Res. 2012, 72, 2100–2110. [Google Scholar] [CrossRef]
- Yarramala, D.S.; Doshi, S.; Rao, C.P. Green Synthesis, Characterization and Anticancer Activity of Luminescent Gold Nanoparticles Capped with Apo-A-Lactalbumin. RSC Adv. 2015, 5, 32761–32767. [Google Scholar] [CrossRef]
- Gong, Y.; Chowdhury, P.; Nagesh, P.K.; Rahman, M.A.; Zhi, K.; Yallapu, M.M.; Kumar, S. Novel Elvitegravir Nanoformulation for Drug Delivery Across the Blood-Brain Barrier to Achieve HIV-1 Suppression in the CNS Macrophages. Sci. Rep. 2020, 10, 1–16. [Google Scholar]
- Lima, T.; Bernfur, K.; Vilanova, M.; Cedervall, T. Understanding the Lipid and Protein Corona Formation on Different Sized Polymeric Nanoparticles. Sci. Rep. 2020, 10, 1–9. [Google Scholar] [CrossRef]
- Singh, N.; Marets, C.; Boudon, J.; Millot, N.; Saviot, L.; Maurizi, L. In Vivo Protein Corona on Nanoparticles: Does the Control of All Material Parameters Orient the Biological Behavior? Nanoscale Adv. 2021, 3, 1209–1229. [Google Scholar] [CrossRef]
- Pownall, H.J.; Liu, J.; Gillard, B.K.; Yelamanchili, D.; Rosales, C. Physico-Chemical and Physiological Determinants of Lipo-Nanoparticle Stability. Nanomed. Nanotechnol. Biol. Med. 2021, 33, 102361. [Google Scholar] [CrossRef]
- Nazir, S.; Khan, M.U.A.; Al-Arjan, W.S.; Abd Razak, S.I.; Javed, A.; Kadir, M.R.A. Nanocomposite Hydrogels for Melanoma Skin Cancer Care and Treatment: In-Vitro Drug Delivery, Drug Release Kinetics and Anti-Cancer Activities. Arab. J. Chem. 2021, 14, 103120. [Google Scholar] [CrossRef]
- Ghosal, S.; Walker, J.E.; Alabi, C.A. Predictive Platforms of Bond Cleavage and Drug Release Kinetics for Macromolecule—Drug Conjugates. Annu. Rev. Chem. Biomol. Eng. 2021, 12, 241–261. [Google Scholar] [CrossRef] [PubMed]
- Kumare, M.M.; Shendarkar, G.R. FORMULATION AND CHARACTERIZATION OF SUSTAINED RELEASE TABLET USING MARDI GUM. Asian J. Pharm. Clin. Res. 2021, 14, 52–55. [Google Scholar] [CrossRef]
- Barrera-Martínez, C.L.; Padilla-Vaca, F.; Liakos, I.; Meléndez-Ortiz, H.I.; Cortez-Mazatan, G.Y.; Peralta-Rodríguez, R.D. Chitosan Microparticles as Entrapment System for Trans-Cinnamaldehyde: Synthesis, Drug Loading, and In Vitro Cytotoxicity Evaluation. Int. J. Biol. Macromol. 2021, 166, 322–332. [Google Scholar] [CrossRef] [PubMed]
- Idris, S.B.; Arifah, A.K.; Jesse, F.F.; Ramanoon, S.Z.; Basit, M.A.; Zakaria, M.Z. In Vitro Cytotoxicity Evaluation of Oxytetracycline Loaded Cockle Shell Derived Calcium Carbonate Aragonite Nanoparticles. Nanosci. Nanotechnol. Asia 2021, 11, 237–242. [Google Scholar] [CrossRef]
- Udo, M.S.B.; da Silva, M.A.A.; de Souza Prates, S.; Dal’Jovem, L.F.; de Oliveira Duro, S.; Faião-Flores, F.; Garcia, R.C.T.; Maria-Engler, S.; Marcourakis, T. Anhydroecgonine Methyl Ester, a Cocaine Pyrolysis Product, Contributes to Cocaine-Induced Rat Primary Hippocampal Neuronal Death in a Synergistic and Time-Dependent Manner. Arch. Toxicol. 2021, 95, 1779–1791. [Google Scholar] [CrossRef] [PubMed]
- Ginsburg, I.; Rozenstein-Tsalkovich, L.; Koren, E.; Rosenmann, H. The Herbal Preparation Padma® 28 Protects Against Neurotoxicity in PC12 Cells. Phytother. Res. 2011, 25, 740–743. [Google Scholar] [CrossRef]
- Venkataramaiah, C.; Priya, B.L.; Payani, S.; Pradeepkiran, J.A. Pharmacological Potentiality of Bioactive Flavonoid Against Ketamine Induced Cell Death of PC 12 Cell Lines: An In Vitro Study. Antioxidants 2021, 10, 934. [Google Scholar] [CrossRef]
- Tomaszewska, E.; Ranoszek-Soliwoda, K.; Sztandera, K.; Błażałek, P.; Głowacki, R.; Janaszewska, A.; Janasik, B.; Celichowski, G.; Wąsowicz, W.; Klajnert-Maculewicz, B.; et al. Systematic Studies of Gold Nanoparticles Functionalised with Thioglucose and Its Cytotoxic Effect. ChemistrySelect 2021, 6, 1230–1237. [Google Scholar] [CrossRef]
- Sharma, O.P.; Bhat, T.K. DPPH Antioxidant Assay Revisited. Food Chem. 2009, 113, 1202–1205. [Google Scholar] [CrossRef]
- Shimamura, T.; Sumikura, Y.; Yamazaki, T.; Tada, A.; Kashiwagi, T.; Ishikawa, H.; Matsui, T.; Sugimoto, N.; Akiyama, H.; Ukeda, H. Applicability of the DPPH Assay for Evaluating the Antioxidant Capacity of Food Additives—Inter-Laboratory Evaluation Study. Anal. Sci. 2014, 30, 717–721. [Google Scholar] [CrossRef]
- Pyrzynska, K.; Pękal, A. Application of Free Radical Diphenylpicrylhydrazyl (DPPH) to Estimate the Antioxidant Capacity of Food Samples. Anal. Methods 2013, 5, 4288–4295. [Google Scholar] [CrossRef]
- Ignarro, L.J.; Byrns, R.E.; Sumi, D.; de Nigris, F.; Napoli, C. Pomegranate Juice Protects Nitric Oxide Against Oxidative Destruction and Enhances the Biological Actions of Nitric Oxide. Nitric Oxide 2006, 15, 93–102. [Google Scholar] [CrossRef] [PubMed]
- Kalaria, D.R.; Sharma, G.; Beniwal, V.; Ravi Kumar, M.R. Design of Biodegradable Nanoparticles for Oral Delivery of Doxorubicin: In Vivo Pharmacokinetics and Toxicity Studies in Rats. Pharm. Res. 2008, 26, 492–501. [Google Scholar] [CrossRef] [PubMed]
- Nesalin, J.A.J.; Smith, A.A. Preparation and Evaluation of Stavudine Loaded Chitosan Nanoparticles. J. Pharm. Res. 2013, 6, 268–274. [Google Scholar]


| Std | Run | A. CS (mg/mL) | B. PCL (mg/mL) | C. Sonication Time (min) | D. Rate of Addition (mL/min) | EE (%) |
|---|---|---|---|---|---|---|
| 5 | 1 | 1 | 0.1 | 10 | 30 | 92.4 |
| 3 | 2 | 1 | 0.2 | 5 | 30 | 53.5 |
| 4 | 3 | 2 | 0.2 | 5 | 30 | 52.5 |
| 14 | 4 | 2 | 0.1 | 10 | 60 | 79.0 |
| 13 | 5 | 1 | 0.1 | 10 | 60 | 93.4 |
| 9 | 6 | 1 | 0.1 | 5 | 60 | 67.2 |
| 7 | 7 | 1 | 0.2 | 10 | 30 | 66.0 |
| 2 | 8 | 2 | 0.1 | 5 | 30 | 52.5 |
| 12 | 9 | 2 | 0.2 | 5 | 60 | 40.4 |
| 11 | 10 | 1 | 0.2 | 5 | 60 | 61.2 |
| 8 | 11 | 2 | 0.2 | 10 | 30 | 54.0 |
| 10 | 12 | 2 | 0.1 | 5 | 60 | 47.0 |
| 1 | 13 | 1 | 0.1 | 5 | 30 | 60.2 |
| 16 | 14 | 2 | 0.2 | 10 | 60 | 87.3 |
| 15 | 15 | 1 | 0.2 | 10 | 60 | 56.3 |
| 6 | 16 | 2 | 0.1 | 10 | 30 | 50.5 |
| Parameters | APO-NPs |
|---|---|
| Viscosity | 0.967 cP |
| pH | 6.9 |
| Density | 0.968 g/mL |
| Conductivity | 7.86 mS/m |
Publisher’s Note: MDPI stays neutral with regard to jurisdictional claims in published maps and institutional affiliations. |
© 2021 by the authors. Licensee MDPI, Basel, Switzerland. This article is an open access article distributed under the terms and conditions of the Creative Commons Attribution (CC BY) license (https://creativecommons.org/licenses/by/4.0/).
Share and Cite
Singh, M.; Agarwal, S.; Tiwari, R.K.; Chanda, S.; Singh, K.; Agarwal, P.; Kashyap, A.; Pancham, P.; Mall, S.; R., R.; et al. Neuroprotective Ability of Apocynin Loaded Nanoparticles (APO-NPs) as NADPH Oxidase (NOX)-Mediated ROS Modulator for Hydrogen Peroxide-Induced Oxidative Neuronal Injuries. Molecules 2021, 26, 5011. https://doi.org/10.3390/molecules26165011
Singh M, Agarwal S, Tiwari RK, Chanda S, Singh K, Agarwal P, Kashyap A, Pancham P, Mall S, R. R, et al. Neuroprotective Ability of Apocynin Loaded Nanoparticles (APO-NPs) as NADPH Oxidase (NOX)-Mediated ROS Modulator for Hydrogen Peroxide-Induced Oxidative Neuronal Injuries. Molecules. 2021; 26(16):5011. https://doi.org/10.3390/molecules26165011
Chicago/Turabian StyleSingh, Manisha, Shriya Agarwal, Raj Kumar Tiwari, Silpi Chanda, Kuldeep Singh, Prakhar Agarwal, Aishwarya Kashyap, Pranav Pancham, Shweta Mall, Rachana R., and et al. 2021. "Neuroprotective Ability of Apocynin Loaded Nanoparticles (APO-NPs) as NADPH Oxidase (NOX)-Mediated ROS Modulator for Hydrogen Peroxide-Induced Oxidative Neuronal Injuries" Molecules 26, no. 16: 5011. https://doi.org/10.3390/molecules26165011
APA StyleSingh, M., Agarwal, S., Tiwari, R. K., Chanda, S., Singh, K., Agarwal, P., Kashyap, A., Pancham, P., Mall, S., R., R., & Sharma, S. (2021). Neuroprotective Ability of Apocynin Loaded Nanoparticles (APO-NPs) as NADPH Oxidase (NOX)-Mediated ROS Modulator for Hydrogen Peroxide-Induced Oxidative Neuronal Injuries. Molecules, 26(16), 5011. https://doi.org/10.3390/molecules26165011