
Hydrocarbon Hydrate Flow Assurance History as a Guide to a Conceptual Model

Abstract
:1. A Brief Hydrate History
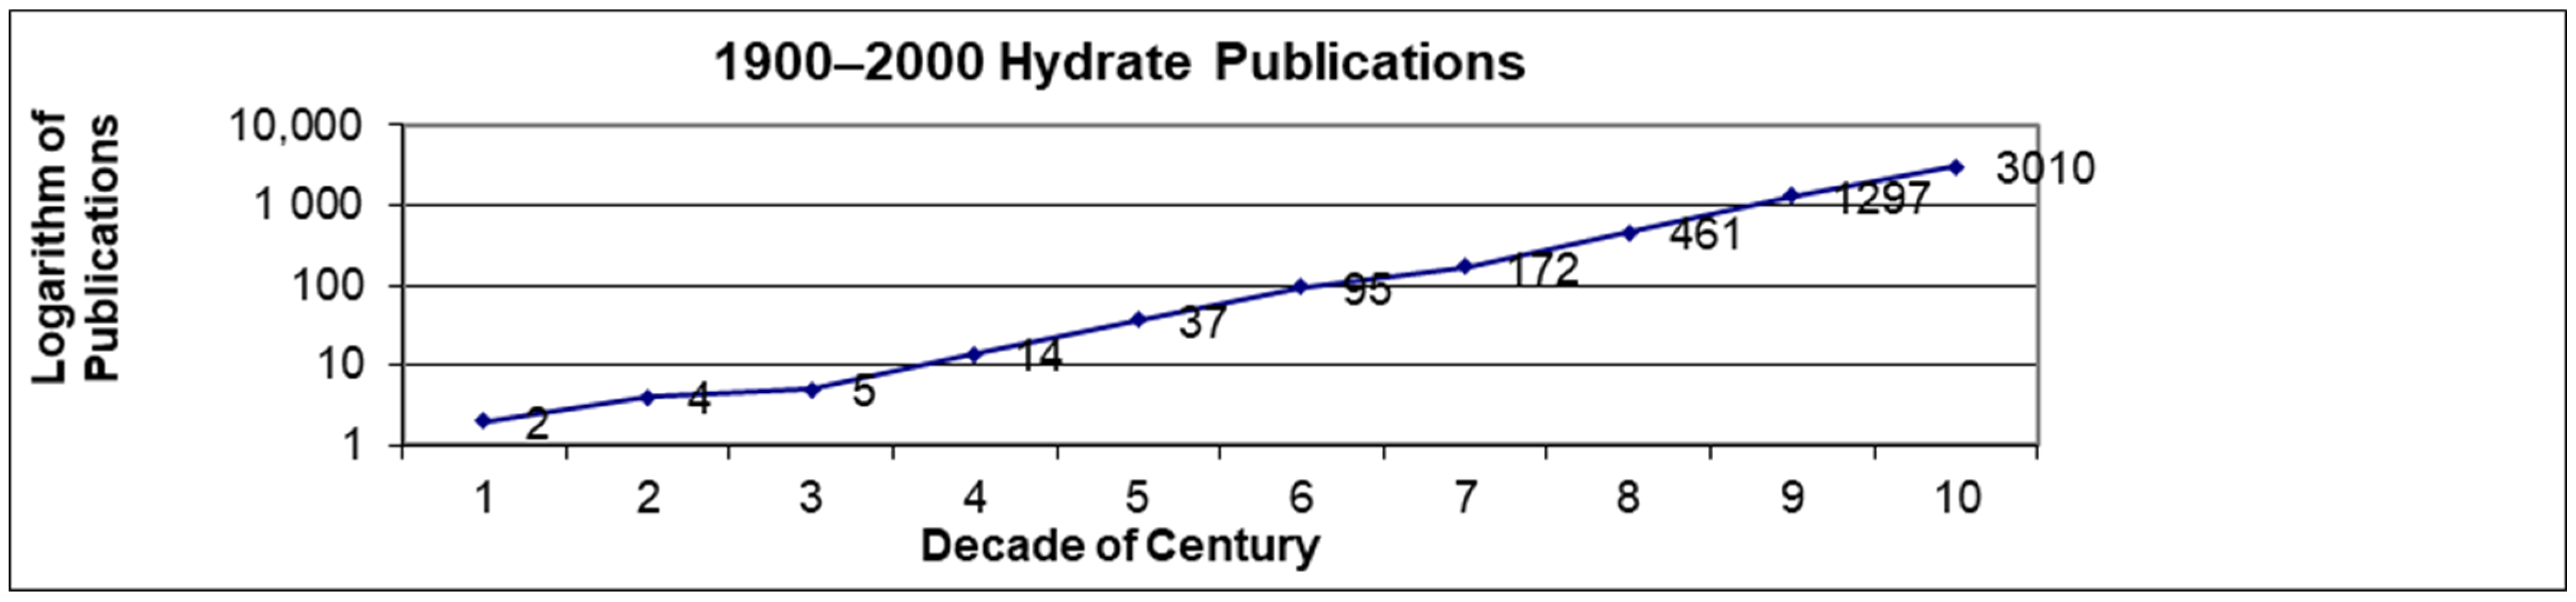
1.1. Curiosity

| Year | Event |
|---|---|
| 1811 | Chlorine hydrate discovery by Sir Humphrey Davy |
| 1823 | Corroboration by Faraday-proposed formula Cl2•10H2O |
| 1882 | De Forcrand suggested hydration number H2S•(12-16)H2O and measured 30 binary hydrates of H2S with a second component such as CHCl3, CH3Cl, C2H5Cl, C2H5Br, C2H3Cl. He indicated all compositions as G•2H2S•23H2O where G = 2nd guest molecule (other than H2S) |
| 1884 | Le Chatelier showed the Cl hydrate P–T curve changes slope at 273 K |
| 1884,5 | Roozeboom postulated lower/upper hydrate quadruple points (Q1 = I-Lw-H-V, Q2 = Lw-H-V-LHC), using SO2 as evidence; determined univariant dependence of P on T |
| 1888 | Villard obtained the temperature dependence of H2S hydrates |
| 1888 | De Forcrand and Villard measured temperature dependence of CH3Cl hydrate |
| 1888 | Villard measured hydrates of CH4, C2H6, C3H8, C2H2, N2O |
| 1890 | Villard measured hydrates of C3H8 and suggested that the temperature of the lower quadruple. Point (Q1) decreased by increasing the molecular mass of a guest; Villard suggested hydrates were regular crystals |
| 1896 | Villard measured hydrates of Ar and proposed that N2 and O2 form hydrates; Used heat of formation data to get the water/gas ratio |
| 1897 | De Forcrand and Thomas sought double (w/H2S or H2Se) hydrates; found mixed (other than H2Sx) hydrates of numerous halohydrocarbons mixed with C2H2, CO2, C2H6 |
| 1902 | De Forcrand first used Clausius–Clapeyron relation for ΔH and compositions; tabulated 15 hydrate conditions |
| 1919 | Scheffer and Meyer refined Clausius–Clapeyron technique as applied to hydrates |
1.2. Flow Assurance: From Apprehension to Avoidance to Management
1.3. A Statistical Theory of Hydrate Thermodynamics
1.4. Beyond Thermodynamics to Kinetics: From Avoidance to Management
1.5. Modern Hydrate Advances
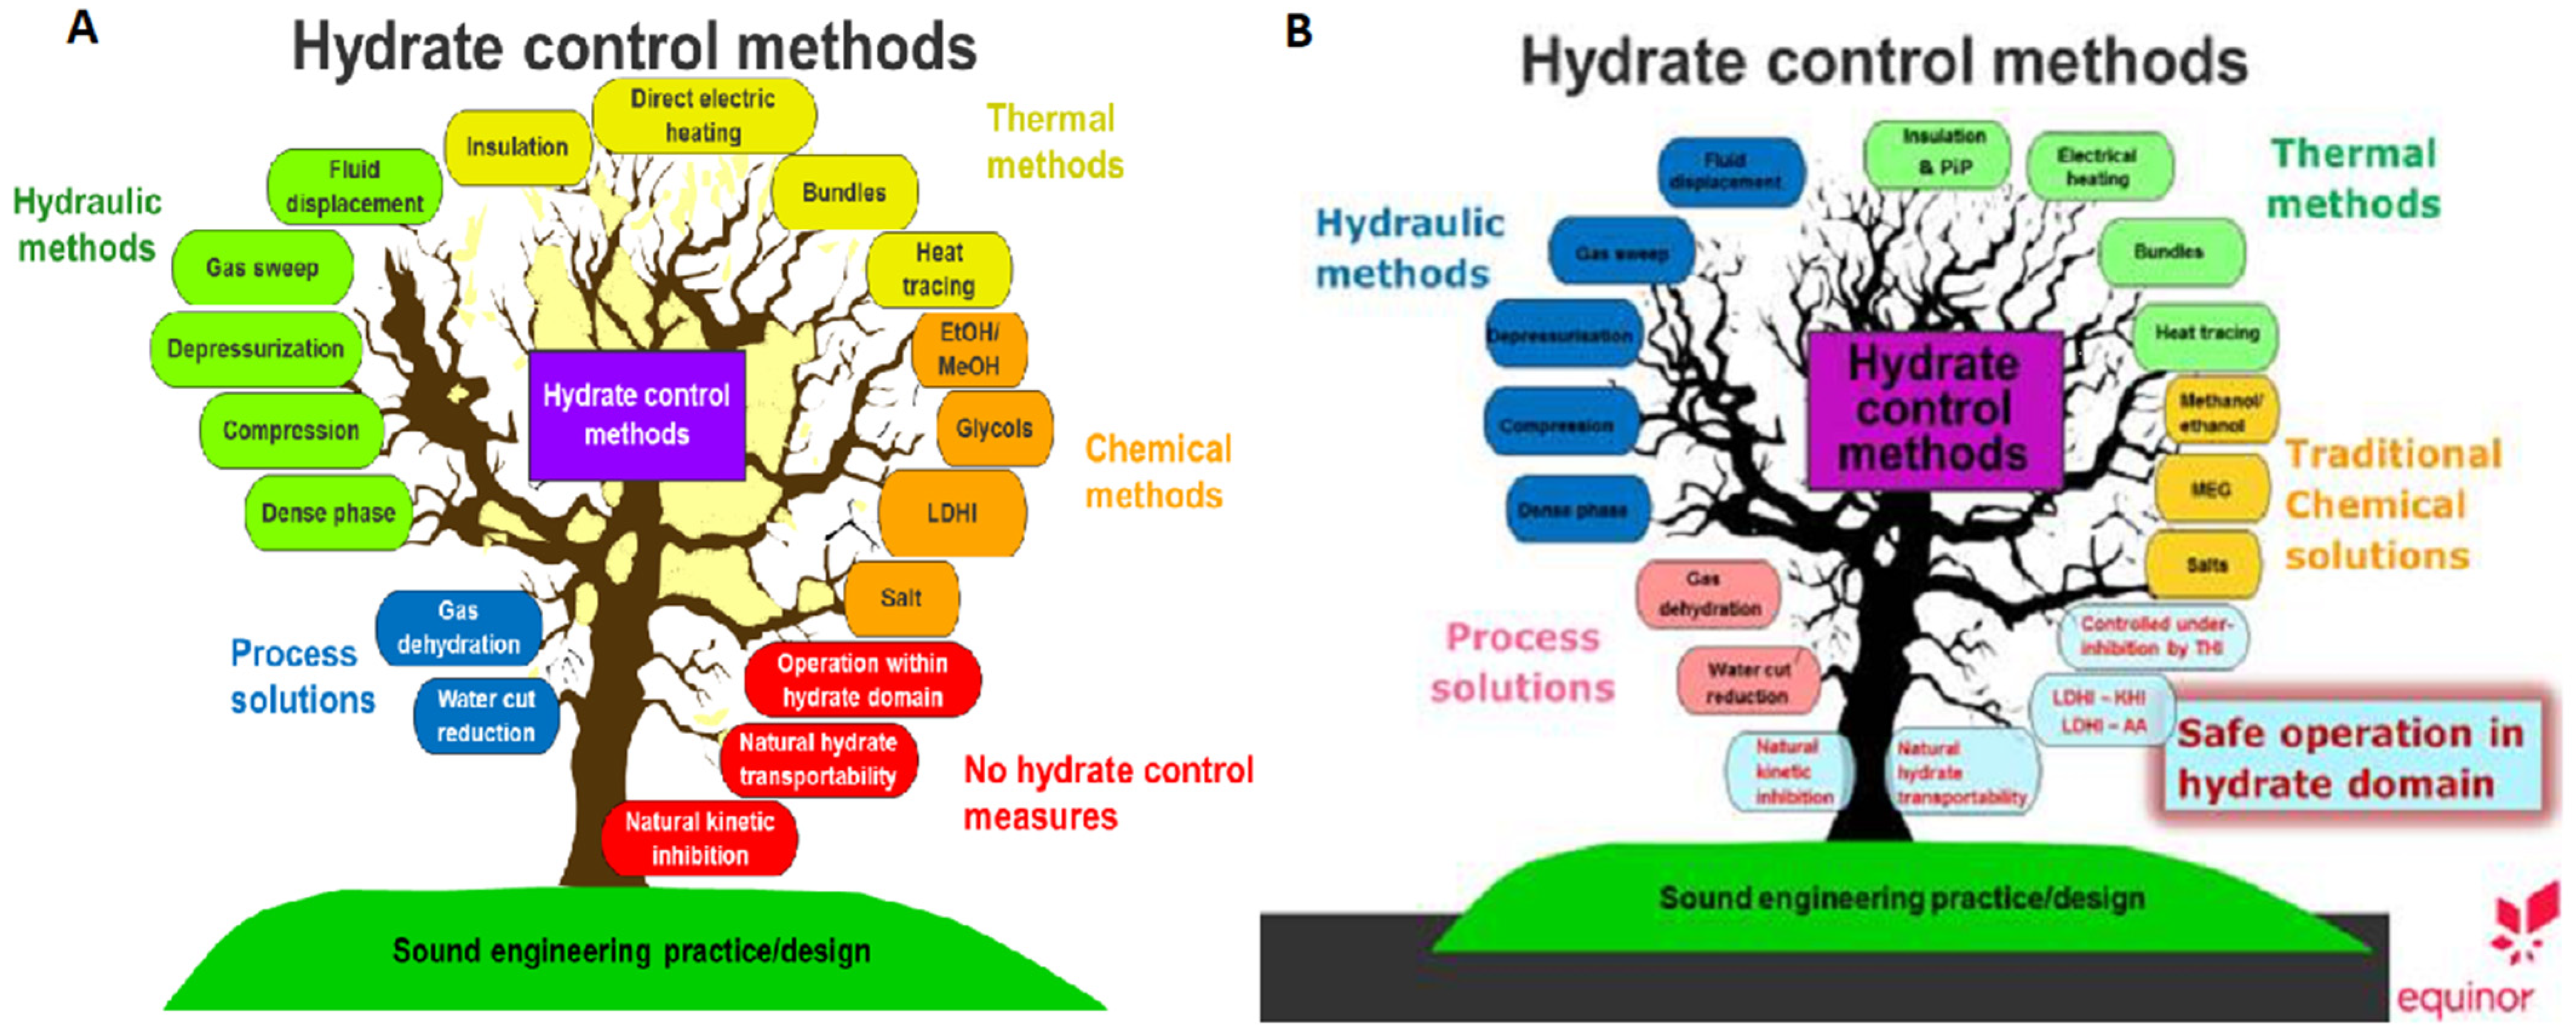
1.6. The Evolution of Best Practices for Hydrate Flow Assurance
- Process Solutions: (a) remove the water and (b) dehydrate the gas.
- Hydraulic Methods: (a) dense phases, (b) compression, (c) depressurization, (d) gas sweep and (e) fluid displacement.
- Thermal Methods: (a) Insulation, (b) direct electrical heating, (c) pipe bundles and d) heat tracing.
- Chemical Methods: (a) alcohols, (b) glycols, (c) low dosage inhibitors (KHIs and AAs) and (d) salt.
- No Hydrate Control Measures: (a) low amounts of subcooling, (b) natural kinetic growth inhibition and (c) natural transportability methods.
2. Conceptual Stages of Hydrate Plug Formation on Transient Restart
3. Conclusions
Funding
Institutional Review Board Statement
Informed Consent Statement
Data Availability Statement
Acknowledgments
Conflicts of Interest
References
- Davy, H. The Bakerian lecture: On some of the combinations of oxymuriatic gas and oxygen and on the chemcial relations of these principles. Phil. Trans. R. Soc. (Lond.) 1811, 101, 1. [Google Scholar]
- Priestley, J. Experiments and Observations on Different Kinds of Air and Other Branches of Natural Philosophy Connected with the Subject (in Three Volumes); T. Pearson: Birmingham, UK, 1790; p. 359. [Google Scholar]
- Von Stackelberg, M. Solid gas hydrates. Naturwiss 1949, 36, 359. [Google Scholar]
- Von Stackelberg, M.; Müller, H.R. Feste gashydrate II structur und raumchemie. Z. Electrochem. 1954, 58, 25. [Google Scholar]
- Von Stackelberg, M. Feste gashydrate. V: Die Bindungsenergien. Z. Electrochem. 1954, 58, 104. [Google Scholar]
- Von Stackelberg, M. Gashydrate. Rec. Trav. Chim. Pays-Bas 1956, 75, 902. [Google Scholar] [CrossRef]
- Claussen, W.F. Suggested structures of water in inert gas hydrates. J. Chem. Phys. 1951, 19, 259. [Google Scholar] [CrossRef]
- Claussen, W.F. A second water structure for inert gas hydrates. J. Chem. Phys. 1951, 19, 1425. [Google Scholar] [CrossRef]
- Pauling, L.; Marsh, R.E. The structure of chlorine hydrate. Proc. Natl. Acad. Sci. USA 1952, 38, 112. [Google Scholar] [CrossRef] [PubMed] [Green Version]
- Ripmeester, J.A.; Tse, J.S.; Ratcliffe, C.I.; Powell, B.M. A new clathrate hydrate structure. Nature 1987, 325, 135. [Google Scholar] [CrossRef]
- Sloan, E.D.; Koh, C.A. Clathrate Hydrates of Natural Gases, 3rd ed.; Taylor & Francis: Boca Raton, FL, USA, 2008. [Google Scholar]
- Hammerschmidt, E.G. Formation of gas hydrates in natural gas transmission lines. Ind. Eng. Chem. 1934, 26, 851. [Google Scholar] [CrossRef]
- Hammerschmidt, E.G. Preventing and removing hydrates in natural gas pipe lines. Gas Age 1939, 83, 45–49. [Google Scholar]
- Schroeder, W. Die Geschichte der Gas Hydrate. Sammlung. Chem. Tech. Vortrage 1927, 29, 90–98. [Google Scholar]
- Koen, B.V. Discussion of the Method: Conducting the Engineer’s Approach to Problem Solving; Oxford University Press: Oxford, UK, 2003. [Google Scholar]
- Makogon, Y.F. Hydrate formation in gas bearing beds under permafrost conditions. Gazov. Promst. 1965, 5, 14. [Google Scholar]
- Van der Waals, J.H.; Platteeuw, J.C. Clathrate solutions. Adv. Chem. Phys. 1959, 2, 1. [Google Scholar]
- Saito, S.; Marshall, D.R.; Kobayashi, R. Hydrates at high Pressures: Part II. Application of statistical mechanics to the study of the hydrates of methane, argon, and nitrogen. AIChE J. 1964, 10, 734. [Google Scholar] [CrossRef]
- Parrish, W.R.; Prausnitz, J.M. Dissociation pressures of gas hydrates formed by gas mixtures. Ind. Eng. Chem. Proc. Des. Dev. 1972, 11, 26. [Google Scholar] [CrossRef]
- Davidson, D.W. Clathrate Hydrates. In Water in Crystalline Hydrates Aqueous Solutions of Simple Nonelectrolytes. Water (A Comprehensive Treatise); Franks, F., Ed.; Springer: Boston, MA, USA, 1973; Volume 2, pp. 115–234. [Google Scholar]
- Sum, A.K.; Burrus, R.C.; Sloan, E.D. Measurement of clathrate hydrates via Raman spectroscopy. J. Phys. Chem. B 1997, 101, 7371. [Google Scholar] [CrossRef]
- Bishnoi, P.R. The Kinetics of Natural Gas Hydrate Formation; Final Report Contract DSSF14SU 23235-0-0497; Dept. Energy, Mines & Resources: Ottawa, ON, Canada, 1980. [Google Scholar]
- Ripmeester, J.A. Clathrate hydrates: The importance of fundamental research. Presented at the Conference for Youth Encouragement, Qingdao, China, 24 July 2018. [Google Scholar]
- Sloan, E.D. A changing hydrate paradigm—From apprehension to avoidance to risk management. Fluid Phase Equilibria 2005, 67, 228–229. [Google Scholar] [CrossRef]
- Kinnari, K.; Hundseid, J.; Li, X.; Askvik, K.M. Hydrate management in practice. Chem. Eng. Data 2014, 60, 437. [Google Scholar] [CrossRef]
- Li, X.; Austvik, K.; Askvik, T.; Equinor ASA, Stavanger, Norway. Personal communication, 27 February 201.
- Pickarts, M. Hydrate Deposition Fundamentals & Mitigation Efforts with Coatings and Hydrate Formation during Transient Shut-In/Restart Operations. Ph.D. Thesis, Colorado School of Mines, Golden, CO, USA, 2022. [Google Scholar]
- Ismail, N. Hydrate Plugging Properties with Natural and Synthetic Anti-Agglomerants in Liquid Hydrocarbon Phase. Ph.D. Thesis, Colorado School of Mines, Golden, CO, USA, 2022. [Google Scholar]
- Høiland, S.; Borgund, A.E.; Barth, T.; Fotland, P.; Askvik, K.M. Wettability of Freon hydrates in crude oil/brine emulsions: The effects of chemical additives. In Proceedings of the International Conference on Gas Hydrates (ICGH 5), Trondheim, Norway, 12–16 June 2005; NO-7005. Tapir Academic Press: Trondheim, Norway, 2005; Volume 4, p. 1151. [Google Scholar]
- Austvik, T. Hydrate Formation in Pipes. Doctor Ing. Thesis, Norwegian Institute of Technology, Trondheim, Norway, 1992. [Google Scholar]
- Davies, S.R.; Sloan, E.D.; Sum, A.K.; Koh, C.A. In situ studies of the mass transfer mechanism across a methane hydrate film using high-resolution confocal raman spectroscopy. J. Phys. Chem. 2010, 114, 1173. [Google Scholar] [CrossRef]

| Year | Events |
|---|---|
| 1966 | NMR measurements of the hydrate phase by Davidson and Ripmeester |
| 1980 | Kinetics study begun (Bishnoi et al.) |
| 1982 | 1st flowloop constructed (Sintef in Norway) |
| 1987 | New structure H (sH) hydrates discovered (Ripmeester et al.) |
| 1995 | Kinetic inhibitors (KHI) used in North Sea (BP) |
| 1996 | Raman measurements of hydrates (Colorado School of Mines[CSM]) |
| 1999 | Depressurization plug removal model (CSM) |
| 1990’s | Extended tiebacks eliminated tension leg platform need (DeepStar) |
| 1999 | Hydrates declared major deep water problem for flow assurance (DeepStar) |
| 2000 | Anti-agglomerates used in Gulf of Mexico for Water Cuts (WC) < 50% (Shell) |
| 2001 | Initial kinetics model enable change from avoidance to management (Shell) |
| 2002 | For P < 275 bara prediction accuracy is to within 1K and 10% P |
| 2003 | Formation of plug incorporated in flow simulators (OLGA) |
| 2003 | Very slow (>1000 min) conversion of metastable hydrate structure (Göttingen, Potsdam, NRC) |
| 2003 | Cold Flow (BP, XoM) |
| 2007 | Acoustic plug locator (Heriot–Watt) |
| 2008 | N2 used for plug removal (BP) |
| 2009 | Formation risk monitoring and detection methods (Heriot–Watt) |
| 2010 | Electrical heating for plug removal |
| 2010 | Hydrate plug resistant oil protocols (Petrobras, Shell) |
| 2012 | KHI recovery and reuse methods (Heriot–Watt) |
| 2012 | Hydrate flowline deposition is important addition to aggregation (XoM) |
| 2014 | Best practices established for prevention/removal (Statoil/Equinor) |
Publisher’s Note: MDPI stays neutral with regard to jurisdictional claims in published maps and institutional affiliations. |
© 2021 by the author. Licensee MDPI, Basel, Switzerland. This article is an open access article distributed under the terms and conditions of the Creative Commons Attribution (CC BY) license (https://creativecommons.org/licenses/by/4.0/).
Share and Cite
Sloan, E.D. Hydrocarbon Hydrate Flow Assurance History as a Guide to a Conceptual Model. Molecules 2021, 26, 4476. https://doi.org/10.3390/molecules26154476
Sloan ED. Hydrocarbon Hydrate Flow Assurance History as a Guide to a Conceptual Model. Molecules. 2021; 26(15):4476. https://doi.org/10.3390/molecules26154476
Chicago/Turabian StyleSloan, E. Dendy. 2021. "Hydrocarbon Hydrate Flow Assurance History as a Guide to a Conceptual Model" Molecules 26, no. 15: 4476. https://doi.org/10.3390/molecules26154476
APA StyleSloan, E. D. (2021). Hydrocarbon Hydrate Flow Assurance History as a Guide to a Conceptual Model. Molecules, 26(15), 4476. https://doi.org/10.3390/molecules26154476