
Phytochemical Composition, Antioxidant Activity, and Enzyme Inhibitory Activities (α-Glucosidase, Xanthine Oxidase, and Acetylcholinesterase) of Musella lasiocarpa


 , ,
, ,
Abstract
:1. Introduction
2. Results
2.1. Total Phenolic and Flavonoid Contents
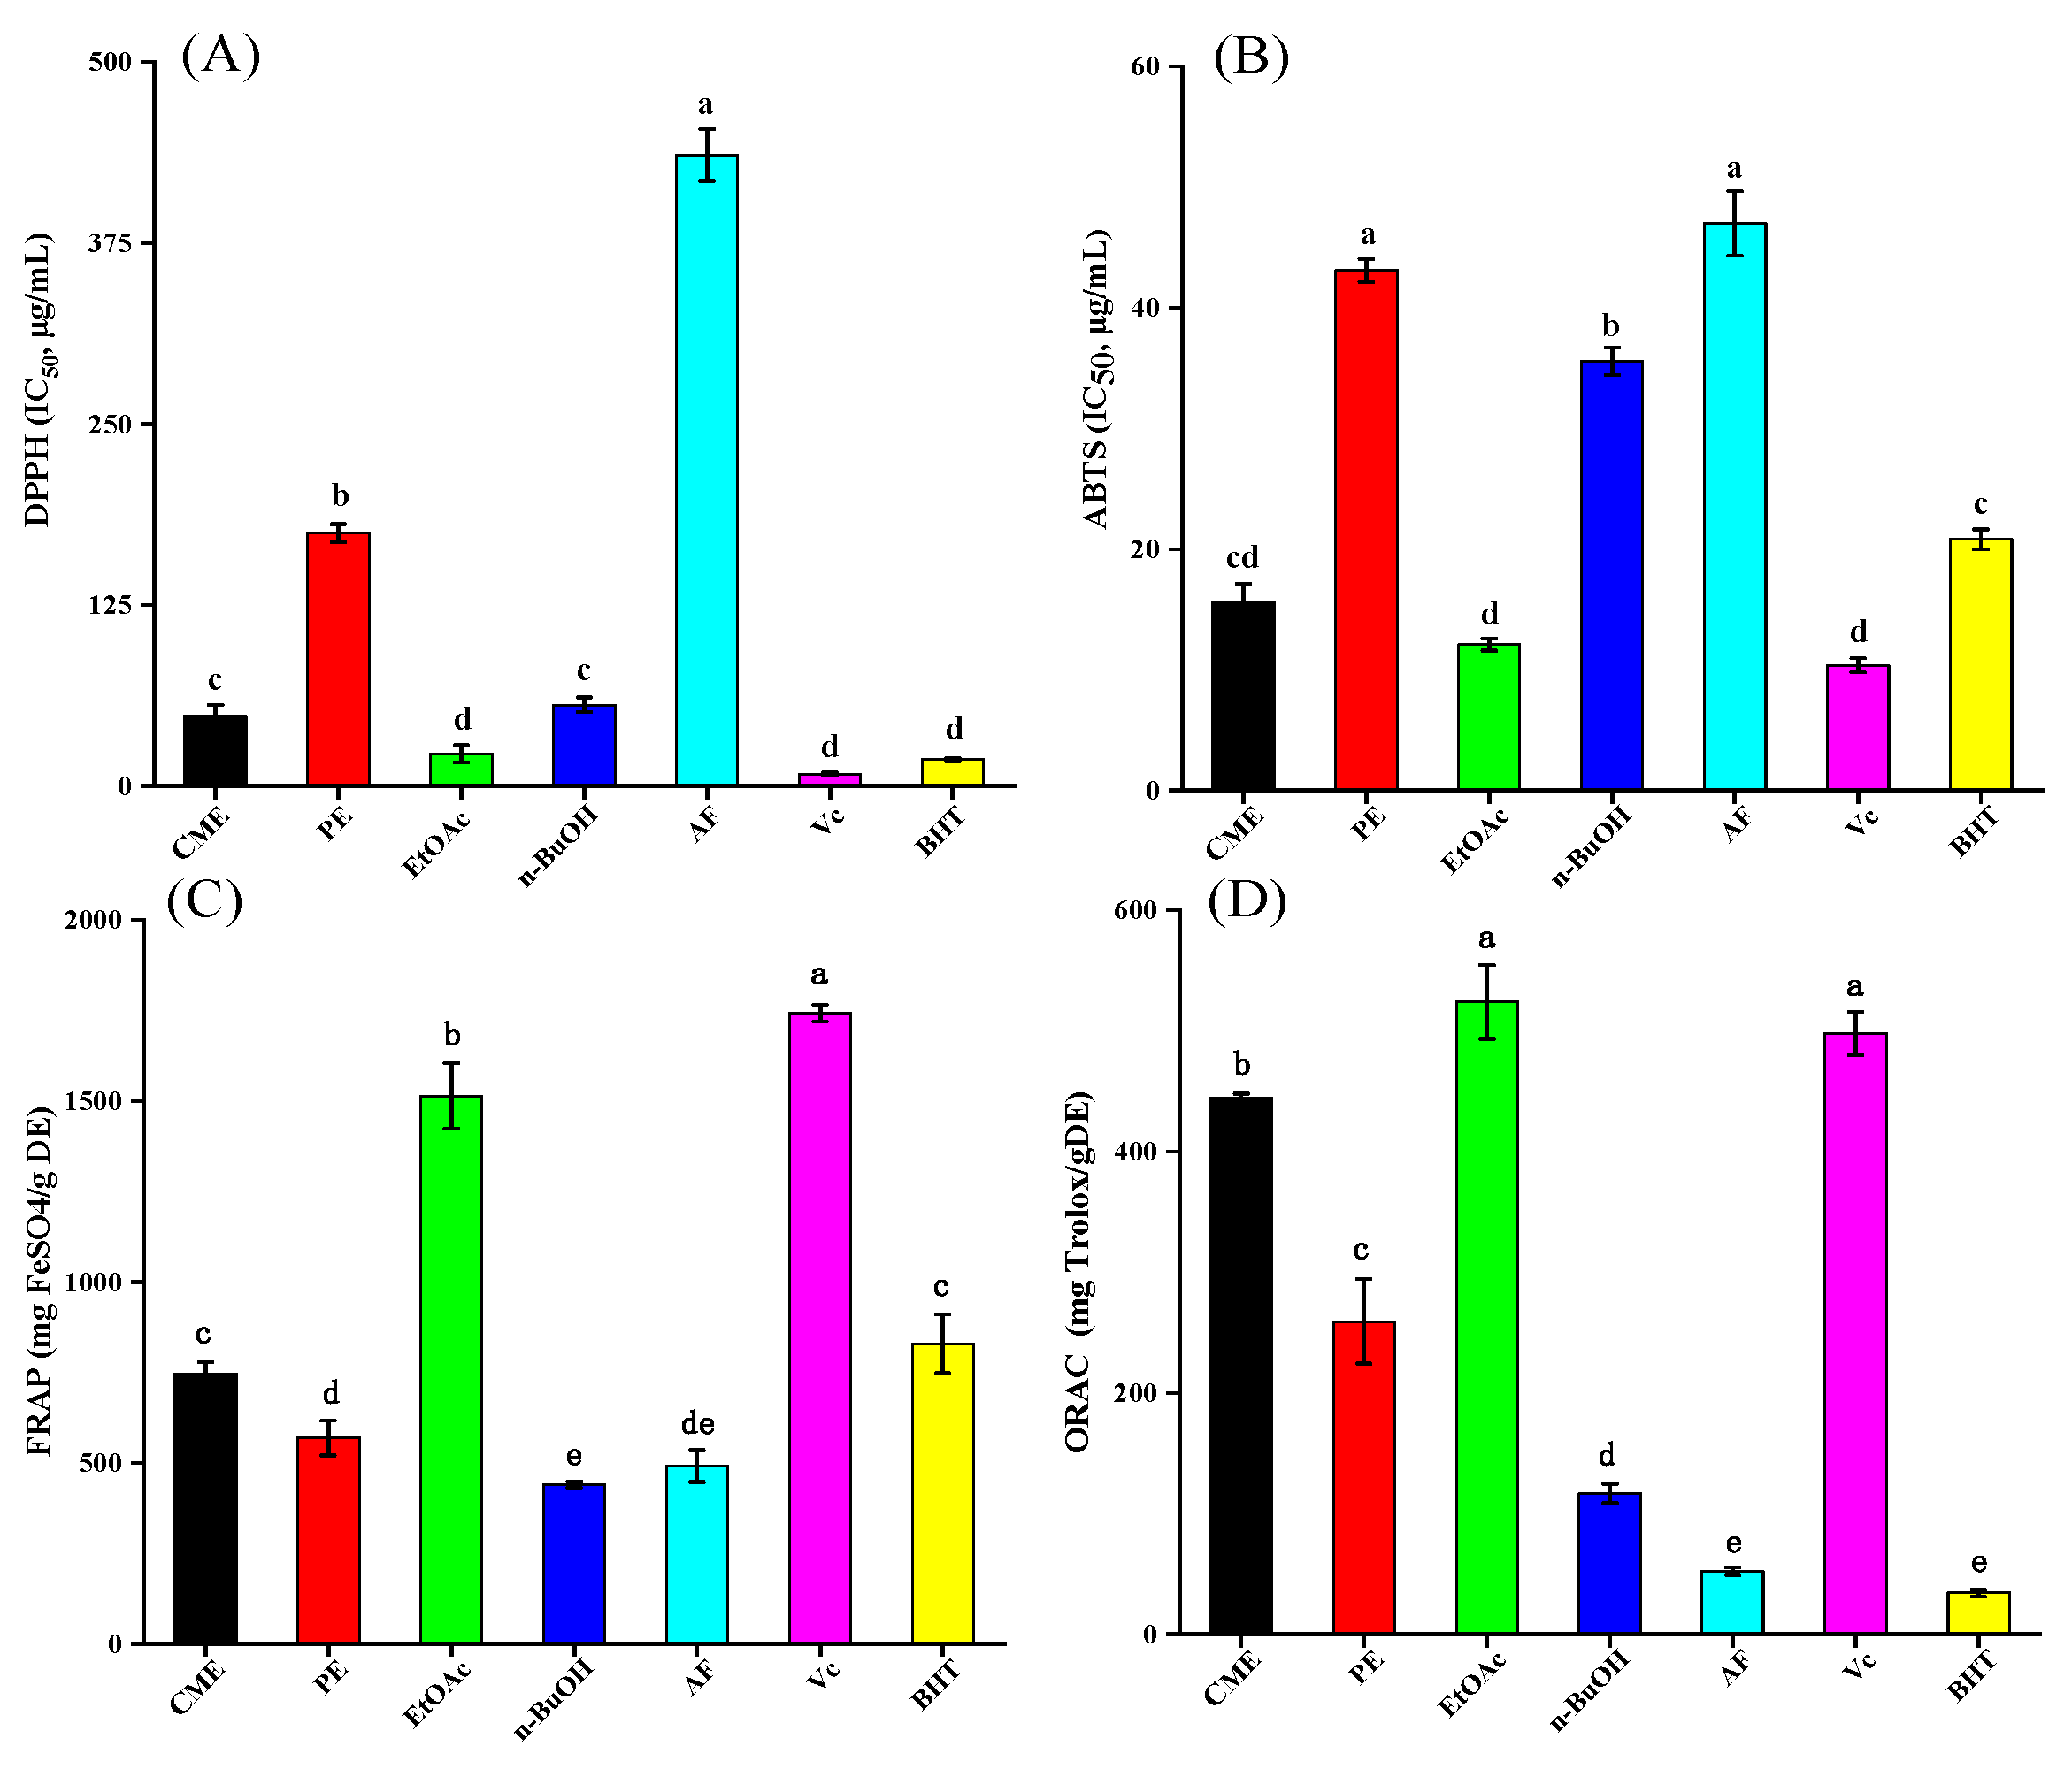
2.2. Antioxidant Activity
2.2.1. DPPH Radical Scavenging Activity
2.2.2. ABTS Radical Scavenging Activity
2.2.3. Ferric Reducing Antioxidant Power
2.2.4. Oxygen Radical Absorbance Capacity
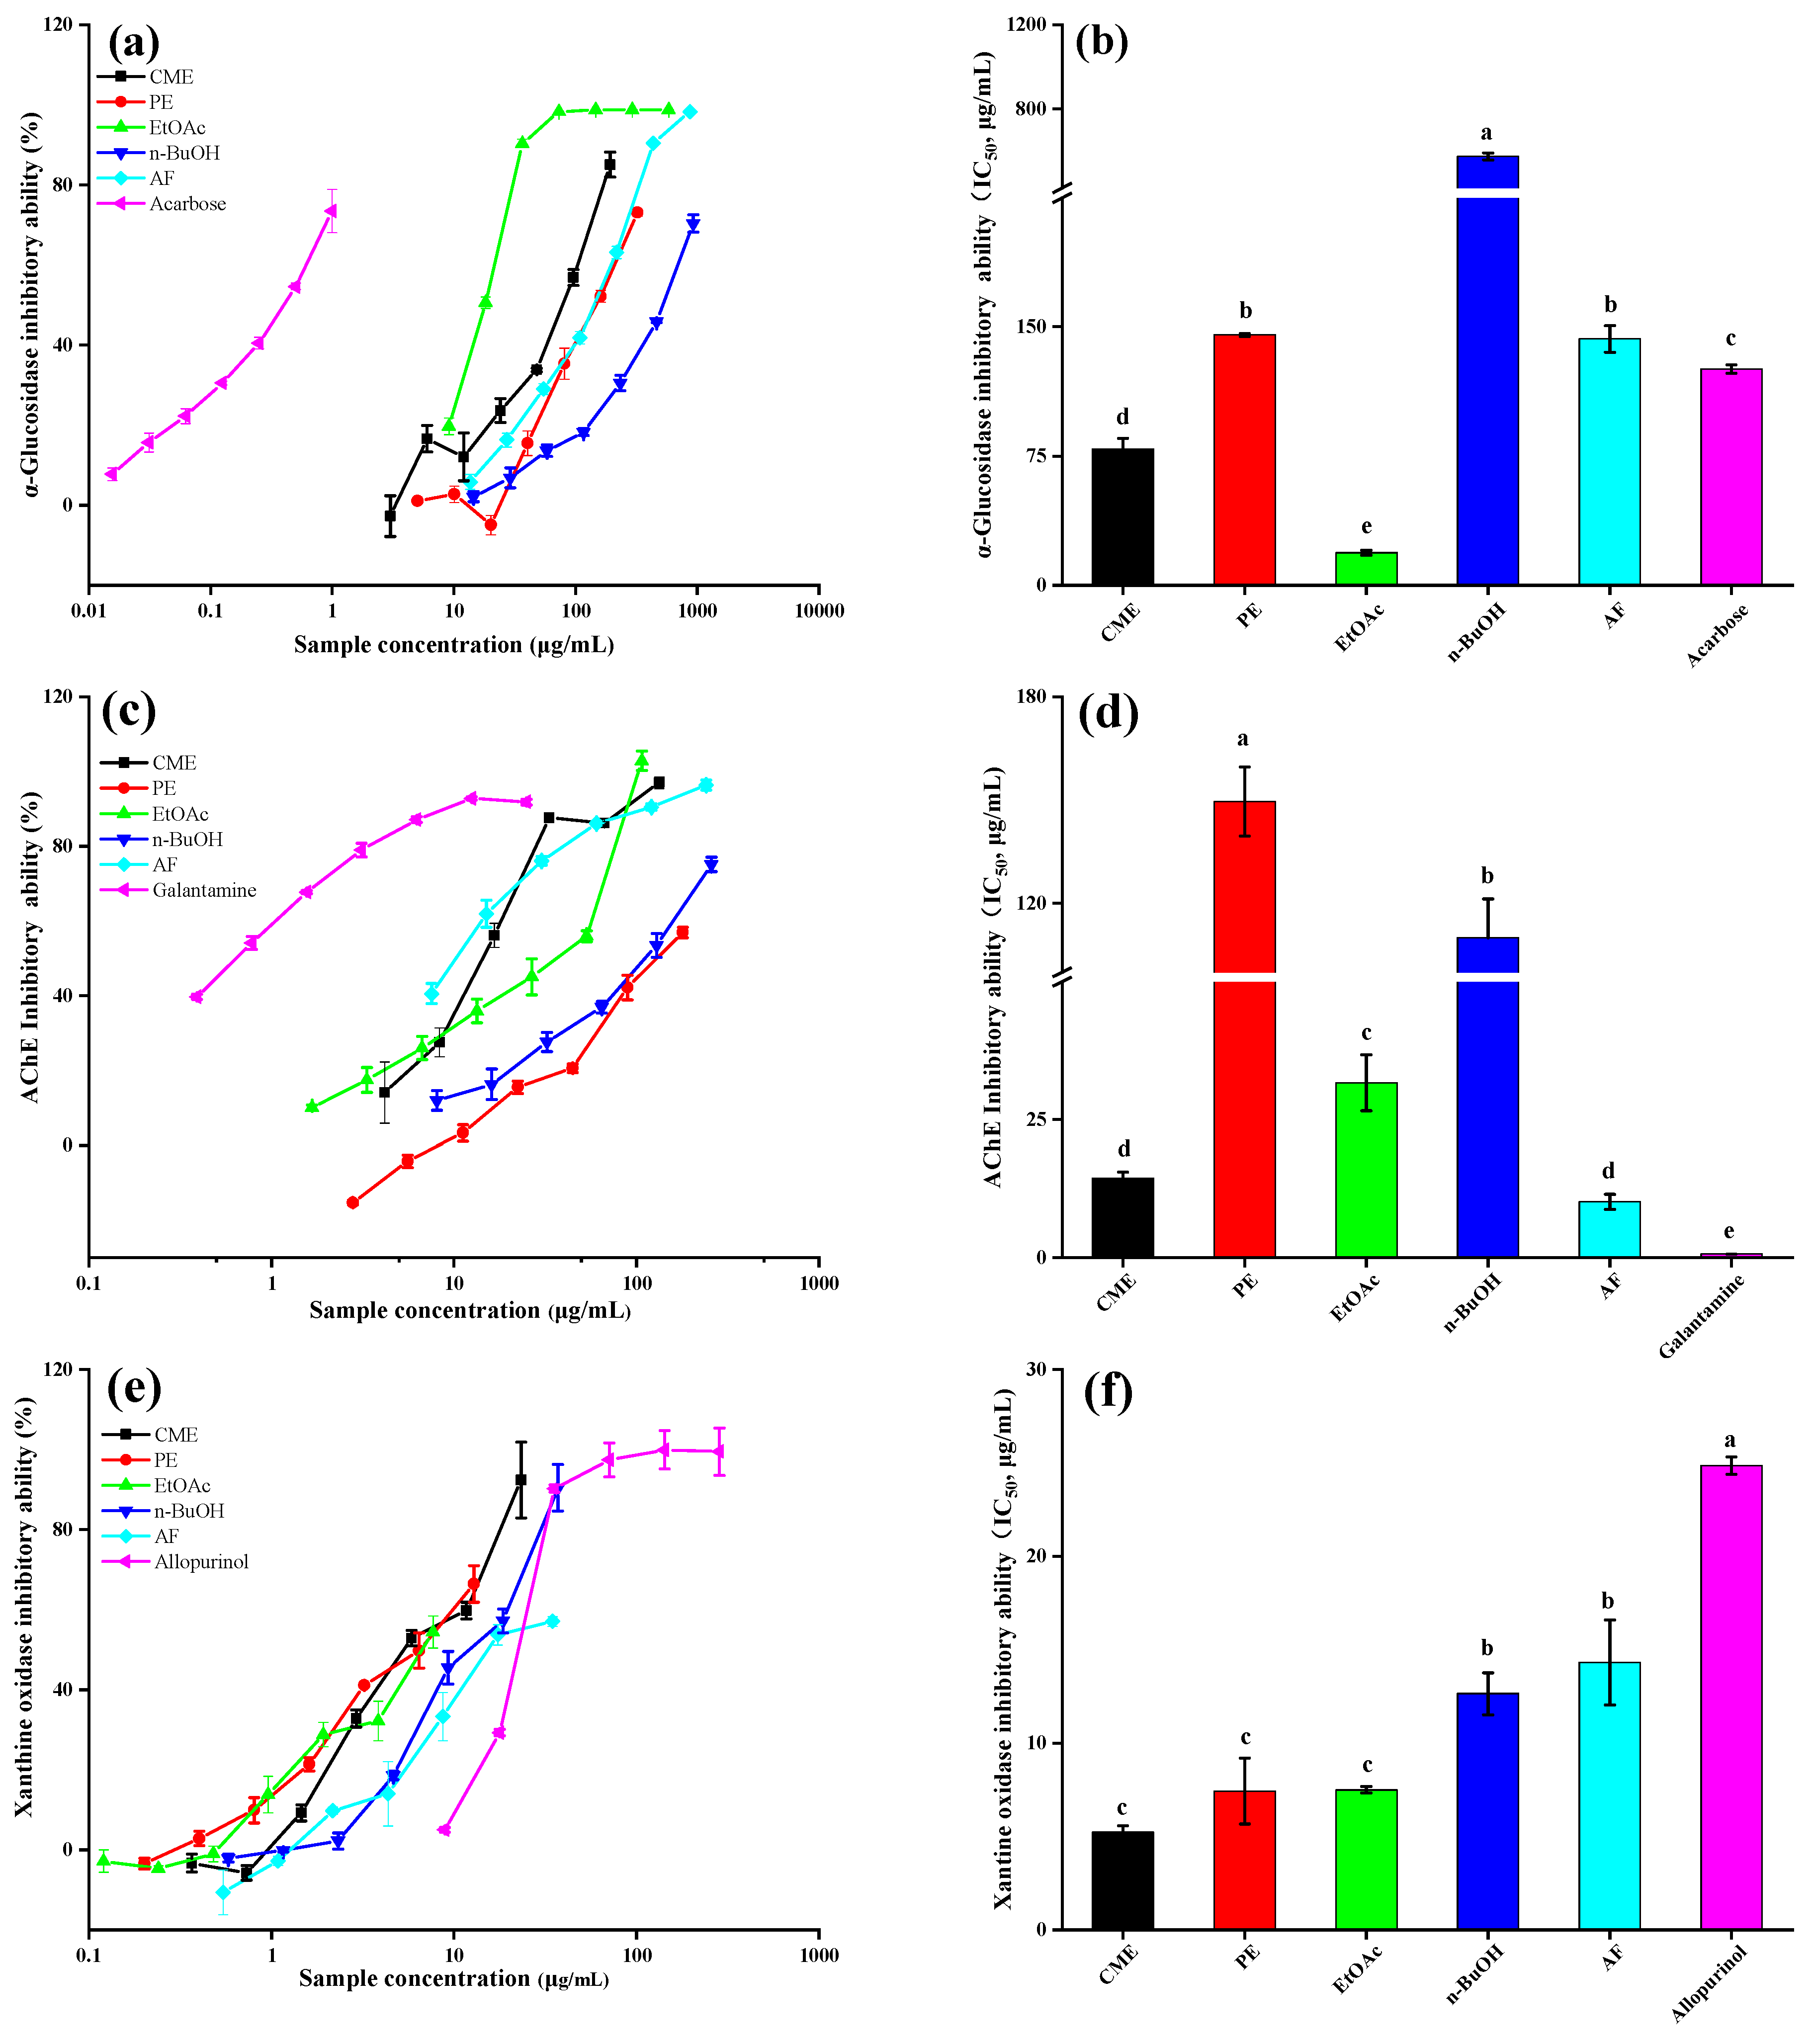
2.3. α-Glucosidase Inhibitory Ability
2.4. Acetylcholinesterase Inhibitory Ability
2.5. Xanthine Oxidase Inhibitory Ability
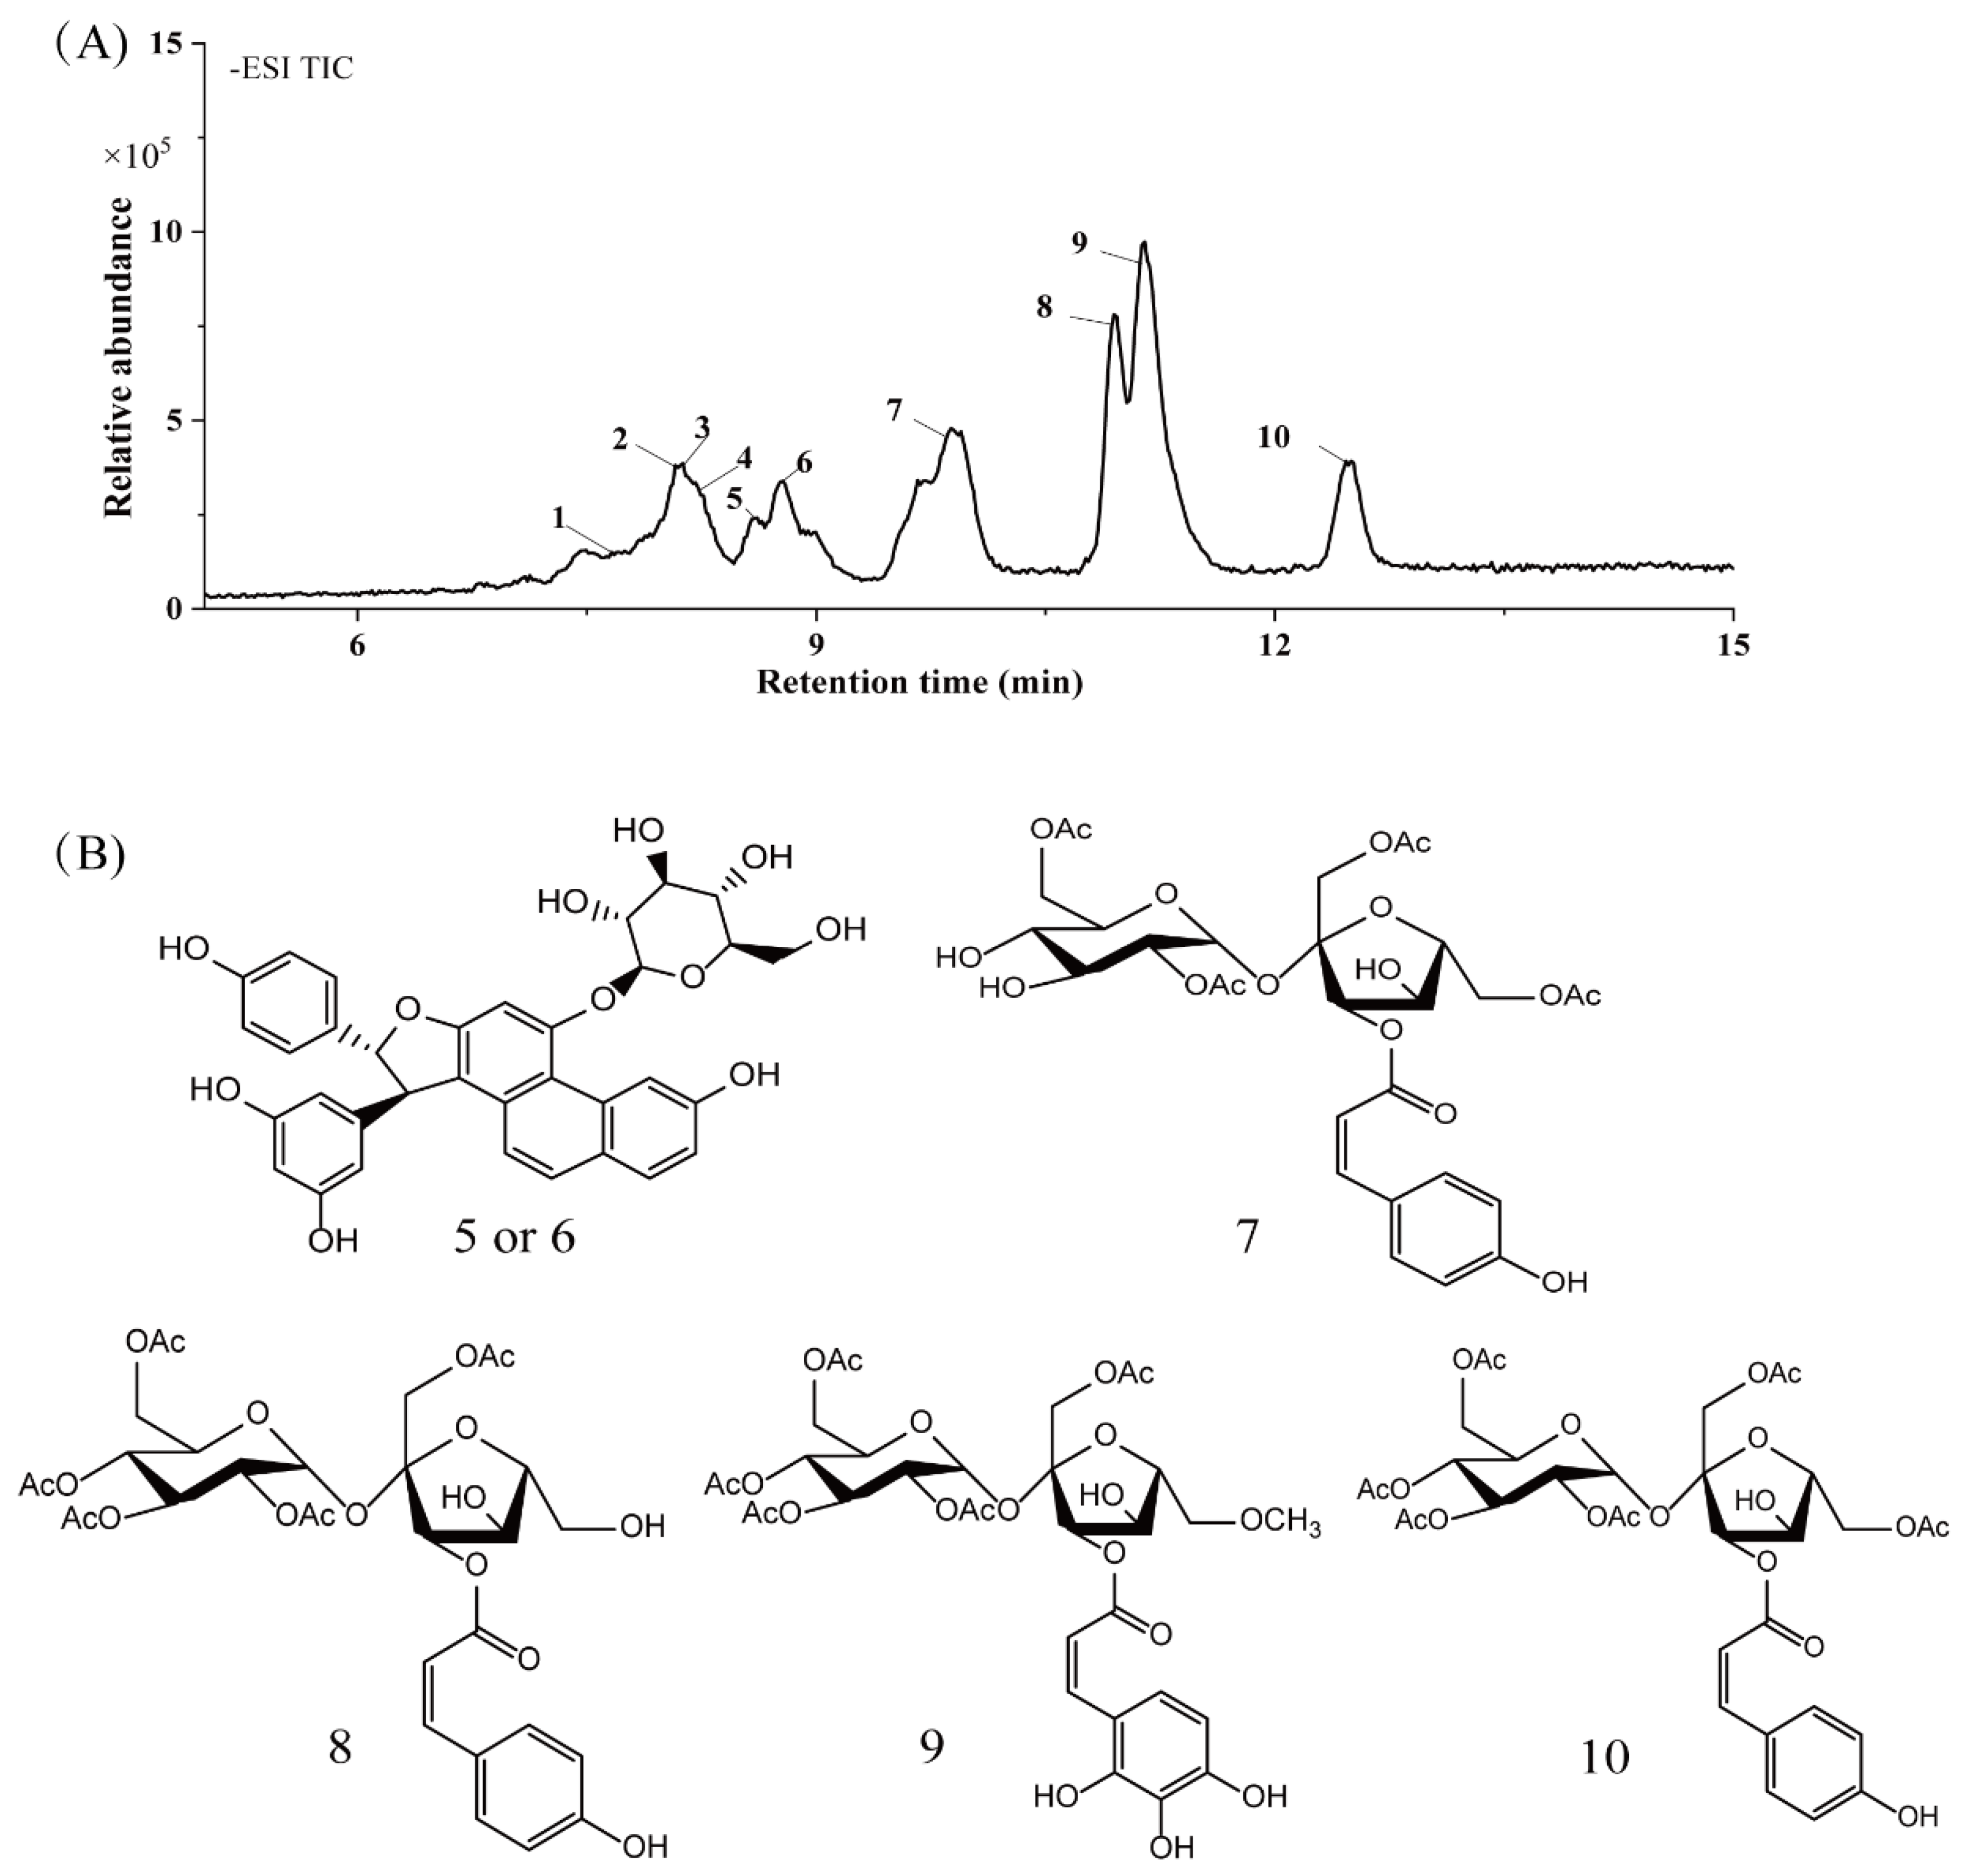
2.6. HPLC-MS/MS Analysis

| RT (time) | MS [M-H] | Molecular Formula | Molecular Weight | Concentration (ppm) | MS/MS Fragments | Name of Compounds | Classification | Reference | |
|---|---|---|---|---|---|---|---|---|---|
| 1 | 7.673 | 289.0682 | C15H14O6 | 290.079 | 12.28 | 203.0789 | Catechin | Phenolic acids | [30] |
| 2 | 8.056 | 571.1620 | C32H28O10 | 572.1682 | −1.8 | 117.03,145.0261, 252.0938 | Daphuribirin D | Terpenoids | [31] |
| 3 | 8.129 | 723.4958 | C37H72O13 | 724.4973 | −7.98 | 207.1456,660.0386, 677.4916 | Epiatechin derivative | Flavonoids | [32] |
| 4 | 8.229 | 836.5792 | C51H81O9 | 837.5822 | 1.89 | 109.2067,230.8014, 790.5704 | unknown | - | - |
| 5 | 8.579 | 613.1719 | C34H30O11 | 614.1788 | −0.59 | 117.0314, 145.0279, 146.0321 | Vaterioside A | Flavonoids | [33] |
| 6 | 8.746 | 613.1719 | C34H30O11 | 614.1788 | −0.59 | 145.0279, 146.0321, 163.038 | Vaterioside A isomer | Flavonoids | [33] |
| 7 | 9.864 | 655.1833 | C29H36O17 | 656.1952 | 7.12 | 117.0334, 145.0282, 163.0403 | 1,6,2′,6′-Tetraacetyl-3-O-p-coumaroylsucrose | Flavonoids | [34] |
| 8 | 10.948 | 697.1947 | C31H38O18 | 698.1985 | 5.5 | 145.0283, 163.038, 655.1838 | 1,2′,3′,4′,6′-Pentaacetyl-3-O-p-coumaroylsucrose | Flavonoids | [35] |
| 9 | 11.131 | 743.1991 | C32H40O20 | 744.2113 | 6.61 | 145.028, 163.0393 | 6-Methoxy-1,2′,3′,4′,6′-pentaacetyl-3-O-p-3,4,5-trihydroxy cinnamoylsucrose | Flavonoids | [36] |
| 10 | 12.449 | 739.2032 | C33H40O9 | 740.2164 | 7.97 | 117.0357, 145.0281, 146.03 | 1,6,2′,3′,4′,6′-Hexaacetyl-3-O-p-coumaroylsucrose | Flavonoids | [37] |
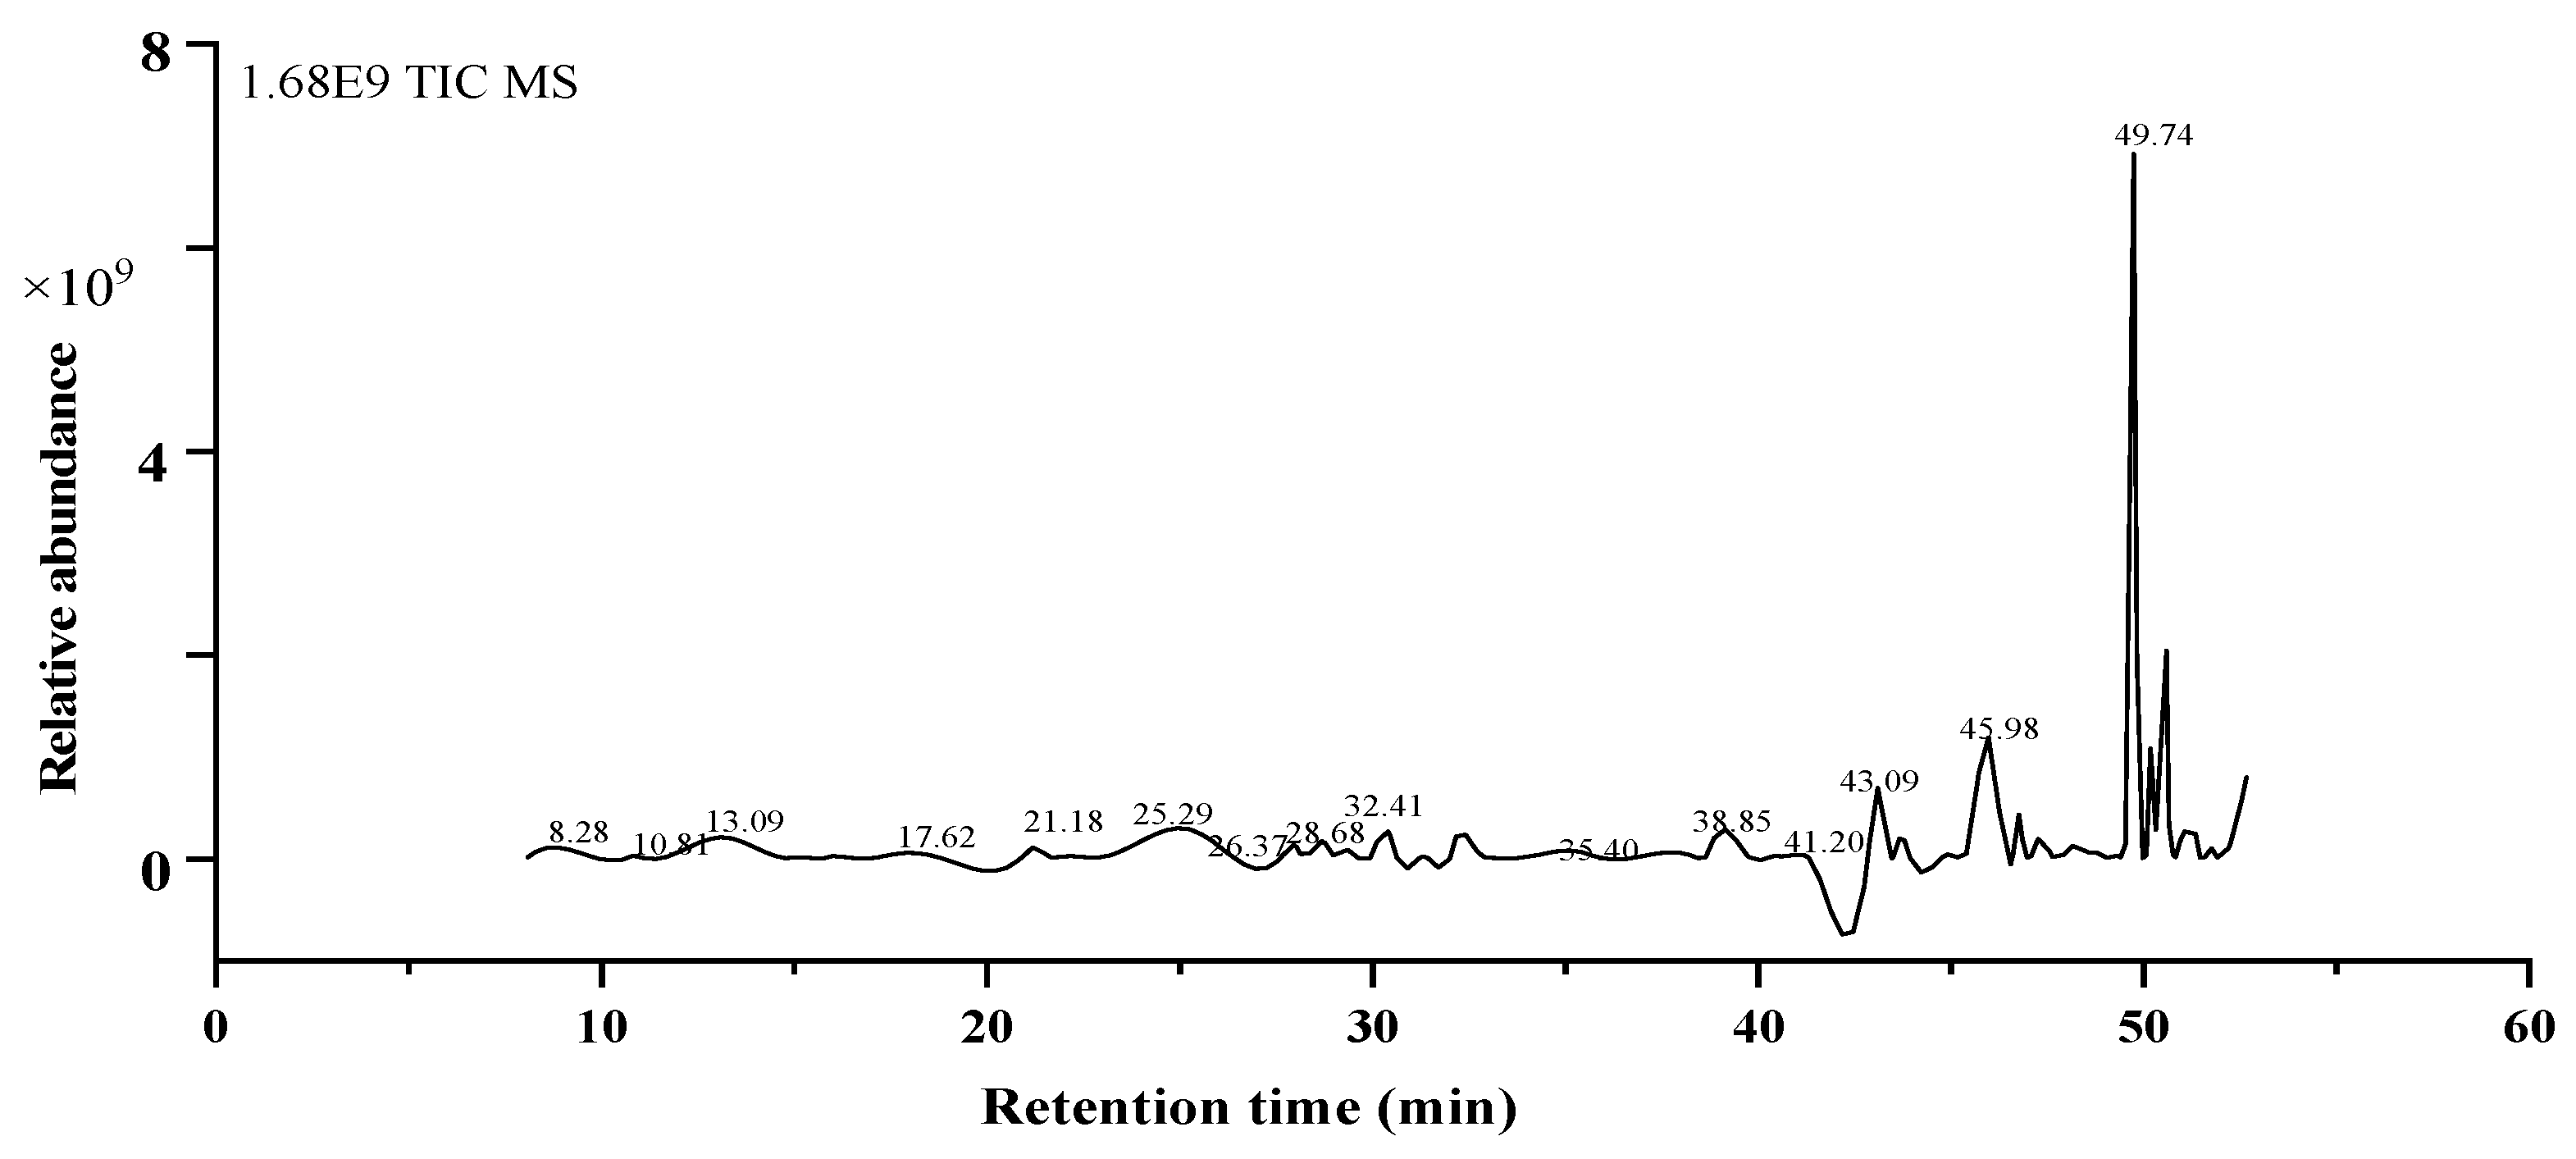
2.7. GC-MS Analysis
3. Discussion
4. Materials and Methods
4.1. Standards and Reagents
4.2. Sample Preparation
4.3. Total Phenolic and Flavonoid Contents
4.4. Antioxidant Activity Determination
4.4.1. DPPH Radical Scavenging Activity
4.4.2. ABTS Radical Scavenging Activity
4.4.3. Ferric Reducing Antioxidant Power Assay
4.4.4. Oxygen Radical Absorbance Capacity (ORAC) Assay
4.5. Enzyme Inhibitory Ability
4.5.1. Inhibition of α-Glucosidase
4.5.2. Inhibition of Acetylcholinesterase
4.5.3. Inhibition of Xanthine Oxidase
4.6. HPLC-MS/MS Analysis
4.7. GC-MS Analysis
4.8. Statistical Analysis
Author Contributions
Funding
Institutional Review Board Statement
Informed Consent Statement
Data Availability Statement
Acknowledgments
Conflicts of Interest
Sample Availability
References
- Ma, H.; Pan, Q.; Wang, L.; Li, Z.; Wan, Y.; Liu, X. Musella lasiocarpa var. rubribracteata (Musaceae), a New Variety from Sichuan, China. Novon J. Bot. Nomencl. 2011, 21, 349–353. [Google Scholar] [CrossRef]
- Novák, P.; Hřibová, E.; Neumann, P.; Koblížková, A.; Doležel, J.; Macas, J. Genome-wide analysis of repeat diversity across the family Musaceae. PLoS ONE 2014, 9, e98918. [Google Scholar] [CrossRef] [PubMed]
- Christelová, P.; Valárik, M.; Hřibová, E.; De Langhe, E.; Doležel, J. A multi gene sequence-based phylogeny of the Musaceae (banana) family. BMC Evol. Biol. 2011, 11, 103. [Google Scholar] [CrossRef] [PubMed] [Green Version]
- Dong, L.-B.; He, J.; Li, X.-Y.; Wu, X.-D.; Deng, X.; Xu, G.; Peng, L.-Y.; Zhao, Y.; Li, Y.; Gong, X.; et al. Chemical constituents from the aerial parts of Musella lasiocarpa. Nat. Prod. BioProspect. 2011, 1, 41–47. [Google Scholar] [CrossRef] [Green Version]
- Long, C.; Ahmed, S.; Wang, X.; Liu, Y.; Long, B.; Yang, C.; Shi, Y.; Li, X.; Guo, R. Why Musella lasiocarpa (Musaceae) is Used in Southwest China to Feed Pigs. Econ. Bot. 2008, 62, 182–186. [Google Scholar] [CrossRef] [Green Version]
- Liu, A.-Z.; Kress, W.J.; Long, C.-L. The ethnobotany of Musella lasiocarpa (Musaceae), an endemic plant of southwest China. Econ. Bot. 2003, 57, 279–281. [Google Scholar] [CrossRef]
- Qin, B.; Lu, R.H.; Wang, H.Q.; Wang, M. Chemical Constituents from Musella lasiocarpa (Franchet) C. Y. Wu. Nat. Prod. Res. Dev. 2000, 12, 41–44. [Google Scholar]
- Yang, W.L.; Tian, J.; Bai, B.R.; Guan, J.F.; Ding, L.S. Chemical constituents of Musella lasiocarpa. Chin. Tradit. Herb. Drugs 2001, 32, 681–683. [Google Scholar]
- Zhang, W.; Hu, X.; Shen, Q.; Xing, D. Mitochondria-specific drug release and reactive oxygen species burst induced by polyprodrug nanoreactors can enhance chemotherapy. Nat. Commun. 2019, 10, 1704. [Google Scholar] [CrossRef] [Green Version]
- Petersen, R.C. Alzheimer’s disease: Progress in prediction. Lancet Neurol. 2010, 9, 4–5. [Google Scholar] [CrossRef] [Green Version]
- Ummat, V.; Tiwari, B.K.; Jaiswal, A.K.; Condon, K.; Garcia-Vaquero, M.; O’Doherty, J.; O’Donnell, C.; Rajauria, G. Optimisation of Ultrasound Frequency, Extraction Time and Solvent for the Recovery of Polyphenols, Phlorotannins and Associated Antioxidant Activity from Brown Seaweeds. Mar. Drugs 2020, 18, 250. [Google Scholar] [CrossRef]
- Chen, J.; Yang, H.; Sheng, Z. Ellagic Acid Activated PPAR Signaling Pathway to Protect Ileums Against Castor Oil-Induced Diarrhea in Mice: Application of Transcriptome Analysis in Drug Screening. Front. Pharmacol. 2020, 10, 1681. [Google Scholar] [CrossRef] [PubMed] [Green Version]
- Kushairi, N.; Phan, C.W.; Sabaratnam, V.; David, P.; Naidu, M. Lion’s Mane Mushroom, Hericium erinaceus (Bull.: Fr.) Pers. Suppresses H(2)O(2)-Induced Oxidative Damage and LPS-Induced Inflammation in HT22 Hippocampal Neurons and BV2 Microglia. Antioxidants 2019, 8, 261. [Google Scholar] [CrossRef] [Green Version]
- Ben Mefteh, F.; Daoud, A.; Chenari Bouket, A.; Thissera, B.; Kadri, Y.; Cherif-Silini, H.; Eshelli, M.; Alenezi, F.N.; Vallat, A.; Oszako, T.; et al. Date Palm Trees Root-Derived Endophytes as Fungal Cell Factories for Diverse Bioactive Metabolites. Int. J. Mol. Sci. 2018, 19, 1986. [Google Scholar] [CrossRef] [PubMed] [Green Version]
- Yu, L.; Zhao, M.; Wang, J.S.; Cui, C.; Yang, B.; Jiang, Y.; Zhao, Q. Antioxidant, immunomodulatory and anti-breast cancer activities of phenolic extract from pine (Pinus massoniana Lamb) bark. Innov. Food Sci. Emerg. Technol. 2008, 9, 122–128. [Google Scholar] [CrossRef]
- Prior, R.L.; Wu, X.; Schaich, K. Standardized Methods for the Determination of Antioxidant Capacity and Phenolics in Foods and Dietary Supplements. J. Agric. Food Chem. 2005, 53, 4290–4302. [Google Scholar] [CrossRef] [PubMed]
- Yao, F.; Xue, Q.; Li, K.; Cao, X.; Sun, L.; Liu, Y. Phenolic Compounds and Ginsenosides in Ginseng Shoots and Their Antioxidant and Anti-Inflammatory Capacities in LPS-Induced RAW264.7 Mouse Macrophages. Int. J. Mol. Sci. 2019, 20, 2951. [Google Scholar] [CrossRef] [Green Version]
- Li, Y.; Guo, C.; Yang, J.; Wei, J.; Xu, J.; Cheng, S. Evaluation of antioxidant properties of pomegranate peel extract in comparison with pomegranate pulp extract. Food Chem. 2006, 96, 254–260. [Google Scholar] [CrossRef]
- Baek, S.H.; Nam, I.J.; Kwak, H.S.; Kim, K.C.; Lee, S.H. Cellular Anti-Melanogenic Effects of a Euryale ferox Seed Extract Ethyl Acetate Fraction via the Lysosomal Degradation Machinery. Int. J. Mol. Sci. 2015, 16, 9217–9235. [Google Scholar] [CrossRef] [Green Version]
- Pimentel, F.B.; Cermeño, M.; Kleekayai, T.; Harnedy-Rothwell, P.A.; Fernandes, E.; Alves, R.C.; Oliveira, M.B.P.P.; FitzGerald, R.J. Enzymatic Modification of Porphyra dioica-Derived Proteins to Improve their Antioxidant Potential. Molecules 2020, 25, 2838. [Google Scholar] [CrossRef]
- Dan, W.-J.; Zhang, Q.; Zhang, F.; Wang, W.-W.; Gao, J.-M. Benzonate derivatives of acetophenone as potent α-glucosidase inhibitors: Synthesis, structure-activity relationship and mechanism. J. Enzym. Inhib. Med. Chem. 2019, 34, 937–945. [Google Scholar] [CrossRef] [Green Version]
- Ofosu, F.K.; Elahi, F.; Daliri, E.B.-M.; Chelliah, R.; Ham, H.J.; Kim, J.-H.; Han, S.-I.; Hur, J.H.; Oh, D.-H. Phenolic Profile, Antioxidant, and Antidiabetic Potential Exerted by Millet Grain Varieties. Antioxidants 2020, 9, 254. [Google Scholar] [CrossRef] [Green Version]
- Kohelová, E.; Peřinová, R.; Maafi, N.; Korábečný, J.; Hulcová, D.; Maříková, J.; Kučera, T.; Martínez González, L.; Hrabinova, M.; Vorčáková, K.; et al. Derivatives of the β-Crinane Amaryllidaceae Alkaloid Haemanthamine as Multi-Target Directed Ligands for Alzheimer’s Disease. Molecules 2019, 24, 1307. [Google Scholar] [CrossRef] [Green Version]
- Laspas, P.; Zhutdieva, M.B.; Brochhausen, C.; Musayeva, A.; Zadeh, J.K.; Pfeiffer, N.; Xia, N.; Li, H.; Wess, J.; Gericke, A. The M(1) muscarinic acetylcholine receptor subtype is important for retinal neuron survival in aging mice. Sci. Rep. 2019, 9, 5222. [Google Scholar] [CrossRef] [PubMed]
- Li, X.; Yan, Z.; Carlström, M.; Tian, J.; Zhang, X.; Zhang, W.; Wu, S.; Ye, F. Mangiferin Ameliorates Hyperuricemic Nephropathy Which Is Associated With Downregulation of AQP2 and Increased Urinary Uric Acid Excretion. Front. Pharmacol. 2020, 11, 49. [Google Scholar] [CrossRef]
- Abdulhafiz, F.; Mohammed, A.; Kayat, F.; Bhaskar, M.; Hamzah, Z.; Podapati, S.K.; Reddy, L.V. Xanthine Oxidase Inhibitory Activity, Chemical Composition, Antioxidant Properties and GC-MS Analysis of Keladi Candik (Alocasia longiloba Miq). Molecules 2020, 25, 2658. [Google Scholar] [CrossRef] [PubMed]
- Sabbagh, F.; Kiarostami, K.; Mahmoudi Khatir, N.; Rezania, S.; Muhamad, I.I. Green Synthesis of Mg(0.99) Zn(0.01)O Nanoparticles for the Fabrication of κ-Carrageenan/NaCMC Hydrogel in order to Deliver Catechin. Polymers 2020, 12, 861. [Google Scholar] [CrossRef] [Green Version]
- Sarker, S.D.; Nahar, L. Progress in the chemistry of naturally occurring coumarins. Prog. Chem. Org. Nat. Prod. 2017, 106, 241–304. [Google Scholar]
- Ferdosian, F.; Ebadi, M.; Mehrabian, R.Z.; Golsefidi, M.A.; Moradi, A.V. Application of Electrochemical Techniques for Determining and Extracting Natural Product (EgCg) by the Synthesized Conductive Polymer Electrode (Ppy/Pan/rGO) Impregnated with Nano-Particles of TiO2. Sci. Rep. 2019, 9, 3940. [Google Scholar] [CrossRef] [PubMed] [Green Version]
- Alimova, D.; Kuliev, Z.; Vdovin, A. Catechins and proanthocyanidines from Alhagi pseudoalhagi. Chem. Nat. Compd. 2007, 43, 326–327. [Google Scholar] [CrossRef]
- Wang, N.-H.; Yoshizaki, K.; Baba, K. Seven new bifuranocoumarins, dahuribirin AG, from Japanese Bai Zhi. Chem. Pharm. Bull. 2001, 49, 1085–1088. [Google Scholar] [CrossRef] [PubMed] [Green Version]
- Zhang, L.; Zhu, M.-F.; Tu, Z.-C.; Zhao, Y.; Wang, H.; Li, G.-J.; Sha, X.-M. a-Glucosidase inhibition, anti-glycation and antioxidant activities of Liquidambar formosana Hance leaf, and identification of phytochemical profile. S. Afr. J. Bot. 2017, 113, 239–247. [Google Scholar] [CrossRef]
- Ito, T.; Masuda, Y.; Abe, N.; Oyama, M.; Sawa, R.; Takahashi, Y.; Chelladurai, V.; Iinuma, M. Chemical constituents in the leaves of Vateria indica. Chem. Pharm. Bull. 2010, 58, 1369–1378. [Google Scholar] [CrossRef] [PubMed] [Green Version]
- Mitani, T.; Horinishi, A.; Kishida, K.; Kawabata, T.; Yano, F.; Mimura, H.; Inaba, N.; Yamanishi, H.; Oe, T.; Negoro, K. Phenolics profile of mume, Japanese apricot (Prunus mume Sieb. et Zucc.) fruit. Biosci. Biotechnol. Biochem. 2013, 77, 1623–1627. [Google Scholar] [CrossRef]
- Jacobs, H.; Koek, G.H.; Peters, R.; Moalin, M.; van der Vij, W.J.; Bast, A.; Haen, G.R.; Tack, J.; van der Vijgh, W.J.; Haenen, G.R. Differences in the metabolicp the antioxidant flavonoid hydroxyethyl)-rutoside and mice. Possible imp cardioprotective. Antioxid. Flavonoid 2011, 7, 107–127. [Google Scholar]
- Alvarez-Parrilla, E. Cinética de secado y efecto de la temperatura sobre las características físicas y compuestos fenólicos de chile jalapeño rojo (Capsicum annuum L.). Inst. Cienc. Biomédicas 2019, 21, 139–147. [Google Scholar] [CrossRef]
- Han, Q.-B.; Xu, H.-X. Caged Garcinia xanthones: Development since 1937. Curr. Med. Chem. 2009, 16, 3775–3796. [Google Scholar] [CrossRef]
- Alkooranee, J.T.; Al-khshemawee, H.H.; Al-badri, M.A.K.; Al-srai, M.S.; Daweri, H.H. Antifungal activity and GC-MS detection of leaves and roots parts of Chenopodium album extract against some phytopathogenic fungi. Indian J. Agric. Res. 2020, 54, 117–121. [Google Scholar] [CrossRef]
- Adisakwattana, S.; Ruengsamran, T.; Kampa, P.; Sompong, W. In Vitro inhibitory effects of plant-based foods and their combinations on intestinal α-glucosidase and pancreatic α-amylase. BMC Complement. Altern. Med. 2012, 12, 110. [Google Scholar] [CrossRef] [PubMed] [Green Version]
- Olennikov, D.N.; Kashchenko, N.I.; Chirikova, N.K.; Akobirshoeva, A.; Zilfikarov, I.N.; Vennos, C. Isorhamnetin and Quercetin Derivatives as Anti-Acetylcholinesterase Principles of Marigold (Calendula officinalis) Flowers and Preparations. Int. J. Mol. Sci. 2017, 18, 1685. [Google Scholar] [CrossRef] [PubMed] [Green Version]
- Gawlik-Dziki, U.; Dziki, L.; Anisiewicz, J.; Habza-Kowalska, E.; Sikora, M.; Dziki, D. Leaves of White Beetroot As a New Source of Antioxidant and Anti-Inflammatory Compounds. Plants 2020, 9, 944. [Google Scholar] [CrossRef] [PubMed]
- Wu, P.; Li, F.; Zhang, J.; Yang, B.; Ji, Z.; Chen, W. Phytochemical compositions of extract from peel of hawthorn fruit, and its antioxidant capacity, cell growth inhibition, and acetylcholinesterase inhibitory activity. BMC Complement. Altern. Med. 2017, 17, 151. [Google Scholar] [CrossRef] [PubMed] [Green Version]
- Liu, Y.; Xu, P.-S.; Ren, Q.; Chen, X.; Zhou, G.; Li, D.; Li, X.-M.; Xu, K.-P.; Yu, X.; Tan, G.-S. Lycodine-type alkaloids from Lycopodiastrum casuarinoides and their cholinesterase inhibitory activities. Fitoterapia 2018, 130, 203–209. [Google Scholar] [CrossRef]
- Afzal, S.; Chaudhry, B.A.; Ahmad, A.; Uzair, M.; Afzal, K. Antioxidant, Acetylcholinesterase, Butyrylcholinesterase, and α-glucosidase Inhibitory Activities of Corchorus depressus. Pharmacogn. Mag. 2017, 13, 647–651. [Google Scholar] [CrossRef]
- Moon, K.; Cha, J. Enhancement of Antioxidant and Antibacterial Activities of Salvia miltiorrhiza Roots Fermented with Aspergillus oryzae. Foods 2020, 9, 34. [Google Scholar] [CrossRef] [PubMed] [Green Version]
- Zhang, L.; Tu, Z.C.; Yuan, T.; Wang, H.; Xie, X.; Fu, Z.F. Antioxidants and alpha-glucosidase inhibitors from Ipomoea batatas leaves identified by bioassay-guided approach and structure-activity relationships. Food Chem. 2016, 208, 61–67. [Google Scholar] [CrossRef]
- Zhang, L.; Tu, Z.-C.; Xie, X.; Lu, Y.; Wang, Z.-X.; Wang, H.; Sha, X.-M. Antihyperglycemic, antioxidant activities of two Acer palmatum cultivars, and identification of phenolics profile by UPLC-QTOF-MS/MS: New natural sources of functional constituents. Ind. Crop. Prod. 2016, 89, 522–532. [Google Scholar] [CrossRef]
- Narwal, S.; Thakur, V.; Sheoran, S.; Dahiya, S.; Jaswal, S.; Gupta, R.K. Antioxidant activity and phenolic content of the Indian wheat varieties. J. Plant Biochem. Biotechnol. 2012, 23, 11–17. [Google Scholar] [CrossRef]
- Arts, M.J.; Haenen, G.R.; Voss, H.P.; Bast, A. Antioxidant capacity of reaction products limits the applicability of the Trolox Equivalent Antioxidant Capacity (TEAC) assay. Food Chem. Toxicol. 2004, 42, 45–49. [Google Scholar] [CrossRef] [PubMed]
- Blažević, I.; Đulović, A.; Čikeš Čulić, V.; Burčul, F.; Ljubenkov, I.; Ruščić, M.; Generalić Mekinić, I. Bunias erucago L.: Glucosinolate Profile and In Vitro Biological Potential. Molecules 2019, 24, 741. [Google Scholar] [CrossRef] [Green Version]
- Huang, D.; Ou, B.; Hampsch-Woodill, M.; Flanagan, J.A.; Prior, R.L. High-throughput assay of oxygen radical absorbance capacity (ORAC) using a multichannel liquid handling system coupled with a microplate fluorescence reader in 96-well format. J. Agric. Food Chem. 2002, 50, 4437–4444. [Google Scholar] [CrossRef]
- Liao, H.; Banbury, L. Different Proportions of Huangqi (Radix Astragali Mongolici) and Honghua (Flos Carthami) Injection on -Glucosidase and -Amylase Activities. Evid. Based Complementary Altern. Med. 2015, 2015, 785193. [Google Scholar] [CrossRef] [PubMed] [Green Version]
- Ellman, G.L.; Courtney, K.D.; Andres, V., Jr.; Featherstone, R.M. A new and rapid colorimetric determination of acetylcholinesterase activity. Biochem. Pharmacol. 1961, 7, 88–95. [Google Scholar] [CrossRef]
- Sahin, H. Honey as an apitherapic product: Its inhibitory effect on urease and xanthine oxidase. J. Enzym. Inhib. Med. Chem. 2016, 31, 490–494. [Google Scholar] [CrossRef] [PubMed] [Green Version]
- Xie, X.; Tu, Z.-C.; Zhang, L.; Zhao, Y.; Wang, H.; Wang, Z.-X.; Zhang, N.-H.; Zhong, B.-Z. Antioxidant activity, α-glucosidase inhibition, and phytochemical fingerprints of Anoectochilus roxburghii formula tea residues with HPLC-QTOF-MS/MS. J. Food Biochem. 2017, 41, e12402. [Google Scholar] [CrossRef]
- Deng, W.; Liu, K.; Cao, S.; Sun, J.; Zhong, B.; Chun, J. Chemical Composition, Antimicrobial, Antioxidant, and Antiproliferative Properties of Grapefruit Essential Oil Prepared by Molecular Distillation. Molecules 2020, 25, 217. [Google Scholar] [CrossRef] [PubMed] [Green Version]

| Samples | TPC | TFC |
|---|---|---|
| CME | 129.40 ± 2.95 b | 187.81 ± 9.74 a |
| PE | 12.67 ± 3.15 e | 0.54 ± 0.03 c |
| EtOAc | 224.99 ± 6.99 a | 178.95 ± 13.04 a |
| n-BuOH | 64.61 ± 1.49 d | 13.04 ± 0.31 bc |
| AF | 111.59 ± 2.50 c | 18.85 ± 1.31 b |
| RT (time) | Name of Compounds | Molecular Formula | Area | Area (%) | Structure | |
|---|---|---|---|---|---|---|
| 1 | 30.44 | Trans-á-santalol | C15H24O | 240,544,370.50 | 1.04 |  |
| 2 | 32.17 | 1,4-Benzenedicarboxylic acid, dimethyl ester | C10H10O4 | 218,812,929.34 | 0.95 |  |
| 3 | 42.89 | Cis-13-eicosenoic acid, methyl ester | C21H40O2 | 1405,375,753.9 | 8.43 |  |
| 4 | 43.78 | Cis-11-eicosenoic acid, methyl ester | C21H40O2 | 181,015,792.24 | 0.78 |  |
| 5 | 45.72 | Eicosanoic acid ME P891 | C21H42O2 | 842,605,575.83 | 3.65 |  |
| 6 | 45.97 | Hexadecanoic acid, methyl ester | C17H34O2 | 1191,145,281.60 | 5.16 | 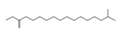 |
| 7 | 46.76 | Phthalic acid, butyl hept-3-yl ester | C19H28O4 | 434,470,530.88 | 1.88 | 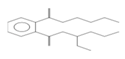 |
| 8 | 46.86 | n-Hexadecanoic acid | C16H32O2 | 186,578,734.29 | 0.81 | 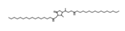 |
| 9 | 49.73 | 9-Octadecenoic acid (Z)-, methyl ester | C19H36O2 | 6915,810,529.98 | 29.96 | 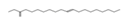 |
| 10 | 49.82 | 9-Octadecenoic acid, methyl ester, (E)- | C19H36O2 | 1950,734,475.62 | 8.45 |  |
| 11 | 50.17 | Methyl stearate | C19H38O2 | 1083,118,959.91 | 4.69 |  |
| 12 | 50.58 | trans-13-Octadecenoic acid | C18H34O2 | 2044,402,879.86 | 8.86 |  |
| 13 | 50.65 | cis-13-Octadecenoic acid | C18H34O2 | 338,345,248.07 | 1.47 |  |
| 14 | 51.35 | Methyl 9-cis,11-transoctadecadienoate | C19H34O2 | 243,690,268.64 | 1.06 |  |
| 15 | 52.66 | Hexacosyl pentafluoropropionate | C29H53F5O2 | 802,126,926.87 | 3.47 |  |
Publisher’s Note: MDPI stays neutral with regard to jurisdictional claims in published maps and institutional affiliations. |
© 2021 by the authors. Licensee MDPI, Basel, Switzerland. This article is an open access article distributed under the terms and conditions of the Creative Commons Attribution (CC BY) license (https://creativecommons.org/licenses/by/4.0/).
Share and Cite
Li, R.; Ru, Y.; Wang, Z.; He, X.; Kong, K.-W.; Zheng, T.; Zhang, X. Phytochemical Composition, Antioxidant Activity, and Enzyme Inhibitory Activities (α-Glucosidase, Xanthine Oxidase, and Acetylcholinesterase) of Musella lasiocarpa. Molecules 2021, 26, 4472. https://doi.org/10.3390/molecules26154472
Li R, Ru Y, Wang Z, He X, Kong K-W, Zheng T, Zhang X. Phytochemical Composition, Antioxidant Activity, and Enzyme Inhibitory Activities (α-Glucosidase, Xanthine Oxidase, and Acetylcholinesterase) of Musella lasiocarpa. Molecules. 2021; 26(15):4472. https://doi.org/10.3390/molecules26154472
Chicago/Turabian StyleLi, Rurui, Yuerong Ru, Zhenxing Wang, Xiahong He, Kin-Weng Kong, Tingting Zheng, and Xuechun Zhang. 2021. "Phytochemical Composition, Antioxidant Activity, and Enzyme Inhibitory Activities (α-Glucosidase, Xanthine Oxidase, and Acetylcholinesterase) of Musella lasiocarpa" Molecules 26, no. 15: 4472. https://doi.org/10.3390/molecules26154472
APA StyleLi, R., Ru, Y., Wang, Z., He, X., Kong, K.-W., Zheng, T., & Zhang, X. (2021). Phytochemical Composition, Antioxidant Activity, and Enzyme Inhibitory Activities (α-Glucosidase, Xanthine Oxidase, and Acetylcholinesterase) of Musella lasiocarpa. Molecules, 26(15), 4472. https://doi.org/10.3390/molecules26154472