Abstract
The drawbacks of utilizing nonrenewable energy have quickened innovative work on practical sustainable power sources (photovoltaics) because of their provision of a better-preserved decent environment which is free from natural contamination and commotion. Herein, the synthesis, characterization, and application of Mo chalcogenide nanoparticles (NP) as alternative sources in the absorber layer of QDSSCs is discussed. The successful synthesis of the NP was confirmed as the results from the diffractive peaks obtained from XRD which were positive and agreed in comparison with the standard. The diffractive peaks were shown in the planes (100), (002), (100), and (105) for the MoS2 nanoparticles; (002), (100), (103), and (110) for the MoSe2 nanoparticles; and (0002), (0004), (103), as well as (0006) for the MoTe2 nanoparticles. MoSe2 presented the smallest size of the nanoparticles, followed by MoTe2 and, lastly, by MoS2. These results agreed with the results obtained using SEM analysis. For the optical properties of the nanoparticles, UV–Vis and PL were used. The shift of the peaks from the red shift (600 nm) to the blue shift (270–275 nm and 287–289 nm (UV–Vis)) confirmed that the nanoparticles were quantum-confined. The application of the MoX2 NPs in QDSSCs was performed, with MoSe2 presenting the greatest PCE of 7.86%, followed by MoTe2 (6.93%) and, lastly, by MoS2, with the PCE of 6.05%.
1. Introduction
Fossil fuels such as coal, oil, and natural gases deliver approximately 80% of the whole world’s energy. Energy generated from nonrenewable energy sources has a drawback of prompted outflow of ozone-harming substances. The emission of greenhouse gases has an effect on the environment as it leads to its degradation as well as to global warming. These drawbacks have quickened innovative work of practical sustainable power sources because of their provision of a better-preserved environment free from natural contamination and commotion. The primary forms of sustainable energy which could potentially be of economic value as suitable alternatives to nonrenewable energy are bioenergy, solar energy photovoltaics, and wind power. The harnessing of solar energy into electricity or other forms of power is conducted with photovoltaic systems and instruments. Solar-based power is utilized on account of its low ecological effect and as an ideal possibility for elective energy sources because of its global accessibility [1,2].
The most readily accessible solar cells are silicon-based solar-powered cells which are the most effective in converting sunlight into electricity. They have been the most effective because they have a strong optical absorption due to sp antibonding coupling, high electron–hole mobilities, and diffusion lengths. Nevertheless, silicon-based solar cells also have disadvantages including an intensive and expensive process of purifying silicon to be used in the solar cells as well as lower efficiency [3,4,5].
A few methodologies have been adopted so as to have solar-powered cells that are competent to overcome the market share of nonrenewable energy sources such as coal and oil. Quantum dots were conjectured during the 1970s and first made in the mid-1980s and have demonstrated effective features that can improve the properties of solar cells. If semiconductor particles are minute, quantum effects become possibly the most important factor, which limit the energies at which electrons and holes can exist in particles. As energy is identified by wavelength, optical properties of a molecule can be fine-tuned relying upon its size. Therefore, particles can be made to transmit or absorb explicit wavelengths of light just by controlling their size [6]. Quantum dots are artificial nanostructures that can have many shifted properties, contingent upon their material and shape. They can be utilized as dynamic materials in single-electron transistors because of their specific electronic properties. The properties of a quantum dot are dictated by its size as well as by its shape, composition, and structure. Quantum dots have found wide use in catalysis, gadgets, photonics, data stockpiling, imaging, medication, or detection [1,6,7].
In solar cells, quantum-confined semiconductor nanocrystals have incredible optical, electronic, and physical properties which further enhance electron generation and transportation around the circuit. Quantum dots (QD) are also much more efficient conductors than their bulk material, and they reduce recombination losses. Their band gap can be designed by manipulating their size and shape. Introducing nanoparticles in the absorber layer of the DSSC enhances the effective surface area and subsequently the dye adsorption [8,9]. A study of new materials with new properties might be favorable in improving the function of photovoltaic devices and utilizing the related innovations. Molybdenum can exhibit very good stability when heated at higher temperatures and allows for good adhesion of the active layer compared to other quantum dots. Therefore, this study focuses on the synthesis and characterization of molybdenum dichalcogenide quantum dots from two-source precursors for application in photovoltaics [10,11].
2. Results
2.1. XRD Analysis
The crystallographic properties of the synthesized metal chalcogenides were determined using X-ray diffraction analysis which was performed at room temperature. Standard hexagonal 2H–MoS2 (JCPDS No. 37-1492), hexagonal 2H–MoSe2 (JCPDS No. 29-0914), and 2H–MoTe2 (JCPDS No. 01-072-011) were used, and the diffraction patterns are shown in Figure 1 below [12,13,14]. The patterns obtained from all the molybdenum chalcogenides were slightly different from the standard hexagonal plane of MoX2 (X = S, Se, Te). The sharp peaks obtained denote that the products obtained were crystalline.
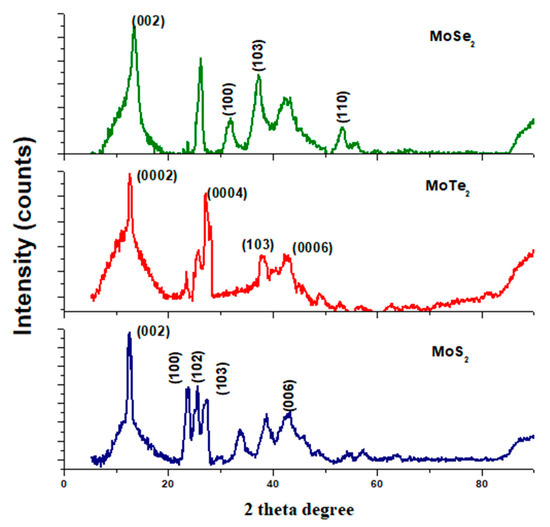
Figure 1.
XRD spectra for the synthesized MoX2 nanomaterials.
Nanocrystals from MoS2 and MoSe2 had the most significantly intense peaks at 12.8° and 13.8°, respectively, and these were both oriented in the (002) plane. This higher intensity of the peaks signifies that the nanocrystals of MoSe2 and MoS2 were of high crystallinity. The sample of MoTe2 exhibited diffraction peaks that were almost similar to the planes (0002), (0004), and (0006) attributed to MoTe2 being perpendicularly oriented to the film plane as shown in Figure 1 and Table 1 [13]. The widening of the XRD peaks observed in Figure 1 for MoSe2 and MoS2 might be due to some stacking faults and structural disorder, hence the widened peaks. Some of the peaks observed did not correspond to the JCPDS reference standards used; the presence of those peaks might be due to some impurities present in the nanomaterials.

Table 1.
XRD parameters of the MoX2 nanoparticles.
The Debye–Scherrer equation (Equation (1)) was used to determine the crystallite size from the half-width of the diffraction peaks [15,16].
where D is the mean particle size; α is the geometric factor (0.94); λ is the x-ray wavelength (1.5406 Å); β is the full width at half maximum (FHWM); θ is the angle of the diffraction peak.
D = (αλ)/βcosθ
The mean particle sizes were calculated, and the values are shown in Table 2; MoSe2 had the smallest particle size, followed by MoTe2 and, lastly, by MoS2. The peak width varied with the crystallite size, although indirectly: the higher the FWHM, the smaller the crystallite size.
Table 2.
XRD parameters and the calculated mean sizes for the nanomaterials.
2.2. SEM Analysis
Scanning electron microscopy (SEM) was utilized to analyze the morphology and grain sizes of the synthesized nanoparticles. Figure 2 shows the images obtained by SEM analysis as well as the particle size distribution. The sample containing the as-synthesized MoS2 showed some dispersion of the nanoparticles with some clusters. A higher degree of aggregation and clustering was also observed in MoTe2 as shown in the SEM images. The MoSe2 nanoparticles were agglomerated as shown in Figure 2. These images are similar to the images published by Zhang et al. in 2017 [15]. The grain size distribution of the nanoparticles was evaluated as well using the results obtained from SEM images using the Image J application (Image J 1.50i, Java 1.8.0_77, Wayne Rasband, National Institute of Health, Bethesda, MA, USA) and Origin 6.1 (V6.1052(B232), OriginLab Cooperation, MA, USA). Table 3 shows the mean particle sizes obtained.
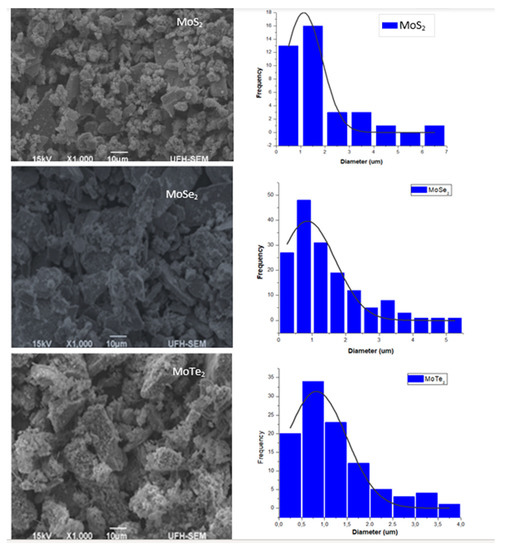
Figure 2.
SEM images and grain size distribution for the molybdenum chalcogenides.
Table 3.
Grain size distribution for the MoX2 NPs calculated using SEM analysis.
From the results obtained, it can be deduced that MoSe2 had the smallest grain size with an average diameter of 0.81718 µm, followed by MoTe2 with 0.82577 µm and, lastly, by MoS2 with the mean grain size of 1.122 µm. The particle sizes of the MoX2 NPs could only be calculated using XRD results, and the particle size of all the nanomaterials fell within the quantum dot nanoparticle range. Only the grain sizes of the agglomerated nanoparticles could be obtained using SEM analysis as it has a lower resolution.
2.3. FTIR Analysis of MoX2 Nanoparticles
The synthesized MoX2 nanoparticles were infrared-active; hence, only FTIR was used to discuss the confirmation of the structure of the synthesized nanomaterials. The successful synthesis of the nanoparticles was confirmed by the availability of the Mo–X peaks in all the three graphs shown in Figure 3. The Mo–Te vibration band was observed at 812 cm−1, Mo–Se—at 689 cm−1, Mo–S—at 459 cm−1. The peaks of the Mo–X stretch observed in these nanomaterials agreed with what is found in the literature [9,11,17]. A C–H stretch was observed at 2920 cm−1 which was attributed to the capping agent TOPO that was used. The other peaks shown in the graphs were due to the composition of the capping agent that was used as well.
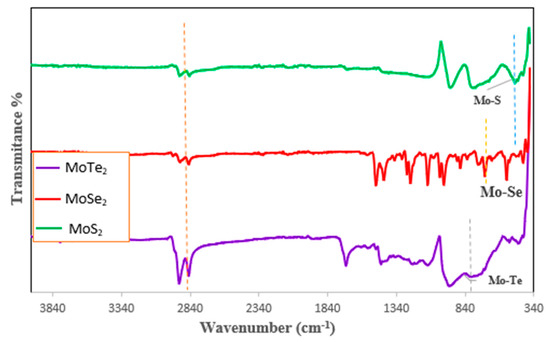
Figure 3.
FTIR spectra for the MoX2 nanoparticles synthesized from two-source precursors.
2.4. Optical Properties of the MoX2 Nanoparticles
The optical properties of the synthesized Mo chalcogenide nanoparticles were studied using ultraviolet–visible spectroscopy (UV–Vis) and photoluminescence (PL) spectroscopy. Figure 4 and Figure 5 show results of the UV–Vis and PL analyses. The nanomaterials were dissolved in a solution to perform the analysis.
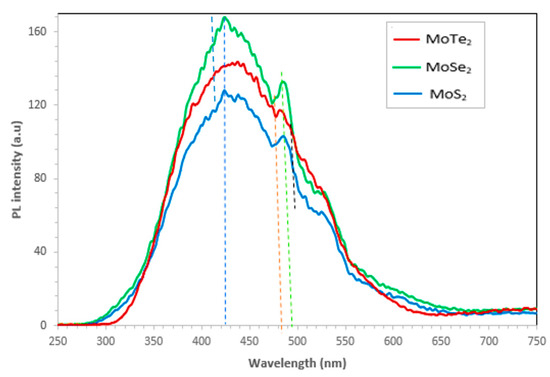
Figure 4.
Emission spectra of the MoX2 (X = S, Se, Te) nanoparticles.
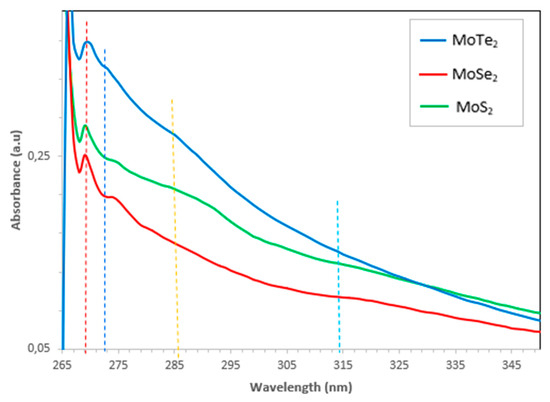
Figure 5.
UV–Vis spectra of the MoX2 (X = S, Se, Te) nanoparticles.
Photoluminescence spectra results for the Mo chalcogenide nanoparticles are shown in Figure 4. The most intense peak was observed for all the MoX2 nanoparticles at 432 nm, signifying the quantum confinement of MoX2. MoSe2 exhibited the highest PL intensity followed by MoTe2 and, lastly, by MoS2; this is attributed to the aggregation and dispersion of the nanoparticles. Hence, high intensity for MoSe2 reveals that the nanoparticles were dispersed, whereas the MoS2 nanoparticles were aggregated. This is further confirmed by the SEM images obtained in Figure 2. Another peak was also observed at 488 nm for all the nanoparticles. Another peak was also exhibited on the spectra for only MoS2 and MoSe2 at 534 nm; this was ascribed to the recombination of holes or electrons that were trapped in surface defect state of the MoX2 nanoparticles [13]. In 2014, Amara et al. recorded a peak of 662 nm for bulk MoS2 [18]; thus, a shift to 488 nm of MoS2 symbolized the synthesis of a monolayer of MoS2 which is a semiconductor with a direct bandgap of approximately 1.92 eV. The photoluminescence characteristics of transition metal chalcogenides can be influenced by the type of solvents used, defects, type of substrate used, intensity of laser excitation, chemical doping, molecular physisorption, as well as heterostructuring [19,20,21].
UV–Vis spectroscopy was used to study the optical properties of the synthesized molybdenum chalcogenide nanoparticles. Basically, the nanoparticle size is directly proportional to the wavelength at the maximum exciton absorption (λmax); hence, as λmax decreases, the nanoparticle size also decreases; this is a result of the photogenerated electron–hole carriers’ quantum confinements. The spectra of the MoX2 are shown in Figure 5 above. Distinctive peaks were observed at 270 nm and 275 nm for all the MoX2 nanoparticles synthesized. Another broad and very shallow peak was again observed at 287–289 nm; this peak was only visible in all the MoS2 and MoTe2 nanoparticles. MoTe2 and MoSe2 presented a very shallow peak at 302–322 nm as shown in the insert. The peaks around 302–322 nm were ascribed to the optical transitions flanked by the state peak density in the conduction and valence bands. The blue shift of the absorption peak clearly indicated that the synthesized MoX2 nanoparticles were quantum-confined. The optical transitions of the synthesized MoX2 nanoparticles were remarkably different from the bulk MoX2. This was further explained by the absence of the K point of the Brillouin zone which typically shows a peak at 615–670 nm. The absence of this peak was due to quantum confinement effects as well as the quasi-incessant electronic energy [17].
2.5. Current–Voltage and Photovoltaic Measurements
The current–voltage characteristics of the developed solar cells utilizing the synthesized chalcogenides as the sensitizer are depicted in Figure 6 and Table 4 below. The efficiency of the developed QDSSCs fabricated from the Mo chalcogenides was calculated using the photovoltaic measurements taken as shown in Figure 6 below. The fill factor and efficiency of the developed cells were calculated using Equations (2) and (3) below:
where PMAX is the maximum power and PIN is the incident power, VOC is the open circuit voltage and ISC is the short circuit current.
PCE = (PMAX/PIN) × 100
FF = (PMAX/VOC × ISC)
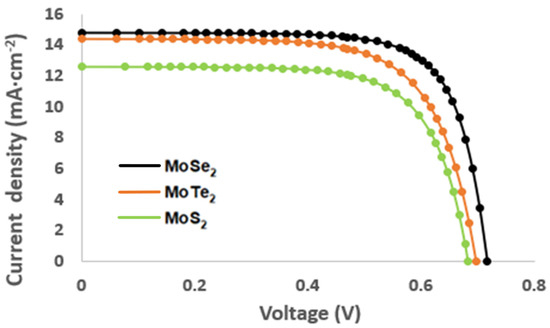
Figure 6.
Current–voltage characteristic of the MoX2 (X = S, Se, Te) nanoparticles.
Table 4.
Photovoltaic parameters of the QDSSCs with the use of the MoX2 nanoparticles as the photoanode.
Power conversion efficiency for the developed solar cells increased in the following order: MoS2 (6.05%) < MoTe2 (6.93%) < MoSe2 (7.05%). MoS2 exhibited the lowest PCE; this was due to the nanoparticles having a higher charge transfer resistance, which resulted in the limitation of electron transfer, subsequently resulting in low electron–hole recombination, hence, in limited efficiency [22]. Low efficiency might be due to the increased surface area and thickness on the photoanode which results in charge transfer resistance [23,24]. Furthermore, according to the chemical composition of the samples, the fill factor (FF) was used to determine the quality of the fabricated QDSSCs. MoSe2 demonstrated the best quality of the cell as it had an FF of 73.7%, followed by MoS2 that had an FF of 70.6% and, lastly, by MoTe2 with an FF of 68%. The variation in the FF can be attributed to higher rates of electron–hole recombination stemming from increased charge transfer resistance which induces lower carrier mobilities leading to a reduced fill factor.
3. Materials and Methods
The chemicals utilized in the synthesis procedure were molybdenum (IV) oxide (Sigma-Aldrich, St Louis, MO, USA, 99.5%); selenium powder (Sigma-Aldrich, St Louis, MO, USA, 99.9%); monoclinic sulfur (Saarchem, Mumbai, India, 98–102%); tellurium dioxide (Sigma-Aldrich St Louis, MO, USA, 99%); oleic acid (Sigma-Aldrich St Louis, MO, USA, 90%); tri-n-octylphosphine oxide (TOPO) (Merck KGaA, Modderfontein, South Africa, 98%).
3.1. Synthesis of the MoX2 Nanoparticles from Two-Source Precursors
The synthesis procedure for ligands and complexes conducted in this work was adopted and modified from the literature and the experiments conducted by Mbese et al., Agoro et al., Meyer et al. [24,25,26], as well as Halimehjane [27]. As an example, to explain the synthesis process, the procedure utilized to synthesize MoS2 was explained. In the solvent (4 mL oleic acid), 2.877 g of MoO2 (0.02 mol) were dissolved. To create a homogenous mixture, the solution was mixed for some time, approximately 10 min, before being transferred to the colloidal setup. In 4 mL of oleic acid, 0.6412 g of sulfur (chalcogenide source, 0.02) was also dissolved and heated with continuous stirring until a homogenous mixture was reached. Two-source precursors were then added to hot TOPO (capping agent) and the temperature was kept constant at 360 °C for an hour. The reaction was then left to cool down to approximately 70 °C; then, ethanol was added to precipitate the nanoparticles. After precipitation, the product was centrifuged at 3500 rpm for 15 min thrice. Toluene was then added to disperse the synthesized nanoparticles.
The same procedure was used for the synthesis of MoSe2 and MoTe2 with Se powder used as a Se source for MoSe2 synthesis and tellurium dioxide as a Te source for MoTe2 synthesis. MoO3 was kept as a Mo source in all the syntheses of the MoX2 nanoparticles. Figure 7 above shows the schematic route taken for the synthesis of the nanoparticles.
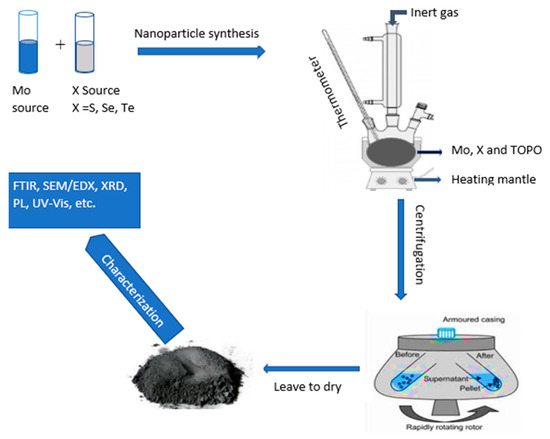
Figure 7.
Synthesis procedure for the molybdenum chalcogenide nanoparticles from two-source precursors.
3.2. Characterization
The morphology, crystallinity studies of the samples and particle size determination, was determined using a Bruker D8 X-ray diffractometer (Bruker, Madison, WI, USA). A Perkin-Elmer Lambda 25 UV–Vis spectrophotometer (Perkin Elmer, Boston, MA, USA) with the infrared data collected at 4000–300 cm−1 and a Perkin-Elmer Lambda 45 Fluorimeter (Perkin Elmer, Boston, MA, USA) at 250–800 nm were used to study the optical properties. Fourier-transform infrared spectroscopy was performed utilizing a FTIR-ATR Perkin-Elmer 4000 Hz Spectrophotometer (Perkin Elmer, Boston, MA, USA). The I–V photovoltaic measurements were conducted using a Keithley 2400 sourcemeter (Keithley, Cleveland, OH, USA). The developed quantum dot-sensitized solar cell which was utilized for the I–V measurements consisted of a synthesized MoX2 quantum dot as the sensitizer, a titanium dioxide photoanode with a 7.5 × 7.5 mm active area, a platinum counter electrode, and an Iodolyte redox mediator purchased from Solaronix (Solaronix, Aubonne, Switzerland). The quantum dot loading for sensitizing was performed using warm water, MoX2 nanoparticles, and coadsorbents (chenodeoxycholic acid). The Iodolyte redox mediator purchased from Solaronix was used with an iodide species with the molarity of 0.05 M. The thin film of TiO2 was then soaked in a photosensitized solution for 9 h. Platinum and TiO2 loaded with photosensitizer substrates were the intercalated ensuring electrical contacts. The electrolyte was then injected into the enclosed hollow on the left between the electrodes till the whole hollow was filled with the electrolyte. The power conversion efficiency (PCE) which measures how effectively the solar cell converts sunlight to electricity was calculated using Equation (2).
4. Conclusions
In conclusion, molybdenum chalcogenide nanoparticles were successfully synthesized using the colloidal bottom–up approach with the two-source precursor route. Successful synthesis was confirmed by the results shown when the nanoparticles were characterized. XRD results confirmed hexagonal arrangement of MoX2 and the size of all the MoX2 particles to be in the nanoparticle range, with MoS2 having the mean particle size of 1.1342 nm, MoSe2—0.7952 nm, MoTe2—0.8457 nm. FTIR analysis revealed the successful synthesis of MoX2 as vibrational bands were found at 812 cm−1, 689 cm−1, and 459 cm−1 for MoTe2, MoSe2, and MoS2, respectively. PL and UV–Vis revealed the optical properties of the Mo chalcogenides to be quantum-confined as observable peaks were noticed in all the MoX2 nanoparticles ranging from 302–322 nm confirming a blue shift from the red range which is usually around 600–700 nm. The application of the NPs synthesized in the QDSSCs was evaluated and the results showed that MoSe2 was the most efficient compound, with a PCE of 7.86%, followed by MoTe2 with 6.93% and MoS2 with 6.05%. Hence, it can be concluded that MoSe2 is the most efficient as a replacement for the dye in QDSSCs.
Author Contributions
Conceptualization, E.C. and J.M.; methodology, E.C. and N.Z.; writing—original draft preparation, E.C.; writing—review and editing, E.C. and N.Z.; supervision, J.M. and E.M.; funding acquisition, E.M. All authors have read and agreed to the published version of the manuscript.
Funding
This research was funded by the South African National Research Foundation (NRF) Grant Number 122493, Eskom (TESP), the South African Department of Science and Technology (DST), and Govan Mbeki Research and Development Center at the University of Fort Hare.
Institutional Review Board Statement
Not applicable.
Informed Consent Statement
Not applicable.
Data Availability Statement
The data presented in the article are available upon request from the authors.
Acknowledgments
We are grateful for the support from Fort Hare Institute of Technology and the University of Fort Hare’s Chemistry department.
Conflicts of Interest
The authors declare no conflict of interest.
Sample Availability
Samples of the compounds are available from the authors upon request.
References
- Kalenga, M.P.; Govindraju, S.; Airo, M.; Moloto, M.J.; Sikhwivhilu, L.M.; Moloto, N. Fabrication of a Schottky Device Using CuSe Nanoparticles: Colloidal versus Microwave Digestive Synthesis. J. Nanosci. Nanotechnol. 2015, 15, 4480–4486. [Google Scholar] [CrossRef] [PubMed]
- Ewing, R.C.; Runde, W.; Albrecht-Schmitt, T.E. Environmental impact of the nuclear fuel cycle: Fate of actinides. MRS Bull. 2010, 35, 859–866. [Google Scholar] [CrossRef]
- Li, G.; Shrotriya, V.; Huang, J.; Yao, Y.; Moriarty, T.; Emery, K.; Yang, Y. High-efficiency solution processable polymer photovoltaic cells by self-organization of polymer blends. Nat. Mater. 2005, 4, 864–868. [Google Scholar] [CrossRef]
- Son, D.-Y.; Kim, S.-G.; Seo, J.-Y.; Lee, S.-H.; Shin, H.; Lee, D.; Park, N.-G. Universal Approach toward Hysteresis-Free Perovskite Solar Cell via Defect Engineering. J. Am. Chem. Soc. 2018, 140, 1358–1364. [Google Scholar] [CrossRef]
- Grätzel, M. Solar Energy Conversion by Dye-Sensitized Photovoltaic Cells. Inorg. Chem. 2005, 44, 6841–6851. [Google Scholar] [CrossRef]
- Abolhosseini, S.; Heshmati, A.; Altmann, J. A Review of Renewable Energy Supply and Energy Efficiency Technologies; IZA Discussion Paper No. 8145; Elsevier: Amsterdam, The Netherlands, 2014. [Google Scholar]
- Kabashi, S.; Bekteshi, S.; Ahmetaj, S.; Kabashi, G.; Najdovski, D.; Zidansek, A.; Šlaus, I. Effects of Kosovo’s energy use scenarios and associated gas emissions on its climate change and sustainable development. Appl. Energy 2011, 88, 473–478. [Google Scholar] [CrossRef]
- Beard, M.C.; Luther, J.M.; Nozik, A.J.; Sargent, E.H. Multiple exciton generation in semiconductor quantum dots and electronically coupled quantum dot arrays for application to thirdgeneration photovoltaic solar cells. Colloid. Quantum Dot Optoelectron. Photovolt. 2010, 9780521198, 112–147. [Google Scholar] [CrossRef]
- Makinana, S. Synthesis and characterization of CdSe quantum dots for solar cell applications. Master’s Dissertation, University of Fort Hare, Alice, South Africa, 2018. [Google Scholar]
- A Green, M. Third generation photovoltaics: Solar cells for 2020 and beyond. Phys. E Low Dimens. Syst. Nanostruct. 2002, 14, 65–70. [Google Scholar] [CrossRef]
- Hewa-Rahinduwage, C.C.; Geng, X.; Silva, K.L.; Niu, X.; Zhang, L.; Brock, S.L.; Luo, L. Reversible Electrochemical Gelation of Metal Chalcogenide Quantum Dots. J. Am. Chem. Soc. 2020, 142, 12207–12215. [Google Scholar] [CrossRef] [PubMed]
- Wu, Y.; Xu, M.; Chen, X.; Yang, S.; Wu, H.; Pan, J.; Xiong, X. CTAB-assisted synthesis of novel ultrathin MoSe2nanosheets perpendicular to graphene for the adsorption and photodegradation of organic dyes under visible light. Nanoscale 2016, 8, 440–450. [Google Scholar] [CrossRef] [PubMed]
- Park, J.C.; Yun, S.J.; Kim, H.; Park, J.-H.; Chae, S.H.; An, S.-J.; Kim, J.-G.; Kim, S.M.; Kim, K.K.; Lee, Y.H. Phase-Engineered Synthesis of Centimeter-Scale 1T′- and 2H-Molybdenum Ditelluride Thin Films. ACS Nano 2015, 9, 6548–6554. [Google Scholar] [CrossRef]
- Zhou, J.; Naiqin, Z.; Zhang, X.; Shi, C.; Liu, E.; Li, J.; Zhao, N.; Chunsheng, S. 2D Space-Confined Synthesis of Few-Layer MoS2 Anchored on Carbon Nanosheet for Lithium-Ion Battery Anode. ACS Nano 2015, 9, 3837–3848. [Google Scholar] [CrossRef] [PubMed]
- Dar, S.H.; Thirumaran, S.; Selvanayagam, S. Synthesis, spectral and X-ray structural studies on Hg(II) dithiocarbamate complexes: A new precursor for HgS nanoparticles. Polyhedron 2015, 96, 16–24. [Google Scholar] [CrossRef]
- Yang, L.; Cui, X.; Zhang, J.; Wang, K.; Shen, M.; Zeng, S.; Dayeh, S.; Feng, L.; Xiang, B. Lattice strain effects on the optical properties of MoS2 nanosheets. Sci. Rep. 2015, 4, srep05649. [Google Scholar] [CrossRef] [PubMed]
- Cao, H.; Wang, H.; Huang, Y.; Sun, Y.; Shi, S.; Tang, M. Quantification of gold(III) in solution and with a test stripe via the quenching of the fluorescence of molybdenum disulfide quantum dots. Microchim. Acta 2016, 184, 91–100. [Google Scholar] [CrossRef]
- Amara, K.K.; Chu, L.; Kumar, R.; Toh, M.; Eda, G. Wet chemical thinning of molybdenum disulfide down to its monolayer. APL Mater. 2014, 2, 092509. [Google Scholar] [CrossRef]
- Samadi, M.; Sarikhani, N.; Zirak, M.; Zhang, H.; Zhang, H.-L.; Moshfegh, A.Z. Group 6 transition metal dichalcogenide nanomaterials: Synthesis, applications and future perspectives. Nanoscale Horiz. 2018, 3, 90–204. [Google Scholar] [CrossRef] [PubMed]
- Lv, R.; Robinson, J.A.; Schaak, R.E.; Sun, D.; Sun, Y.; Mallouk, T.E.; Terrones, M. Transition Metal Dichalcogenides and Beyond: Synthesis, Properties, and Applications of Single- and Few-Layer Nanosheets. Acc. Chem. Res. 2015, 48, 56–64. [Google Scholar] [CrossRef]
- Gupta, P.; Rahman, A.A.; Subramanian, S.; Gupta, S.; Thamizhavel, A.; Orlova, T.; Rouvimov, S.; Vishwanath, S.; Protasenko, V.; Laskar, M.R.; et al. Layered transition metal dichalcogenides: Promising near-lattice-matched substrates for GaN growth. Sci. Rep. 2016, 6, 23708. [Google Scholar] [CrossRef]
- Alavi, M.; Rahimi, R.; Maleki, Z.; Hosseini-Kharat, M. Improvement of Power Conversion Efficiency of Quantum Dot-Sensitized Solar Cells by Doping of Manganese into a ZnS Passivation Layer and Cosensitization of Zinc-Porphyrin on a Modified Graphene Oxide/Nitrogen-Doped TiO2 Photoanode. ACS Omega 2020, 5, 11024–11034. [Google Scholar] [CrossRef]
- Lu, S.; Peng, S.; Zhang, Z.; Deng, Y.; Qin, T.; Huang, J.; Ma, F.; Hou, J.; Cao, G. Impacts of Mn ion in ZnSe passivation on electronic band structure for high efficiency CdS/CdSe quantum dot solar cells. Dalton Trans. 2018, 47, 9634–9642. [Google Scholar] [CrossRef] [PubMed]
- Agoro, M.A.; Meyer, E.L.; Mbese, J.; Manu, K. Electrochemical Fingerprint of CuS-Hexagonal Chemistry from (Bis(N-1,4-Phenyl-N-(4-Morpholinedithiocarbamato) Copper(II) Complexes) as Photon Absorber in Quantum-Dot/Dye-Sensitised Solar Cells. Catalysts 2020, 10, 300. [Google Scholar] [CrossRef] [Green Version]
- Mbese, J.Z.; Meyer, E.L.; Agoro, M.A. Electrochemical Performance of Photovoltaic Cells Using HDA Capped-SnS Nanocrystal from bis (N-1,4-Phenyl-N-Morpho-Dithiocarbamato) Sn(II) Complexes. Nanomaterials 2020, 10, 414. [Google Scholar] [CrossRef] [Green Version]
- Agoro, M.A.; Mbese, J.Z.; Meyer, E.L. Electrochemistry of Inorganic OCT-PbS/HDA and OCT-PbS Photosensitizers Thermalized from Bis(N-diisopropyl-N-octyldithiocarbamato) Pb(II) Molecular Precursors. Molecules 2020, 25, 1919. [Google Scholar] [CrossRef] [Green Version]
- Halimehjani, A.Z.; Torabi, S.; Amani, V.; Notash, B.; Saidi, M.R. Synthesis and characterization of metal dithiocarbamate derivatives of 3-((pyridin-2-yl)methylamino)propanenitrile: Crystal structure of [3-((pyridin-2-yl)methylamino)propanenitrile dithiocarbamato] nickel(II). Polyhedron 2015, 102, 643–648. [Google Scholar] [CrossRef]
Publisher’s Note: MDPI stays neutral with regard to jurisdictional claims in published maps and institutional affiliations. |
© 2021 by the authors. Licensee MDPI, Basel, Switzerland. This article is an open access article distributed under the terms and conditions of the Creative Commons Attribution (CC BY) license (https://creativecommons.org/licenses/by/4.0/).