
Size Effect of Graphene Quantum Dots on Photoluminescence

 , ,
, ,
Abstract
:1. Introduction
2. Experimental Section
2.1. Synthesis of GQDs
2.2. Computational Details
2.3. Characterization
3. Results and Discussion
4. Conclusions
Supplementary Materials
Author Contributions
Funding
Institutional Review Board Statement
Informed Consent Statement
Data Availability Statement
Conflicts of Interest
References
- Xu, X.Y.; Ray, R.; Gu, Y.L.; Ploehn, H.J.; Gearheart, L.; Raker, K.; Scrivens, W.A. Electrophoretic analysis and purification of fluorescent single-walled carbon nanotube fragments. J. Am. Chem. Soc. 2004, 126, 12736–12737. [Google Scholar] [CrossRef] [PubMed]
- Ju, S.Y.; Kopcha, W.P.; Papadimitrakopoulos, F. Brightly Fluorescent Single-Walled Carbon Nanotubes via an Oxygen-Excluding Surfactant Organization. Science 2009, 323, 1319–1323. [Google Scholar] [CrossRef]
- Baker, S.N.; Baker, G.A. Luminescent Carbon Nanodots: Emergent Nanolights. Angew. Chem. Int. Ed. 2010, 49, 6726–6744. [Google Scholar] [CrossRef] [PubMed]
- Tang, Y.; Rao, L.; Li, Z.; Lu, H.; Yan, C.; Yu, S.; Ding, X.; Yu, B. Rapid synthesis of highly photoluminescent nitrogen-doped carbon quantum dots via a microreactor with foamy copper for the detection of Hg2+ ions. Sens. Actuators B 2018, 258, 637–647. [Google Scholar] [CrossRef]
- Murugesan, B.; Sonamuthu, J.; Pandiyan, N.; Pandi, B.; Samayanan, S.; Mahalingam, S. Photoluminescent reduced graphene oxide quantum dots from latex of Calotropis gigantea for metal sensing, radical scavenging, cytotoxicity, and bioimaging in Artemia salina: A greener route. J. Photochem. Photobiol. B Biol. 2018, 178, 371–379. [Google Scholar] [CrossRef] [PubMed]
- Eda, G.; Lin, Y.Y.; Mattevi, C.; Yamaguchi, H.; Chen, H.A.; Chen, I.S.; Chen, C.W.; Chhowalla, M. Blue Photoluminescence from Chemically Derived Graphene Oxide. Adv. Mater. 2010, 22, 505–509. [Google Scholar] [CrossRef]
- Luo, Y.; Xu, Y.; Li, M.; Sun, L.; Hu, G.; Tang, T.; Wen, J.; Li, X. Tuning the Photoluminescence of Graphene Quantum Dots by Fluorination. J. Nanomater. 2017, 2017, 1–6. [Google Scholar] [CrossRef] [Green Version]
- Yan, X.; Cui, X.; Li, B.; Li, L. Large, solution-processable graphene quantum dots as light absorbers for photovoltaics. Nano Lett. 2010, 10, 1869–1873. [Google Scholar] [CrossRef]
- Li, L.S.; Yan, X. Colloidal Graphene Quantum Dots. J. Phys. Chem. Lett. 2010, 1, 2572–2576. [Google Scholar] [CrossRef]
- Pan, D.; Zhang, J.; Li, Z.; Wu, M. Hydrothermal Route for Cutting Graphene Sheets into Blue-Luminescent Graphene Quantum Dots. Adv. Mater. 2010, 22, 734–738. [Google Scholar] [CrossRef]
- Hawrylak, P.; Peeters, F.; Ensslin, K. Carbononics-integrating electronics, photonics and spintronics with graphene quantum dots. Phys. Status Solidi RRL 2016, 10, 11–12. [Google Scholar] [CrossRef]
- Liu, R.; Wu, D.; Feng, X.; Mullen, K. Bottom-up fabrication of photoluminescent graphene quantum dots with uniform morphology. J. Am. Chem. Soc. 2011, 133, 15221–15223. [Google Scholar] [CrossRef]
- Kim, S.; Hwang, S.W.; Kim, M.-K.; Shin, D.Y.; Shin, D.H.; Kim, C.O.; Yang, S.B.; Park, J.H.; Hwang, E.; Choi, S.-H.; et al. Choi Anomalous behaviors of visible luminescence from graphene quantum dots: Interplay size and shape. ACS Nano 2012, 6, 8203–8208. [Google Scholar] [CrossRef]
- Wang, S.; Li, Z.; Xu, X.; Zhang, G.; Li, Y.; Peng, Q. Amino-Functionalized Graphene Quantum Dots as Cathode Interlayer for Efficient Organic Solar Cells: Quantum Dot Size on Interfacial Modification Ability and Photovoltaic Performance. Adv. Mater. Interfaces 2019, 6, 1801480. [Google Scholar] [CrossRef]
- Fei, H.; Ye, R.; Ye, G.; Gong, Y.; Peng, Z.; Fan, X.; Samuel, E.L.G.; Ajayan, P.M.; Tour, J.M. Boron- and nitrogen-doped graphene quantum dots/graphene hybrid nanoplatelets as efficient electrocatalysts for oxygen reduction. ACS Nano 2014, 8, 10837–10843. [Google Scholar] [CrossRef] [PubMed]
- Tang, L.; Wang, J.J.; Jia, C.T.; Lv, G.X.; Xu, G.; Li, W.T.; Wang, L.; Zhang, J.Y.; Wu, M.H. Simulated solar driven catalytic degradation of psychiatric drug carbamazepine with binary BiVO4 heterostructures sensitized by graphene quantum dots. Appl. Catal. B Environ. 2017, 205, 587–596. [Google Scholar] [CrossRef]
- Yeh, T.F.; Teng, C.Y.; Chen, S.J.; Teng, H. Nitrogen-Doped Graphene Oxide Quantum Dots as Photocatalysts for Overall Water-Splitting under Visible Light Illumination. Adv. Mater. 2014, 26, 3297–3303. [Google Scholar] [CrossRef] [PubMed]
- Luo, Y.; Li, M.; Hu, G.; Tang, T.; Wen, J.; Li, X.; Wang, L. Enhanced photocatalytic activity of sulfur-doped graphene quantum dots decorated with TiO2 nanocomposites. Mater. Res. Bull. 2018, 97, 428–435. [Google Scholar] [CrossRef]
- Ji, Z.; Dervishi, E.; Doorn, S.; Sykora, M. Size-dependent electronic properties of uniform ensembles of strongly confined graphene quantum dots. J. Phys. Chem. Lett. 2019, 10, 953–959. [Google Scholar] [CrossRef] [PubMed]
- Li, Q.; Zhang, S.; Dai, L.; Li, L. Nitrogen-doped colloidal graphene quantum dots and their size-dependent electrocatalytic activity for the oxygen reduction reaction. J. Am. Chem. Soc. 2012, 134, 18932–18935. [Google Scholar] [CrossRef]
- Li, F.; Sun, L.; Luo, Y.; Li, M.; Xu, Y.; Hu, G.; Li, X.; Wang, L. Effect of thiophene S on the enhanced ORR electrocatalytic performance of sulfur-doped graphene quantum dot/reduced graphene oxide nanocomposites. RSC Adv. 2018, 8, 19635–19641. [Google Scholar] [CrossRef] [Green Version]
- Sun, L.; Luo, Y.; Li, M.; Hu, G.; Xu, Y.; Tang, T.; Wen, J.; Li, X.; Wang, L. Role of Pyridinic-N for Nitrogen-doped graphene quantum dots in oxygen reaction reduction. J. Colloid Interface Sci. 2017, 508, 154–158. [Google Scholar] [CrossRef]
- Kim, J.; Lee, B.; Kim, Y.J.; Hwang, S.W. Enhancement of Dye-sensitized Solar Cells Efficiency Using Graphene Quantum Dots as Photoanode. Bull. Korean Chem. Soc. 2019, 40, 56–61. [Google Scholar] [CrossRef] [Green Version]
- Sokolov, P.M.; Zvaigzne, M.A.; Krivenkov, V.A.; Litvin, A.P.; Baranov, A.V.; Fedorov, A.V.; Samokhvalov, P.S.; Nabiev, I.R. Graphene–quantum dot hybrid nanostructures with controlled optical and photoelectric properties for solar cell applications. Russ. Chem. Rev. 2019, 88, 370–386. [Google Scholar] [CrossRef]
- Gevaerd, A.; Banks, C.E.; Bergamini, M.F.; Marcolino-Junior, L.H. Graphene Quantum Dots Modified Screen-printed Electrodes as Electroanalytical Sensing Platform for Diethylstilbestrol. Electroanalysis 2019, 31, 838–843. [Google Scholar] [CrossRef]
- Wang, L.; Li, W.; Wu, B.; Li, Z.; Wang, S.; Liu, Y.; Pan, D.; Wu, M. Facile synthesis of fluorescent graphene quantum dots from coffee grounds for bioimaging and sensing. Chem. Eng. J. 2016, 300, 75–82. [Google Scholar] [CrossRef]
- Dong, J.; Wang, K.; Sun, L.; Sun, B.; Yang, M.; Chen, H.; Wang, Y.; Sun, J.; Dong, L. Application of graphene quantum dots for simultaneous fluorescence imaging and tumor-targeted drug delivery. Sens. Actuators B 2018, 256, 616–623. [Google Scholar] [CrossRef]
- Wang, L.; Li, W.; Wu, B.; Li, Z.; Pan, D.; Wu, M. Room-temperature synthesis of graphene quantum dots via electron-beam irradiation and their application in cell imaging. Chem. Eng. J. 2017, 309, 374–380. [Google Scholar] [CrossRef]
- Wang, L.; Wu, B.; Li, W.; Li, Z.; Zhan, J.; Geng, B.; Wang, S.; Pan, D.; Wu, M. Industrial production of ultra-stable sulfonated graphene quantum dots for Golgi apparatus imaging. J. Mater. Chem. B 2017, 5, 5355–5361. [Google Scholar] [CrossRef]
- Wang, L.; Li, W.; Li, M.; Su, Q.; Li, Z.; Pan, D.; Wu, M. Ultrastable Amine, Sulfo Cofunctionalized Graphene Quantum Dots with High Two-Photon Fluorescence for Cellular Imaging. ACS Sustain. Chem. Eng. 2018, 6, 4711–4716. [Google Scholar] [CrossRef]
- Wang, L.; Wu, B.; Li, W.; Wang, S.; Li, Z.; Li, M.; Pan, D.; Wu, M. Amphiphilic Graphene Quantum Dots as Self-Targeted Fluorescence Probes for Cell Nucleus Imaging. Adv. Biosys. 2018, 2, 1700191. [Google Scholar] [CrossRef]
- Pan, D.; Guo, L.; Zhang, J.; Xi, C.; Xue, Q.; Huang, H.; Li, J.; Zhang, Z.; Yu, W.; Chen, Z.; et al. Cutting sp2 clusters in graphene sheets into colloidal graphene quantum dots with strong green fluorescence. J. Mater. Chem. 2012, 22, 3314–3318. [Google Scholar] [CrossRef]
- Dong, Y.; Chen, C.; Zheng, X.; Gao, L.; Cui, Z.; Yang, H.; Guo, C.; Chi, Y.; Li, C.M. One-step and high yield simultaneous preparation of single- and multi-layer graphene quantum dots from CX-72 carbon black. J. Mater. Chem. 2012, 22, 8764–8766. [Google Scholar] [CrossRef]
- Li, W.; Li, M.; Liu, Y.; Pan, D.; Li, Z.; Wang, L.; Wu, M. Three Minute Ultrarapid Microwave-Assisted Synthesis of Bright Fluorescent Graphene Quantum Dots for Live Cell Staining and White LEDs. ACS Appl. Nano Mater. 2018, 1, 1623–1630. [Google Scholar] [CrossRef]
- Li, L.; Wu, G.; Yang, G.; Peng, J.; Zhao, J.; Zhu, J.J. Focusing on luminescent graphene quantum dots: Current status and future perspectives. Nanoscale 2013, 5, 4015–4039. [Google Scholar] [CrossRef] [PubMed] [Green Version]
- Qi, C.; Chentian, S.; Chunfeng, Z.; Songyang, P.; Rui, W.; Xuewei, W.; Xiaoyong, W.; Fei, X.; Dengyu, P.; Min, X. Magnetic enhancement of photoluminescence from blue-luminescent graphene quantum dots. Appl. Phys. Lett. 2016, 108, 1–5. [Google Scholar]
- Dong, Y.; Shao, J.; Chen, C.; Li, H.; Wang, R.; Chi, Y.; Lin, X.; Chen, G. Blue luminescent graphene quantum dots and graphene oxide prepared by tuning the carbonization degree of citric acid. Carbon 2012, 50, 4738–4743. [Google Scholar] [CrossRef]
- Wang, K.; Dong, J.; Sun, L.; Chen, H.; Wang, Y.; Wang, C.; Dong, L. Effects of elemental doping on the photoluminescence properties of graphene quantum dots. RSC Adv. 2016, 6, 91225–91232. [Google Scholar] [CrossRef]
- Gu, S.; Hsieh, C.T.; Tsai, Y.Y.; Ashraf Gandomi, Y.; Yeom, S.; Kihm, K.D.; Fu, C.C.; Juang, R.S. Sulfur and Nitrogen Co-Doped Graphene Quantum Dots as a Fluorescent Quenching Probe for Highly Sensitive Detection toward Mercury Ions. ACS Appl. Nano Mater. 2019, 2, 790–798. [Google Scholar] [CrossRef]
- Li, X.; Lau, S.P.; Tang, L.; Ji, R.; Yang, P. Multicolour light emission from chlorine-doped graphene quantum dots. J. Mater. Chem. C 2013, 1, 7308–7313. [Google Scholar] [CrossRef]
- Wang, L.; Wang, Y.; Xu, T.; Liao, H.; Yao, C.; Liu, Y.; Li, Z.; Chen, Z.; Pan, D.; Sun, L.; et al. Gram-scale synthesis of single-crystalline graphene quantum dots with superior optical properties. Nat. Commun. 2014, 5, 5357–5365. [Google Scholar] [CrossRef] [Green Version]
- Kresse, G. Ab initio molecular dynamics for liquid metals. J. Non-Cryst. Solids 1995, 192–193, 222–229. [Google Scholar] [CrossRef]
- Kresse, G.; Furthmuller, J. Efficient iterative schemes for ab initio total-energy calculations using a plane-wave basis set. Phys. Rev. B Condens. Matter. 1996, 54, 11169–11186. [Google Scholar] [CrossRef]
- Kresse, G.; Joubert, D. From ultrasoft pseudopotentials to the projector augmented-wave method. Phys. Rev. B 1999, 59, 1758–1775. [Google Scholar] [CrossRef]
- Blöchl, P.E. Projector augmented-wave method. Phys. Rev. B 1994, 50, 17953–17979. [Google Scholar] [CrossRef] [Green Version]
- Perdew, J.P.; Burke, K.; Ernzerhof, M. Generalized Gradient Approximation Made Simple. Phys. Rev. Lett. 1996, 77, 3865–3868. [Google Scholar] [CrossRef] [PubMed] [Green Version]
- Ding, Z.; Li, F.; Wen, J.; Wang, X.; Sun, R. Gram-scale synthesis of single-crystalline graphene quantum dots derived from lignin biomass. Green Chem. 2018, 20, 1383–1390. [Google Scholar] [CrossRef]
- Peng, J.; Gao, W.; Gupta, B.K.; Liu, Z.; Romero-Aburto, R.; Ge, L.; Song, L.; Alemany, L.B.; Zhan, X.; Gao, G.; et al. Graphene Quantum Dots Derived from Carbon Fibers. Nano Lett. 2012, 12, 844–849. [Google Scholar] [CrossRef] [PubMed]
- Chien, C.T.; Li, S.S.; Lai, W.J.; Yeh, Y.C.; Chen, H.A.; Chen, I.S.; Chen, L.C.; Chen, K.H.; Nemoto, T.; Isoda, S.; et al. Tunable photoluminescence from graphene oxide. Angew. Chem. Int. Ed. 2012, 51, 6662–6666. [Google Scholar] [CrossRef]
- Li, J.L.; Bao, H.C.; Hou, X.L.; Sun, L.; Wang, X.G.; Gu, M. Graphene Oxide Nanoparticles as a Nonbleaching Optical Probe for Two-Photon Luminescence Imaging and Cell Therapy. Angew. Chem. Int. Ed. 2012, 51, 1830–1834. [Google Scholar] [CrossRef]
- Xu, Q.; Zhou, Q.; Hua, Z.; Xue, Q.; Zhang, C.; Wang, X.; Pan, D.; Xiao, M. Single-Particle Spectroscopic Measurements of Fluorescent Graphene Quantum Dots. ACS Nano 2013, 7, 10654–10661. [Google Scholar] [CrossRef] [PubMed] [Green Version]
- Zhu, Z.; Ma, J.; Wang, Z.; Mu, C.; Fan, Z.; Du, L.; Bai, Y.; Fan, L.; Yan, H.; Phillips, D.L.; et al. Efficiency Enhancement of Perovskite Solar Cells through Fast Electron Extraction: The Role of Graphene Quantum Dots. J. Am. Chem. Soc. 2014, 136, 3760–3763. [Google Scholar] [CrossRef] [PubMed]
- Liu, M.L.; Yang, L.; Li, R.S.; Chen, B.B.; Liu, H.; Huang, C.Z. Large-scale simultaneous synthesis of highly photoluminescent green amorphous carbon nanodots and yellow crystalline graphene quantum dots at room temperature. Green Chem. 2017, 19, 3611–3617. [Google Scholar] [CrossRef]
- Suryawanshi, A.; Biswal, M.; Mhamane, D.; Gokhale, R.; Patil, S.; Guin, D.; Ogale, S. Large scale synthesis of graphene quantum dots (GQDs) from waste biomass and their use as an efficient and selective photoluminescence on-off-on probe for Ag+ ions. Nanoscale 2014, 6, 11664–11670. [Google Scholar] [CrossRef]
- Li, M.; Wu, W.; Ren, W.; Cheng, H.M.; Tang, N.; Zhong, W.; Du, Y. Synthesis and upconversion luminescence of N-doped graphene quantum dots. Appl. Phys. Lett. 2012, 101, 103107. [Google Scholar] [CrossRef]


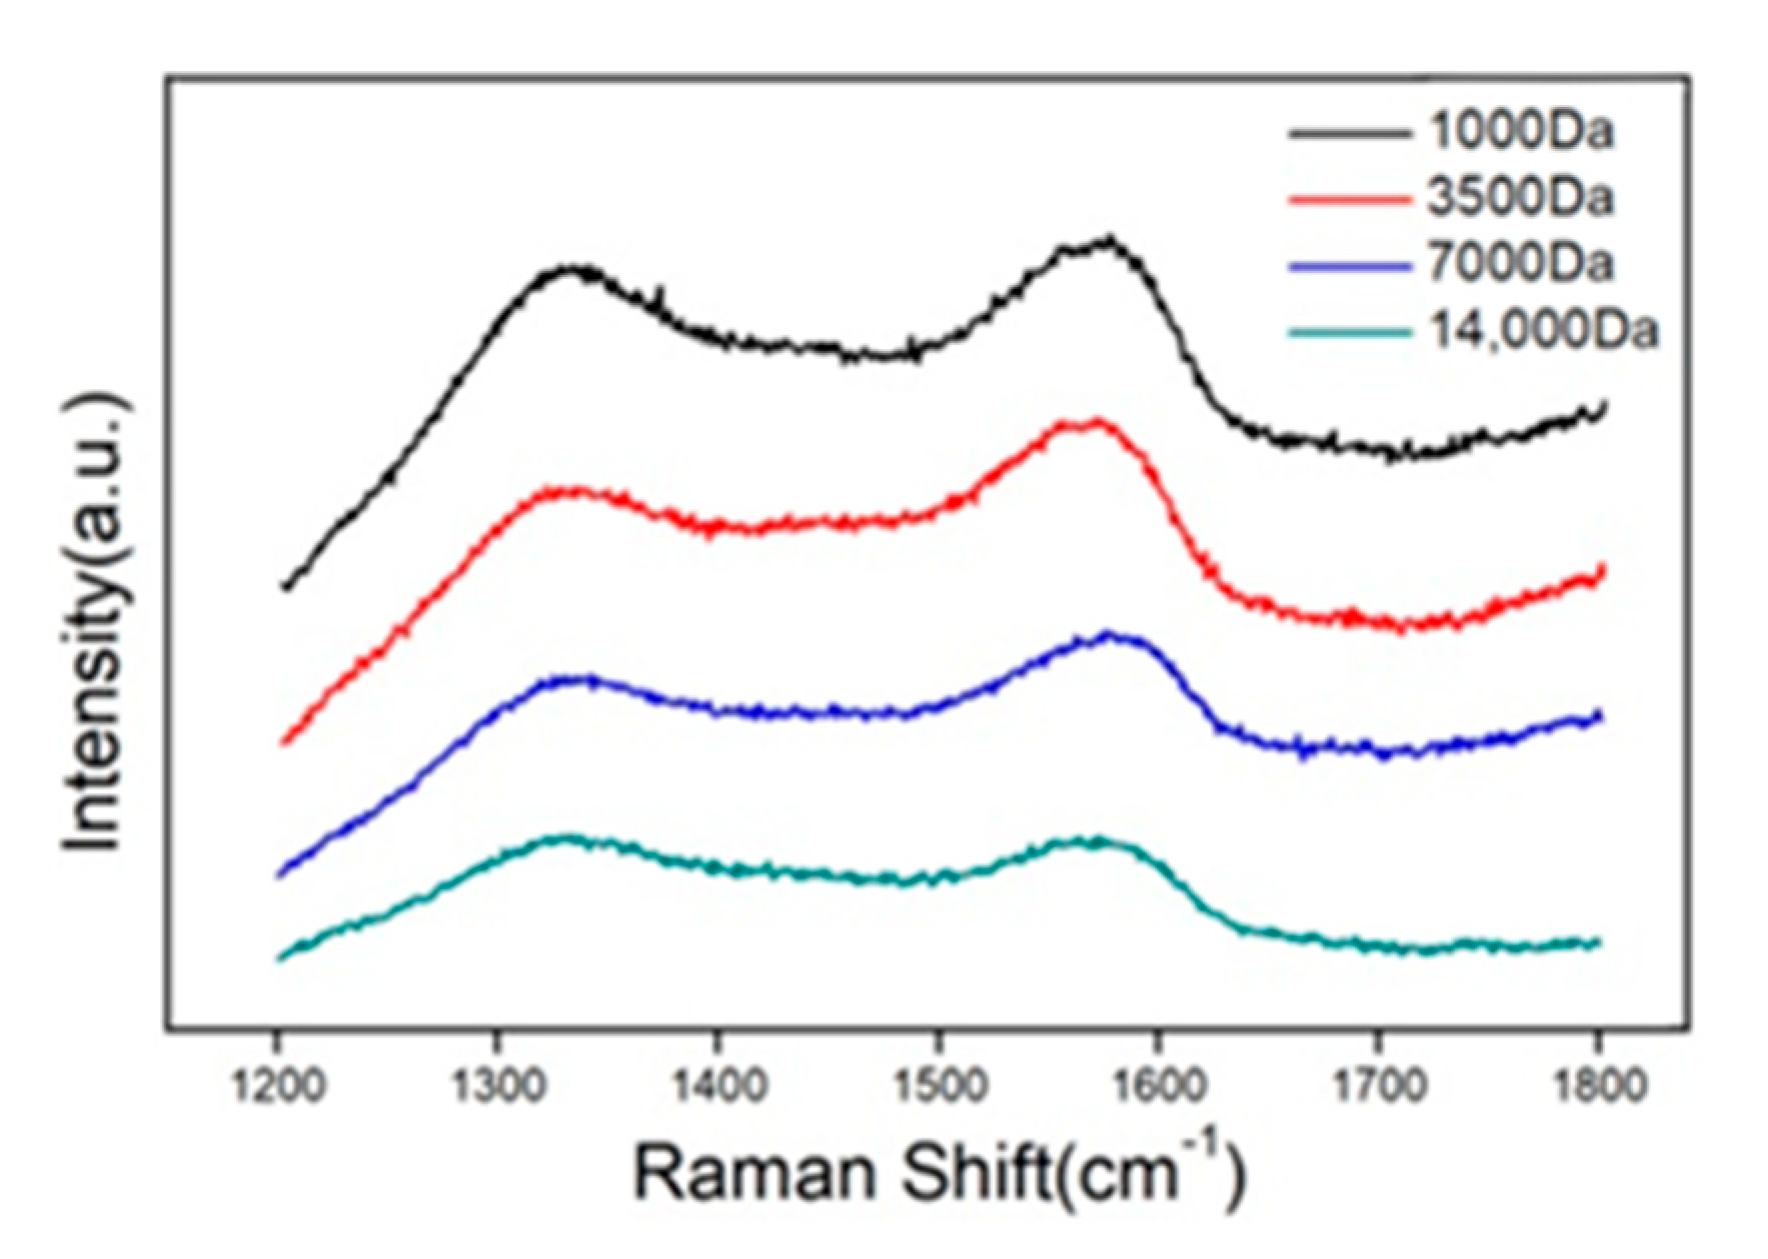
| Samples | |||||
|---|---|---|---|---|---|
| 1000 Da | 1333.5 | 89,594.1 | 1576.61 | 91,445 | 0.98 |
| 3500 Da | 1343.29 | 37,244.3 | 1581.99 | 39,994.2 | 0.93 |
| 7000 Da | 1342.23 | 44,510.4 | 1575.87 | 47,180.2 | 0.94 |
| 14,000 Da | 1333.78 | 34,741.8 | 1572.8 | 34,708.5 | 1.00 |
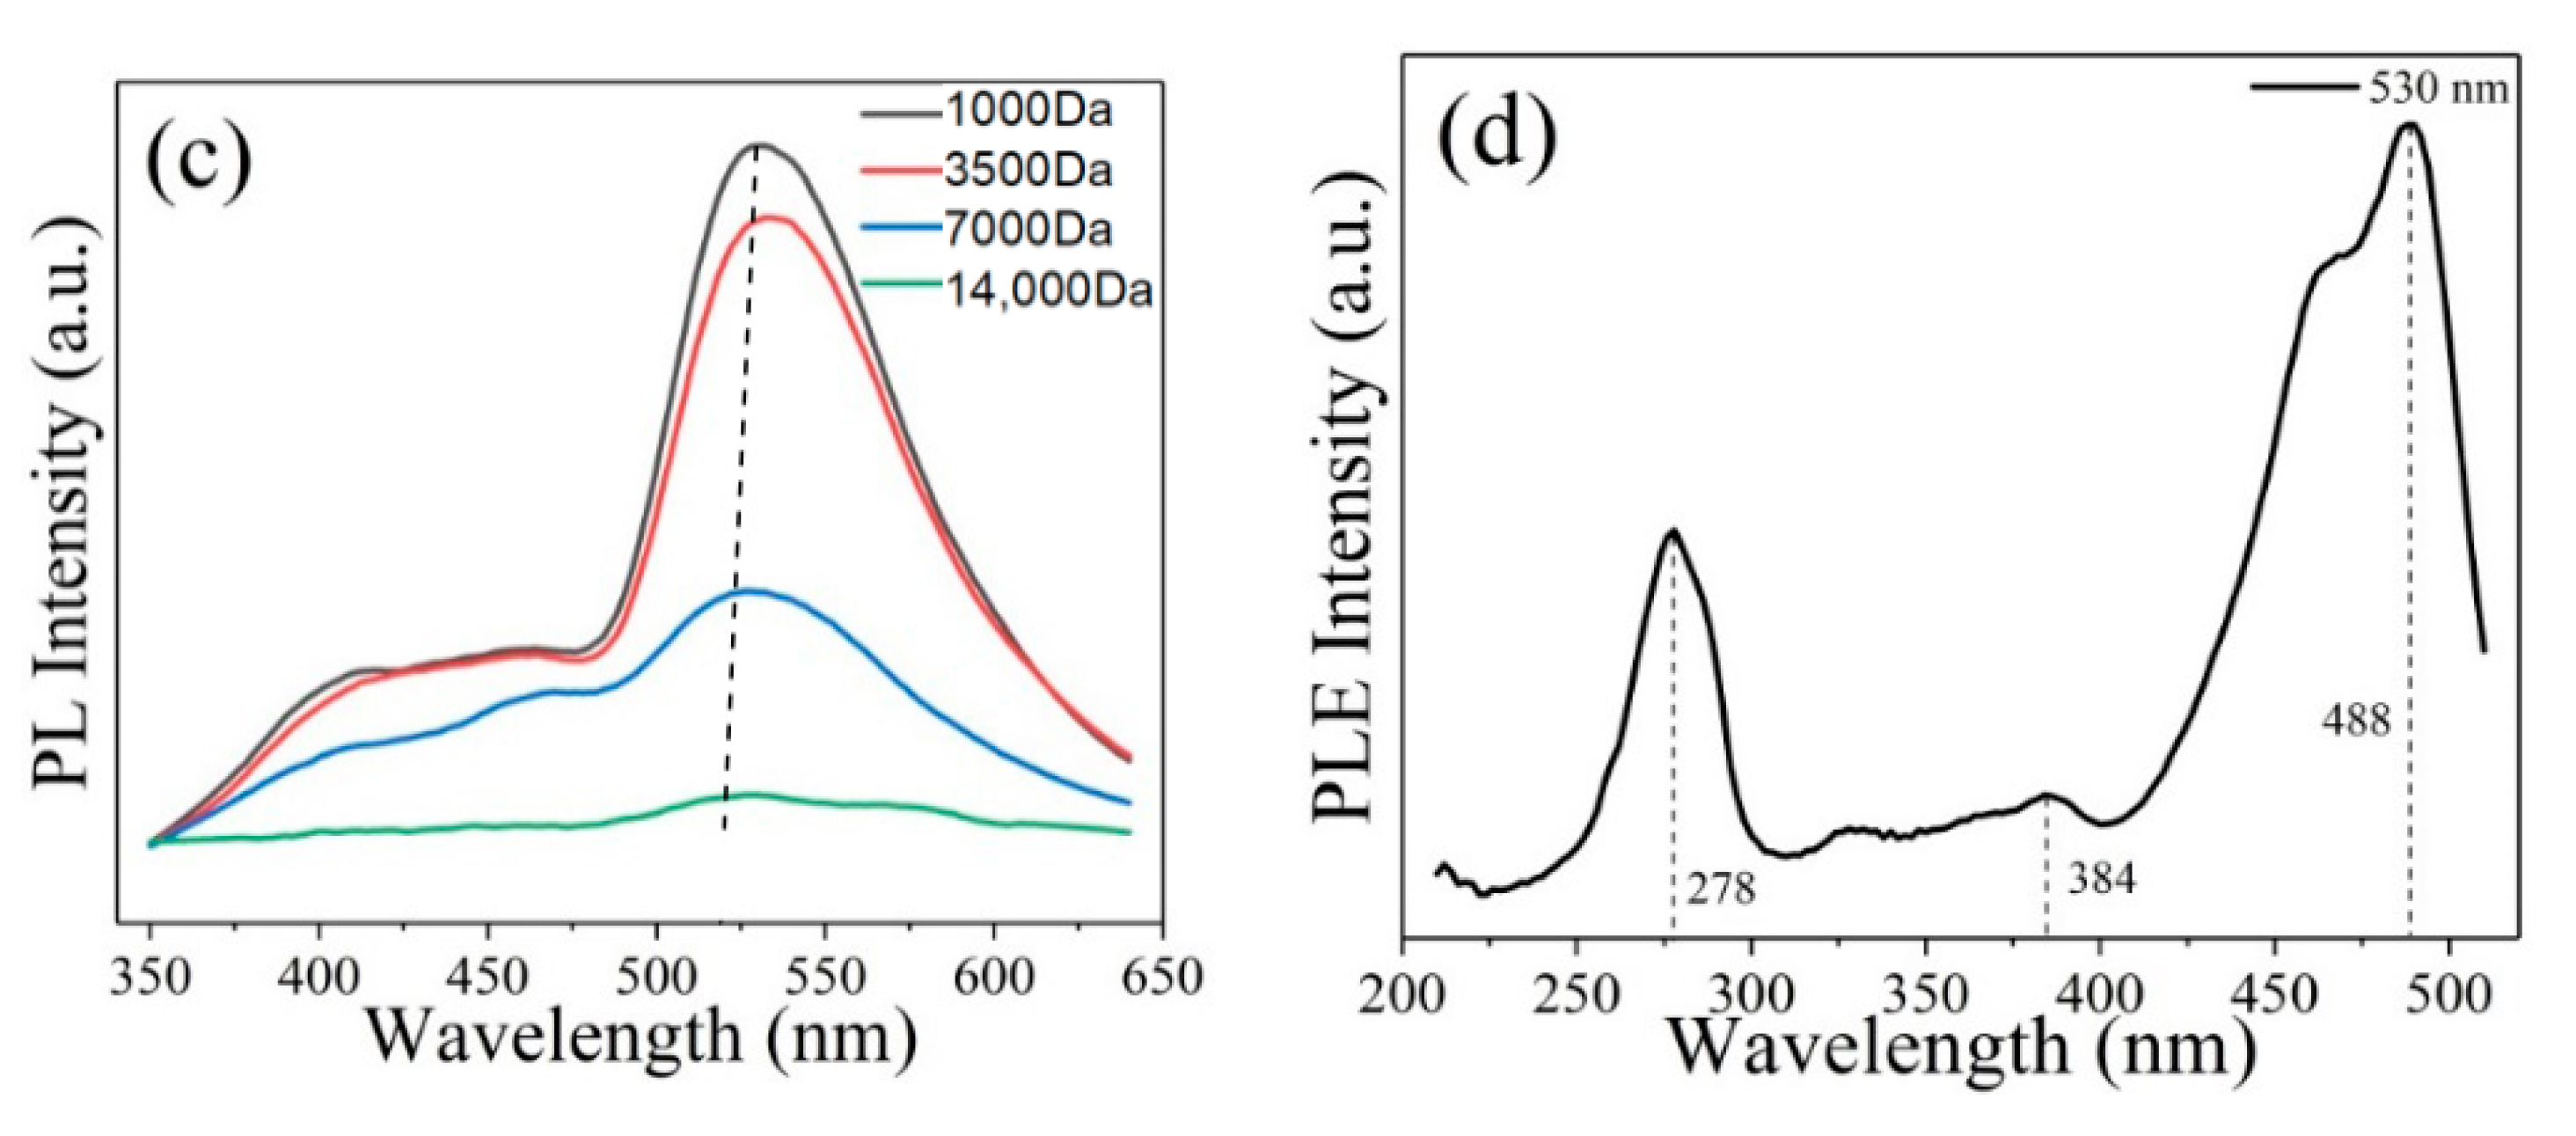
| Samples | Integrated Emission Intensity (I) | Abs. (A) | Refractive Index of Solvent (n) | QY (φ) |
|---|---|---|---|---|
| Quinine sulfate | 15,644 | 0.109 | 1.33 | 0.54 (know) |
| 14,000 Da | 397 | 0.128 | 1.33 | 0.02 |
| 7000 Da | 2321 | 0.048 | 1.33 | 0.18 |
| 3500 Da | 4651 | 0.05 | 1.33 | 0.35 |
| 1000 Da | 5047 | 0.042 | 1.33 | 0.45 |
Publisher’s Note: MDPI stays neutral with regard to jurisdictional claims in published maps and institutional affiliations. |
© 2021 by the authors. Licensee MDPI, Basel, Switzerland. This article is an open access article distributed under the terms and conditions of the Creative Commons Attribution (CC BY) license (https://creativecommons.org/licenses/by/4.0/).
Share and Cite
Liu, Z.; Li, F.; Luo, Y.; Li, M.; Hu, G.; Pu, X.; Tang, T.; Wen, J.; Li, X.; Li, W. Size Effect of Graphene Quantum Dots on Photoluminescence. Molecules 2021, 26, 3922. https://doi.org/10.3390/molecules26133922
Liu Z, Li F, Luo Y, Li M, Hu G, Pu X, Tang T, Wen J, Li X, Li W. Size Effect of Graphene Quantum Dots on Photoluminescence. Molecules. 2021; 26(13):3922. https://doi.org/10.3390/molecules26133922
Chicago/Turabian StyleLiu, Ziyi, Fei Li, Yi Luo, Ming Li, Guanghui Hu, Xianjuan Pu, Tao Tang, Jianfeng Wen, Xinyu Li, and Weitao Li. 2021. "Size Effect of Graphene Quantum Dots on Photoluminescence" Molecules 26, no. 13: 3922. https://doi.org/10.3390/molecules26133922
APA StyleLiu, Z., Li, F., Luo, Y., Li, M., Hu, G., Pu, X., Tang, T., Wen, J., Li, X., & Li, W. (2021). Size Effect of Graphene Quantum Dots on Photoluminescence. Molecules, 26(13), 3922. https://doi.org/10.3390/molecules26133922