
Confirmatory Analysis of Per and Polyfluoroalkyl Substances in Milk and Infant Formula Using UHPLC–MS/MS


Abstract
1. Introduction
2. Results
2.1. Identification and Confirmation
2.2. Method Validation
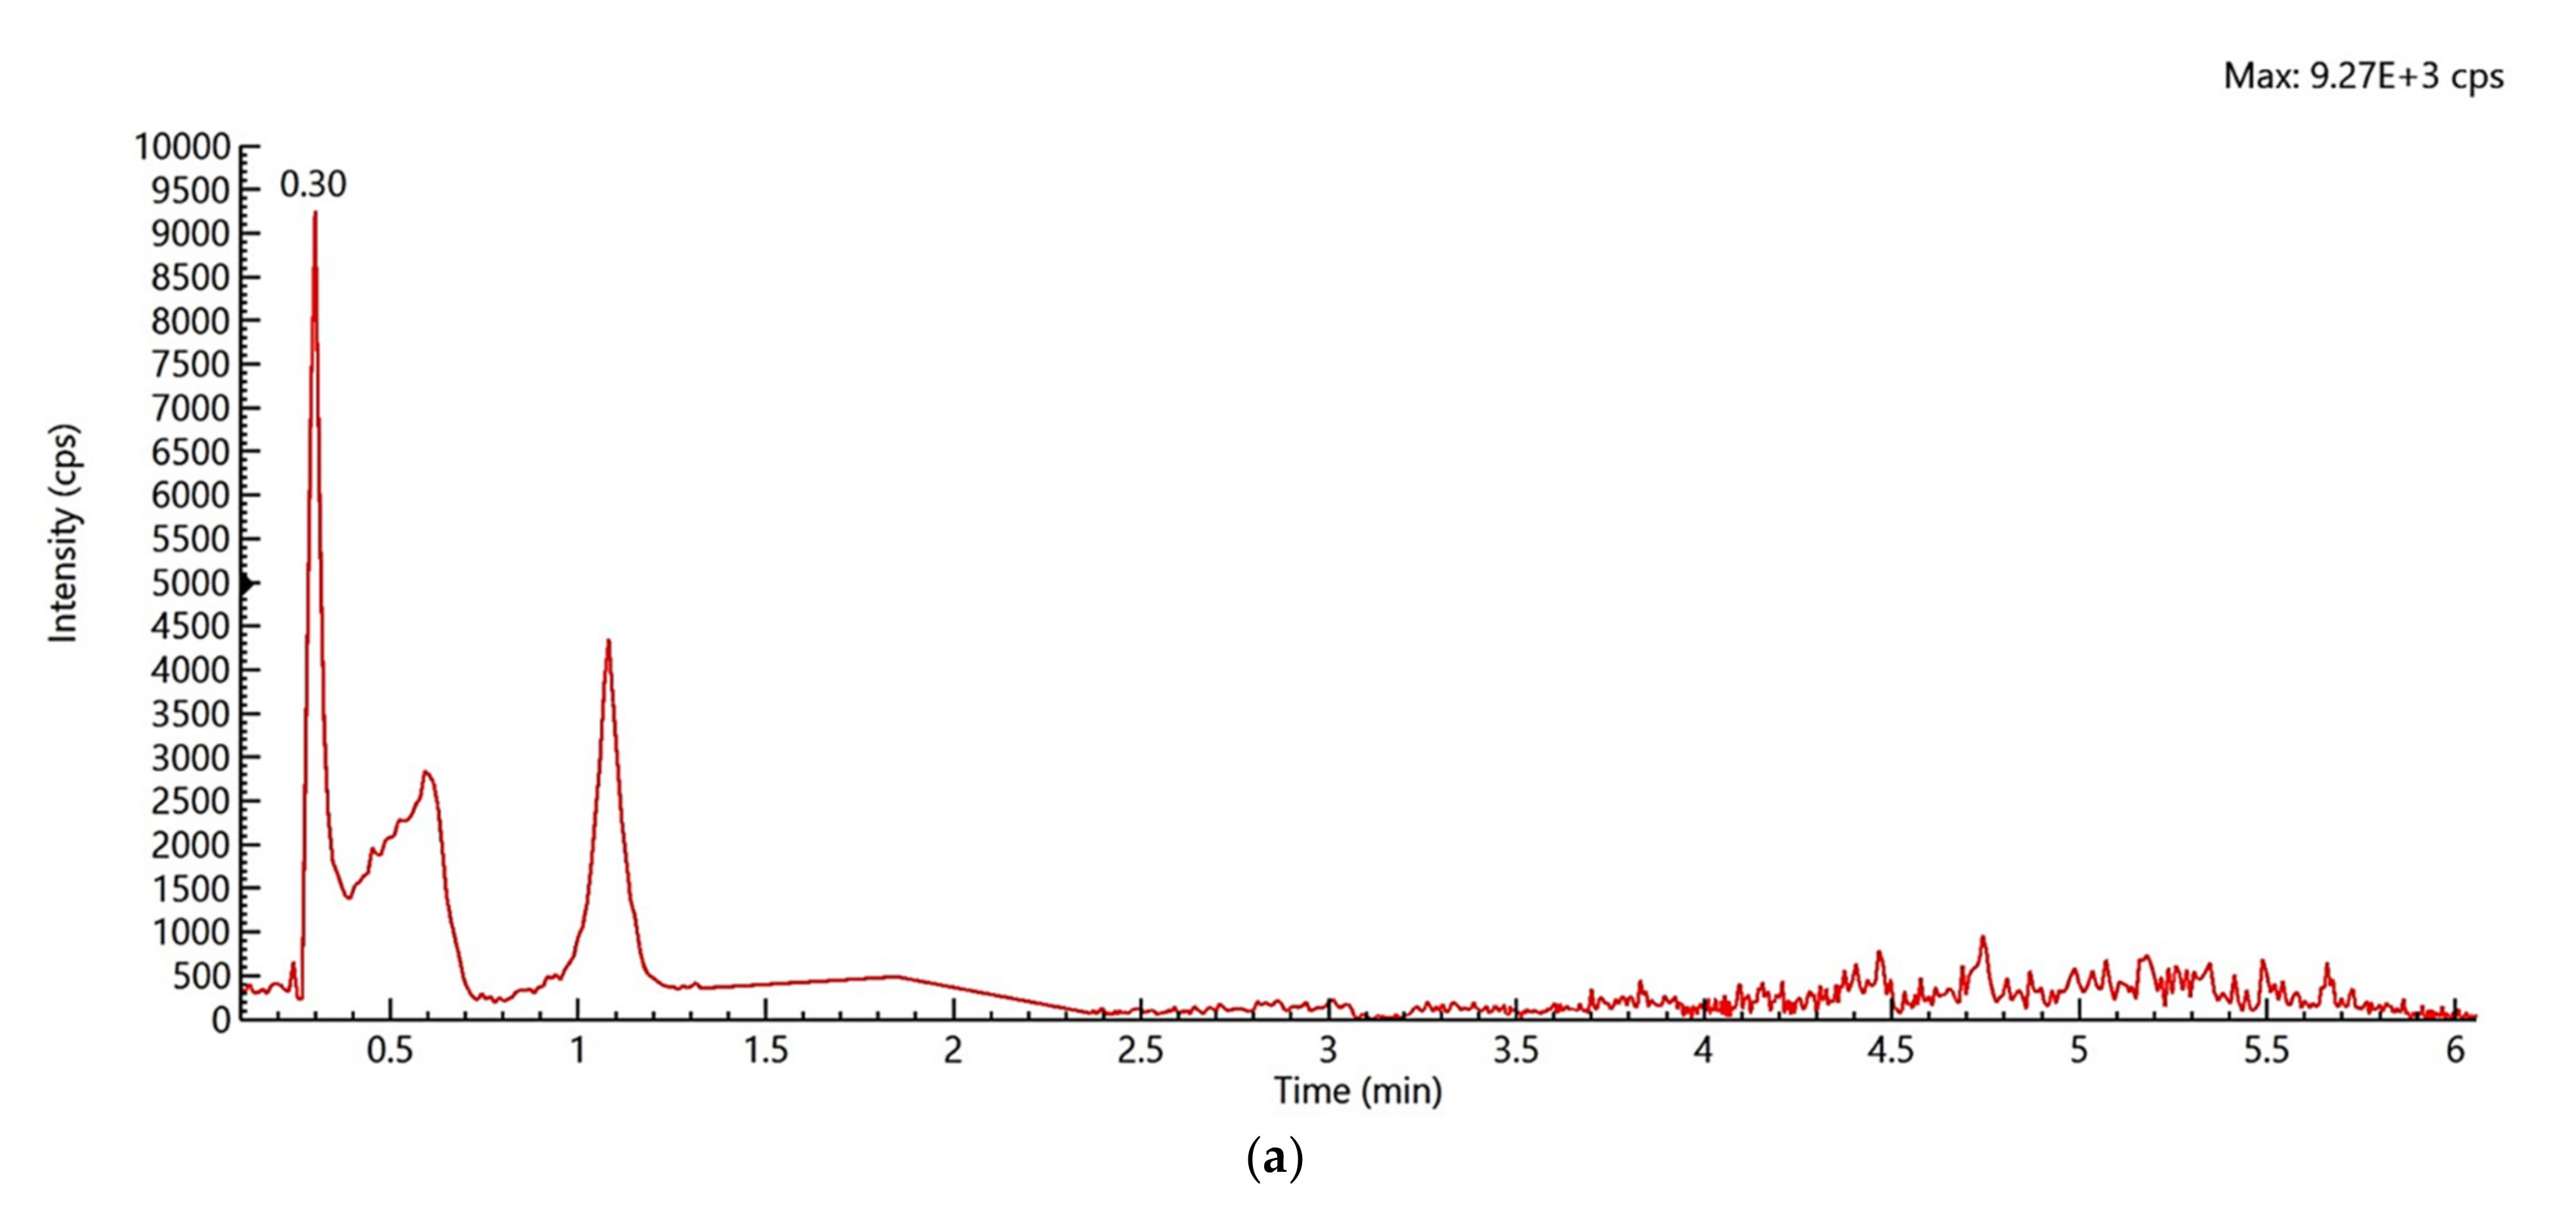
2.2.1. Selectivity
2.2.2. Linearity
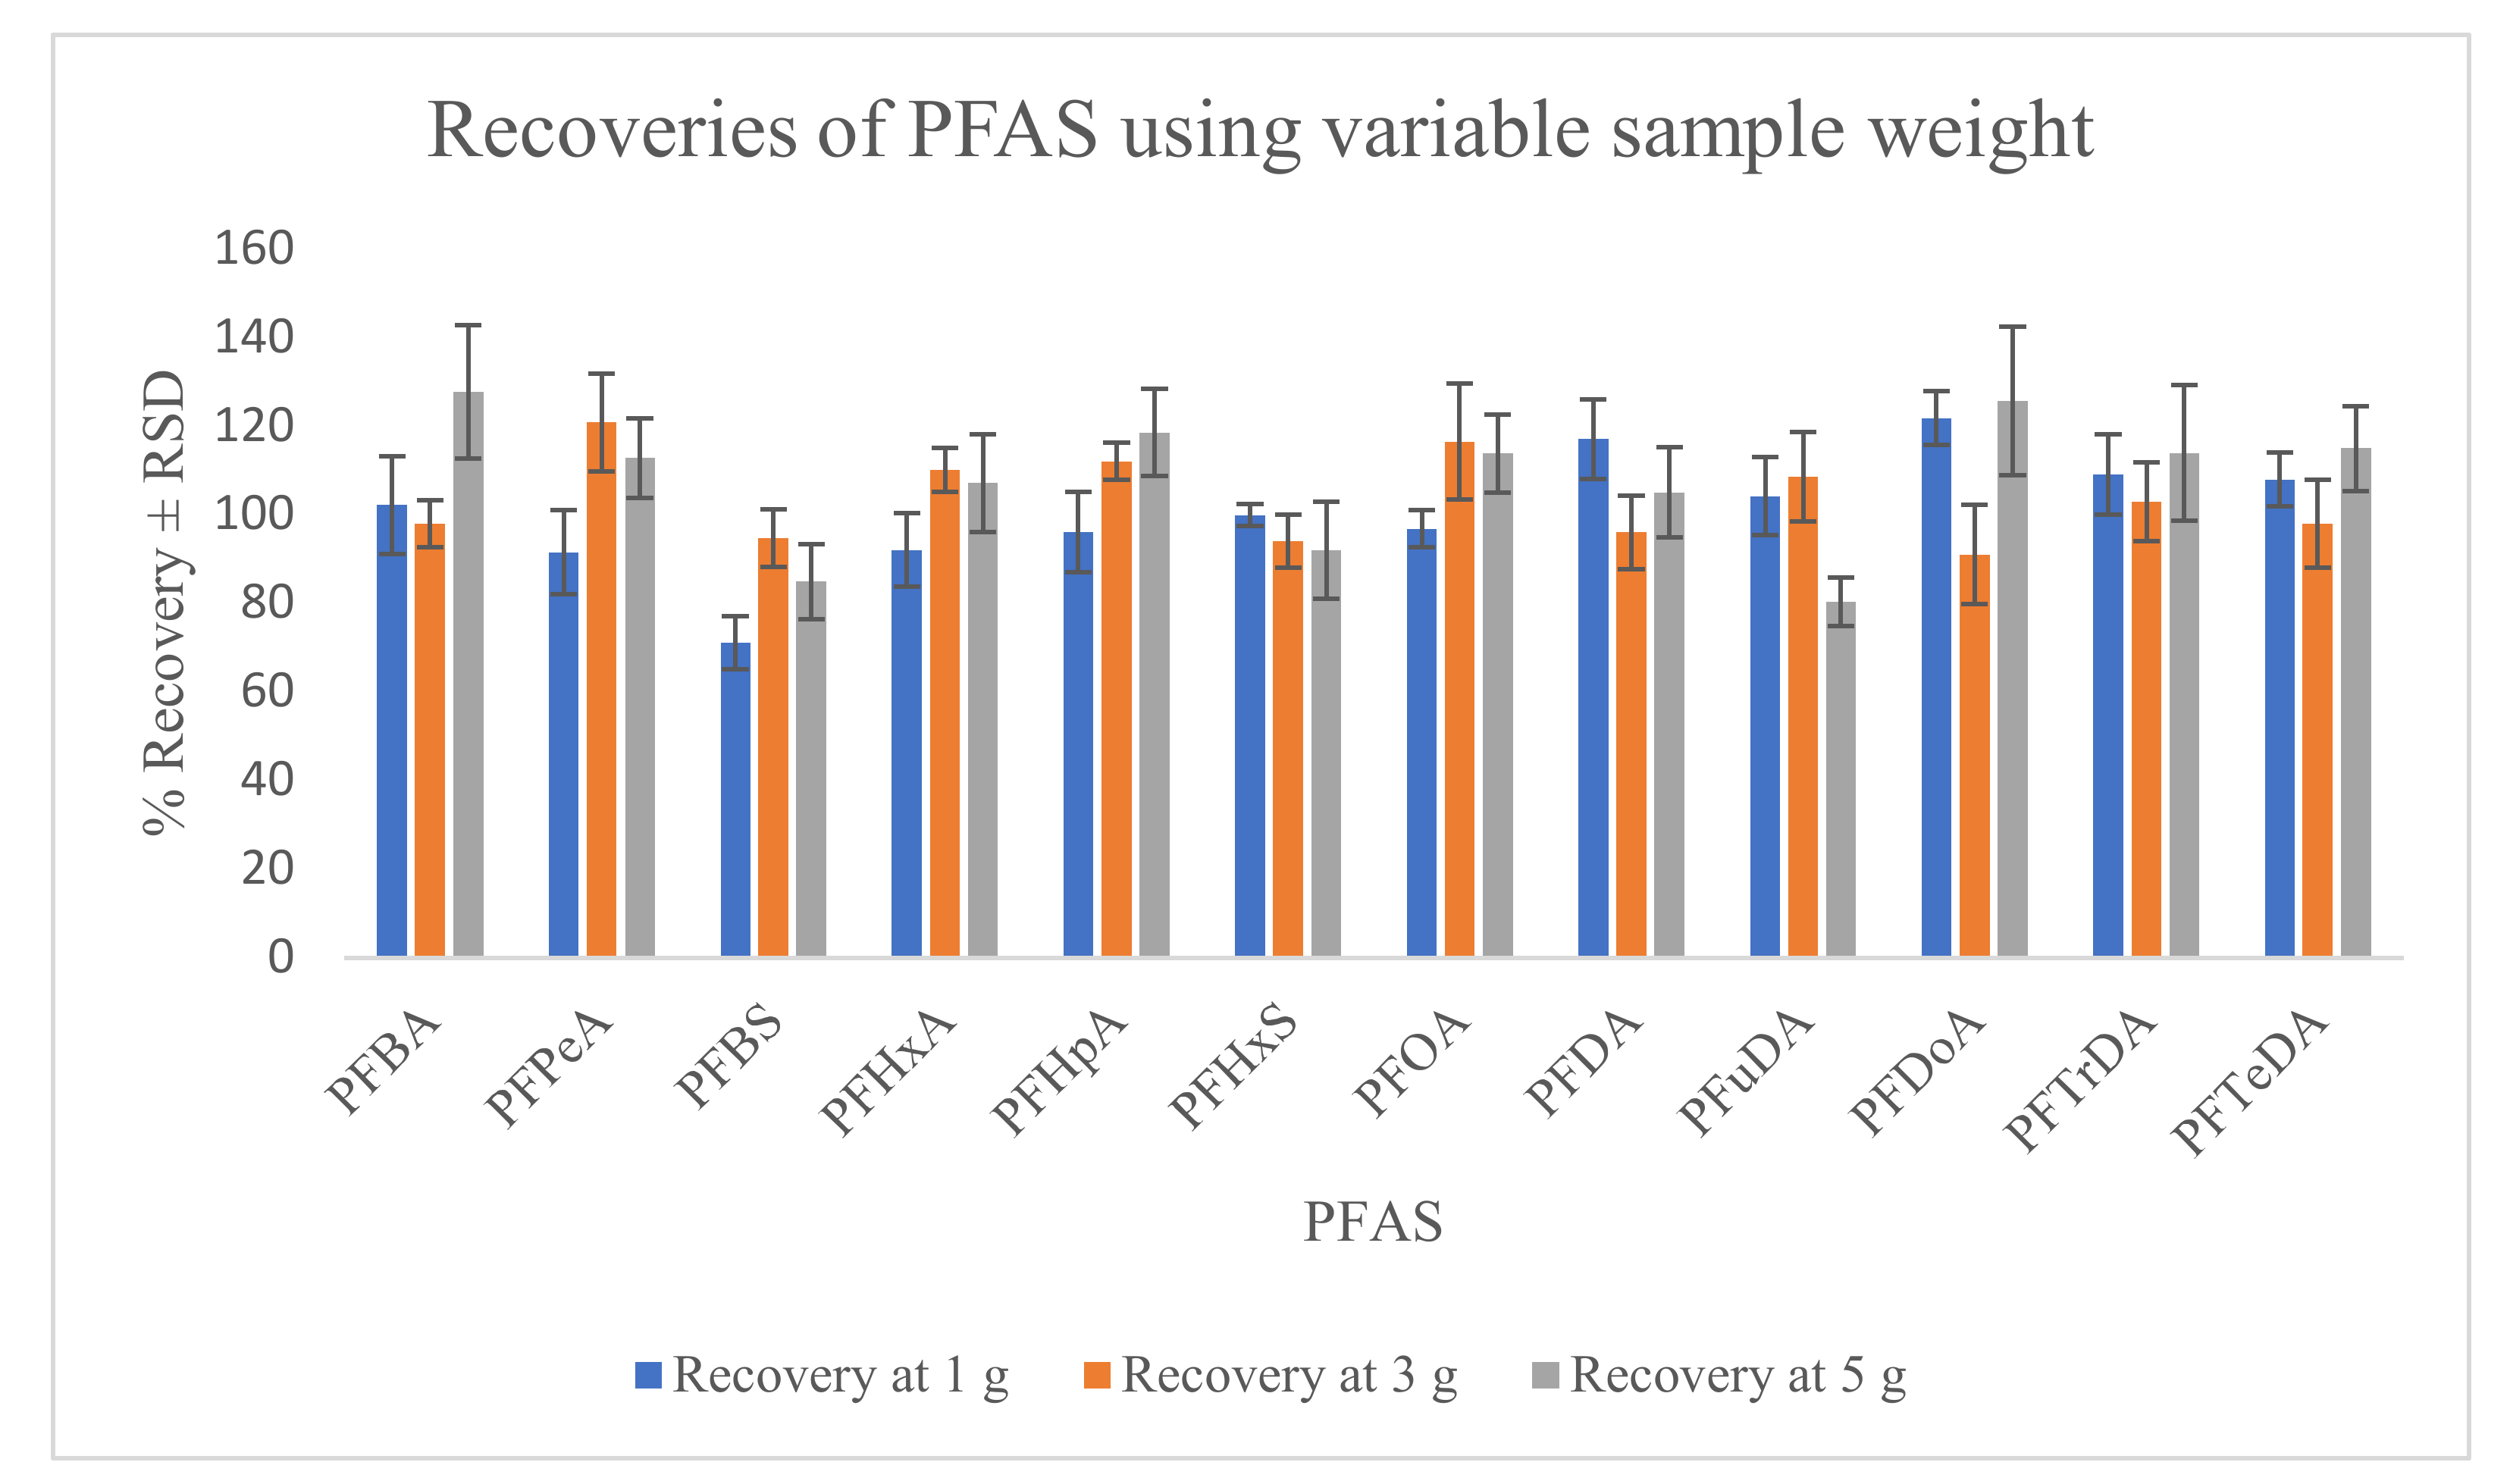
2.2.3. Recovery
2.2.4. Precision (Repeatability and within-Laboratory Reproducibility) and between-Laboratory Reproducibility
2.2.5. Matrix Effect
2.2.6. Decision Limit, Detection Capability and Limit of Quantitation
2.2.7. Robustness
2.2.8. Measurement Uncertainty
2.2.9. Stability
3. Discussion
3.1. Method Development
3.2. Method Validation
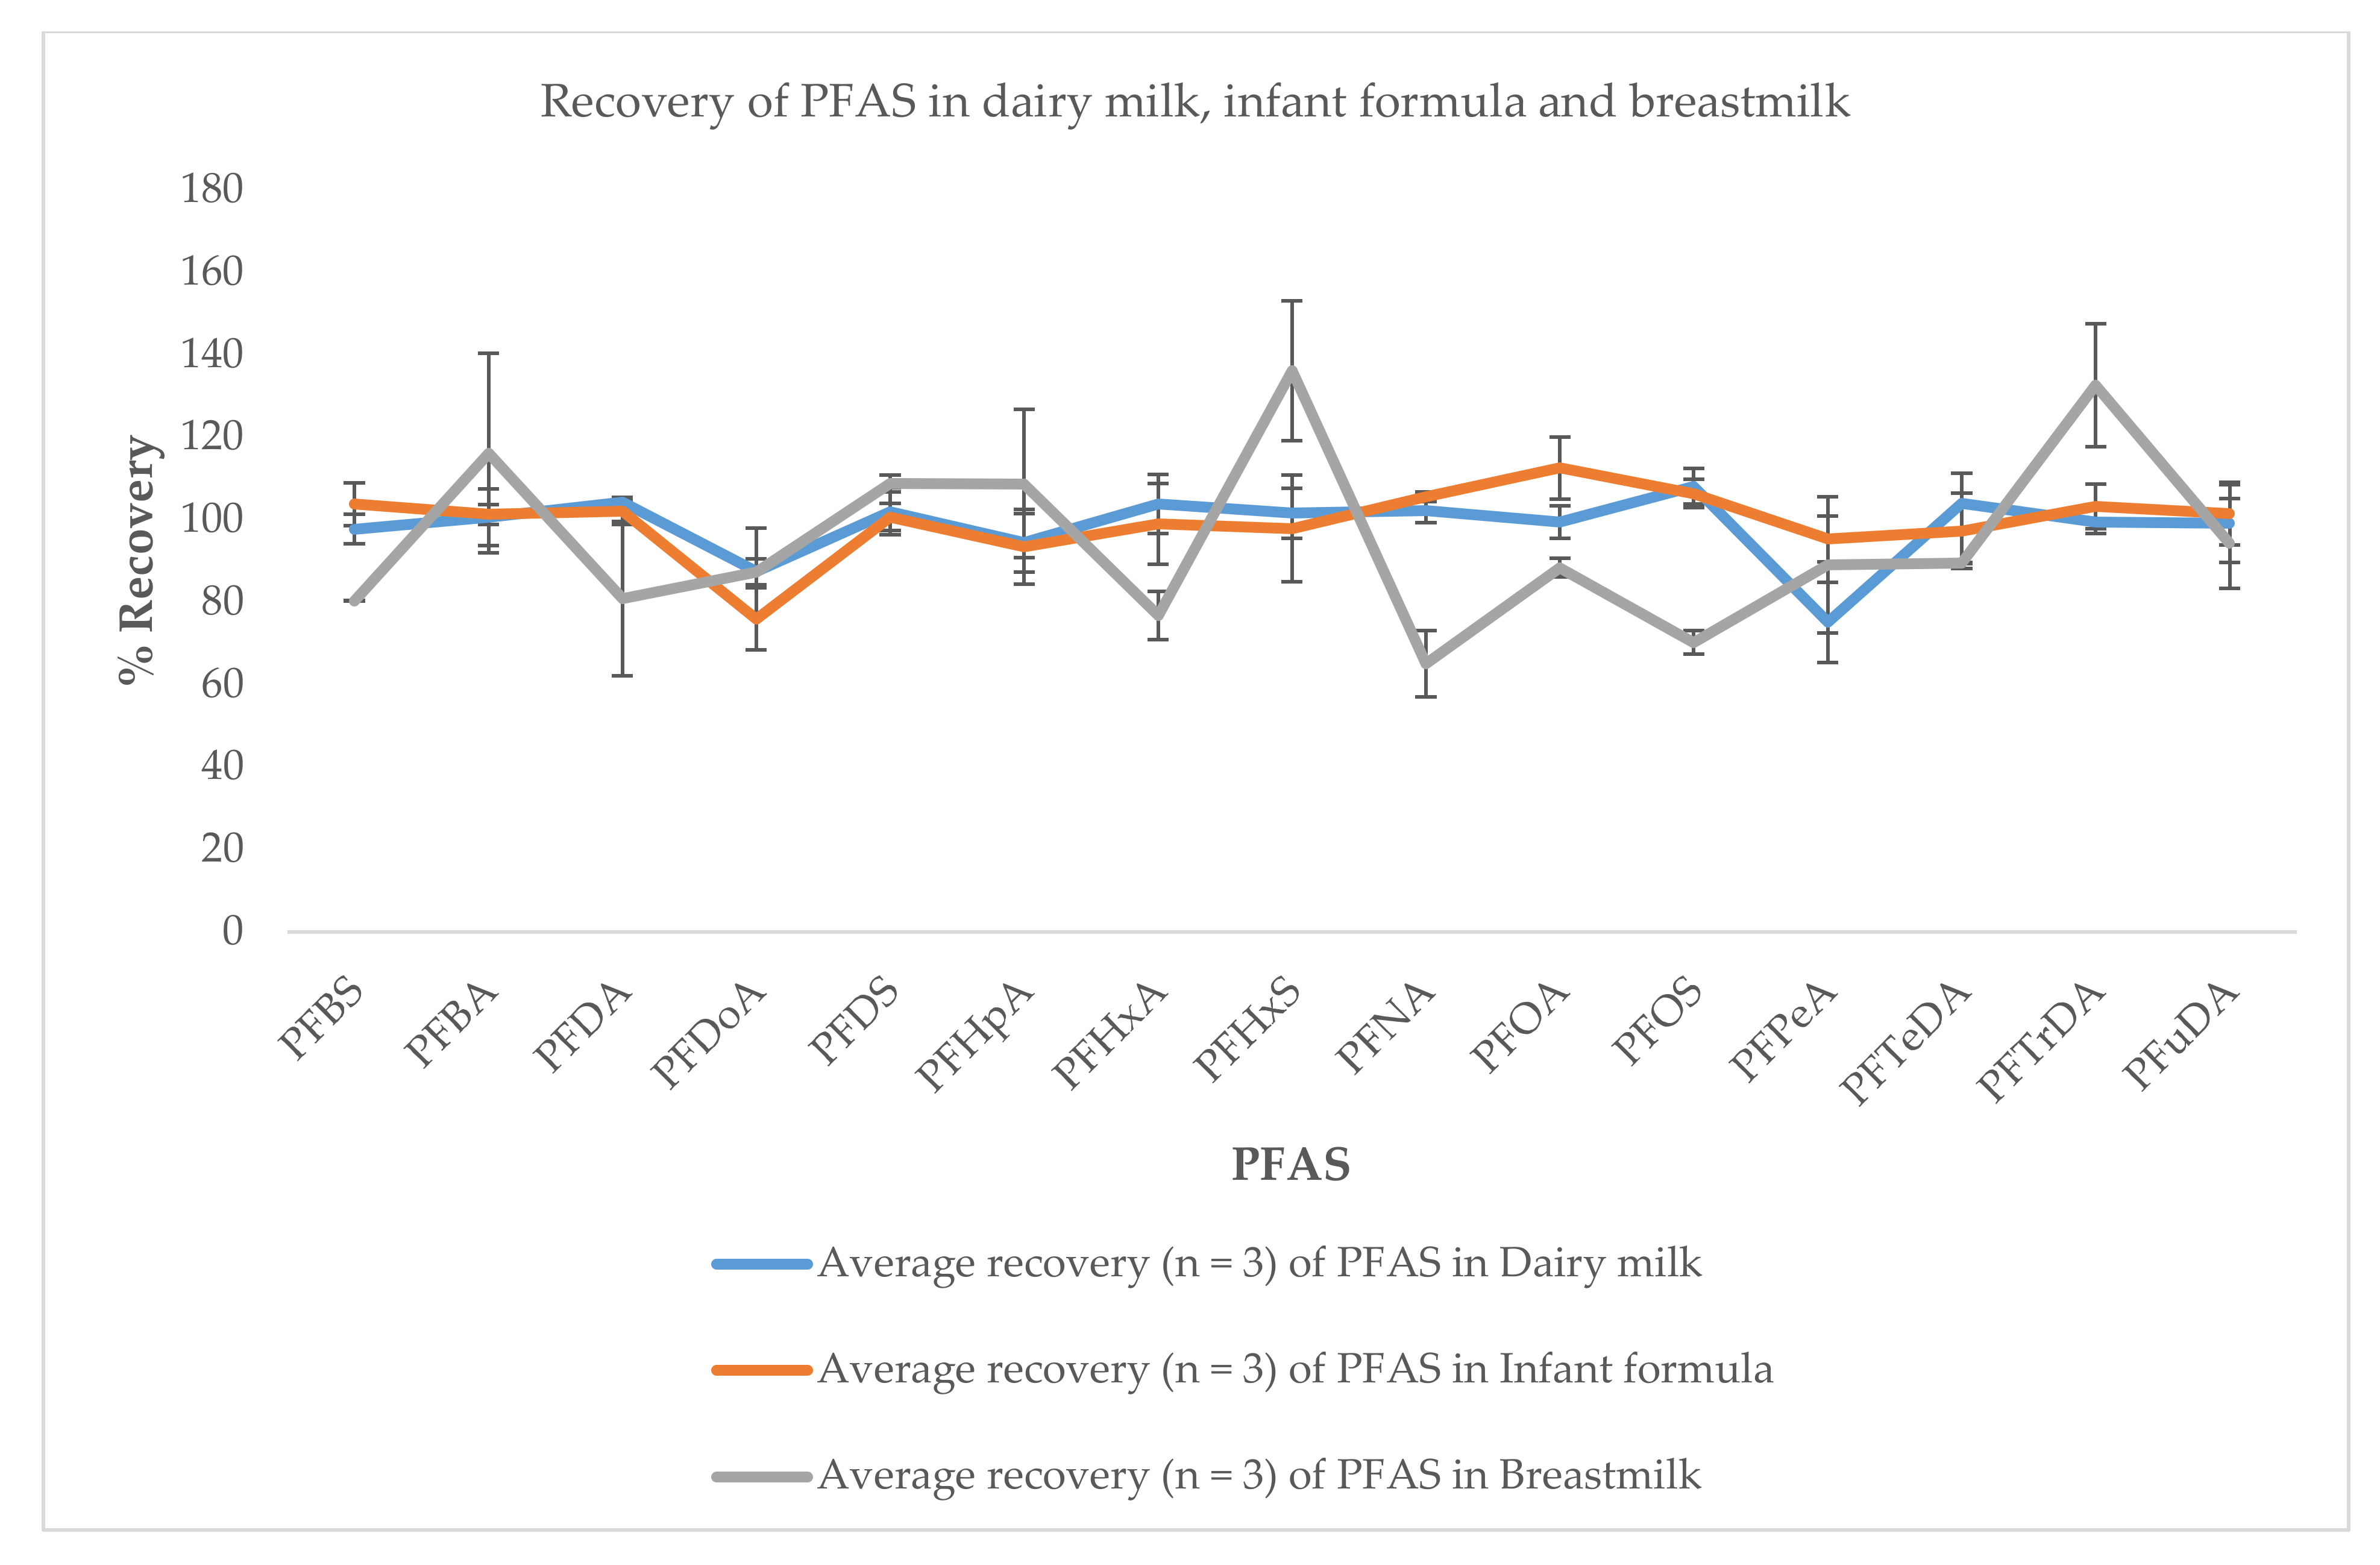
3.3. Application to Real Sample
4. Materials and Methods
4.1. Chemicals
4.2. Standard and Sample Preparation
4.2.1. Preparation of Standard Solution
4.2.2. Sampling
4.2.3. Simplified QuEChERS Method
4.3. Instrumental Method
4.4. Method Validation
4.5. Quality Control
4.6. Statistics
5. Conclusions
Supplementary Materials
Author Contributions
Funding
Institutional Review Board Statement
Informed Consent Statement
Data Availability Statement
Acknowledgments
Conflicts of Interest
Sample Availability
References
- Wille, K.; Vanden Bussche, J.; Noppe, H.; De Wulf, E.; Van Caeter, P.; Janssen, C.R.; De Brabander, H.F.; Vanhaecke, L. A validated analytical method for the determination of perfluorinated compounds in surface-, sea- and sewagewater using liquid chromatography coupled to time-of-flight mass spectrometry. J. Chromatogr. A 2010, 1217, 6616–6622. [Google Scholar] [CrossRef]
- Fromme, H.; Tittlemier, S.A.; Völkel, W.; Wilhelm, M.; Twardella, D. Perfluorinated compounds–Exposure assessment for the general population in western countries. Int. J. Hyg. Environ. Health 2009, 212, 239–270. [Google Scholar] [CrossRef]
- Tittlemier, S.A.; Pepper, K.; Seymour, C.; Moisey, J.; Bronson, R.; Cao, X.L.; Dabeka, R.W. Dietary exposure of Canadians to perfluorinated carboxylates and perfluorooctane sulfonate via consumption of meat, fish, fast foods, and food items prepared in their packaging. J. Agric. Food Chem. 2007, 55, 3203–3210. [Google Scholar] [CrossRef]
- Björklund, J.A.; Thuresson, K.; De Wit, C.A. Perfluoroalkyl compounds (PFCs) in indoor dust: Concentrations, human exposure estimates, and sources. Environ. Sci. Technol. 2009, 43, 2276–2281. [Google Scholar] [CrossRef]
- Harrad, S.; De Wit, C.A.; Abdallah, M.A.E.; Bergh, C.; Björklund, J.A.; Covaci, A.; Darnerud, P.O.; De Boer, J.; Diamond, M.; Huber, S.; et al. Indoor contamination with hexabromocyclododecanes, polybrominated diphenyl ethers, and perfluoroalkyl compounds: An important exposure pathway for people? Environ. Sci. Technol. 2010, 44, 3221–3231. [Google Scholar] [CrossRef]
- Genualdi, S.; Lee, S.C.; Shoeib, M.; Gawor, A.; Ahrens, L.; Harner, T. Global pilot study of legacy and emerging persistent organic pollutants using sorbent-impregnated polyurethane foam disk passive air samplers. Environ. Sci. Technol. 2010, 44, 5534–5539. [Google Scholar] [CrossRef] [PubMed]
- Domingo, J.L.; Nadal, M. Human exposure to per- and polyfluoroalkyl substances (PFAS) through drinking water: A review of the recent scientific literature. Environ. Res. 2019, 177, 108648. [Google Scholar] [CrossRef]
- Young, W.M.; South, P.; Begley, T.H.; Diachenko, G.W.; Noonan, G.O. Determination of perfluorochemicals in cow’s milk using liquid chromatography-tandem mass spectrometry. J. Agric. Food Chem. 2012, 60, 1652–1658. [Google Scholar] [CrossRef] [PubMed]
- Guerranti, C.; Perra, G.; Corsolini, S.; Focardi, S.E. Pilot study on levels of perfluorooctane sulfonic acid (PFOS) and perfluorooctanoic acid (PFOA) in selected foodstuffs and human milk from Italy. Food Chem. 2013, 140, 197–203. [Google Scholar] [CrossRef]
- Tao, L.; Ma, J.; Kunisue, T.; Libelo, E.L.; Tanabe, S.; Kannan, K. Perfluorinated compounds in human breast milk from several Asian countries, and in infant formula and dairy milk from the United States. Environ. Sci. Technol. 2008, 42, 8597–8602. [Google Scholar] [CrossRef] [PubMed]
- Lorenzo, M.; Farré, M.; Blasco, C.; Onghena, M.; Picó, Y.; Barceló, D. Perfluoroalkyl substances in Breast milk, infant formula and baby food from Valencian Community (Spain). Environ. Nanotechnol. Monit. Manag. 2016, 6, 108–115. [Google Scholar] [CrossRef]
- Wang, J.M.; Shi, Y.L.; Pan, Y.Y.; Cai, Y.Q. Perfluorinated compounds in milk, milk powder and yoghurt purchased from markets in China. Chin. Sci. Bull. 2010, 55, 1020–1025. [Google Scholar] [CrossRef]
- Macheka, L.R.; Olowoyo, J.O.; Mugivhisa, L.L.; Abafe, O.A. Determination and assessment of human dietary intake of per and polyfluoroalkyl substances in retail dairy milk and infant formula from South Africa. Sci. Total Environ. 2021, 755, 142697. [Google Scholar] [CrossRef]
- Xing, Z.; Lu, J.; Liu, Z.; Li, S.; Wang, G.; Wang, X. Occurrence of perfluorooctanoic acid and perfluorooctane sulfonate in milk and yogurt and their risk assessment. Int. J. Environ. Res. Public Health 2016, 13, 1037. [Google Scholar] [CrossRef] [PubMed]
- Ropers, M.H.; Durand, S.; Veyrand, B.; Beaumal, V.; Marchand, P.; Anton, M.; Le Bizec, B. Contamination of food by fluorinated surfactants—Distribution in emulsions and impact on the interfacial protein behaviour. Food Hydrocoll. 2009, 23, 1149–1155. [Google Scholar] [CrossRef]
- Shi, Y.; Cai, Y.; Jiang, G. Sample pretreatment techniques for perfluorinated compounds. In Comprehensive Sampling and Sample Preparation; Elsevier: Amsterdam, The Netherlands, 2012; Volume 3, pp. 615–627. ISBN 9780123813749. [Google Scholar]
- Trojanowicz, M.; Koc, M. Recent developments in methods for analysis of perfluorinated persistent pollutants. Microchim. Acta 2013, 180, 957–971. [Google Scholar] [CrossRef] [PubMed]
- Domingo, J.L.; Jogsten, I.E.; Eriksson, U.; Martorell, I.; Perelló, G.; Nadal, M.; Bavel, B. van Human dietary exposure to perfluoroalkyl substances in Catalonia, Spain. Temporal trend. Food Chem. 2012, 135, 1575–1582. [Google Scholar] [CrossRef]
- Liang, M.; Xian, Y.; Wang, B.; Hou, X.; Wang, L.; Guo, X.; Wu, Y.; Dong, H. High throughput analysis of 21 perfluorinated compounds in drinking water, tap water, river water and plant effluent from southern China by supramolecular solvents-based microextraction coupled with HPLC-Orbitrap HRMS. Environ. Pollut. 2020, 263, 114389. [Google Scholar] [CrossRef]
- Sadia, M.; Yeung, L.W.Y.; Fiedler, H. Trace level analyses of selected perfluoroalkyl acids in food: Method development and data generation. Environ. Pollut. 2020, 263, 113721. [Google Scholar] [CrossRef]
- Abdallah, M.A.E.; Wemken, N.; Drage, D.S.; Tlustos, C.; Cellarius, C.; Cleere, K.; Morrison, J.J.; Daly, S.; Coggins, M.A.; Harrad, S. Concentrations of perfluoroalkyl substances in human milk from Ireland: Implications for adult and nursing infant exposure. Chemosphere 2020, 246, 125724. [Google Scholar] [CrossRef]
- Yeung, L.W.Y.; Taniyasu, S.; Kannan, K.; Xu, D.Z.Y.; Guruge, K.S.; Lam, P.K.S.; Yamashita, N. An analytical method for the determination of perfluorinated compounds in whole blood using acetonitrile and solid phase extraction methods. J. Chromatogr. A 2009, 1216, 4950–4956. [Google Scholar] [CrossRef]
- Macheka-Tendenguwo, L.R.; Olowoyo, J.O.; Mugivhisa, L.L.; Abafe, O.A. Per- and polyfluoroalkyl substances in human breast milk and current analytical methods. Environ. Sci. Pollut. Res. 2018, 25, 36064–36086. [Google Scholar] [CrossRef] [PubMed]
- Yu, Y.; Xu, D.; Lu, M.; Zhou, S.; Peng, T.; Yue, Z.; Zhou, Y. QuEChERs Combined with Online Interference Trapping LC-MS/MS Method for the Simultaneous Determination of 20 Polyfluoroalkane Substances in Dietary Milk. J. Agric. Food Chem. 2015, 63, 4087–4095. [Google Scholar] [CrossRef] [PubMed]
- Plassmann, M.M.; Schmidt, M.; Brack, W.; Krauss, M. Detecting a wide range of environmental contaminants in human blood samples—combining QuEChERS with LC-MS and GC-MS methods. Anal. Bioanal. Chem. 2015, 407. [Google Scholar] [CrossRef]
- Lankova, D.; Lacina, O.; Pulkrabova, J.; Hajslova, J. The determination of perfluoroalkyl substances, brominated flame retardants and their metabolites in human breast milk and infant formula. Talanta 2013, 117, 318–325. [Google Scholar] [CrossRef]
- Fromme, H.; Mosch, C.; Morovitz, M.; Alba-Alejandre, I.; Boehmer, S.; Kiranoglu, M.; Faber, F.; Hannibal, I.; Genzel-Boroviczény, O.; Koletzko, B.; et al. Pre- and Postnatal Exposure to Perfluorinated Compounds (PFCs). Environ. Sci. Technol. 2010, 44, 7123–7129. [Google Scholar] [CrossRef] [PubMed]
- Thomsen, C.; Haug, L.S.; Stigum, H.; Frøshaug, M.; Broadwell, S.L.; Becher, G. Changes in concentrations of perfluorinated compounds, polybrominated diphenyl ethers, and polychlorinated biphenyls in Norwegian breast-milk during twelve months of lactation. Environ. Sci. Technol. 2010, 44, 9550–9556. [Google Scholar] [CrossRef]
- The European Parliament and the Council of the European Union Commission Decision 2002/657/EC Implementing Council Directive 96/23/EC Concerning the Performance of Analytical Methods and the Interpretation of Results 96/23/Ec Comm. Decis; The European Parliament: Brussels, Belgium, 2002.
- Keller, J.M.; Calafat, A.M.; Kato, K.; Ellefson, M.E.; Reagen, W.K.; Strynar, M.; O’Connell, S.; Butt, C.M.; Mabury, S.A.; Small, J.; et al. Determination of perfluorinated alkyl acid concentrations in human serum and milk standard reference materials. Anal. Bioanal. Chem. 2010, 397, 439–451. [Google Scholar] [CrossRef] [PubMed]
- Nyberg, E.; Awad, R.; Bignert, A.; Ek, C.; Sallsten, G.; Benskin, J.P. Inter-individual{,} inter-city{,} and temporal trends of per- and polyfluoroalkyl substances in human milk from Swedish mothers between 1972 and 2016. Environ. Sci. Process. Impacts 2018, 20, 1136–1147. [Google Scholar] [CrossRef] [PubMed]
- Awad, R.; Zhou, Y.; Nyberg, E.; Namazkar, S.; Yongning, W.; Xiao, Q.; Sun, Y.; Zhu, Z.; Bergman, Å.; Benskin, J.P. Emerging per- and polyfluoroalkyl substances (PFAS) in human milk from Sweden and China. Environ. Sci. Process. Impacts 2020, 22, 2023–2030. [Google Scholar] [CrossRef]
- González-Antuña, A.; Domínguez-Romero, J.C.; García-Reyes, J.F.; Rodríguez-González, P.; Centineo, G.; García Alonso, J.I.; Molina-Díaz, A. Overcoming matrix effects in electrospray: Quantitation of β-agonists in complex matrices by isotope dilution liquid chromatography–mass spectrometry using singly 13C-labeled analogues. J. Chromatogr. A 2013, 1288, 40–47. [Google Scholar] [CrossRef] [PubMed]
- Abafe, O.A.; Gatyeni, P.M.; Chokwe, T. Development and validation of a confirmatory method for the determination of stilbene estrogens in Ostrich serum. Food Addit. Contam. Part A Chem. Anal. Control. Expo. Risk Assess 2017. [Google Scholar] [CrossRef]
- Tahziz, A.; Mohamad Haron, D.E.; Aziz, M.Y. Liquid Chromatographic Tandem Mass Spectrometric (LC-MS/MS) Determination of Perfluorooctane Sulfonate (PFOS) and Perfluorooctanoic Acid (PFOA) in the Yolk of Poultry Eggs in Malaysia. Molecules 2020, 25. [Google Scholar] [CrossRef] [PubMed]
- Lin, Y.; Liu, R.; Hu, F.; Liu, R.; Ruan, T.; Jiang, G. Simultaneous qualitative and quantitative analysis of fluoroalkyl sulfonates in riverine water by liquid chromatography coupled with Orbitrap high resolution mass spectrometry. J. Chromatogr. A 2016, 1435, 66–74. [Google Scholar] [CrossRef]
- Tan, A.; Fanaras, J.C. Use of high-pH (basic/alkaline) mobile phases for LC-MS or LC-MS/MS bioanalysis. Biomed. Chromatogr. 2019, 33, e4409. [Google Scholar] [CrossRef] [PubMed]


| Analyte | Internal Standard | CCα/ng kg−1 | CCβ/ng kg−1 | LOQ/ng kg−1 | Regression Equation | R2 | % ME | MU |
|---|---|---|---|---|---|---|---|---|
| L-PFBS | 13C-PFOA | 30 | 50 | 5 | Y = 3.2844x − 0.0041 | 0.9993 | 29 | 20.2 |
| PFBA | 13C-PFOA | 30 | 60 | 50 | Y = 1.2464x + 0.1871 | 0.9983 | −20 | 19 |
| PFDA | 13C-PFNA | 30 | 50 | 5 | Y = 10.604x + 1.2112 | 0.9963 | −15 | 12.6 |
| PFDoA | 13C-PFNA | 50 | 90 | 5 | Y = 7.5313x + 2.3109 | 0.9957 | −45 | 26 |
| PFDS | 13C-PFNA | 40 | 60 | 5 | Y = 6.9454x + 0.0345 | 0.9919 | −19 | 14.5 |
| PFHpA | 13C-PFOA | 50 | 80 | 5 | Y = 3.0588x + 0.3459 | 0.9981 | −3 | 13.4 |
| PFHxA | 13C-PFOA | 30 | 60 | 5 | Y = 6.4299x + 0.0239 | 0.9989 | 6 | 12.3 |
| PFHxS | 13C-PFOA | 30 | 50 | 50 | Y = 5.184x + 0.2849 | 0.9998 | 13 | 12.7 |
| PFNA | 13C-PFNA | 30 | 50 | 5 | Y = 10.478x + 0.0657 | 0.9941 | 5 | 10.5 |
| PFOA | 13C-PFOA | 30 | 50 | 5 | Y = 9.3557x+ 0.1439 | 0.9997 | −11 | 12.3 |
| PFOS | 13C-PFNA | 30 | 50 | 5 | Y = 8.2593x + 0.4787 | 0.9843 | −20 | 11.9 |
| PFPeA | 13C-PFOA | 60 | 100 | 5 | Y = 3.0567x + 0.3481 | 0.9979 | −6 | 24.2 |
| PFTeDA | 13C-PFNA | 30 | 40 | 5 | Y = 8.7075x + 1.549 | 0.9989 | −20 | 9.7 |
| PFTrDA | 13C-PFNA | 30 | 50 | 5 | Y = 10.627x + 3.0888 | 0.9959 | −17,5 | 12.2 |
| PFuDA | 13C-PFNA | 40 | 60 | 5 | Y = 11.602x + 2.5914 | 0.9905 | −17 | 15.3 |
| Analyte | Spiked Concentration (ng kg−1) | Within-Laboratory Repeatability (n = 7) | Within-Laboratory Reproducibility (n = 21) | ||
|---|---|---|---|---|---|
| Recovery (%) | Precision (%) | Recovery (%) | Precision (%) | ||
| L-PFBS | 5 | 100 | 7.6 | 83 | 28 |
| 50 | 100 | 4 | 93 | 14 | |
| 100 | 100 | 7.1 | 100 | 11 | |
| *PFBA | |||||
| 50 | 104 | 9.6 | 98 | 14 | |
| 100 | 100 | 13 | 100 | 18 | |
| PFDA | 5 | 100 | 15.9 | 100 | 16 |
| 50 | 100 | 10.8 | 100 | 11 | |
| 100 | 105 | 5.4 | 100 | 8.6 | |
| PFDoA | 5 | 120 | 18.2 | 100 | 34 |
| 50 | 120 | 11.5 | 110 | 22 | |
| 100 | 100 | 6.8 | 95 | 18 | |
| PFDS | 5 | 100 | 10.9 | 122 | 22 |
| 50 | 100 | 11.5 | 110 | 14 | |
| 100 | 100 | 7.1 | 105 | 6 | |
| PFHpA | 5 | 100 | 11.3 | 100 | 13 |
| 50 | 100 | 6.4 | 100 | 12 | |
| 100 | 100 | 14.2 | 95 | 16 | |
| PFHxA | 5 | 100 | 5.7 | 100 | 11 |
| 50 | 110 | 4.3 | 100 | 16 | |
| 100 | 105 | 8.6 | 100 | 13 | |
| *PFHxS | |||||
| 50 | 100 | 7.8 | 90 | 13 | |
| 100 | 95 | 7.1 | 97 | 7 | |
| PFNA | 5 | 100 | 9.6 | 100 | 10 |
| 50 | 100 | 9 | 100 | 13 | |
| 100 | 100 | 7.6 | 100 | 7 | |
| PFOA | 5 | 100 | 10.3 | 100 | 17 |
| 50 | 100 | 8.4 | 106 | 10 | |
| 100 | 100 | 7.2 | 106 | 9 | |
| PFOS | 5 | 100 | 5.5 | 112 | 15 |
| 50 | 110 | 11.7 | 107 | 10 | |
| 100 | 101 | 6.2 | 113 | 8 | |
| PFPeA | 5 | 100 | 18 | 60 | 25 |
| 50 | 105 | 14.9 | 100 | 21 | |
| 100 | 100 | 10.3 | 105 | 20 | |
| PFTeDA | 5 | 100 | 8.4 | 100 | 15 |
| 50 | 100 | 4.6 | 100 | 5 | |
| 100 | 100 | 6.9 | 100 | 7 | |
| PFTrDA | 5 | 100 | 14.4 | 100 | 17 |
| 50 | 90 | 11.5 | 93 | 12 | |
| 100 | 100 | 7.4 | 100 | 6 | |
| PFuDA | 5 | 100 | 5.3 | 100 | 25 |
| 50 | 100 | 5.8 | 94 | 12 | |
| 100 | 95 | 6.5 | 104 | 20 | |
| PFAS | This Study | Keller et al., 2010 [30] | Nyberg et al., 2018 [31] | Awad et al., 2020 [32] |
|---|---|---|---|---|
| PFBA | <LOQ | NR | NR | NR |
| PFPeA | 0.0262 ± 0.0159 | NR | 0.0158 ± 0.023 | NR |
| PFBS | 0.0802 ± 0.0003 | 0.007 | 0.0034 ± 0.0044 | 0.004 ± 0.0017 |
| PFHxA | 0.0068 ± 0.0012 | 0.014 − 0.023 | 0.07 ± 0.052 | NR |
| PFHpA | 0.010 ± 0.0007 | 0.014 ± 0.001 | 0.0125 ± 0.007 | 0.011 ± 0.010 |
| PFHxS | 0.0156 ± 0.0169 | 0.012 − 0.031 | 0.0177 ± 0.0046 | 0.0198 ± 0.006 |
| PFOA | 0.0211 ± 0.012395 | 0.116 − 0.810 | 0.074 ± 0.003 | 0.093 ± 0.038 |
| PFNA | 0.0498 ± 0.0026 | 0.016 − 0.104 | 0.0157 ± 0.003 | 0.016 ± 0.0051 |
| PFOS | 0.0573 ± 0.045 | 0.136 − 0.189 | 0.097 ± 0.0017 | 0.0934 ± 0.031 |
| PFDA | 0.022 ± 0.0078 | 0.006 − 0.127 | 0.0083 ± 0.0043 | 0.0092 ± 0.0044 |
| PFUdA | 0.00815 ± 0.0031 | 0.007 − 0.094 | 0.0034 ± 0.001 | 0.0069 ± 0.0039 |
| PFDS | 0.0908 ± 0.022 | NR | 0.0009 ± 0.0008 | 0.002 ± 0.0023 |
| PFDoA | 0.0027 ± 0.00280 | 0.003 − 0.044 | 0.0013 ± 0.0005 | 0.0026 ± 0.0018 |
| PFTrDA | 0.0254 ± 0.0023 | 0.199 | 0.001 ± 0.001 | 0.0036 ± 0.0035 |
| PFTeDA | 0.0045 ± 0.0000317 | 0.002 | 0.0017 ± 0.0015 | 0.0048 ± 0.00 |
Publisher’s Note: MDPI stays neutral with regard to jurisdictional claims in published maps and institutional affiliations. |
© 2021 by the authors. Licensee MDPI, Basel, Switzerland. This article is an open access article distributed under the terms and conditions of the Creative Commons Attribution (CC BY) license (https://creativecommons.org/licenses/by/4.0/).
Share and Cite
Abafe, O.A.; Macheka, L.R.; Olowoyo, J.O. Confirmatory Analysis of Per and Polyfluoroalkyl Substances in Milk and Infant Formula Using UHPLC–MS/MS. Molecules 2021, 26, 3664. https://doi.org/10.3390/molecules26123664
Abafe OA, Macheka LR, Olowoyo JO. Confirmatory Analysis of Per and Polyfluoroalkyl Substances in Milk and Infant Formula Using UHPLC–MS/MS. Molecules. 2021; 26(12):3664. https://doi.org/10.3390/molecules26123664
Chicago/Turabian StyleAbafe, Ovokeroye A., Linda R. Macheka, and Joshua O. Olowoyo. 2021. "Confirmatory Analysis of Per and Polyfluoroalkyl Substances in Milk and Infant Formula Using UHPLC–MS/MS" Molecules 26, no. 12: 3664. https://doi.org/10.3390/molecules26123664
APA StyleAbafe, O. A., Macheka, L. R., & Olowoyo, J. O. (2021). Confirmatory Analysis of Per and Polyfluoroalkyl Substances in Milk and Infant Formula Using UHPLC–MS/MS. Molecules, 26(12), 3664. https://doi.org/10.3390/molecules26123664