
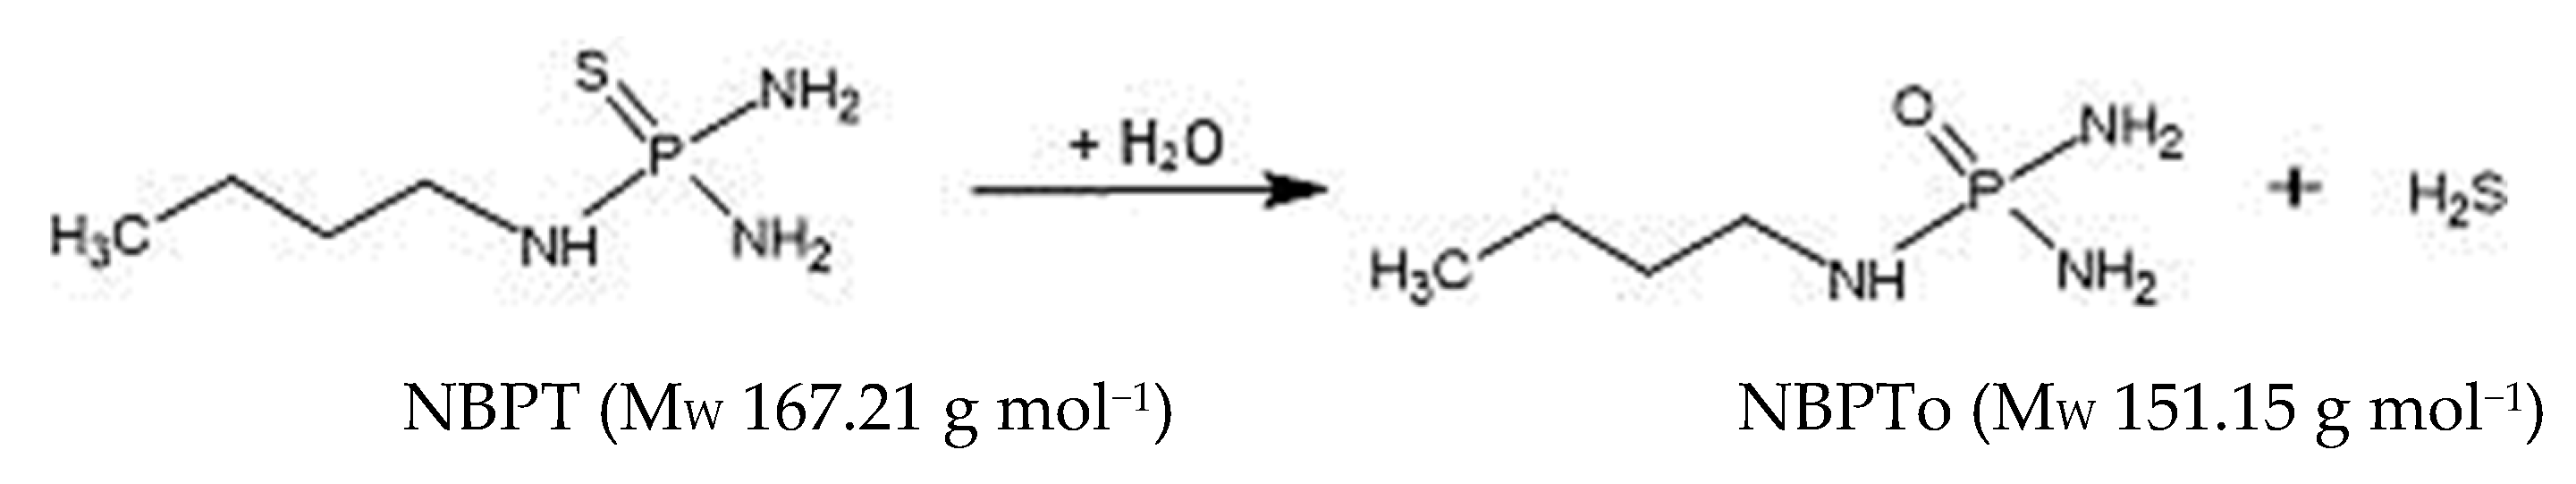
Development of One-Step Non-Solvent Extraction and Sensitive UHPLC-MS/MS Method for Assessment of N-(n-Butyl) Thiophosphoric Triamide (NBPT) and N-(n-Butyl) Phosphoric Triamide (NBPTo) in Milk

 , , ,
, , ,  ,
, 
Abstract
1. Introduction
2. Results and Discussion
2.1. Sample Extraction Development
2.2. UHPLC-MS/MS Method Development
2.3. Method Performance Characterization and Validation
2.3.1. Linearity and Specificity
2.3.2. Matrix Effect
2.3.3. Trueness and Precision
2.3.4. Limit of Quantitation
2.4. Application of Method
2.4.1. Stability Assessment of Standards in Solvent and in Milk Matrix
2.4.2. Farm Scale Pasture Grazing Experiment
3. Materials and Methods
3.1. Chemicals and Reagents
3.2. Standard Preparations
3.3. Calibration and Quality Control
3.4. Control of pH Using a Buffer
3.5. Sample Preparation
3.6. UHPLC-MS/MS Method Development and Analysis
3.7. Method Performance Characterization and Validation
3.8. Stability Assessment of NBPT and NBPTo in Solvents and Milk Matrix
3.9. Farm Scale Pasture Grazing Experiment
4. Conclusions
Supplementary Materials
Author Contributions
Funding
Institutional Review Board Statement
Informed Consent Statement
Data Availability Statement
Acknowledgments
Conflicts of Interest
Sample Availability
References
- Watson, C.; Miller, H.; Poland, P.; Kilpatrick, D.; Allen, M.; Garrett, M.; Christianson, C. Soil properties and the ability of the urease inhibitor N-(n-BUTYL) thiophosphoric triamide (nBTPT) to reduce ammonia volatilization from surface-applied urea. Soil Biol. Biochem. 1994, 26, 1165–1171. [Google Scholar] [CrossRef]
- Forrestal, P.J.; Harty, M.; Carolan, R.; Lanigan, G.J.; Watson, C.J.; Laughlin, R.J.; McNeill, G.; Chambers, B.J.; Richards, K.G. Ammonia emissions from urea, stabilized urea and calcium ammonium nitrate: Insights into loss abatement in temperate grassland. Soil Use Manag. 2015, 32, 92–100. [Google Scholar] [CrossRef]
- Environmental Protection Agency USA. Global Anthropogenic Non-CO2 Greenhouse Gas Emissions: 1990–2030. A Report from the Office of Atmospheric Programs, Climate Change Division (EPA 430-R-12-006); 2012. Available online: http://www.epa.gov/climatechange/EPAactivities/economics/nonco2projections.html (accessed on 10 May 2021).
- Byrne, M.P.; Tobin, J.T.; Forrestal, P.J.; Danaher, M.; Nkwonta, C.G.; Richards, K.; Cummins, E.; Hogan, S.A.; O’Callaghan, T.F. Urease and Nitrification Inhibitors—As Mitigation Tools for Greenhouse Gas Emissions in Sustainable Dairy Systems: A Review. Sustainability 2020, 12, 6018. [Google Scholar] [CrossRef]
- Jamil Khan, M.; Malik, A.; Zaman, M.; Khan, Q.; Rehman, H. Nitrogen Use Efficiency and Yield of Maize Crop as Affected by Agrotain Coated Urea in Arid Calcareous Soils. Soil Environ. 2014, 33, 1–6. [Google Scholar]
- Mateo-Marín, N.; Quílez, D.; Isla, R. Utility of stabilized nitrogen fertilizers to reduce nitrate leaching under optimal management practices. J. Plant Nutr. Soil Sci. 2020, 183, 567–578. [Google Scholar] [CrossRef]
- Pal, P.; McMillan, A.M.S.; Saggar, S. Pathways of dicyandiamide uptake in pasture plants: A laboratory study. Biol. Fertil. Soils 2016, 52, 539–546. [Google Scholar] [CrossRef]
- European Chemical Agency (ECHA). Nitrification and urease inhibitors. Fertilisers Regulation 2019/1102/EU, Annex I, F. Available online: https://echa.europa.eu/fertilizer-list-ann-1-f (accessed on 10 May 2021).
- Engel, R.; Williams, E.; Wallander, R.T.; Hilmer, J.K. Apparent Persistence of N -(n -butyl) Thiophosphoric Triamide Is Greater in Alkaline Soils. Soil Sci. Soc. Am. J. 2013, 77, 1424–1429. [Google Scholar] [CrossRef]
- Engel, R.E.; Towey, B.D.; Gravens, E. Degradation of the Urease Inhibitor NBPT as Affected by Soil pH. Soil Sci. Soc. Am. J. 2015, 79, 1674–1683. [Google Scholar] [CrossRef]
- Francisco, S.S.; Urrutia, O.; Martin, V.; Peristeropoulos, A.; Garcia-Mina, J.M. Efficiency of urease and nitrification inhibitors in reducing ammonia volatilization from diverse nitrogen fertilizers applied to different soil types and wheat straw mulching. J. Sci. Food Agric. 2011, 91, 1569–1575. [Google Scholar] [CrossRef]
- Domínguez, M.J.; Sanmartín, C.; Font, M.; Palop, J.A.; Francisco, S.S.; Urrutia, O.; Houdusse, F.; García-Mina, J.M. Design, Synthesis, and Biological Evaluation of Phosphoramide Derivatives as Urease Inhibitors. J. Agric. Food Chem. 2008, 56, 3721–3731. [Google Scholar] [CrossRef]
- Van De Ligt, J.; Borghoff, S.J.; Yoon, M.; Ferguson, L.J.; DeMaio, W.; McClanahan, R.H. Nondetectable or minimal detectable residue levels of N-(n-butyl) thiophosphoric triamide in bovine tissues and milk from a 28-d NBPT dosing study. Transl. Anim. Sci. 2019, 3, 1606–1616. [Google Scholar] [CrossRef] [PubMed]
- National Industrial Chemicals Notification and Assessment Scheme (Australia) & Australia, Department of Health and Ageing. N-(n-Butyl) Thiophosphoric Triamide; NICNAS: Sydney, Australia, 2011.
- Gutierrez-Docio, A.; Almodóvar, P.; Moreno-Fernandez, S.; Silvan, J.M.; Martinez-Rodriguez, A.J.; Alonso, G.L.; Prodanov, M. Evaluation of an Integrated Ultrafiltration/Solid Phase Extraction Process for Purification of Oligomeric Grape Seed Procyanidins. Membranes 2020, 10, 147. [Google Scholar] [CrossRef]
- Guiry, E.J.; Szpak, P.; Richards, M.P. Effects of lipid extraction and ultrafiltration on stable carbon and nitrogen isotopic compositions of fish bone collagen. Rapid Commun. Mass Spectrom. 2016, 30, 1591–1600. [Google Scholar] [CrossRef]
- Lee, K.; Mower, R.; Hollenbeck, T.; Castelo, J.; Johnson, N.; Gordon, P.; Sinko, P.J.; Holme, K.; Lee, Y. Modulation of nonspecific binding in ultrafiltration protein binding studies. Pharm. Res. 2003, 20, 1015–1021. [Google Scholar] [CrossRef]
- European Commission. Method Validation Procedures for Pesticide Residues Analysis in Food and Feed; European Commission: Brussels, Belgium; Luxembourg, 2019. [Google Scholar]
- Kruve, A.; Kaupmees, K. Adduct Formation in ESI/MS by Mobile Phase Additives. J. Am. Soc. Mass Spectrom. 2017, 28, 887–894. [Google Scholar] [CrossRef]
- Ma, Y.-C.; Kim, H.-Y. Determination of steroids by liquid chromatography/mass spectrometry. J. Am. Soc. Mass Spectrom 1997, 8, 1010–1020. [Google Scholar] [CrossRef]
- Jenkins, R.; Duggan, J.X.; Aubry, A.-F.; Zeng, J.; Lee, J.W.; Cojocaru, L.; Dufield, D.; Garofolo, F.; Kaur, S.; Schultz, G.A.; et al. Recommendations for Validation of LC-MS/MS Bioanalytical Methods for Protein Biotherapeutics. AAPS J. 2015, 17, 1–16. [Google Scholar] [CrossRef]
- Patel, D. Matrix Effect in a View of LC-MS/MS: An Overview. Int. J. Pharma Bio Sci. 2011, 2, 559–564. [Google Scholar]
- Gaugain, M.; Chotard, M.-P.; Verdon, E. Stability Study for 53 Antibiotics in Solution and in Fortified Biological Matrixes by LC/MS/MS. J. AOAC Int. 2013, 96, 471–480. [Google Scholar] [CrossRef]
- Khedr, T.; Ryad, L.; Youssef, A.O. Testing the validity of reference standard materials and stock solutions of veterinary drugs using LC-MS/MS. Food Addit. Contam. Part A 2019, 36, 405–412. [Google Scholar] [CrossRef]
- Berendsen, B.; Elbers, I.; Stolker, A. Determination of the stability of antibiotics in matrix and reference solutions using a straightforward procedure applying mass spectrometric detection. Food Addit. Contam. Part A 2011, 28, 1–10. [Google Scholar] [CrossRef] [PubMed]
- Desmarchelier, A.; Feuerrigel, P.; Ahmed, H.F.; Moulin, J.; Beck, A.; Mujahid, C.; Bessaire, T.; Savoy, M.-C.; Mottier, P. Stability study of veterinary drugs in standard solutions for LC-MS/MS screening in food. Food Addit. Contam. Part A 2018, 35, 696–706. [Google Scholar] [CrossRef] [PubMed]


| Validation Parameter (10 Runs) | NBPT | NBPTo | ||
|---|---|---|---|---|
| Level (mg kg−1) | L1, 0.0020 | L2, 0.0250 | L1, 0.0020 | L2, 0.0250 |
| Extraction recovery | ||||
| Average Accuracy (%) | 92 | 95 | 94 | 98 |
| Precision (%) | ||||
| RSDr | 6 | 1 | 9 | 3 |
| RSDWR | 8 | 7 | 10 | 6 |
| Trueness (%) | ||||
| Within laboratory repeatability, WLr | 103 | 101 | 100 | 108 |
| Within laboratory reproducibility, WLR | 102 | 99 | 101 | 103 |
| Sensitivity/Linearity | ||||
| Accuracy Range (%) | 81–119 | 81–117 | ||
| RSD (%) | 6 | 8 | ||
| R2 | ≥0.9940 | ≥0.9900 | ||
| Reporting Limit/ LOQ (mg kg−1) | 0.0020 | 0.0020 | ||
| Matrix Effect range (n = 30), % | 68–112 | 31–117 | ||
| RSD (%) | 13 | 16 | ||
| Sampling Year | Month | Sample Source | ||
|---|---|---|---|---|
| Bulk Tank | Individual Cows | |||
| Experiment Farm Samples (Johnstown Castle Farm) | Negative Control Farm (No urea + NBPT) | Grazing Pastures Fertilised at 234 kg N/ha as Urea + NBPT | ||
| 2020 | February | 12 | - | - |
| March | 24 | 3 | - | |
| April | 24 | 9 | - | |
| May | 24 | 12 | - | |
| June | 24 | 9 | 80 | |
| July | 24 | 9 | 80 | |
| August | 21 | 9 | 80 | |
| September | 26 | 8 | - | |
| October | 10 | |||
| November | 8 | |||
| December | 8 | |||
| 2021 | January | 8 | ||
| February | 4 | |||
| Total sample | 217 | 59 | 240 | |
| Sum of residues (NBPT and NBPTo) concentrations for all samples (mg kg−1) | <0.0020 | <0.0020 | <0.0020 | |
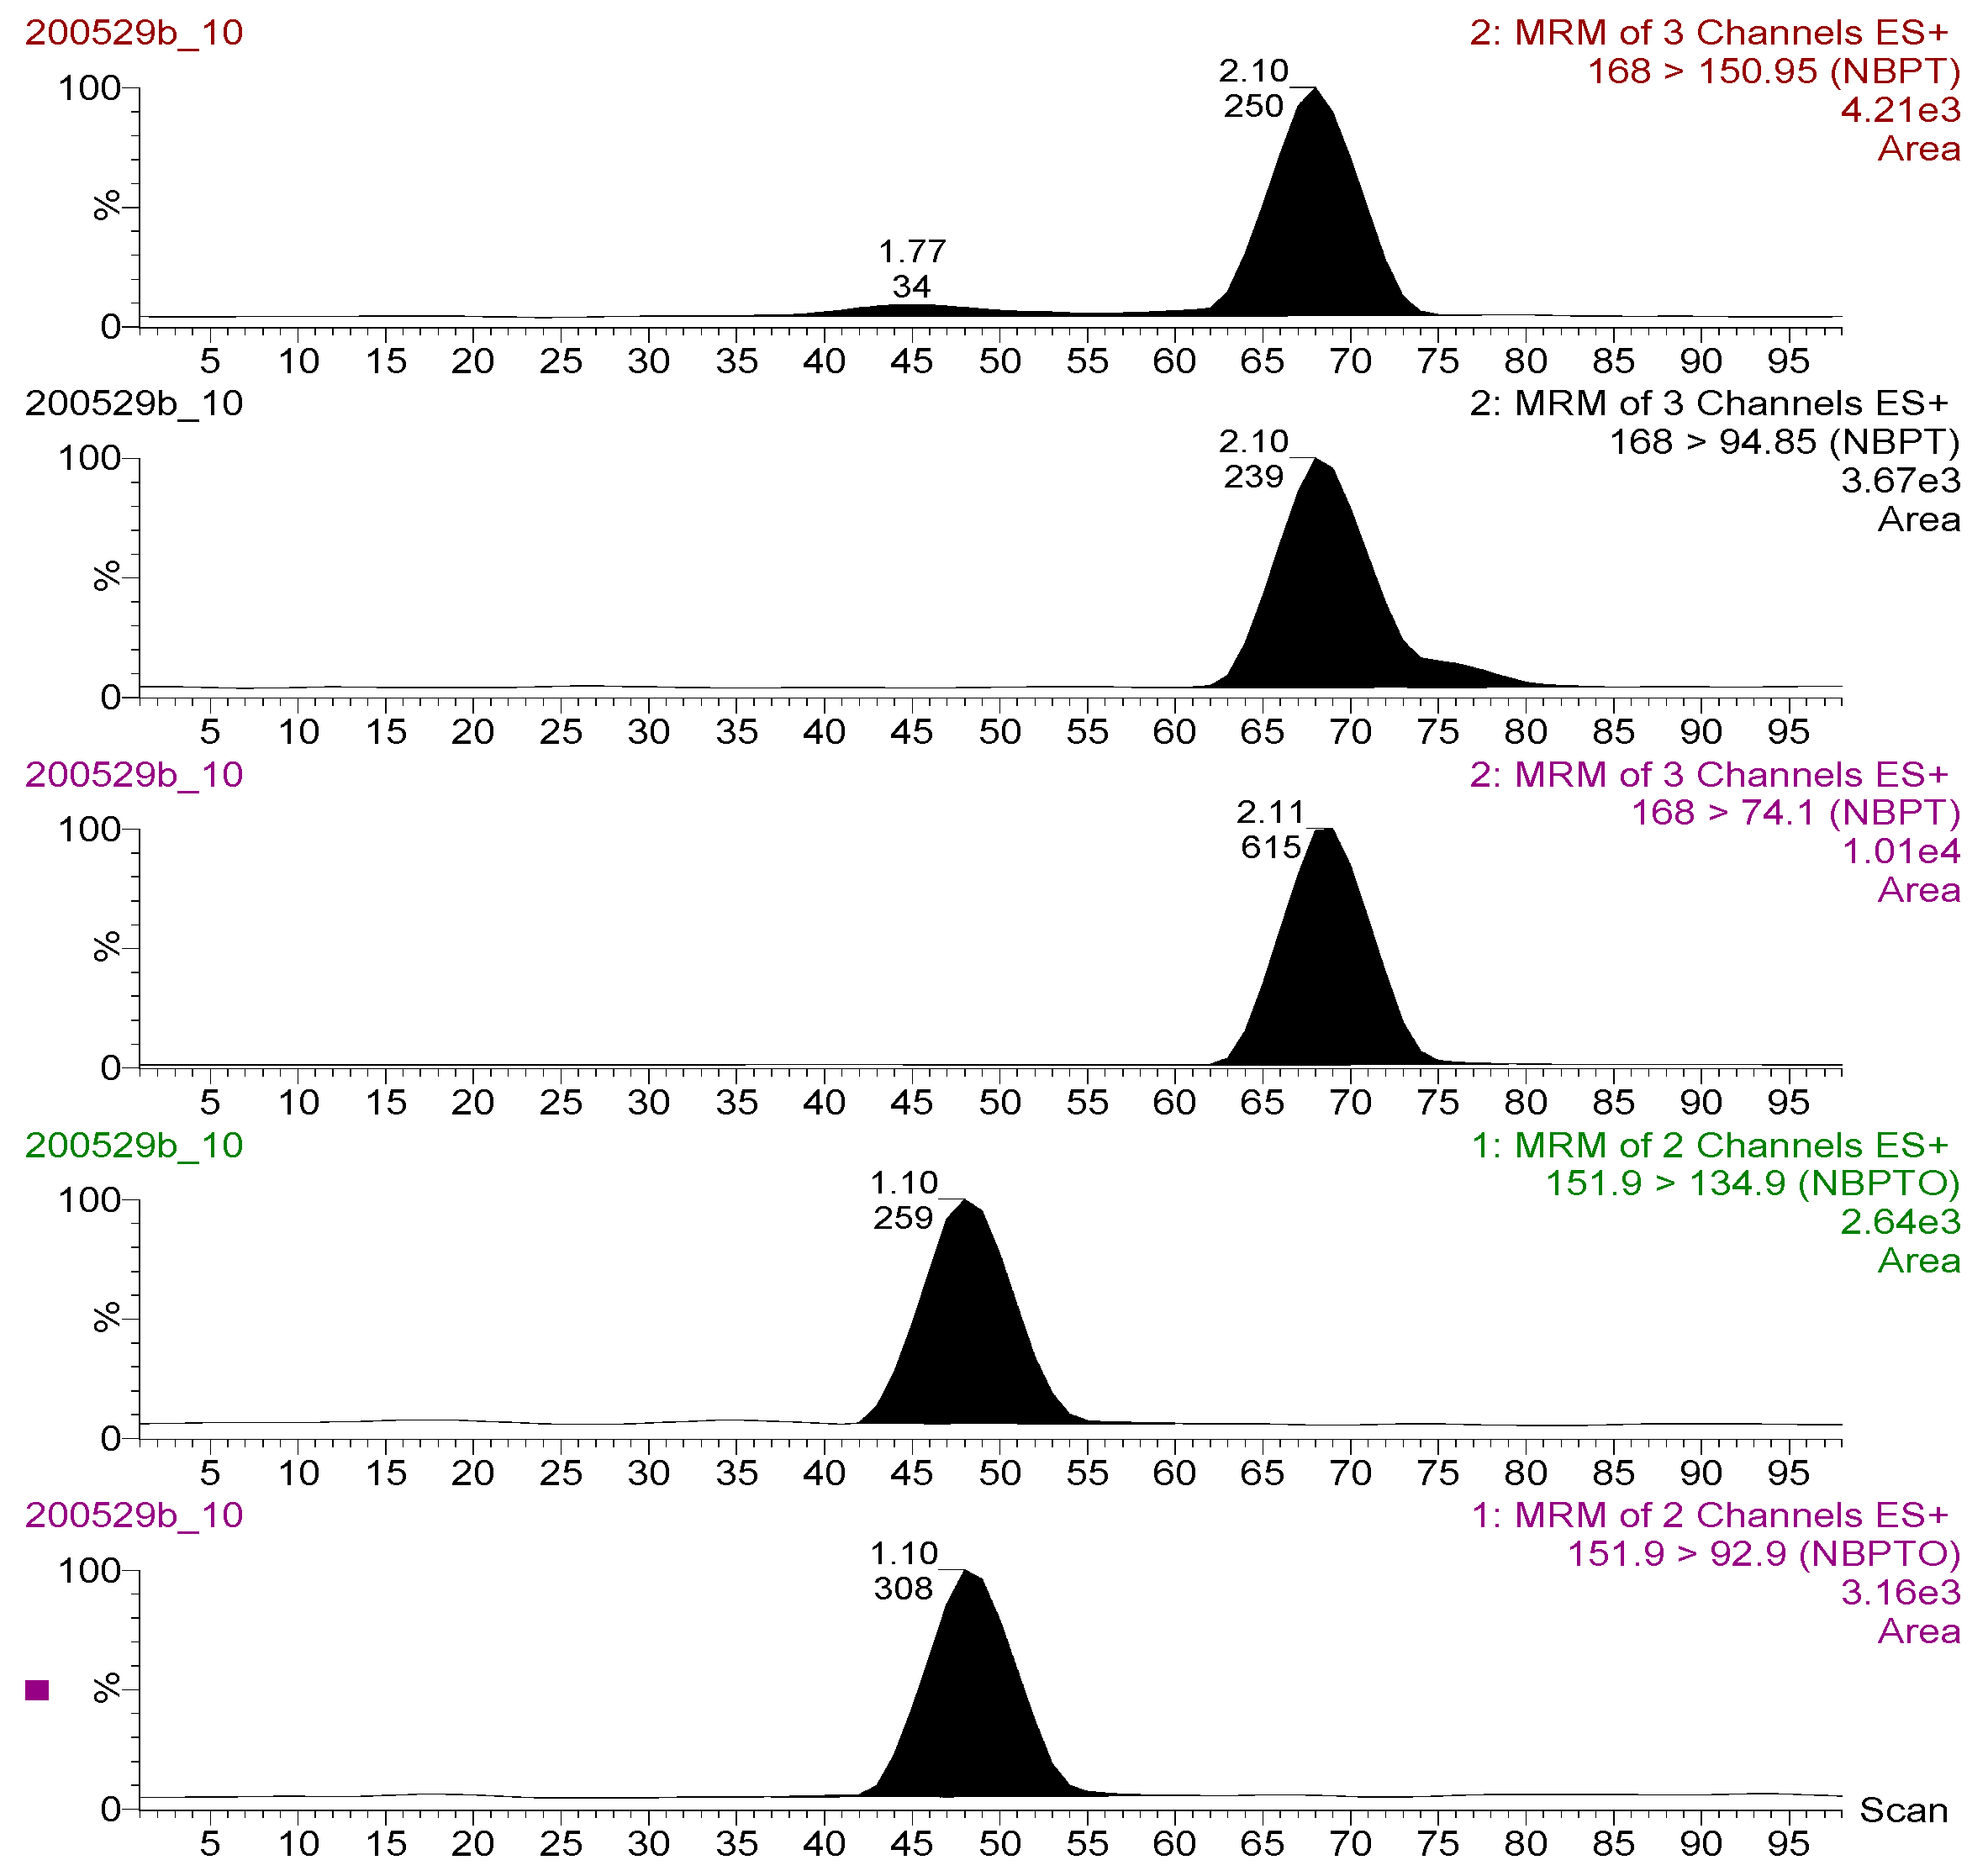
| Channel | Compound | RT (min) | Parent ion (m/z) | Daughter (m/z) | Dwell Time (s) | Collision Energy (eV) |
|---|---|---|---|---|---|---|
| 1 | NBPTO | 1.10 | 151.90 | 92.90 | 0.200 | 15.00 |
| 2 | 151.90 | 134.90 | 0.200 | 13.00 | ||
| 3 | NBPT | 2.11 | 168.00 | 74.10 | 0.200 | 12.00 |
| 4 | 168.00 | 94.85 | 0.200 | 18.00 | ||
| 5 | 168.00 | 150.95 | 0.200 | 10.00 |
| Herd | Number of Cows | Nitrogen Rate (kg N ha−1) | Sward |
|---|---|---|---|
| Red | 44 | 214 | Ryegrass/Clover (95%/5%) |
| Yellow | 42 | 212 | Ryegrass/Clover (95%/5%) |
| Green | 20 | 234 | Ryegrass/Clover (80%/20%) |
| Blue | 20 | 82 | Multi-species |
| White * | 29 | 162 | Ryegrass/Clover (95%/5%) |
| Mean N Rate | 181 |
Publisher’s Note: MDPI stays neutral with regard to jurisdictional claims in published maps and institutional affiliations. |
© 2021 by the authors. Licensee MDPI, Basel, Switzerland. This article is an open access article distributed under the terms and conditions of the Creative Commons Attribution (CC BY) license (https://creativecommons.org/licenses/by/4.0/).
Share and Cite
Nkwonta, C.G.; O’Neill, M.; Rahman, N.; Moloney, M.; Forrestal, P.J.; Hogan, S.A.; Richards, K.G.; Cummins, E.; Danaher, M. Development of One-Step Non-Solvent Extraction and Sensitive UHPLC-MS/MS Method for Assessment of N-(n-Butyl) Thiophosphoric Triamide (NBPT) and N-(n-Butyl) Phosphoric Triamide (NBPTo) in Milk. Molecules 2021, 26, 2890. https://doi.org/10.3390/molecules26102890
Nkwonta CG, O’Neill M, Rahman N, Moloney M, Forrestal PJ, Hogan SA, Richards KG, Cummins E, Danaher M. Development of One-Step Non-Solvent Extraction and Sensitive UHPLC-MS/MS Method for Assessment of N-(n-Butyl) Thiophosphoric Triamide (NBPT) and N-(n-Butyl) Phosphoric Triamide (NBPTo) in Milk. Molecules. 2021; 26(10):2890. https://doi.org/10.3390/molecules26102890
Chicago/Turabian StyleNkwonta, Chikere G., Macdara O’Neill, Niharika Rahman, Mary Moloney, Patrick J. Forrestal, Sean A. Hogan, Karl G. Richards, Enda Cummins, and Martin Danaher. 2021. "Development of One-Step Non-Solvent Extraction and Sensitive UHPLC-MS/MS Method for Assessment of N-(n-Butyl) Thiophosphoric Triamide (NBPT) and N-(n-Butyl) Phosphoric Triamide (NBPTo) in Milk" Molecules 26, no. 10: 2890. https://doi.org/10.3390/molecules26102890
APA StyleNkwonta, C. G., O’Neill, M., Rahman, N., Moloney, M., Forrestal, P. J., Hogan, S. A., Richards, K. G., Cummins, E., & Danaher, M. (2021). Development of One-Step Non-Solvent Extraction and Sensitive UHPLC-MS/MS Method for Assessment of N-(n-Butyl) Thiophosphoric Triamide (NBPT) and N-(n-Butyl) Phosphoric Triamide (NBPTo) in Milk. Molecules, 26(10), 2890. https://doi.org/10.3390/molecules26102890