
Determinants for α4β2 vs. α3β4 Subtype Selectivity of Pyrrolidine-Based nAChRs Ligands: A Computational Perspective with Focus on Recent cryo-EM Receptor Structures


Abstract
1. Introduction
2. Results and Discussion
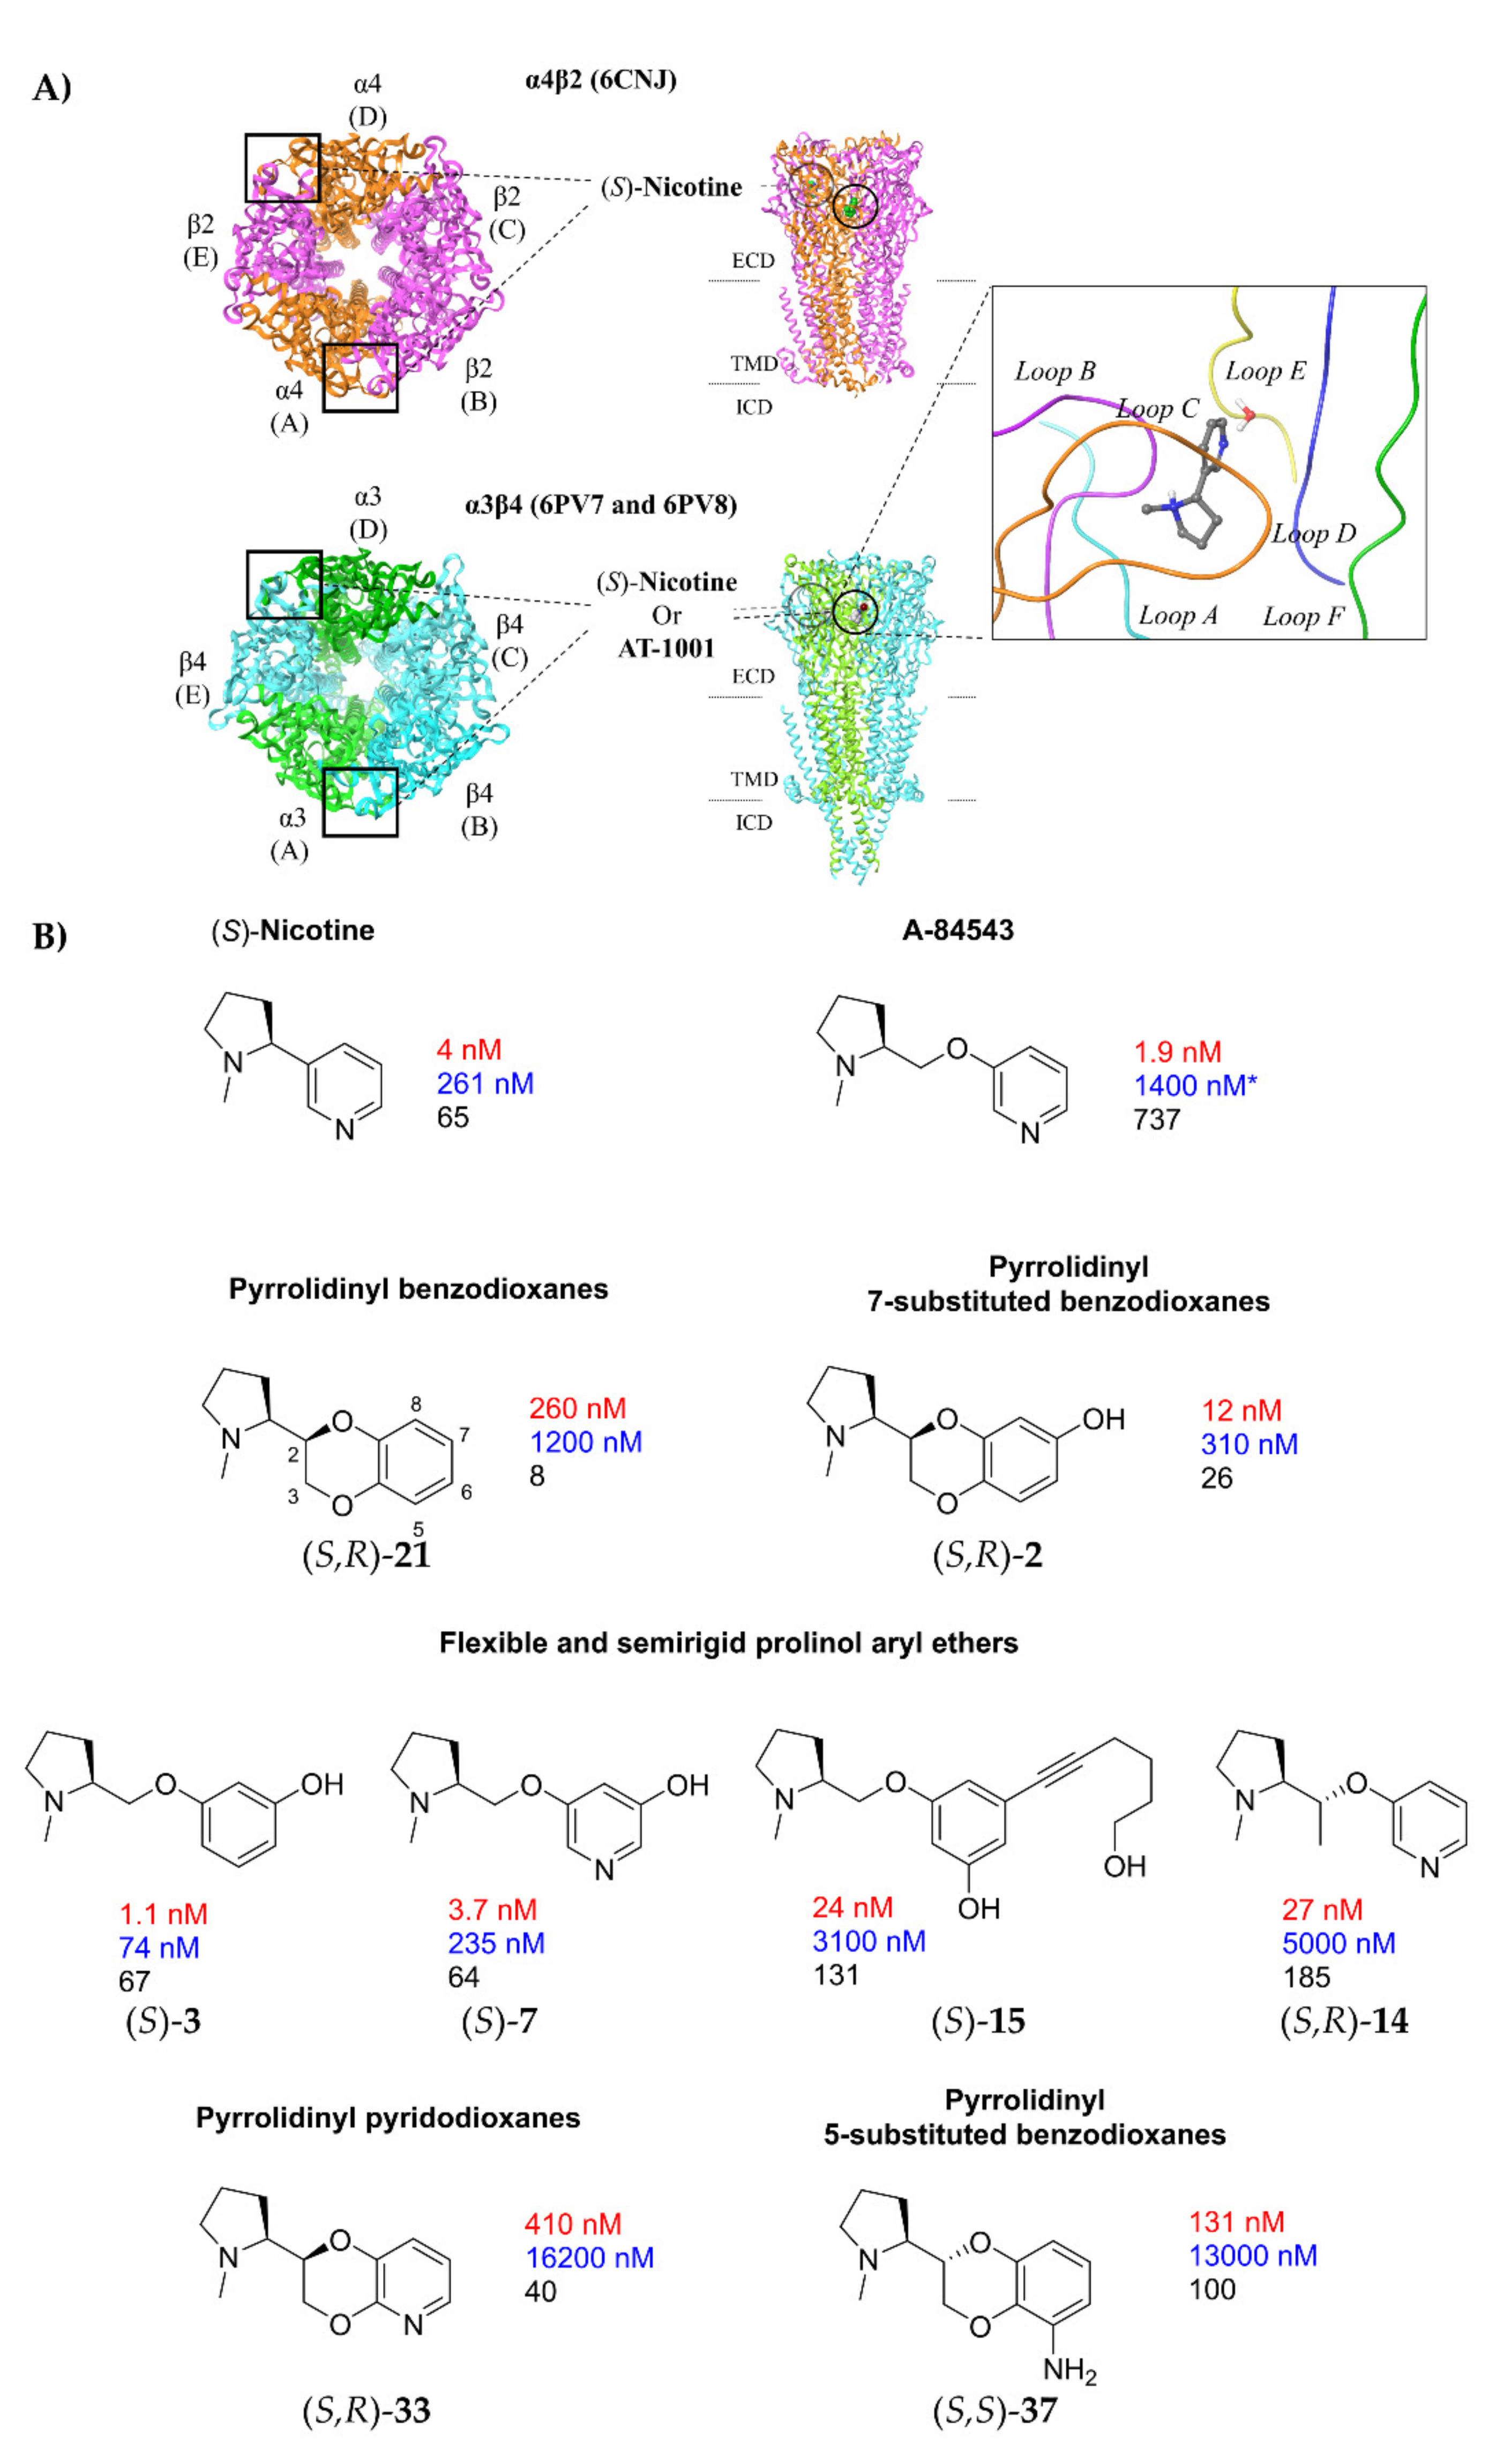
2.1. Nicotine, Pyridyl Ethers of (S)-N-Me-Prolinol, and Inter-Species α4β2 vs. α3β4 Selectivity Ratios
2.1.1. Analysis of α4β2 and α3β4 Affinity, Activity, and Selectivity Data from the Literature
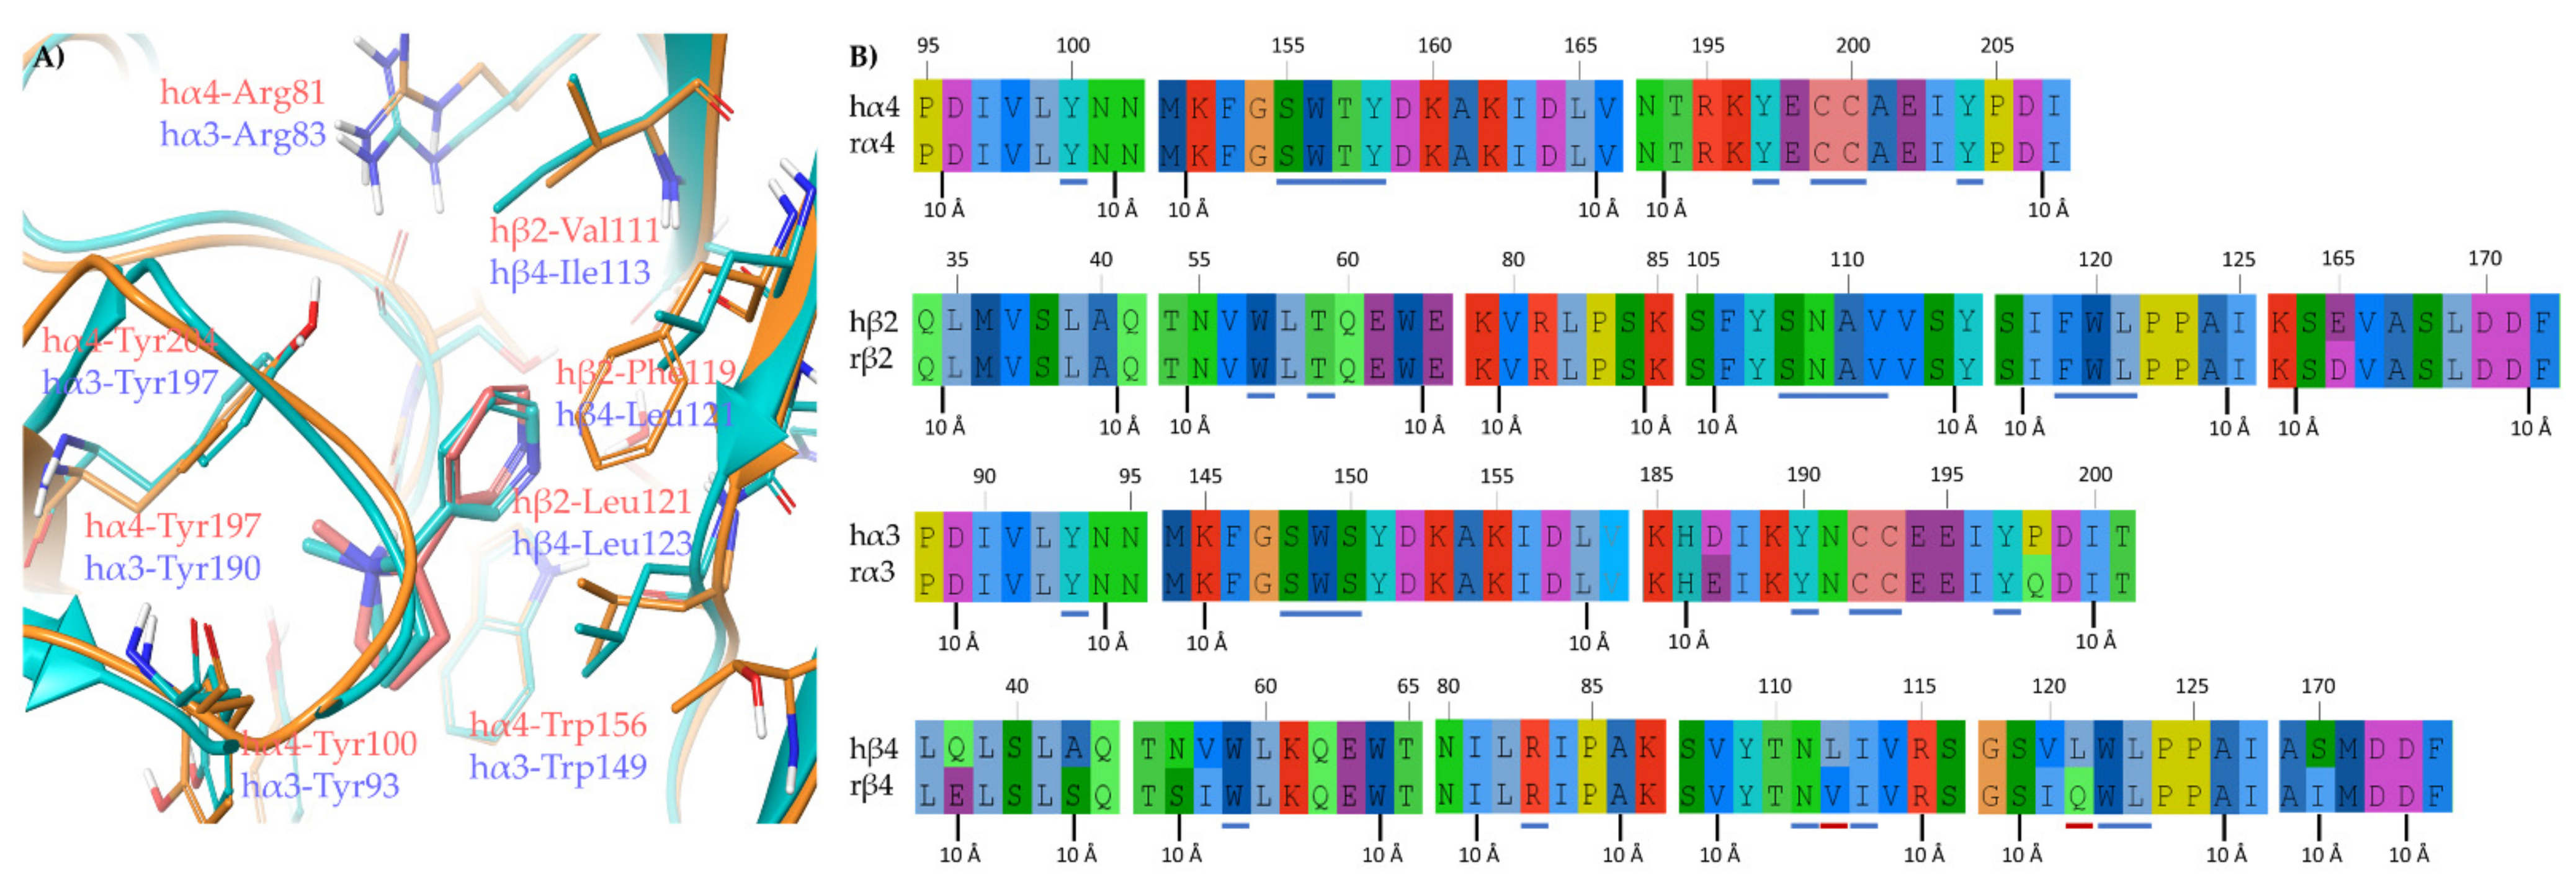
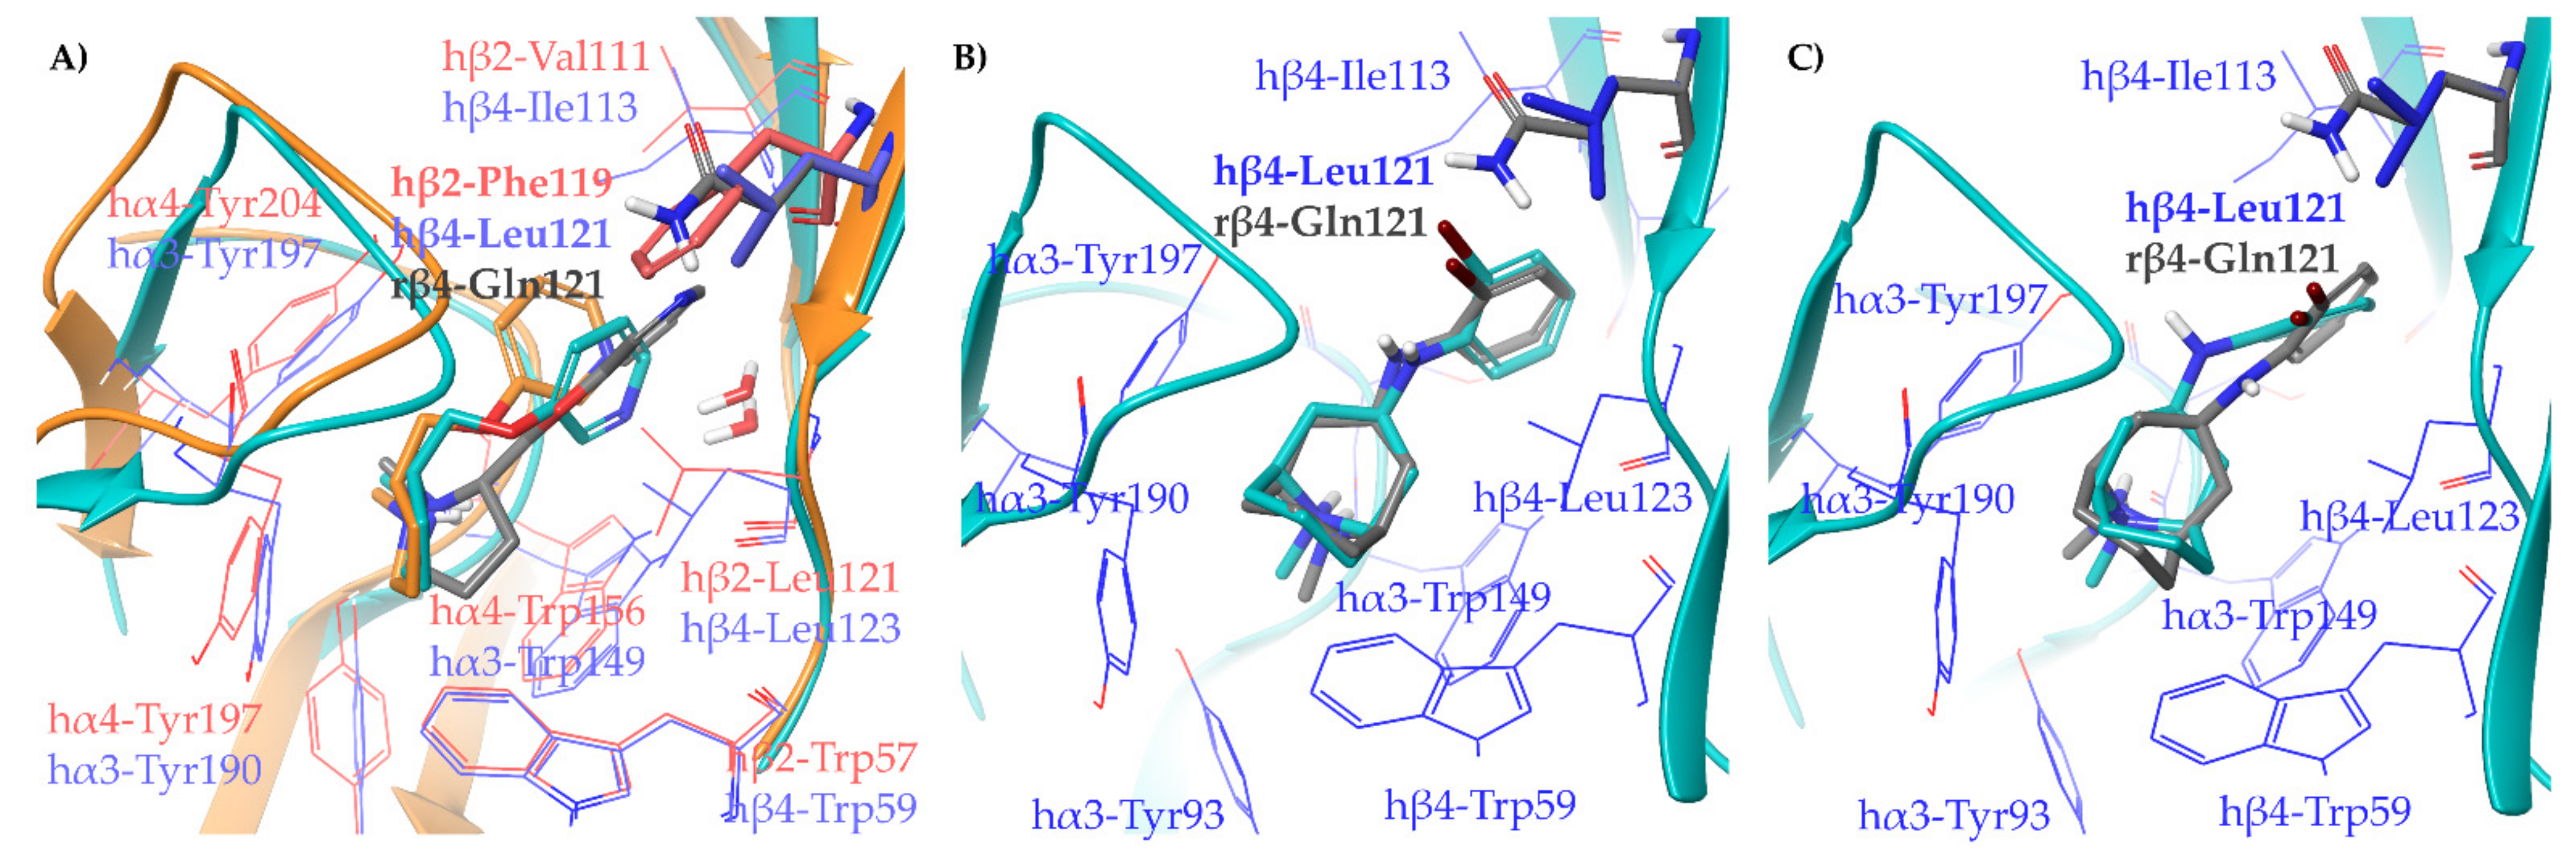
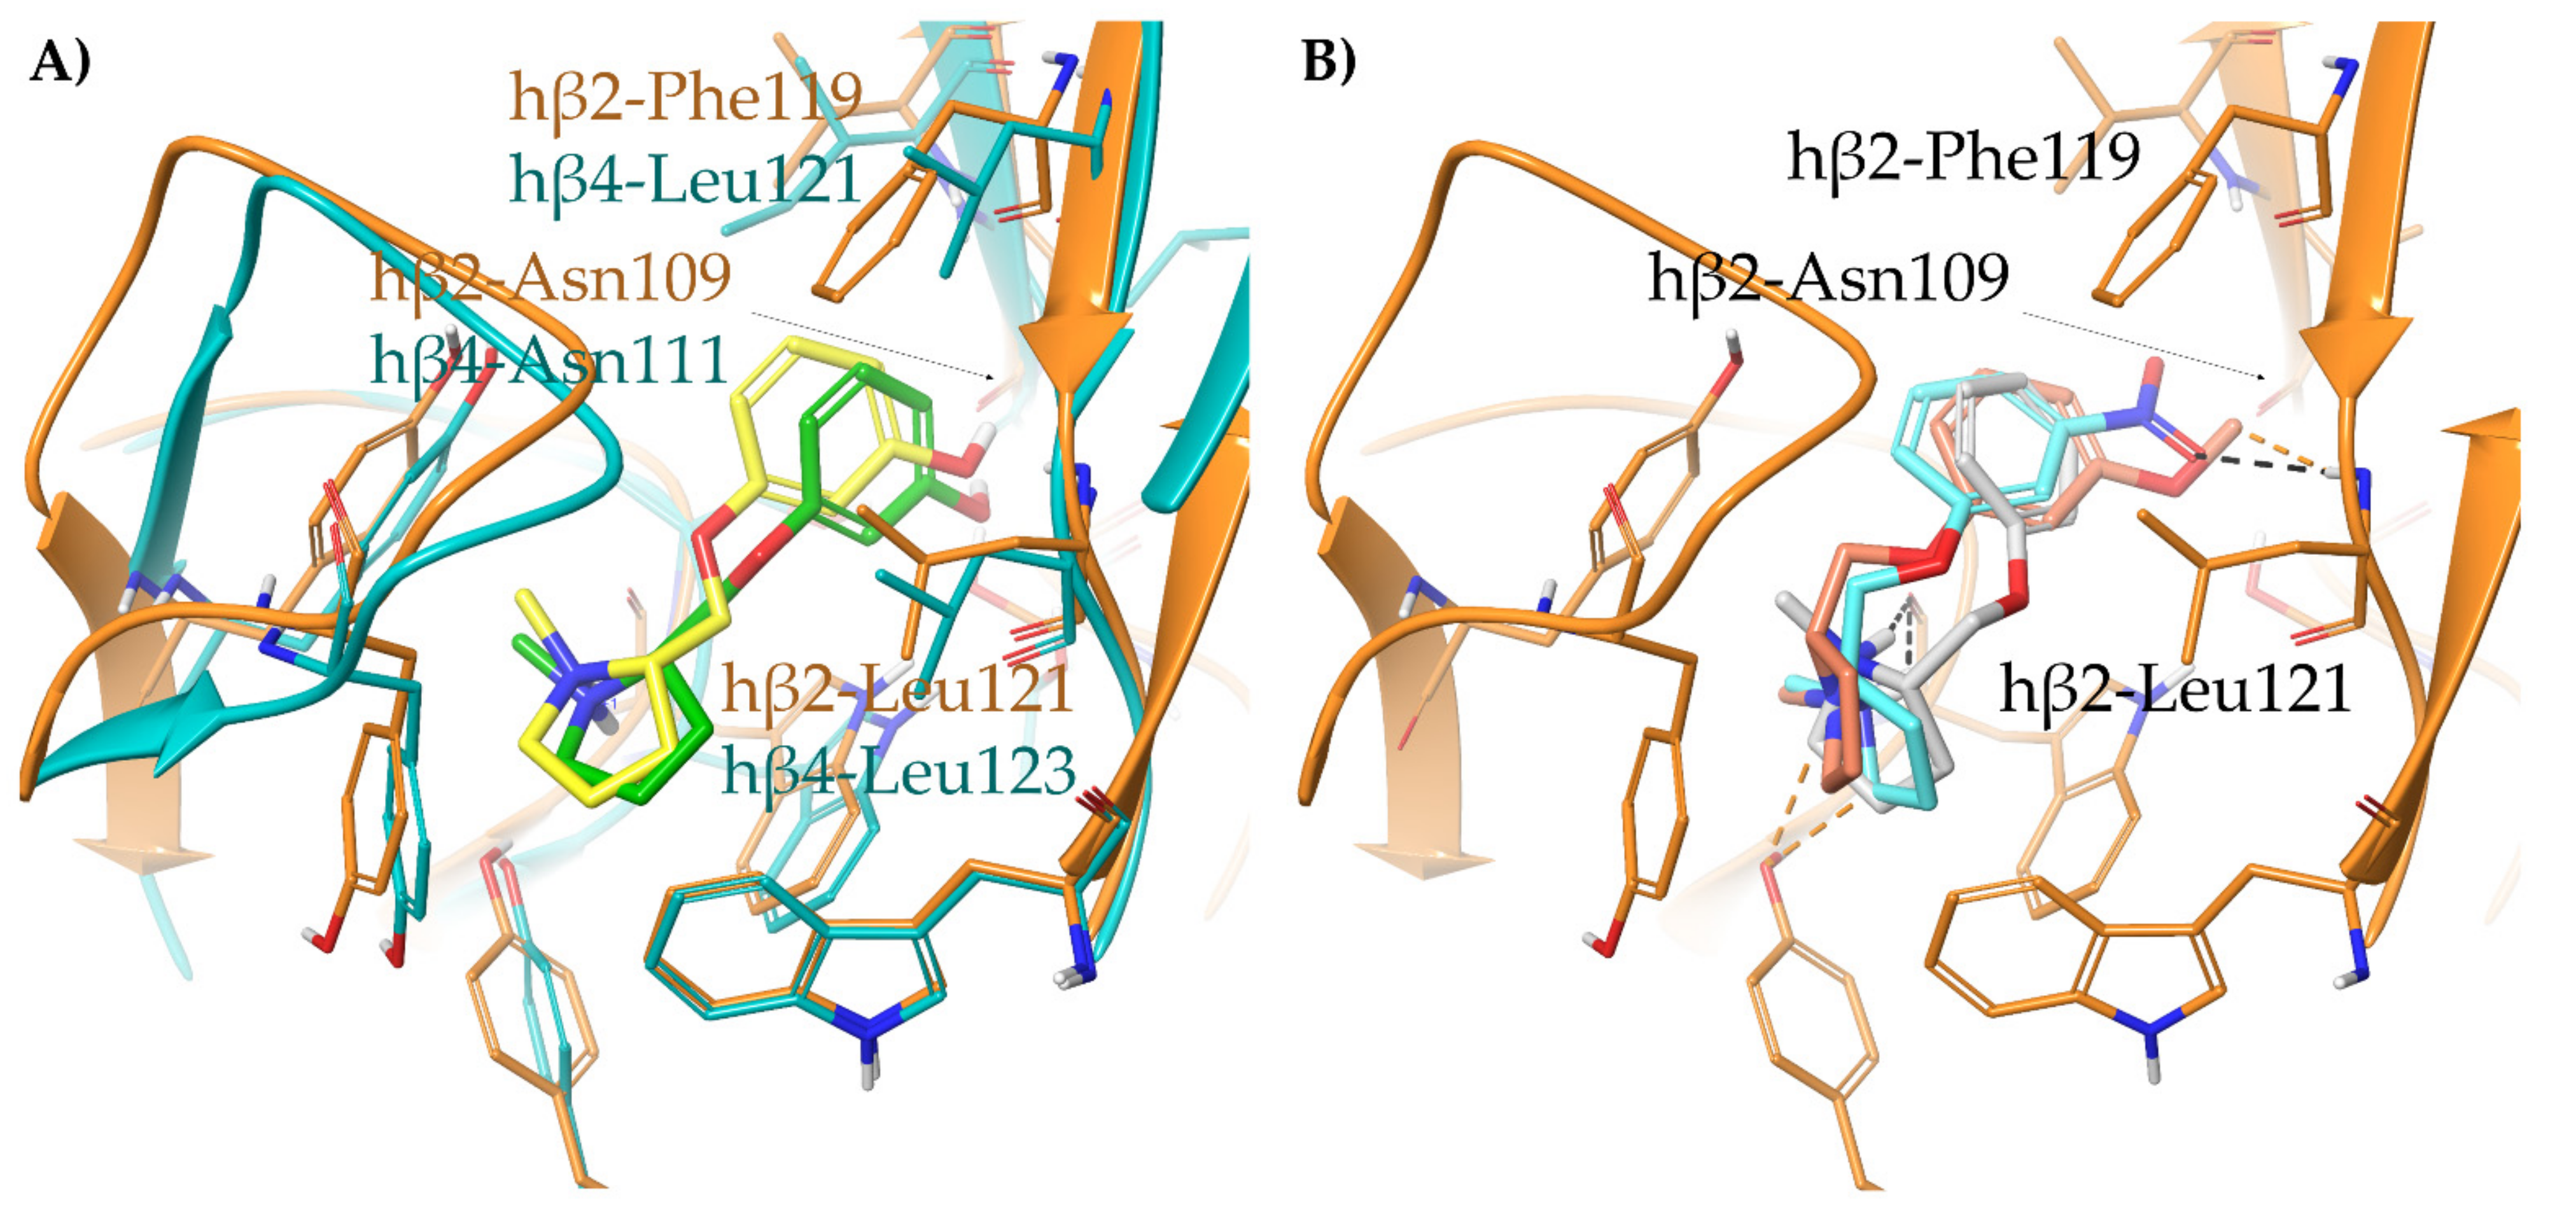
2.1.2. Structural Rationalization of the Rat vs. Human Differences of α4β2 vs. α3β4 Selectivity Ratios
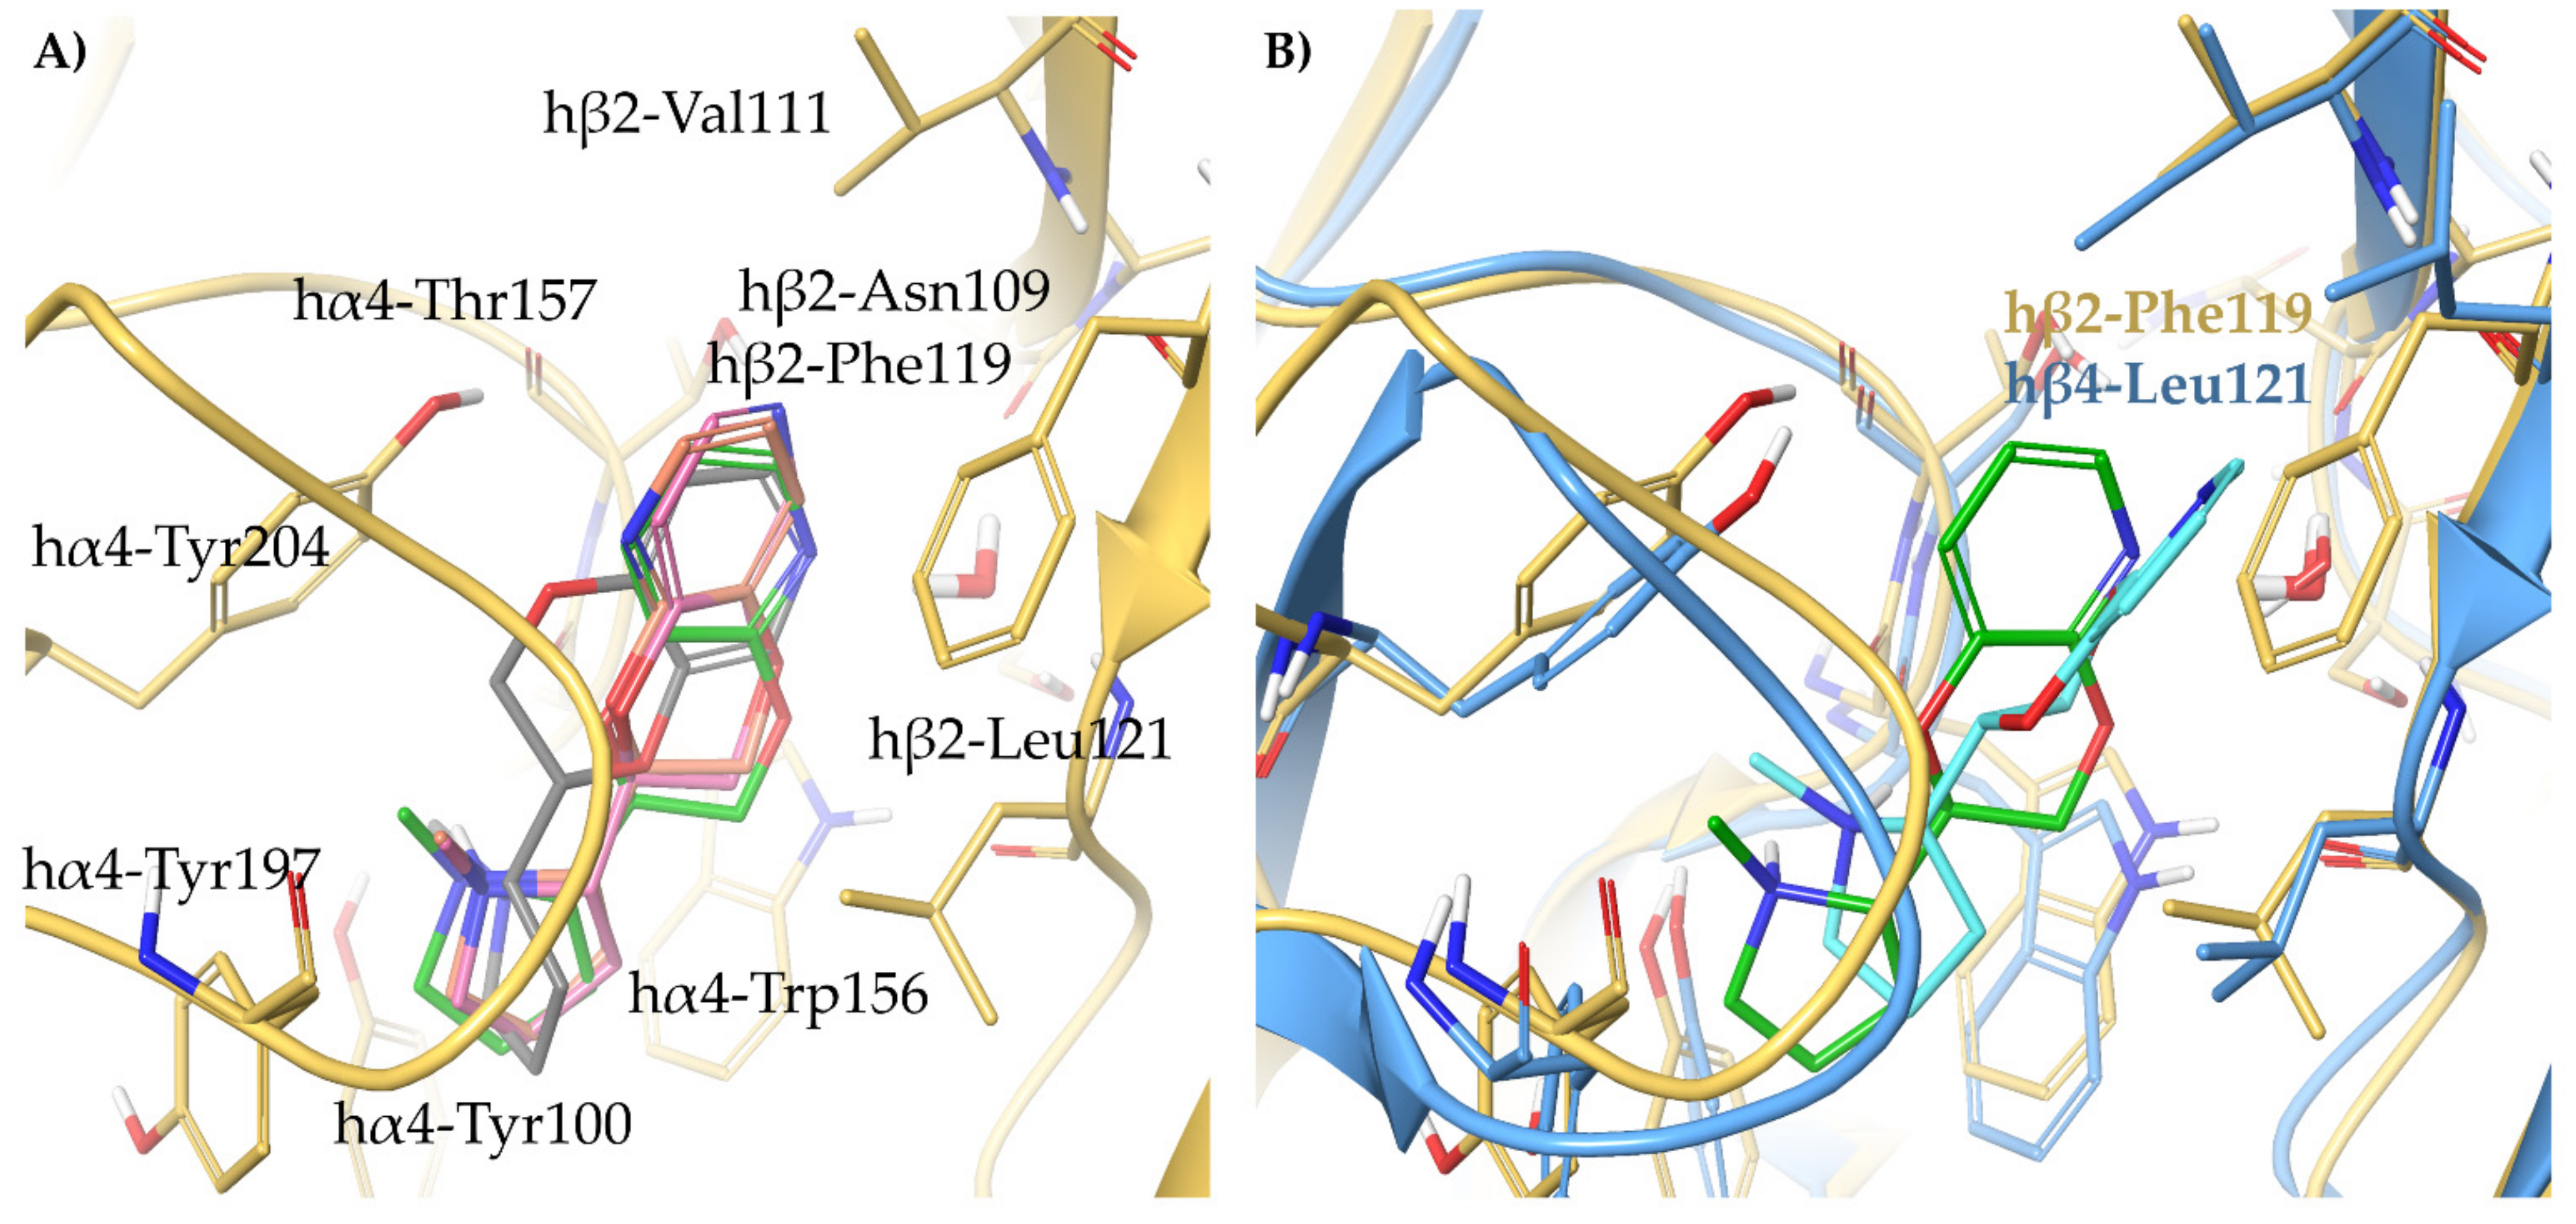
2.2. Rationalization of Determinants for α4β2 vs. α3β4 nAChR Selectivity of Small, Flexible Phenyl Ethers of (S)-N-Methyl-Prolinol
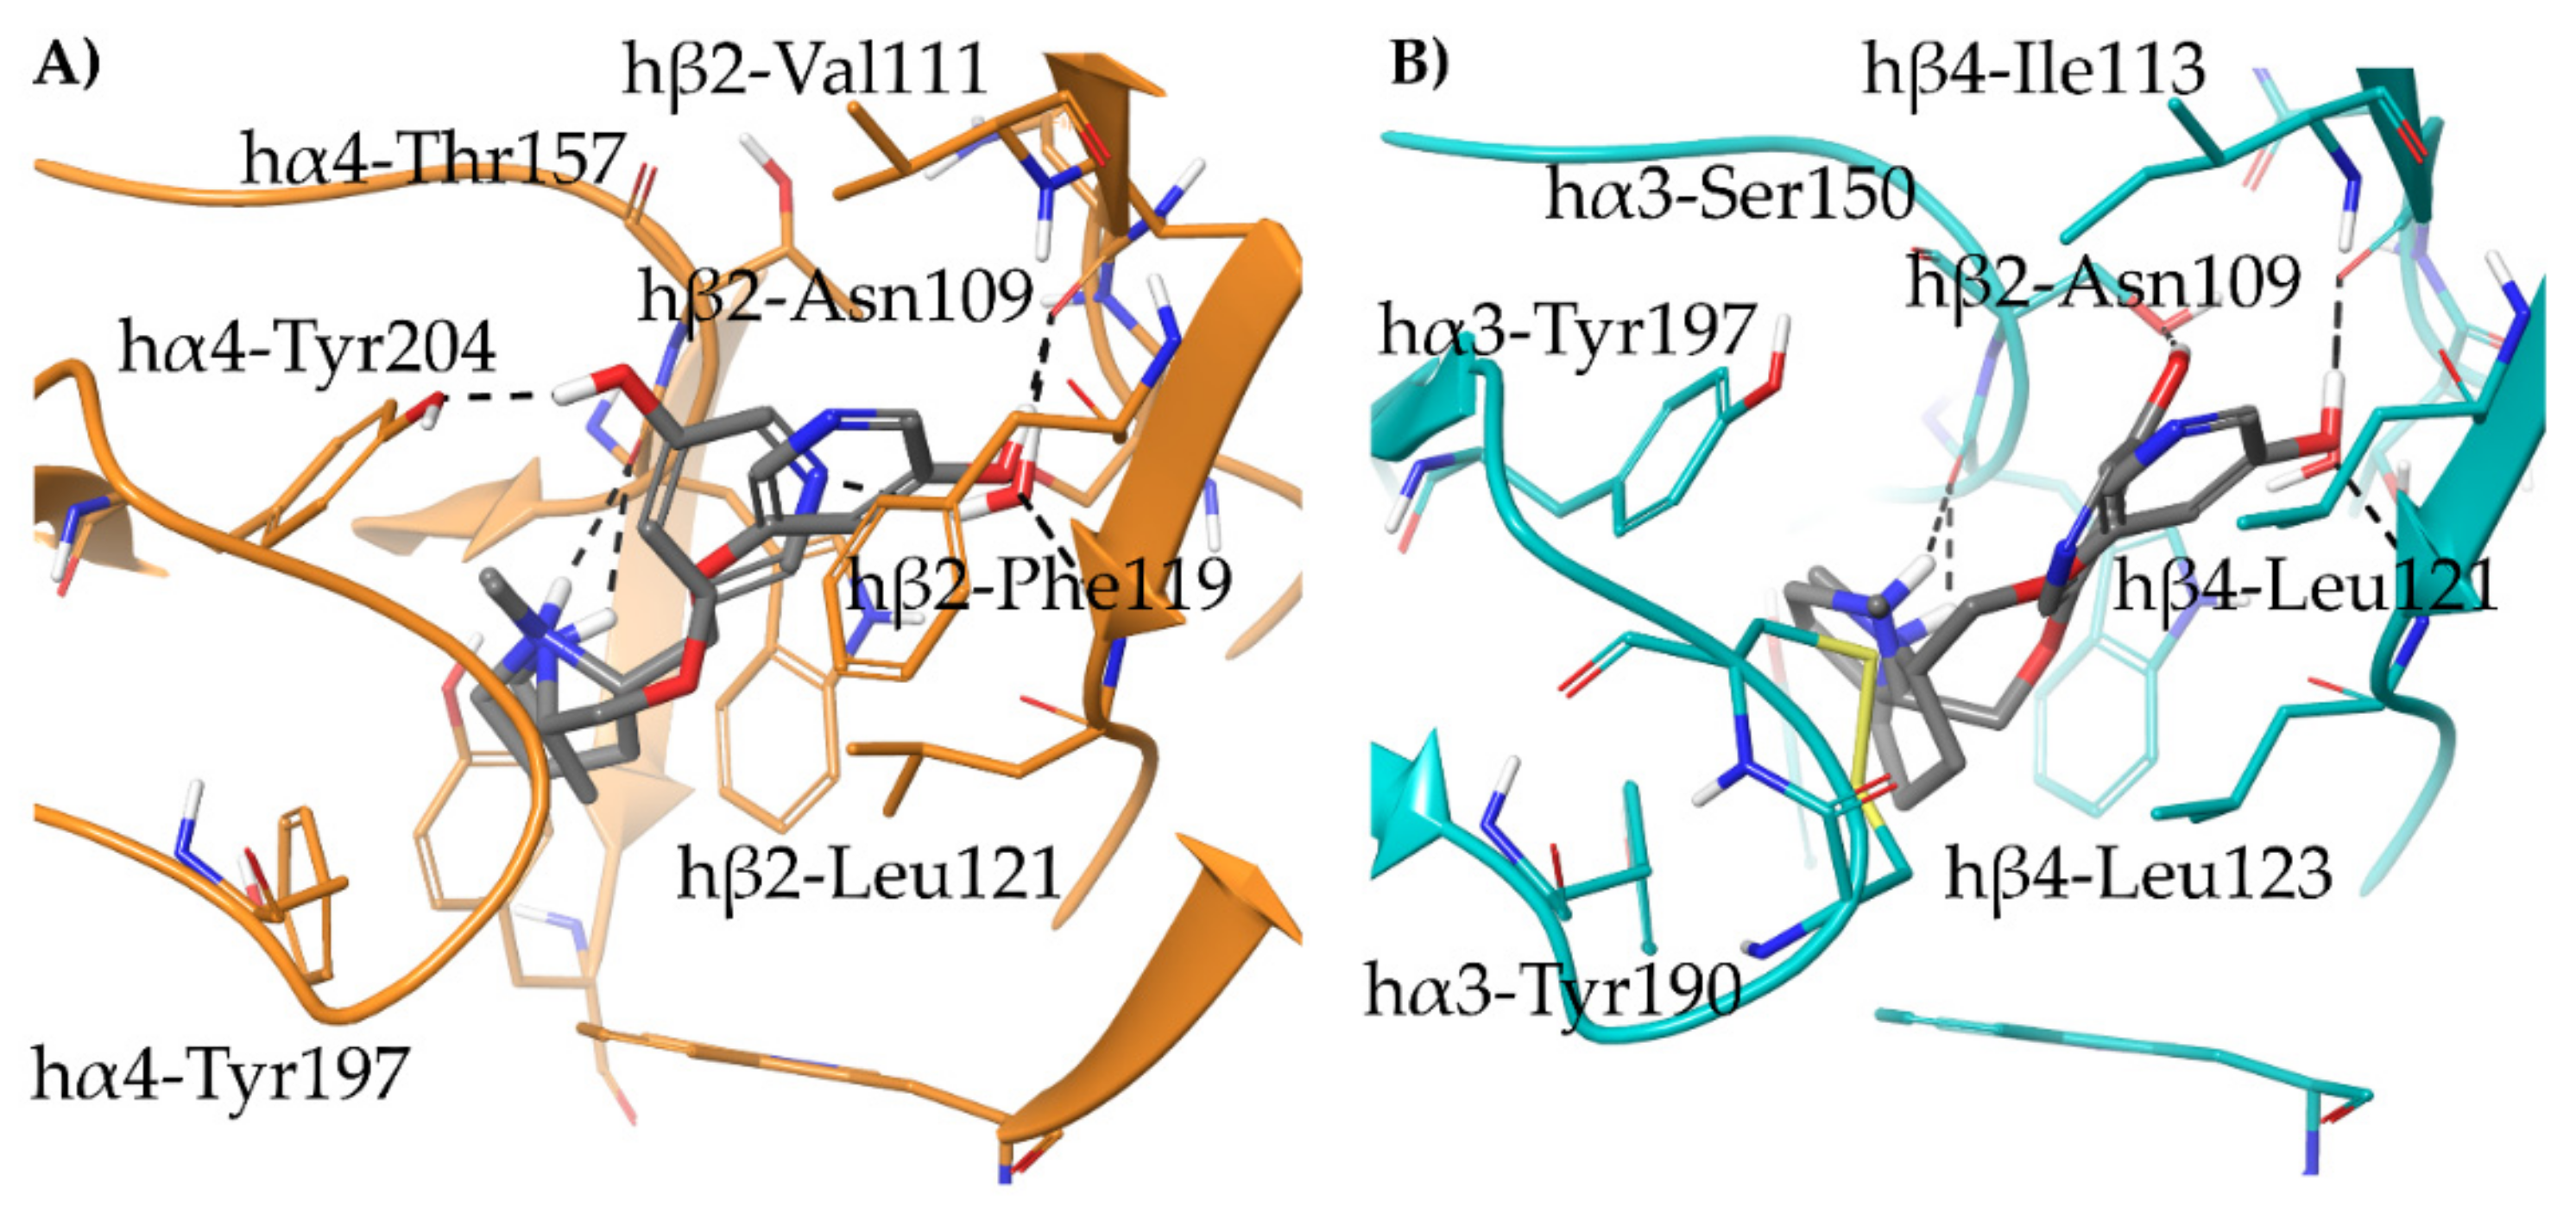
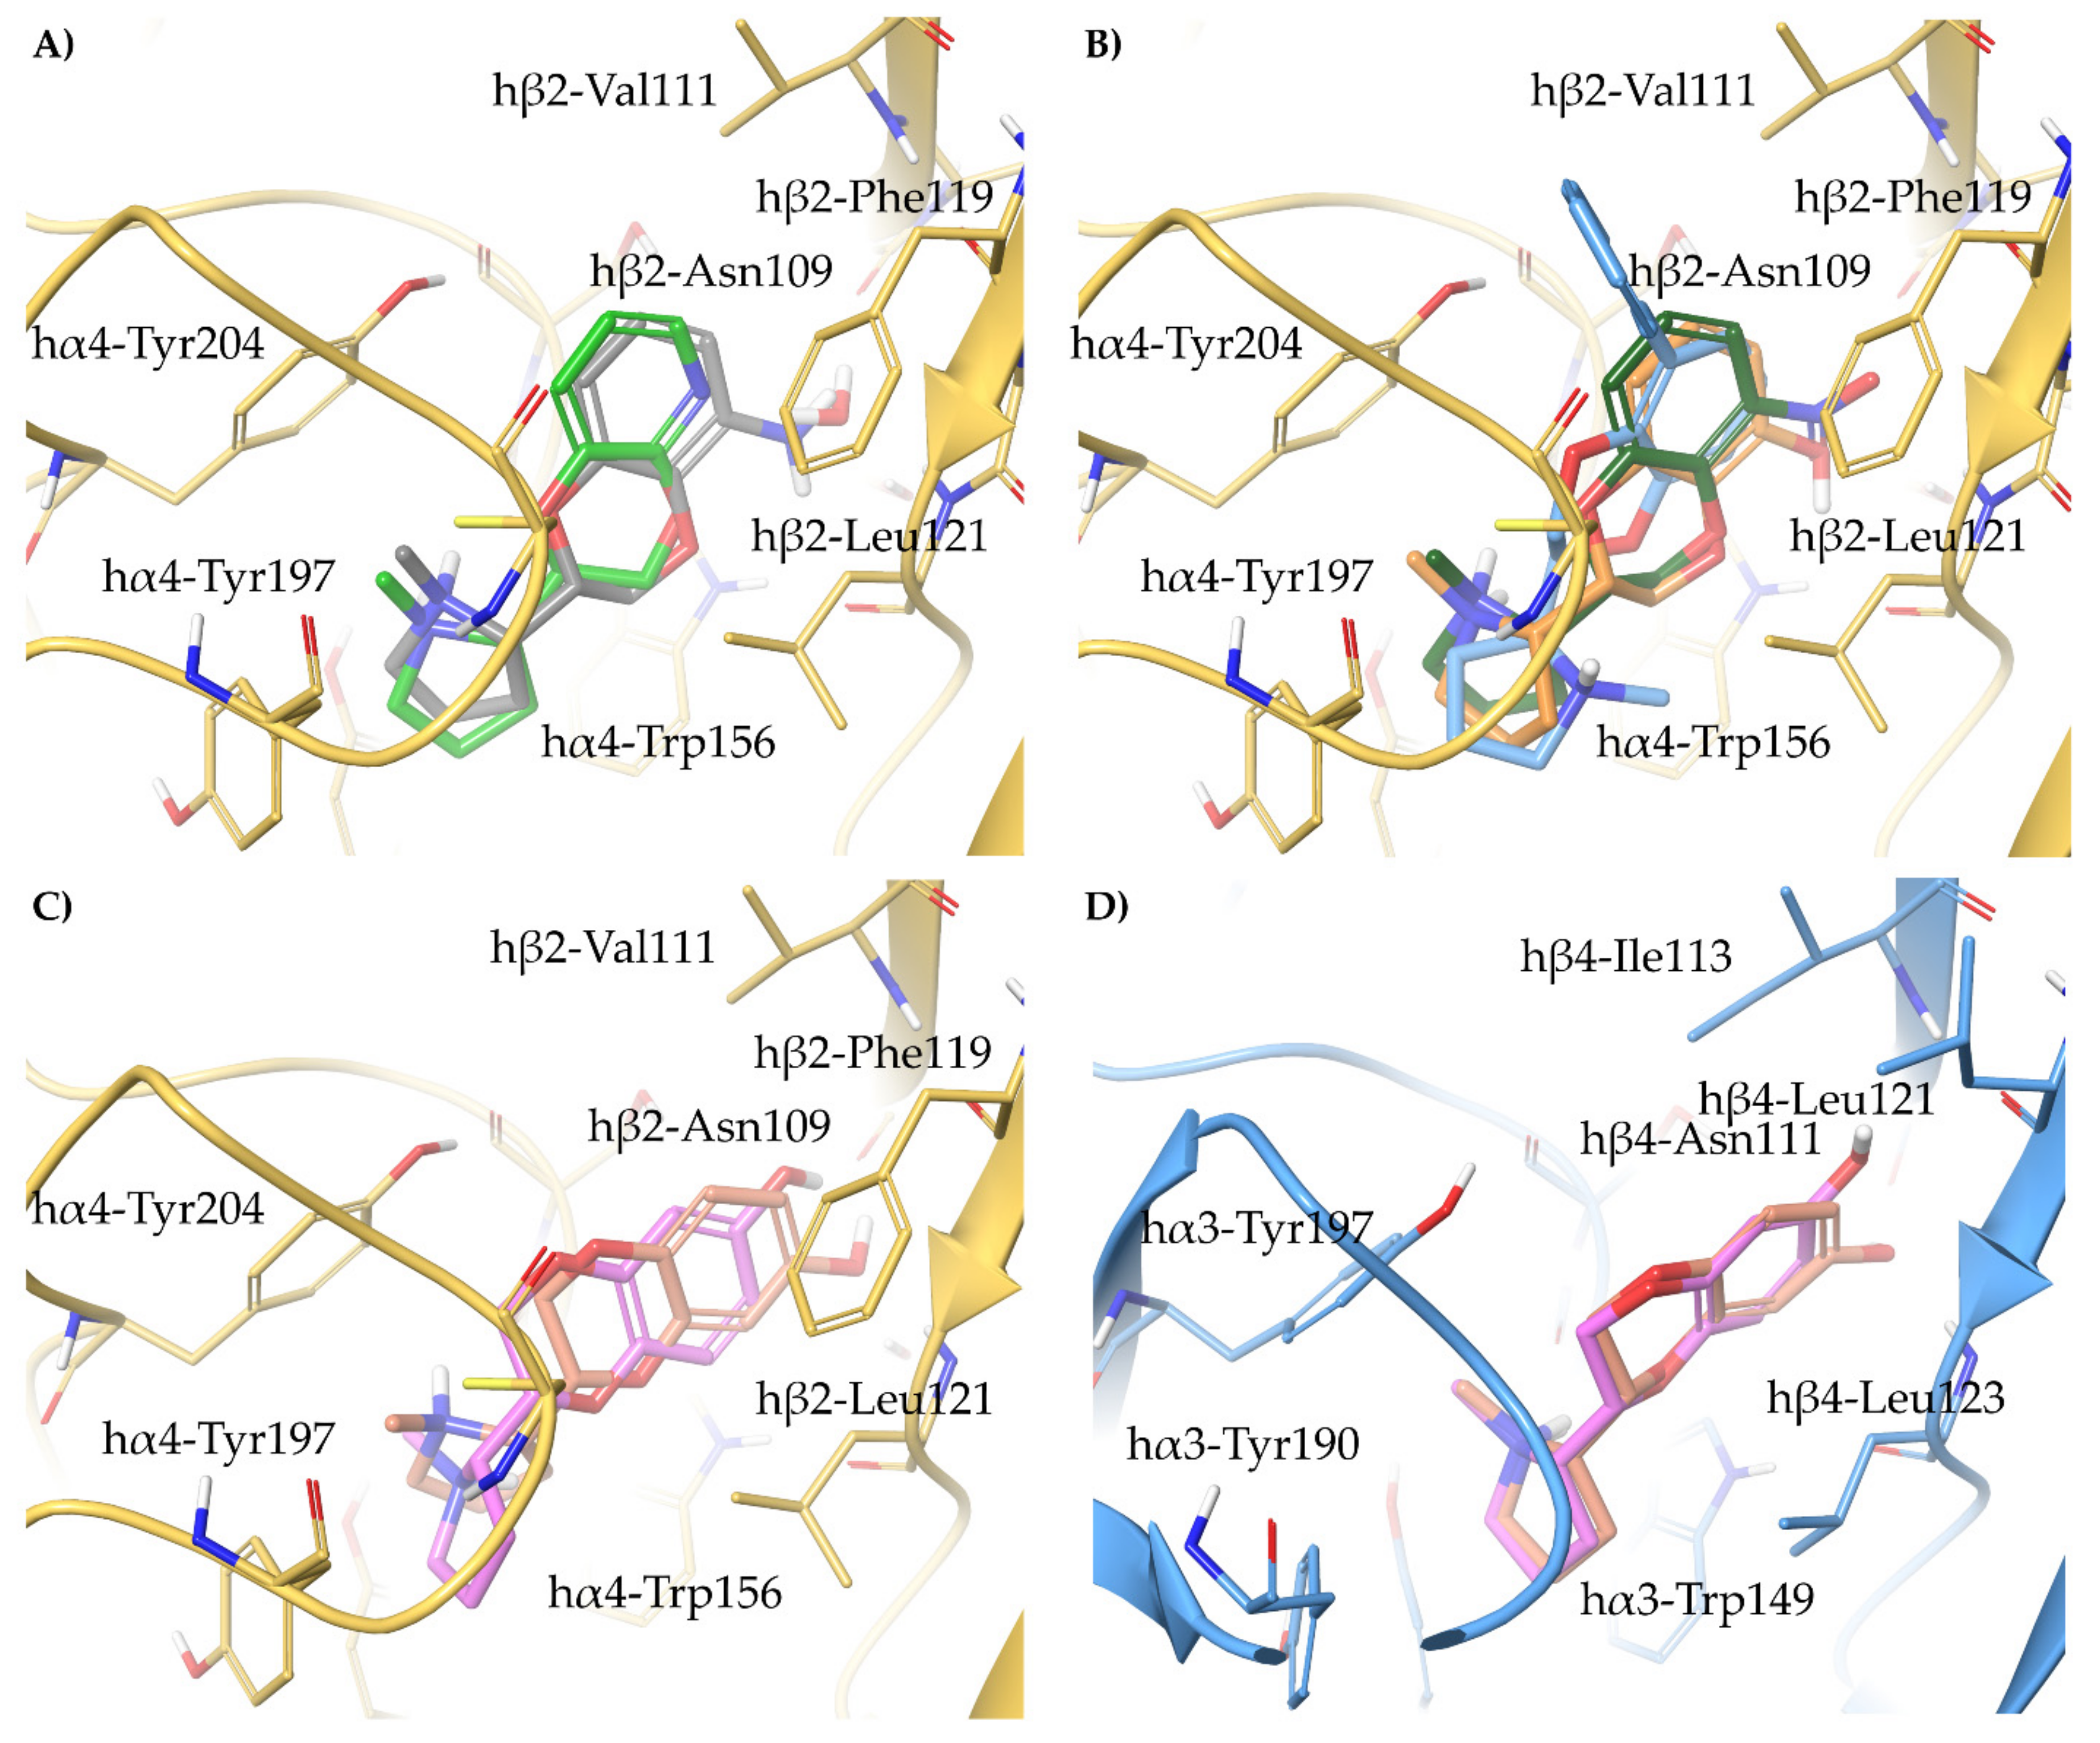
2.3. Binding Modes of the α4β2 Superagonist Hydroxy Pyridyl Ether of N-Methyl Prolinol (S)-7
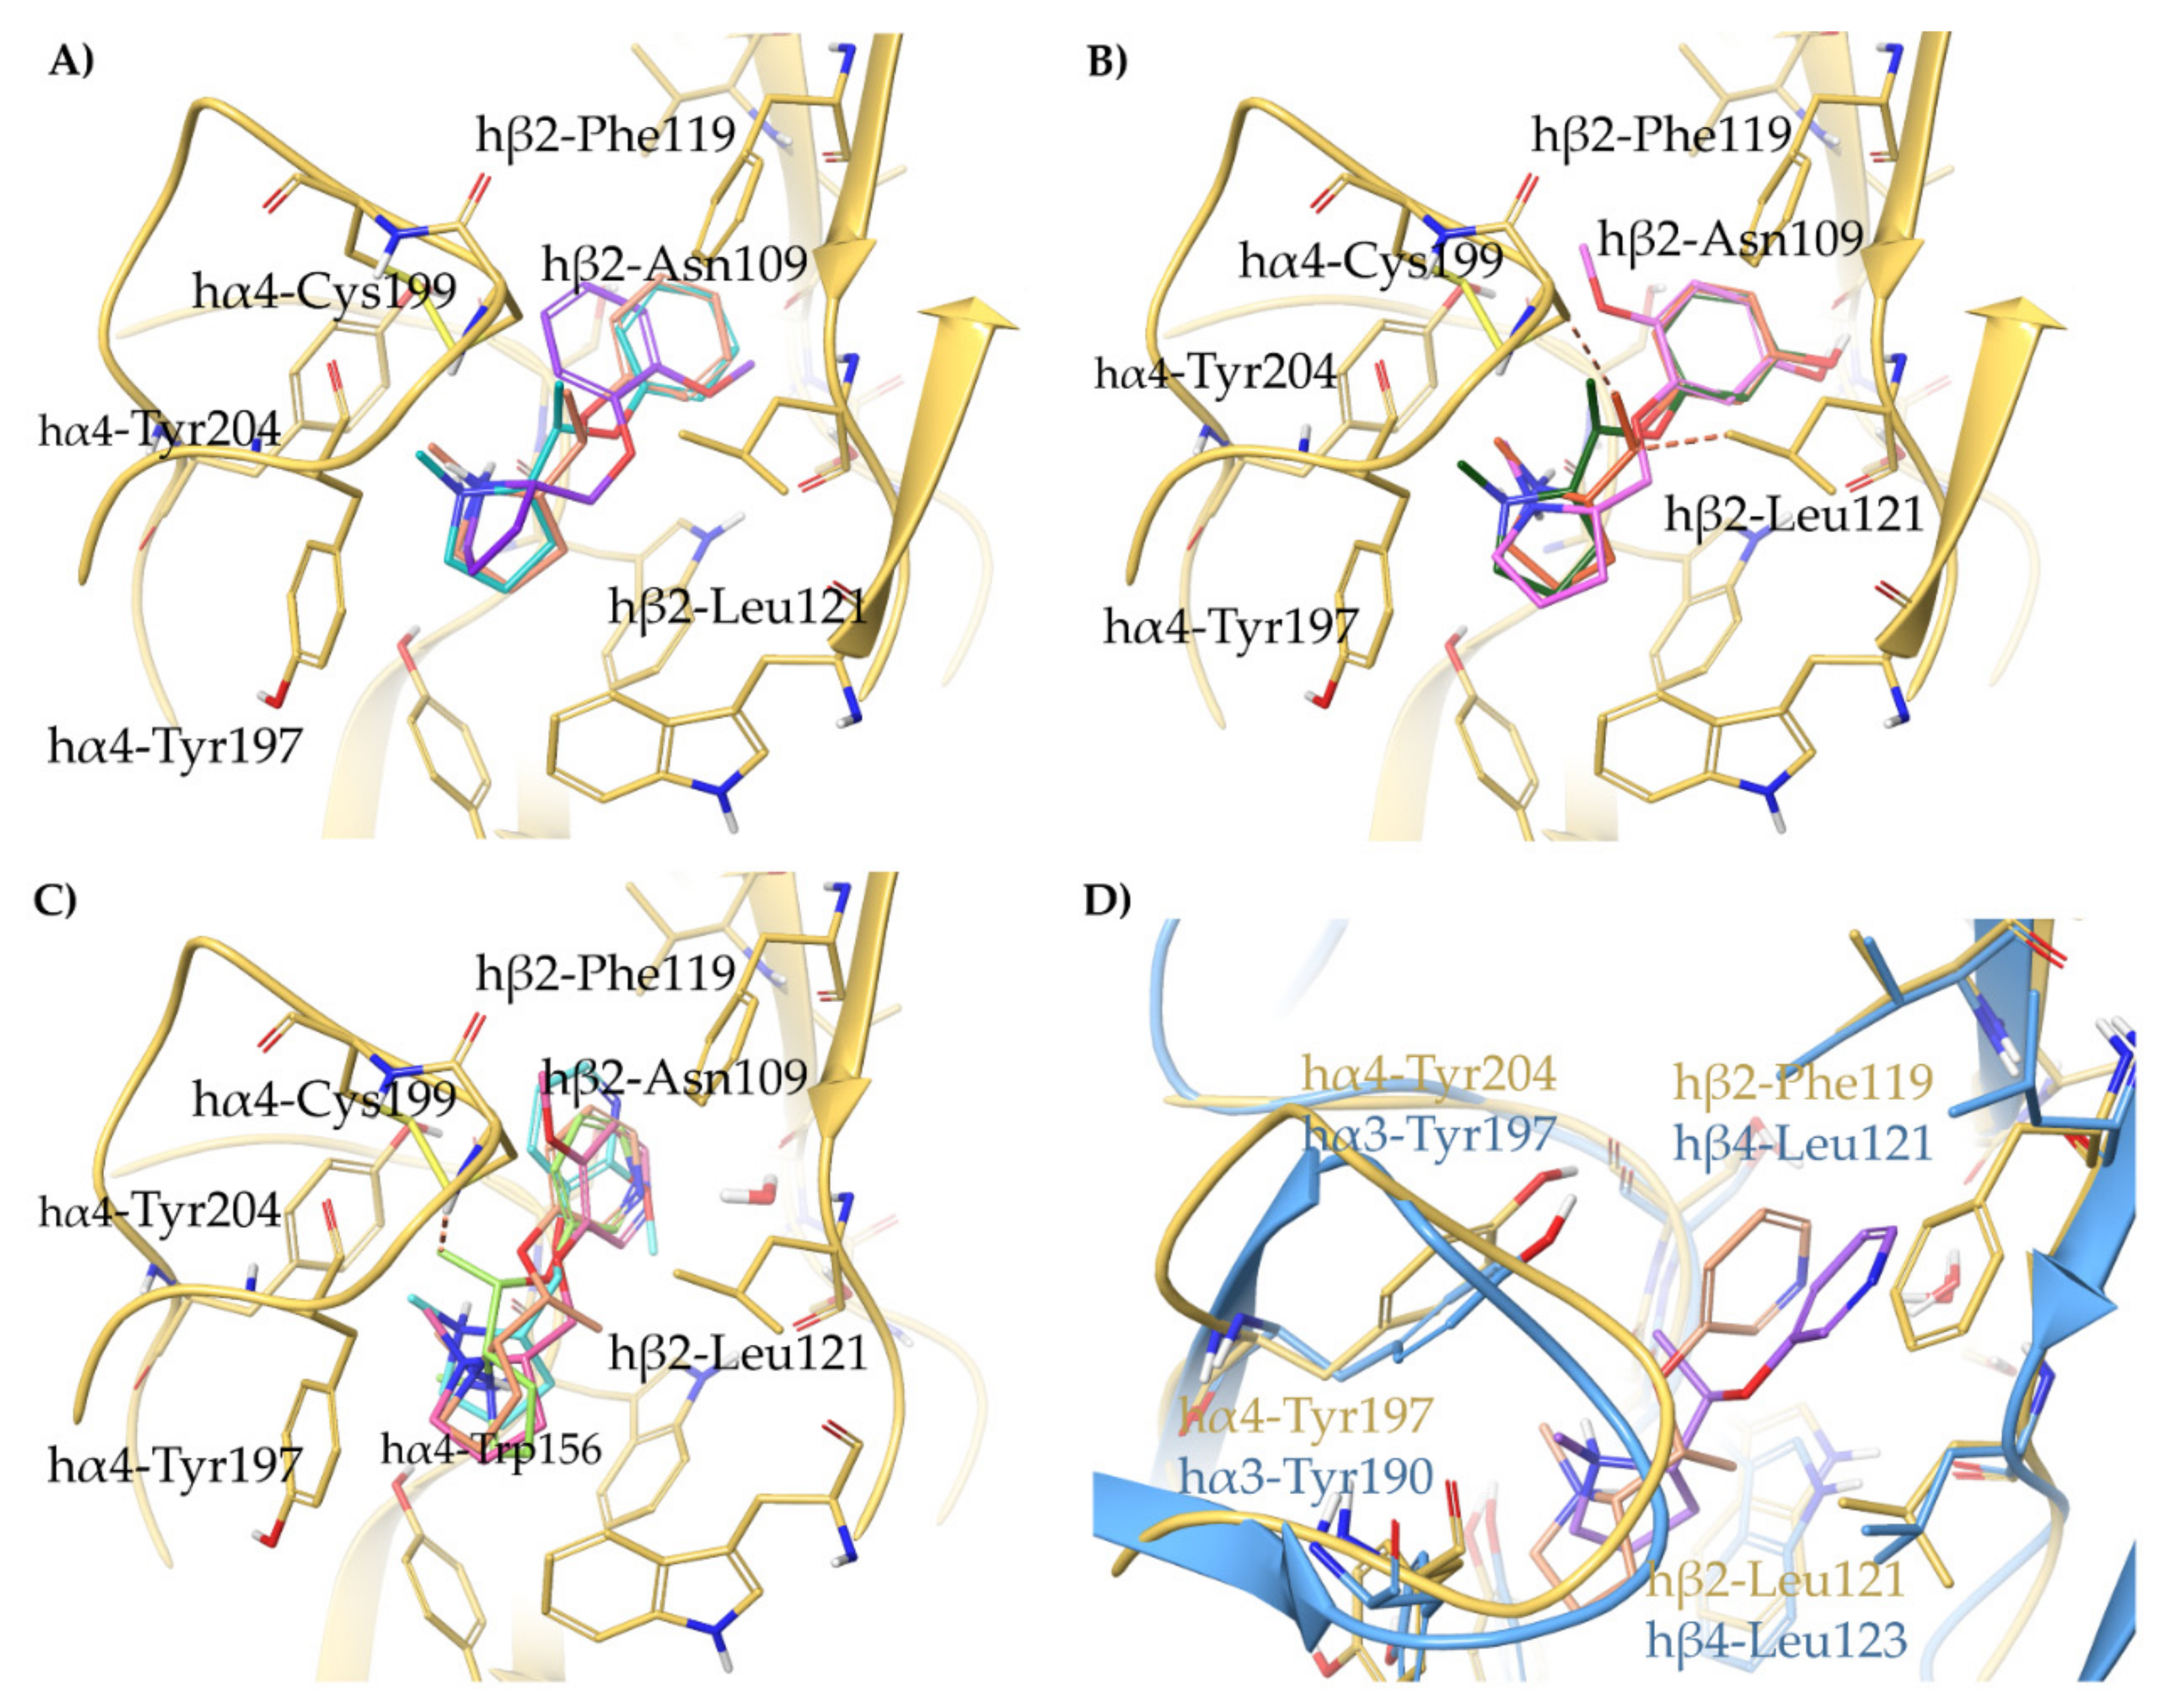
2.4. Semirigid Pyrrolidine-Based Nicotinic Ligands: Rationalization of Determinants for α4β2 nAChRs Affinity and for High α4β2 vs. α3β4 Selectivity of (S,R)-14
2.5. Structural Determinants for α4β2 nAChR Affinity and α4β2 vs. α3β4 Selectivity of 5-Substituted 3-Hydrophenyl Ethers of N-Methyl Prolinol
2.6. Structural Determinants for α4β2 nAChR Affinity and α4β2 vs. α3β4 Selectivity of 7-Substituted and Unsubstituted N-Methyl Pyrrolidinyl-Benzodioxanes
2.7. Structural Determinants for α4β2 nAChR Affinity and α4β2 vs. α3β4 Selectivity of N-Methylpyrrolidinyl Pyridodioxanes
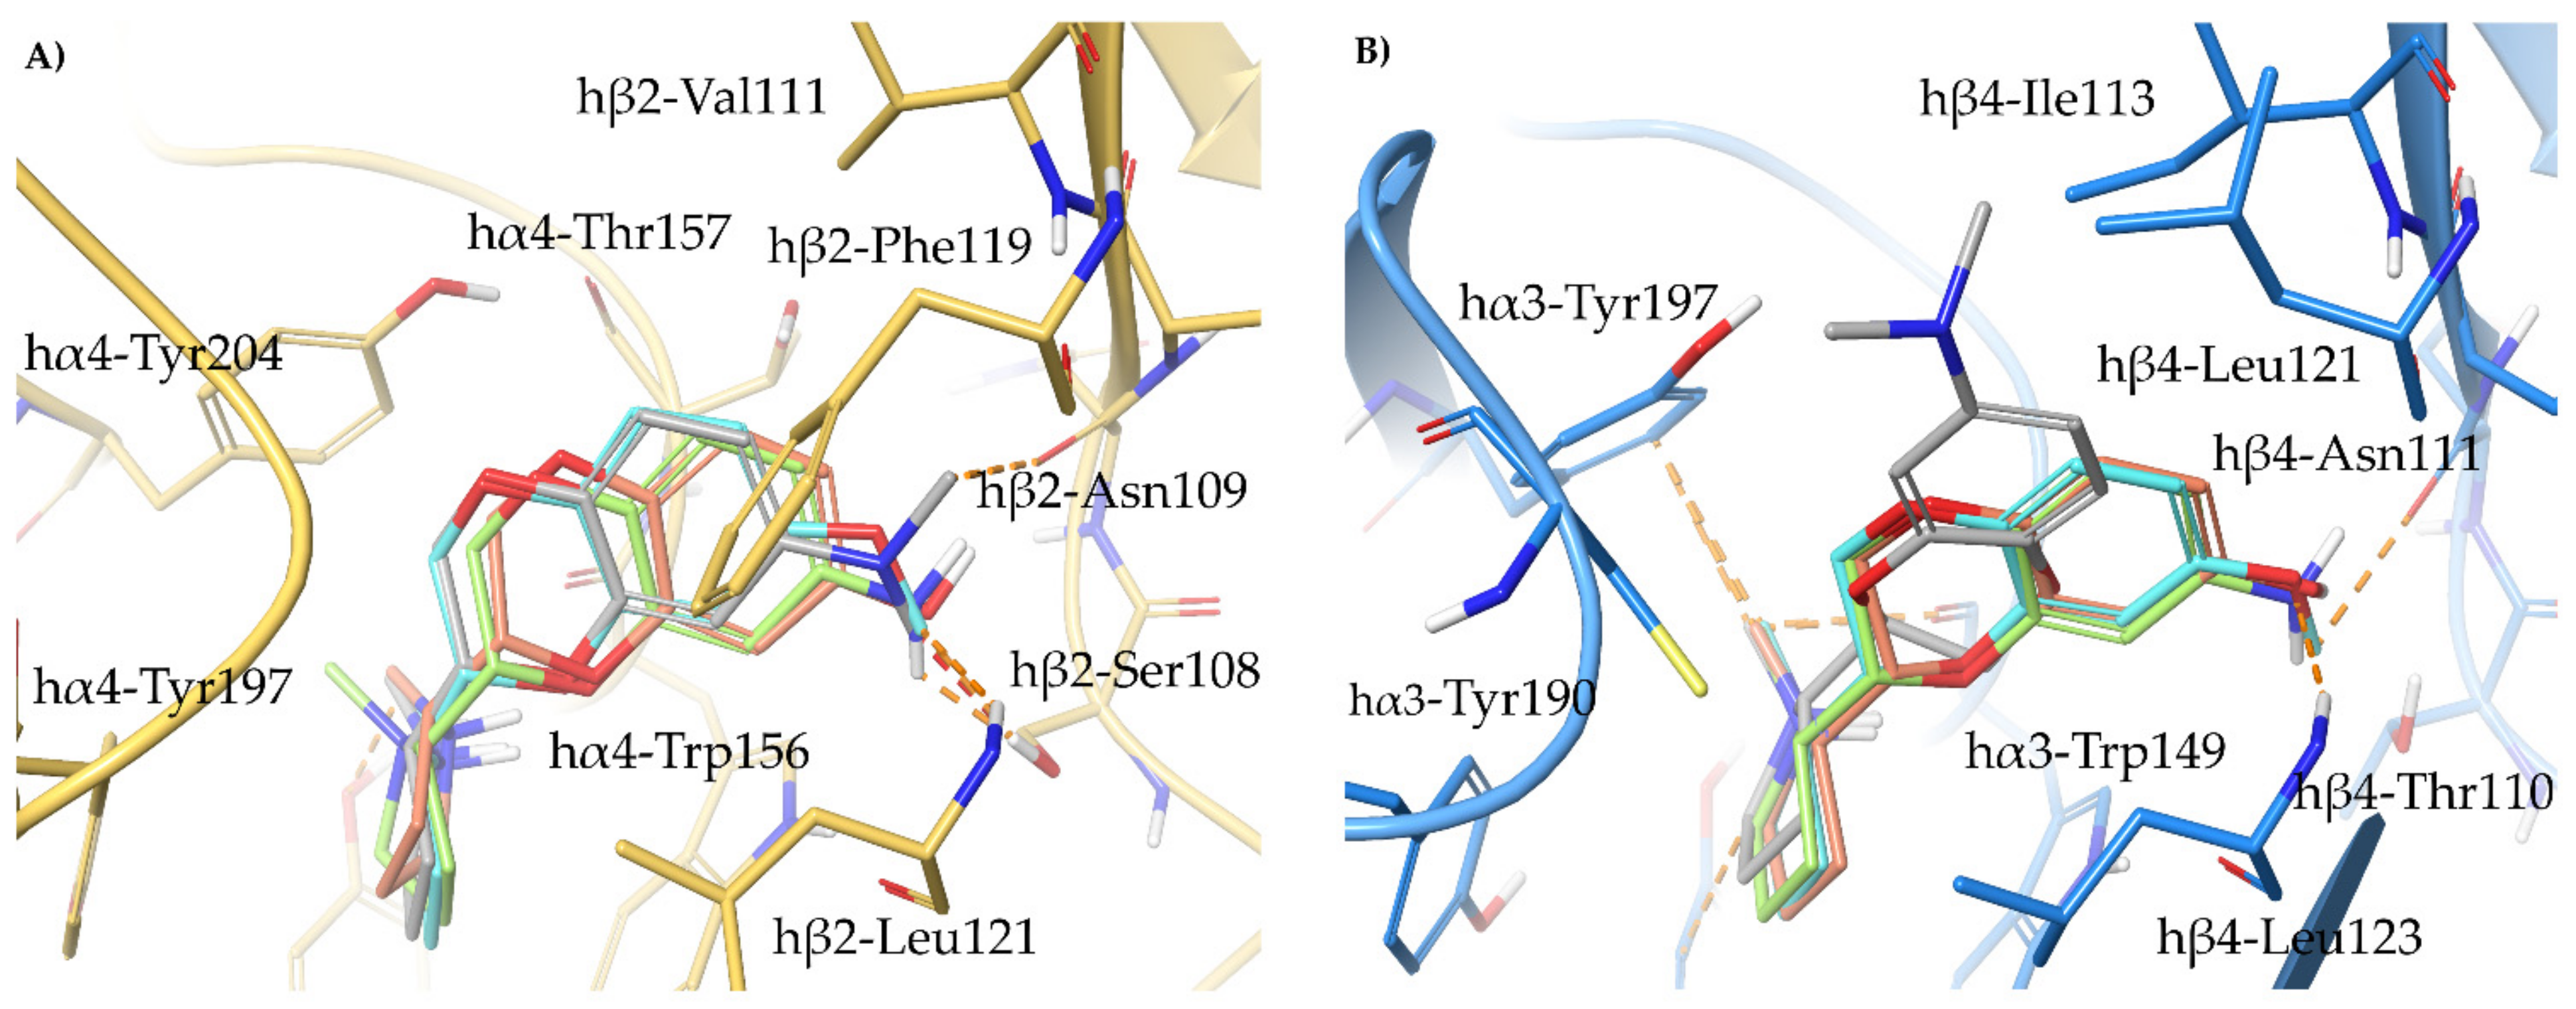
2.8. Structural Determinants for α4β2 nAChR Affinity and α4β2 vs. α3β4 Selectivity of 5- and 6-Substituted N-Methyl Pyrrolidinyl-Benzodioxanes
3. Materials and Methods
3.1. Ligand Preparation
3.2. Binding Site Preparation: Water-Containing and Water-Free hα4β2 and hα3β4 from cryo-EM Structures
3.3. Binding Site Preparation: Water-Containing and Water-Free hα4β2 and hα3β4 from IFD Complexes
3.4. Human/Rat Sequence Alignments
3.5. Binding Site Preparation: Rα3β4 by In Silico Site Directed Mutagenesis
3.6. Molecular Docking
3.6.1. Docking of A-84543, (S)-nicotine, AT-1001, and Compounds 2–43
3.6.2. Self-Docking Studies
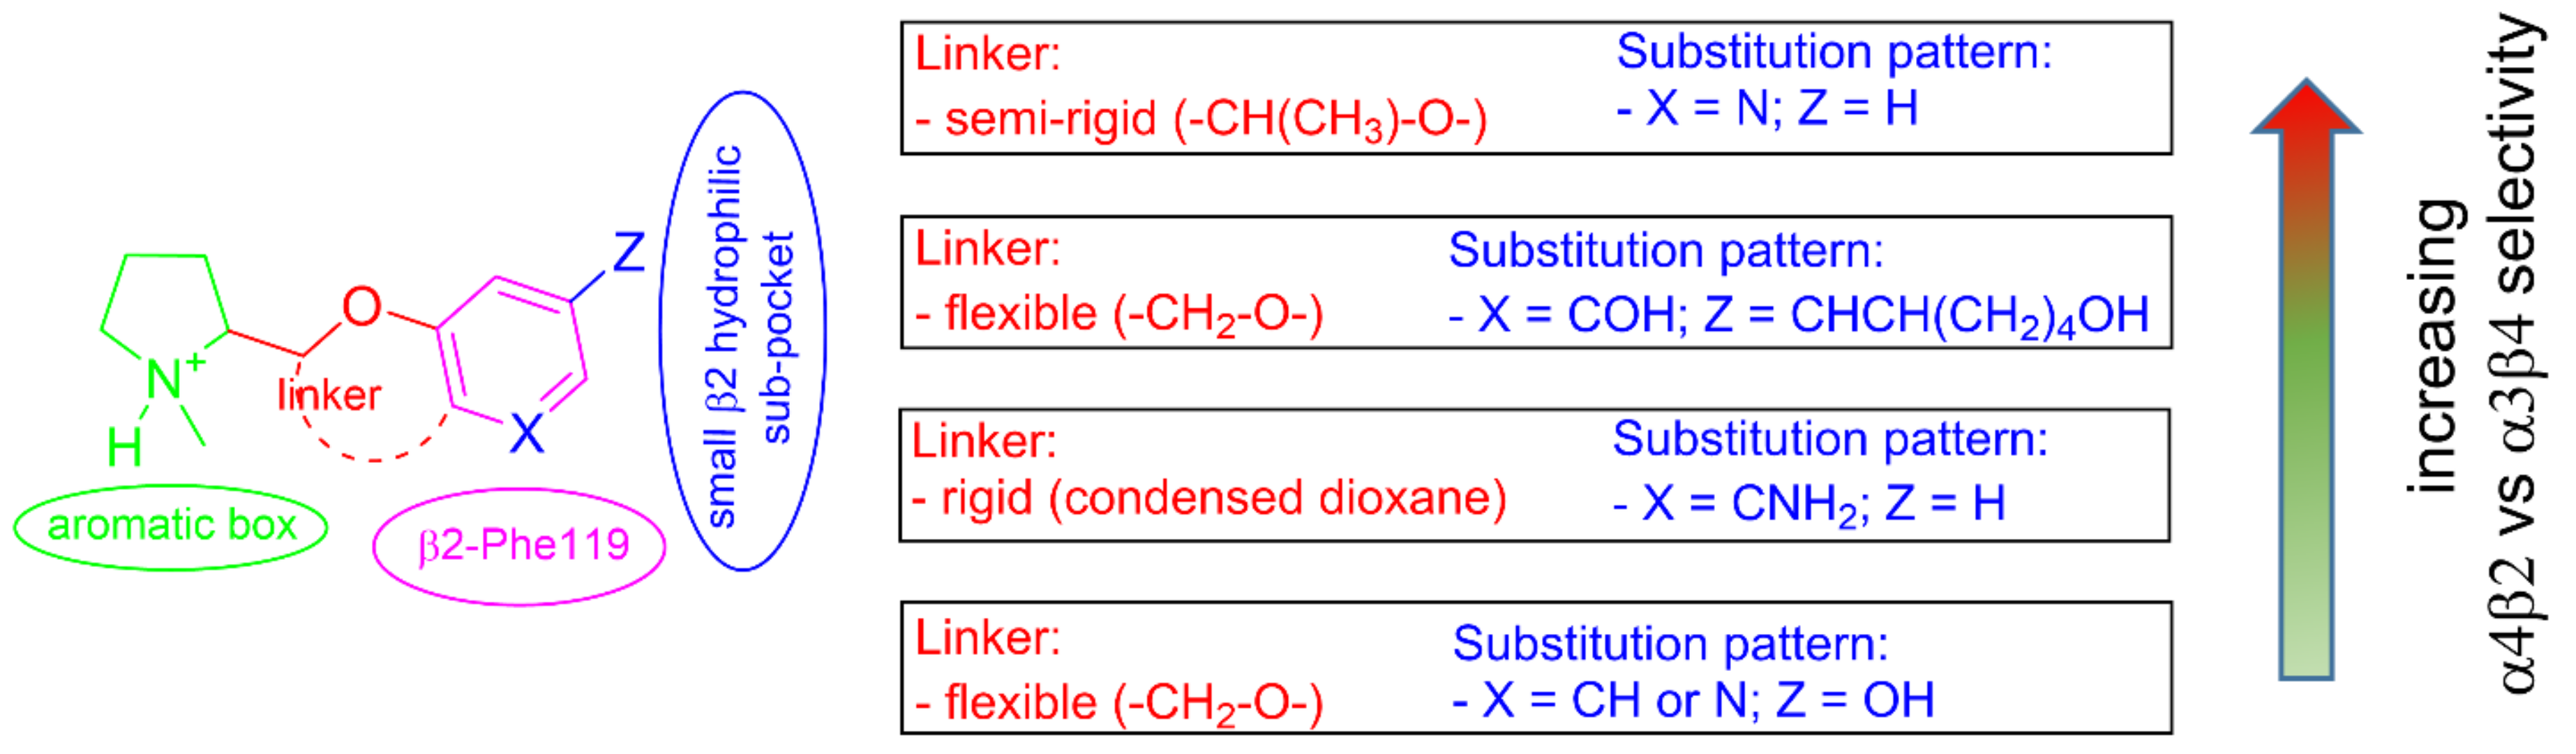
4. Conclusions
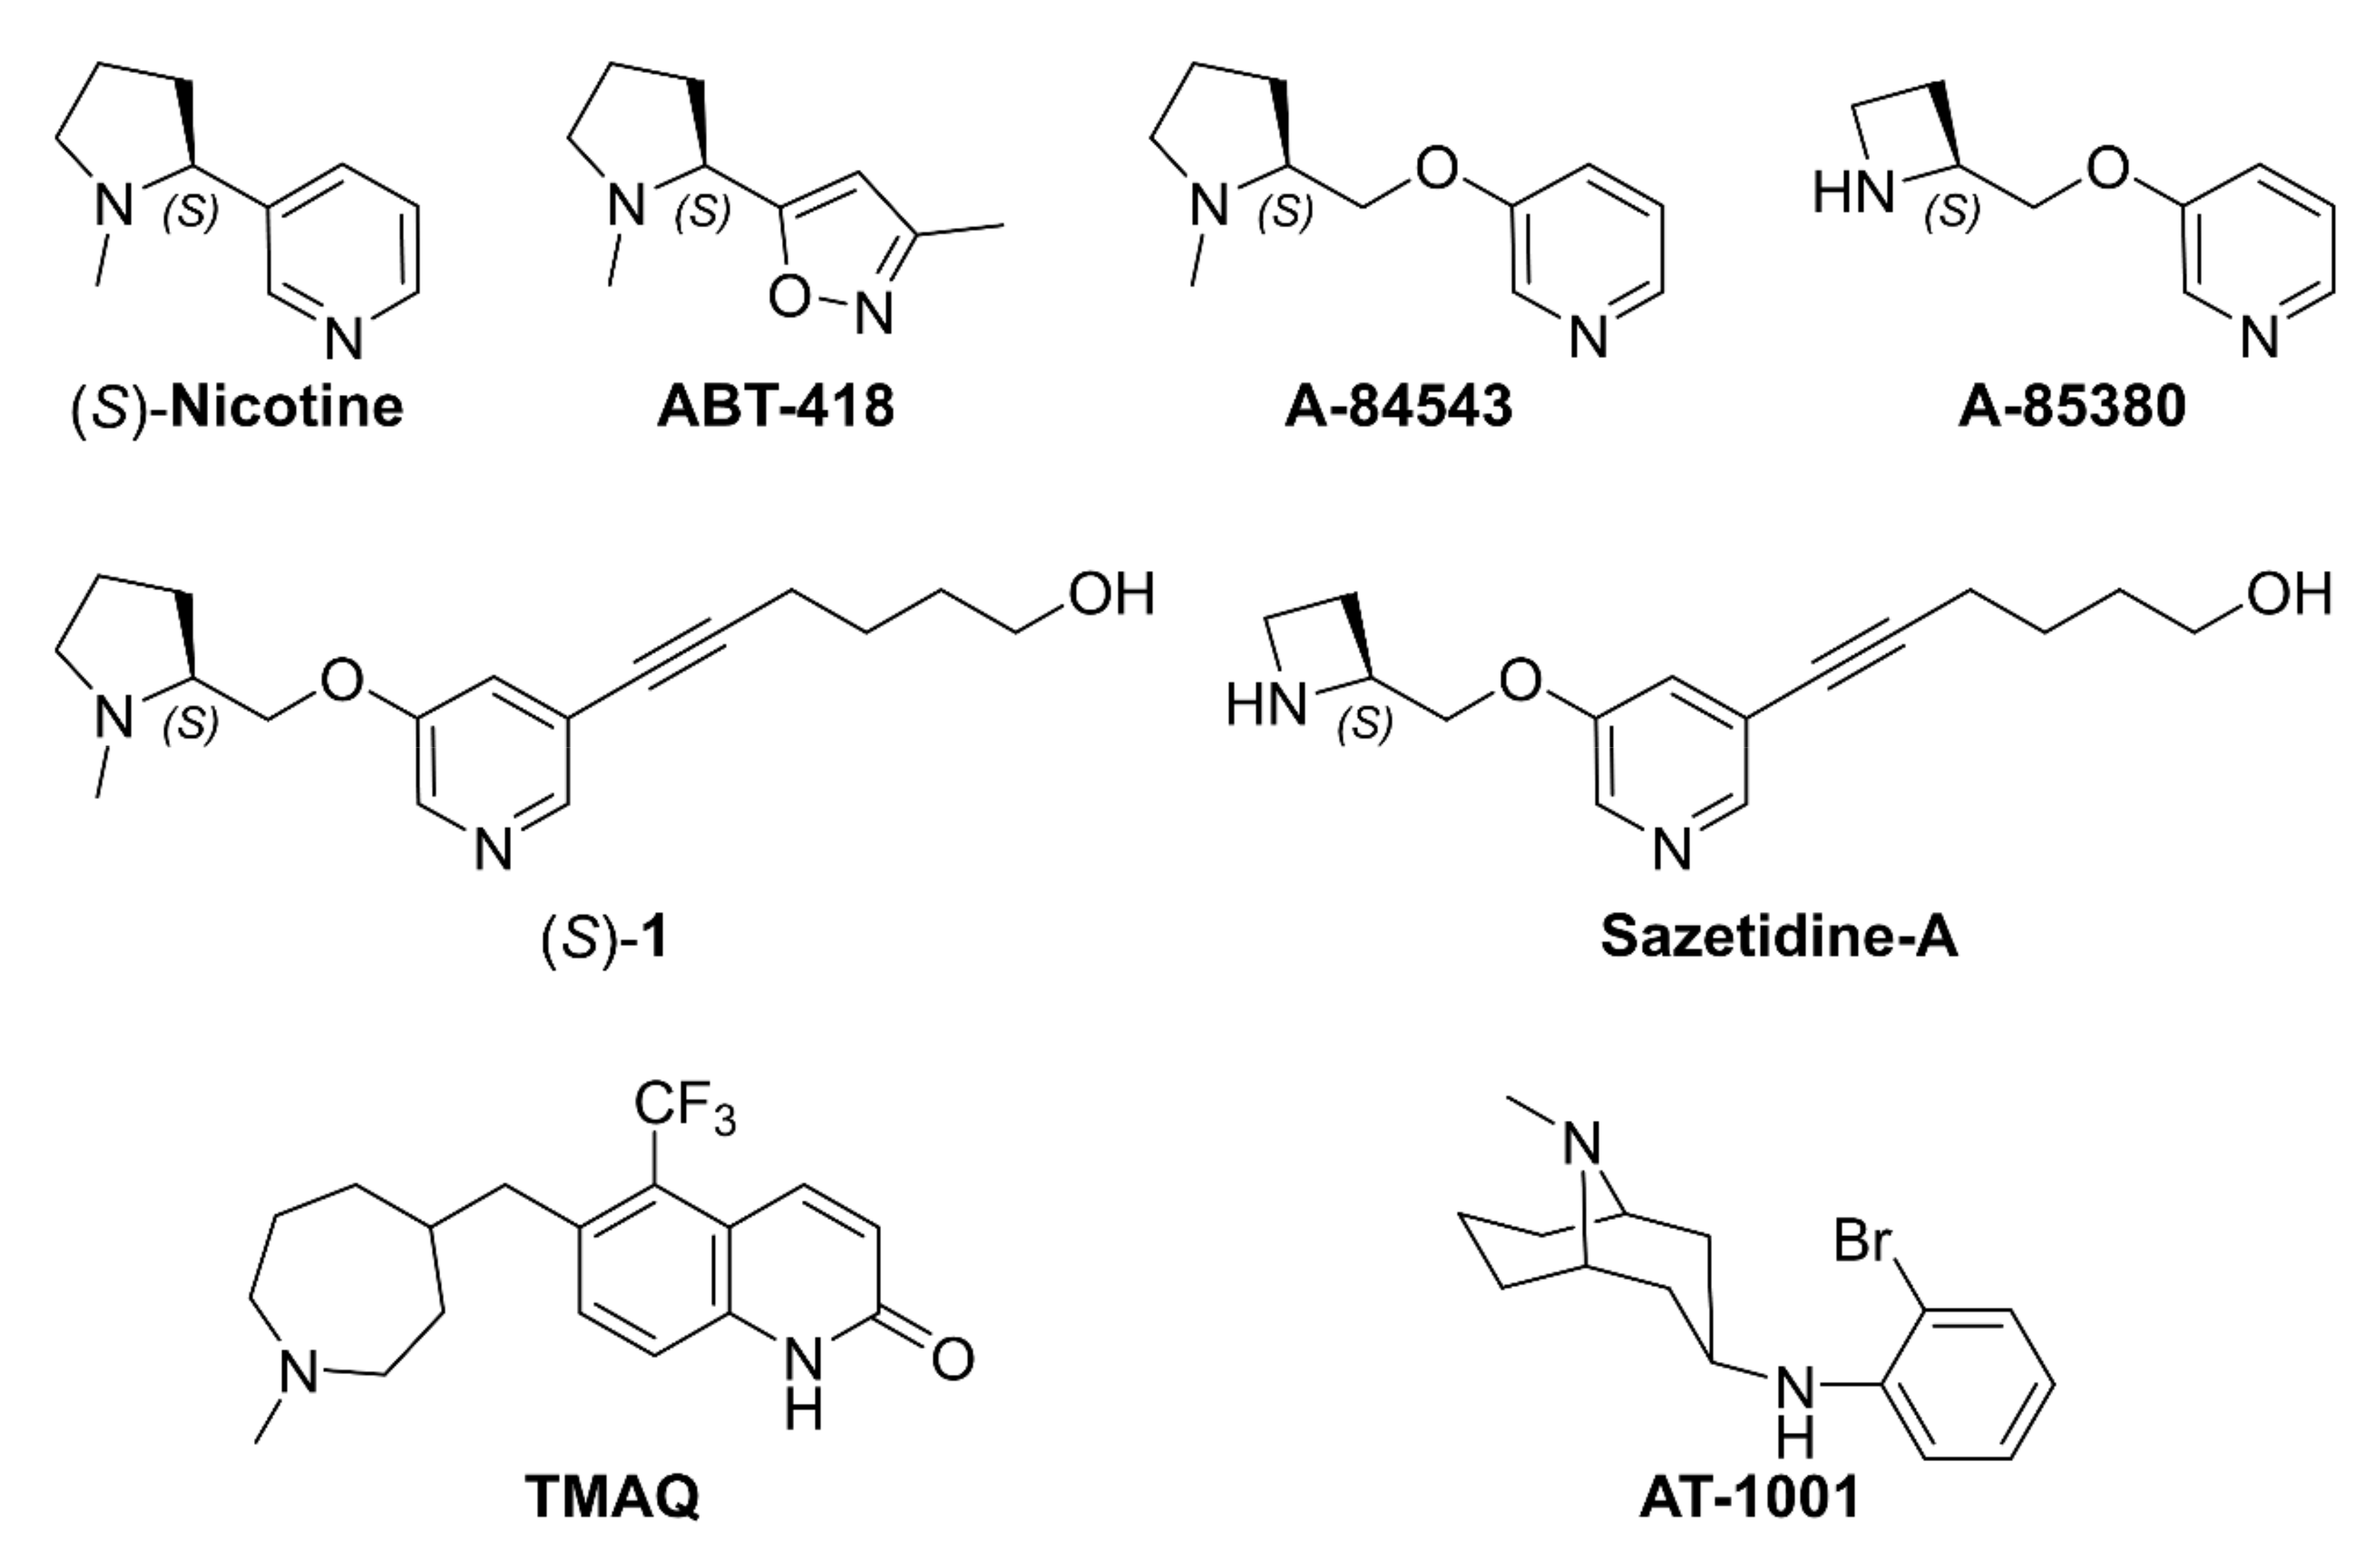
- A-84543 and (S)-nicotine interact with the so-called aromatic box through the pyrrolidine N+ in both subtypes and with β2-Phe119 through the pyridine ring. In the α3β4 binding site, due to the absence of phenylalanine in the β4 side, the pyridine of the flexible A-84543 “falls out” from the plane occupied in the α4β2 binding site whereas the nicotine pyridine maintains a substantially unchanged disposition. This is consistent with the high selectivity of A-84543 and the only moderate one of nicotine.
- The docking of the 3-hydroxy phenyl ether (S)-3 is very similar to that of (S)-nicotine: Overlap of the pyrrolidine rings, same interactions with the β2 hydrophilic sub-pocket through the m-OH rather than structural water and same minimal change of the disposition of the aromatic ring in the two subtypes. This is consistent with the only moderate selectivity displayed by both compounds.
- For the hydroxypyridyl ether (S)-7, α4β2 super-agonist with almost null α3β4 activity but with an affinity and selectivity profiles very similar to those of nicotine, a hydroxyphenyl ether-like extended pose without water-mediated interaction and an A-83543-like folded pose with pyridine nitrogen interacting with structural water can be assumed in both subtypes. Such a dualism could be correlated with the significantly different degree of selectivity, typical of this compound, in binding and functional tests.
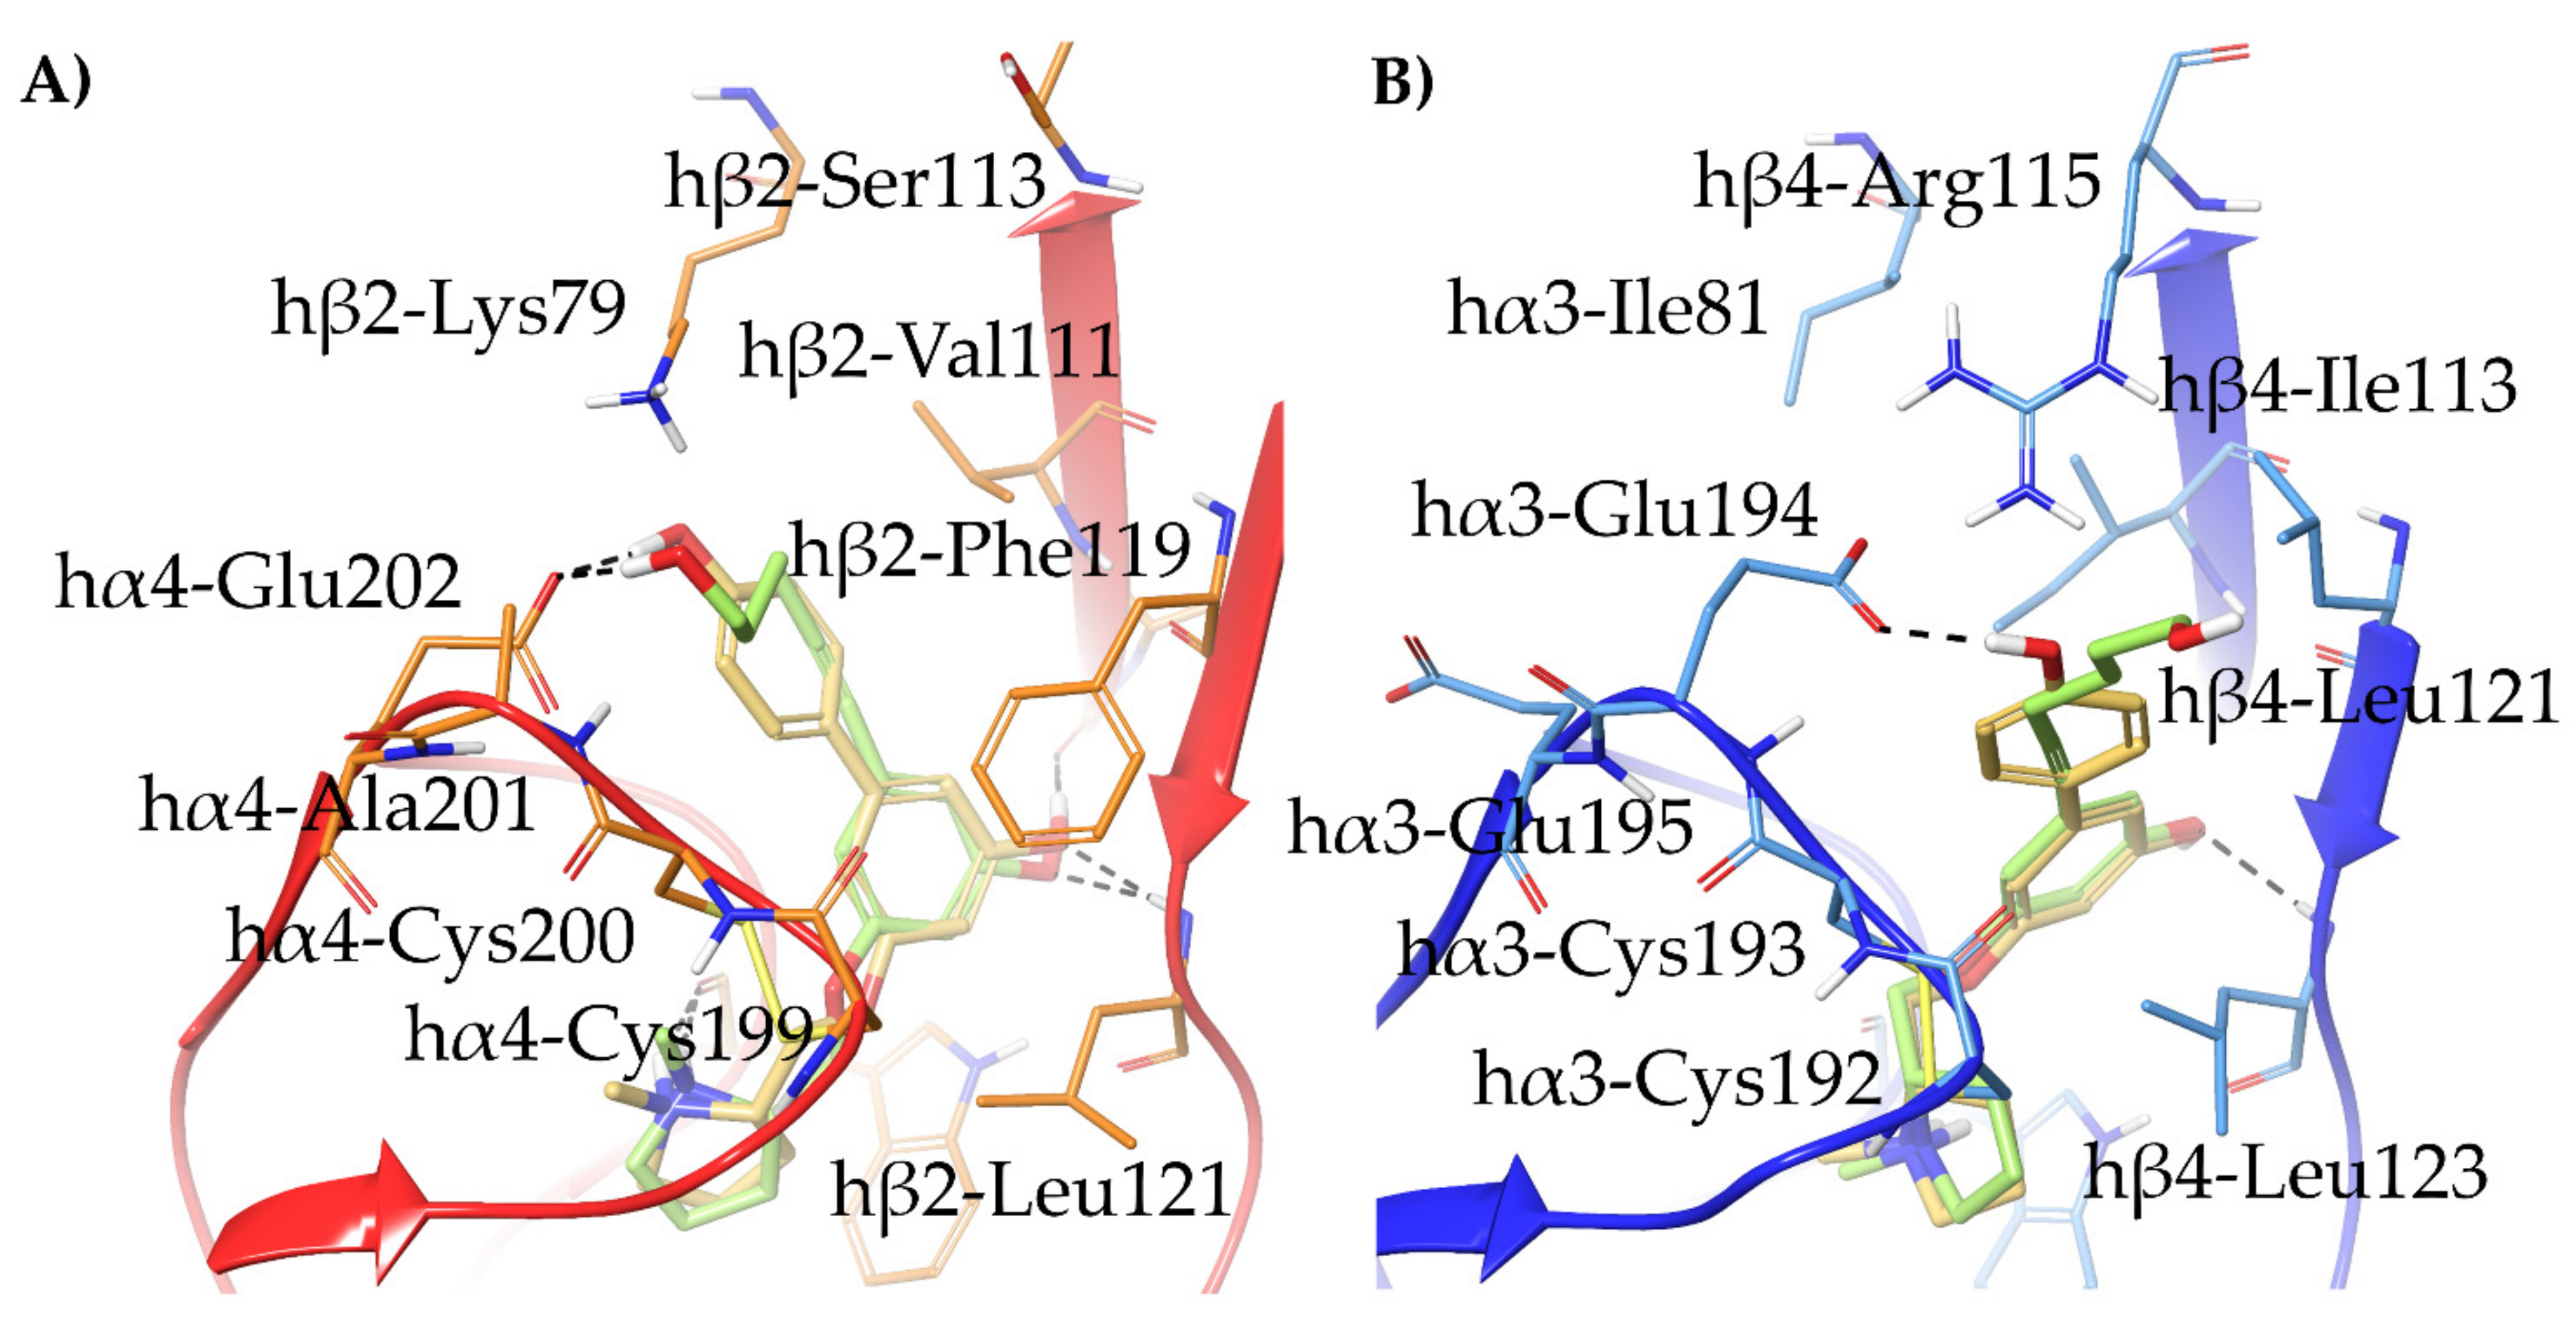
- The 3,5-disubstituted phenyl ethers show the conventional α4β2 interactions (N+-aromatic box, phenyl- β2-Phe119) and, in the case of the 3-hydroxy-5-(6-hydroxyhexinyl)phenyl ether (S)-15, an additional interaction of the chain’s terminal OH with an α4 glutamic acid residue. Such interaction with the corresponding identical α3 aminoacidic residue is lost in the α3β4 binding site. This is consistent with the high selectivity (131 times) of the above derivative.
- The (S,R) diastereomer of the pyrrolidinyl pyridodioxane with N in place of benzodioxane C(5)H ((S,R)-33) accommodates its N+ in the aromatic box of the α4β2 binding site and establishes a pyridine-β2-Phe119 interaction and a water-mediated interaction with the hydrophilic β2 sub-pocket through the pyridine nitrogen. These two interactions are lost when the molecule is docked into the α3β4 binding site. Such binding modes are conserved and favoured in (S,R)-14, where pyridodioxane deconstruction to α-methyl prolinol pyridyl ether corresponds to a significant increase in α4β2 affinity (410 nM → 27 nM) and selectivity (40 → 185 times).
- The high α4β2 affinity of 7-OH and 7-NH2 substituted pyrrolidinyl benzodioxanes (S,R)-2 and (S,R)-29 is traceable to that of the prolinol 3-hydroxyphenyl ether (S)-3, without involvement of structural water. On the other hand, the significantly lower or null selectivity could be ascribed to a less detrimental effect of Phe to Leu replacement for the rigid and extended benzodioxane scaffold compared with flexible aryloxymethyl residues.
- With opposite stereo-preference concerning the dioxane stereocenter, the 5-amino substitution at benzodioxane ((S,S)-37) maintains high α4β2 affinity thanks to the same productive interactions established by the above mentioned 7-substituted pyrrolidinyl benzodioxanes, but, notably, it does not confer the ability to interact with the wider β4 minus side resulting in high selectivity.
Supplementary Materials
Author Contributions
Funding
Institutional Review Board Statement
Informed Consent Statement
Data Availability Statement
Conflicts of Interest
Sample Availability
References
- Terry, A.V., Jr.; Callahan, P.M. Nicotinic acetylcholine receptor ligands, cognitive function, and preclinical approaches to drug discovery. Nicotine Tob. Res. 2018, 21, 383–394. [Google Scholar] [CrossRef]
- Yu, L.-F.; Zhang, H.-K.; Caldarone, B.J.; Eaton, J.B.; Lukas, R.J.; Kozikowski, A.P. Recent developments in novel antidepressants targeting α4β2-nicotinic acetylcholine receptors. J. Med. Chem. 2014, 57, 8204–8223. [Google Scholar] [CrossRef] [PubMed]
- Wang, J.; Lindstrom, J. Orthosteric and allosteric potentiation of heteromeric neuronal nicotinic acetylcholine receptors. Br. J. Pharmacol. 2018, 175, 1805–1821. [Google Scholar] [CrossRef] [PubMed]
- Rahman, S.; Engleman, E.A.; Bell, R.L. Nicotinic receptor modulation to treat alcohol and drug dependence. Front. Neurosci. 2015, 8, 426. [Google Scholar] [CrossRef]
- Bolchi, C.; Bavo, F.; Gotti, C.; Fumagalli, L.; Fasoli, F.; Binda, M.; Mucchietto, V.; Sciaccaluga, M.; Plutino, S.; Fucile, S.; et al. From pyrrolidinyl-benzodioxane to pyrrolidinyl-pyridodioxanes, or from unselective antagonism to selective partial agonism at α4β2 nicotinic acetylcholine receptor. Eur. J. Med. Chem. 2017, 125, 1132–1144. [Google Scholar] [CrossRef]
- Rego Campello, H.; Del Villar, S.G.; Honraedt, A.; Minguez, T.; Oliveira, A.S.F.; Ranaghan, K.E.; Shoemark, D.K.; Bermudez, I.; Gotti, C.; Sessions, R.B.; et al. Unlocking nicotinic selectivity via direct C‒H functionalization of (−)-cytisine. Chem 2018, 4, 1710–1725. [Google Scholar] [CrossRef]
- Bolchi, C.; Bavo, F.; Fumagalli, L.; Gotti, C.; Fasoli, F.; Moretti, M.; Pallavicini, M. Novel 5-substituted 3-hydroxyphenyl and 3-nitrophenyl ethers of S-prolinol as α4β2-nicotinic acetylcholine receptor ligands. Bioorg. Med. Chem. Lett. 2016, 26, 5613–5617. [Google Scholar] [CrossRef]
- Bavo, F.; Pucci, S.; Fasoli, F.; Lammi, C.; Moretti, M.; Mucchietto, V.; Lattuada, D.; Viani, P.; De Palma, C.; Budriesi, R.; et al. Potent antiglioblastoma agents by hybridizing the onium-alkyloxy-stilbene based structures of an α7-nAChR, α9-nAChR antagonist and of a pro-oxidant mitocan. J. Med. Chem. 2018, 61, 10531–10544. [Google Scholar] [CrossRef] [PubMed]
- Walsh, R.M.; Roh, S.-H.; Gharpure, A.; Morales-Perez, C.L.; Teng, J.; Hibbs, R.E. Structural principles of distinct assemblies of the human α4β2 nicotinic receptor. Nature 2018, 557, 261–265. [Google Scholar] [CrossRef]
- Gharpure, A.; Teng, J.; Zhuang, Y.; Noviello, C.M.; Walsh, R.M., Jr.; Cabuco, R.; Howard, R.J.; Zaveri, N.T.; Lindahl, E.; Hibbs, R.E. Agonist selectivity and ion permeation in the α3β4 ganglionic nicotinic receptor. Neuron 2019, 104, 501–511. [Google Scholar] [CrossRef]
- Flores, C.M.; DeCamp, R.M.; Kilo, S.; Rogers, S.W.; Hargreaves, K.M. Neuronal nicotinic receptor expression in sensory neurons of the rat trigeminal ganglion: Demonstration of α3β4, a novel subtype in the mammalian nervous system. J. Neurosci. 1996, 16, 7892–7901. [Google Scholar] [CrossRef] [PubMed]
- McBride, P.E. The health consequences of smoking: Cardiovascular diseases. Med. Clin. N. Am. 1992, 76, 333–353. [Google Scholar] [CrossRef]
- Stolerman, I.P.; Garcha, H.S.; Mirza, N.R. Dissociations between the locomotor stimulant and depressant effects of nicotinic agonists in rats. Psychopharmacology 1995, 117, 430–437. [Google Scholar] [CrossRef]
- Antolin-Fontes, B.; Ables, J.L.; Görlich, A.; Ibañez-Tallon, I. The habenulo-interpeduncular pathway in nicotine aversion and withdrawal. Neuropharmacology 2015, 96, 213–222. [Google Scholar] [CrossRef]
- Jackson, K.J.; Muldoon, P.P.; De Biasi, M.; Damaj, M.I. New mechanisms and perspectives in nicotine withdrawal. Neuropharmacology 2015, 96, 223–234. [Google Scholar] [CrossRef]
- Saladino, A.C.; Xu, Y.; Tang, P. Homology Modeling and Molecular Dynamics Simulations of Transmembrane Domain Structure of Human Neuronal Nicotinic Acetylcholine Receptor. Biophys. J. 2005, 88, 1009–1017. [Google Scholar] [CrossRef]
- Pedretti, A.; Marconi, C.; Bolchi, C.; Fumagalli, L.; Ferrara, R.; Pallavicini, M.; Valoti, E.; Vistoli, G. Modelling of full-length human α4β2 nicotinic receptor by fragmental approach and analysis of its binding modes. Biochem. Biophys. Res. Commun. 2008, 369, 648–653. [Google Scholar] [CrossRef] [PubMed]
- Morales-Perez, C.L.; Noviello, C.M.; Hibbs, R.E. X-ray structure of the human α4β2 nicotinic receptor. Nature 2016, 538, 411–415. [Google Scholar] [CrossRef] [PubMed]
- Harpsøe, K.; Hald, H.; Timmermann, D.B.; Jensen, M.L.; Dyhring, T.; Nielsen, E.Ø.; Peters, D.; Balle, T.; Gajhede, M.; Kastrup, J.S.; et al. Molecular Determinants of Subtype-selective Efficacies of Cytisine and the Novel Compound NS3861 at Heteromeric Nicotinic Acetylcholine Receptors. J. Biol. Chem. 2013, 288, 2559–2570. [Google Scholar] [CrossRef]
- Blum, A.P.; Lester, H.A.; Dougherty, D.A. Nicotinic pharmacophore: The pyridine N of nicotine and carbonyl of acetylcholine hydrogen bond across a subunit interface to a backbone NH. Proc. Natl. Acad. Sci. USA 2010, 107, 13206–13211. [Google Scholar] [CrossRef] [PubMed]
- Celie, P.H.N.; van Rossum-Fikkert, S.E.; van Dijk, W.J.; Brejc, K.; Smit, A.B.; Sixma, T.K. Nicotine and carbamylcholine binding to nicotinic acetylcholine receptors as studied in AChBP crystal structures. Neuron 2004, 41, 907–914. [Google Scholar] [CrossRef]
- Braida, D.; Ponzoni, L.; Moretti, M.; Viani, P.; Pallavicini, M.; Bolchi, C.; Appiani, R.; Bavo, F.; Gotti, C.; Sala, M. Behavioural and pharmacological profiles of zebrafish administrated pyrrolidinyl benzodioxanes and prolinol aryl ethers with high affinity for heteromeric nicotinic acetylcholine receptors. Psychopharmacology 2020, 237, 2317–2326. [Google Scholar] [CrossRef]
- Pallavicini, M.; Moroni, B.; Bolchi, C.; Cilia, A.; Clementi, F.; Fumagalli, L.; Gotti, C.; Meneghetti, F.; Riganti, L.; Vistoli, G.; et al. Synthesis and α4β2 nicotinic affinity of unichiral 5-(2-pyrrolidinyl) oxazolidinones and 2-(2-pyrrolidinyl) benzodioxanes. Bioorg. Med. Chem. Lett. 2006, 16, 5610–5615. [Google Scholar] [CrossRef] [PubMed]
- Pallavicini, M.; Bolchi, C.; Binda, M.; Cilia, A.; Clementi, F.; Ferrara, R.; Fumagalli, L.; Gotti, C.; Moretti, M.; Pedretti, A.; et al. 5-(2-Pyrrolidinyl) oxazolidinones and 2-(2-pyrrolidinyl) benzodioxanes: Synthesis of all the stereoisomers and α4β2 nicotinic affinity. Bioorg. Med. Chem. Lett. 2009, 19, 854–859. [Google Scholar] [CrossRef]
- Bolchi, C.; Bavo, F.; Appiani, R.; Roda, G.; Pallavicini, M. 1,4-Benzodioxane, an evergreen, versatile scaffold in medicinal chemistry: A review of its recent applications in drug design. Eur. J. Med. Chem. 2020, 200, 112419. [Google Scholar] [CrossRef] [PubMed]
- Straniero, V.; Pallavicini, M.; Chiodini, G.; Ruggeri, P.; Fumagalli, L.; Bolchi, C.; Corsini, A.; Ferri, N.; Ricci, C.; Valoti, E. Farnesyltransferase inhibitors: CAAX mimetics based on different biaryl scaffolds. Bioorg. Med. Chem. Lett. 2014, 24, 2924–2927. [Google Scholar] [CrossRef]
- Straniero, V.; Pallavicini, M.; Chiodini, G.; Zanotto, C.; Volontè, L.; Radaelli, A.; Bolchi, C.; Fumagalli, L.; Sanguinetti, M.; Menchinelli, G.; et al. 3-(Benzodioxan-2-ylmethoxy)-2,6-difluorobenzamides bearing hydrophobic substituents at the 7-position of the benzodioxane nucleus potently inhibit methicillin-resistant Sa and Mtb cell division. Eur. J. Med. Chem. 2016, 120, 227–243. [Google Scholar] [CrossRef]
- Fumagalli, L.; Pallavicini, M.; Budriesi, R.; Gobbi, M.; Straniero, V.; Zagami, M.; Chiodini, G.; Bolchi, C.; Chiarini, A.; Micucci, M.; et al. Affinity and activity profiling of unichiral 8-substituted 1,4-benzodioxane analogues of WB4101 reveals a potent and selective α1B-adrenoceptor antagonist. Eur. J. Med. Chem. 2012, 58, 184–191. [Google Scholar] [CrossRef]
- Bolchi, C.; Valoti, E.; Straniero, V.; Ruggeri, P.; Pallavicini, M. From 2-aminomethyl-1,4-benzodioxane enantiomers to unichiral 2-cyano- and 2-carbonyl-substituted benzodioxanes via dichloroamine. J. Org. Chem. 2014, 79, 6732–6737. [Google Scholar] [CrossRef]
- Abreo, M.A.; Lin, N.-H.; Garvey, D.S.; Gunn, D.E.; Hettinger, A.-M.; Wasicak, J.T.; Pavlik, P.A.; Martin, Y.C.; Donnelly-Roberts, D.L.; Anderson, D.J.; et al. Novel 3-pyridyl ethers with subnanomolar affinity for central neuronal nicotinic acetylcholine receptors. J. Med. Chem. 1996, 39, 817–825. [Google Scholar] [CrossRef]
- Bolchi, C.; Gotti, C.; Binda, M.; Fumagalli, L.; Pucci, L.; Pistillo, F.; Vistoli, G.; Valoti, E.; Pallavicini, M. Unichiral 2-(2’-pyrrolidinyl)-1,4-benzodioxanes: The 2R,2’S diastereomer of the N-methyl-7-hydroxy analogue is a potent α4β2- and α6β2-nicotinic acetylcholine receptor partial agonist. J. Med. Chem. 2011, 54, 7588–7601. [Google Scholar] [CrossRef]
- Bolchi, C.; Valoti, E.; Gotti, C.; Fasoli, F.; Ruggeri, P.; Fumagalli, L.; Binda, M.; Mucchietto, V.; Sciaccaluga, M.; Budriesi, R.; et al. Chemistry and pharmacology of a series of unichiral analogues of 2-(2-pyrrolidinyl)-1,4-benzodioxane, prolinol phenyl ether, and prolinol 3-pyridyl ether designed as α4β2-nicotinic acetylcholine receptor agonists. J. Med. Chem. 2015, 58, 6665–6677. [Google Scholar] [CrossRef]
- Bavo, F.; Pallavicini, M.; Gotti, C.; Appiani, R.; Moretti, M.; Colombo, S.F.; Pucci, S.; Viani, P.; Budriesi, R.; Renzi, M.; et al. Modifications at C(5) of 2-(2-pyrrolidinyl)-substituted 1,4-benzodioxane elicit potent α4β2 nicotinic acetylcholine receptor partial agonism with high selectivity over the α3β4 subtype. J. Med. Chem. 2020, 63, 15668–15692. [Google Scholar] [CrossRef] [PubMed]
- Eaton, J.B.; Peng, J.-H.; Schroeder, K.M.; George, A.A.; Fryer, J.D.; Krishnan, C.; Buhlman, L.; Kuo, Y.-P.; Steinlein, O.; Lukas, R.J. Characterization of human α4β2-nicotinic acetylcholine receptors stably and heterologously expressed in native nicotinic receptor-Null SH-EP1 human epithelial cells. Mol. Pharmacol. 2003, 64, 1283–1294. [Google Scholar] [CrossRef]
- Xiao, Y.; Kellar, K.J. The comparative pharmacology and up-regulation of rat neuronal nicotinic receptor subtype binding sites stably expressed in transfected mammalian cells. J. Pharmacol. Exp. Ther. 2004, 310, 98–107. [Google Scholar] [CrossRef] [PubMed]
- Hansen, C.P.; Jensen, A.A.; Christensen, J.K.; Balle, T.; Liljefors, T.; Frølund, B. Novel acetylcholine and carbamoylcholine analogues: Development of a functionally selective α4β2 nicotinic acetylcholine receptor agonist. J. Med. Chem. 2008, 51, 7380–7395. [Google Scholar] [CrossRef]
- Jensen, A.A.; Mikkelsen, I.; Frølund, B.; Bräuner-Osborne, H.; Falch, E.; Krogsgaard-Larsen, P. Carbamoylcholine homologs: Novel and potent agonists at neuronal nicotinic acetylcholine receptors. Mol. Pharmacol. 2003, 64, 865. [Google Scholar] [CrossRef]
- Garvey, D.S.; Wasicak, J.T.; Decker, M.W.; Brioni, J.D.; Buckley, M.J.; Sullivan, J.P.; Carrera, G.M.; Holladay, M.W.; Arneric, S.P.; Williams, M. Novel isoxazoles which interact with brain cholinergic channel receptors have intrinsic cognitive enhancing and anxiolytic activities. J. Med. Chem. 1994, 37, 1055–1059. [Google Scholar] [CrossRef] [PubMed]
- Wei, Z.-L.; Xiao, Y.; Yuan, H.; Baydyuk, M.; Petukhov, P.A.; Musachio, J.L.; Kellar, K.J.; Kozikowski, A.P. Novel pyridyl ring C5 substituted analogues of epibatidine and 3-(1-methyl-2(S)- pyrrolidinylmethoxy)pyridine (A-84543) as highly selective agents for neuronal nicotinic acetylcholine receptors containing β2 subunits. J. Med. Chem. 2005, 48, 1721–1724. [Google Scholar] [CrossRef]
- Zwart, R.; Carbone, A.L.; Moroni, M.; Bermudez, I.; Mogg, A.J.; Folly, E.A.; Broad, L.M.; Williams, A.C.; Zhang, D.; Ding, C.; et al. Sazetidine-A is a potent and selective agonist at native and recombinant α4β2 nicotinic acetylcholine receptors. Mol. Pharmacol. 2008, 73, 1838–1843. [Google Scholar] [CrossRef]
- Xiao, Y.; Fan, H.; Musachio, J.L.; Wei, Z.-L.; Chellappan, S.K.; Kozikowski, A.P.; Kellar, K.J. Sazetidine-A, a novel ligand that desensitizes α4β2 nicotinic acetylcholine receptors without activating them. Mol. Pharmacol. 2006, 70, 1454–1460. [Google Scholar] [CrossRef]
- Young, G.T.; Broad, L.M.; Zwart, R.; Astles, P.C.; Bodkin, M.; Sher, E.; Millar, N.S. Species selectivity of a nicotinic acetylcholine receptor agonist is conferred by two adjacent extracellular β4 amino acids that are implicated in the coupling of binding to channel gating. Mol. Pharmacol. 2007, 71, 389–397. [Google Scholar] [CrossRef]
- Tuan, E.W.; Horti, A.G.; Olson, T.T.; Gao, Y.; Stockmeier, C.A.; Al-Muhtasib, N.; Bowman Dalley, C.; Lewin, A.E.; Wolfe, B.B.; Sahibzada, N.; et al. AT-1001 is a partial agonist with high affinity and selectivity at human and rat α3β4 nicotinic cholinergic receptors. Mol. Pharmacol. 2015, 88, 640–649. [Google Scholar] [CrossRef] [PubMed]
- Elliott, R.L.; Kopecka, H.; Gunn, D.E.; Lin, N.-H.; Garvey, D.S.; Ryther, K.B.; Holladay, M.W.; Anderson, D.J.; Campbell, J.E.; Sullivan, J.P.; et al. 2-(Aryloxymethyl) azacyclic analogues as novel nicotinic acetylcholine receptor (nAChR) ligands. Bioorg. Med. Chem. Lett. 1996, 6, 2283–2288. [Google Scholar] [CrossRef]
- Schrödinger Release 2019-4: Maestro; Schrödinger LLC: New York, NY, USA, 2019.
- Schrödinger Release 2019-4: LigPrep; Schrödinger LLC: New York, NY, USA, 2019.
- Schrödinger Release 2019-4: Protein Preparation Wizard; Epik; Schrödinger LLC: New York, NY, USA, 2019; Impact; Schrödinger LLC: New York, NY, USA, Prime; Schrödinger LLC: New York, NY, USA, 2019.
- Madhavi Sastry, G.; Adzhigirey, M.; Day, T.; Annabhimoju, R.; Sherman, W. Protein and ligand preparation: Parameters, protocols, and influence on virtual screening enrichments. J. Comput. Aided Mol. Des. 2013, 27, 221–234. [Google Scholar] [CrossRef] [PubMed]
- Sherman, W.; Day, T.; Jacobson, M.P.; Friesner, R.A.; Farid, R. Novel procedure for modeling ligand/receptor induced fit effects. J. Med. Chem. 2006, 49, 534–553. [Google Scholar] [CrossRef]
- Sievers, F.; Wilm, A.; Dineen, D.; Gibson, T.J.; Karplus, K.; Li, W.; Lopez, R.; McWilliam, H.; Remmert, M.; Söding, J.; et al. Fast, scalable generation of high-quality protein multiple sequence alignments using Clustal Omega. Mol. Syst. Biol. 2011, 7, 539. [Google Scholar] [CrossRef] [PubMed]
- UniProt Consortium. UniProt: The universal protein knowledgebase in 2021. Nucleic Acids Res. 2021, 49, D480–D489. [Google Scholar] [CrossRef] [PubMed]
- Larsson, A. AliView: A fast and lightweight alignment viewer and editor for large datasets. Bioinformatics 2014, 30, 3276–3278. [Google Scholar] [CrossRef] [PubMed]
- Friesner, R.A.; Murphy, R.B.; Repasky, M.P.; Frye, L.L.; Greenwood, J.R.; Halgren, T.A.; Sanschagrin, P.C.; Mainz, D.T. Extra precision glide: Docking and scoring incorporating a model of hydrophobic enclosure for protein-ligand complexes. J. Med. Chem. 2006, 49, 6177–6196. [Google Scholar] [CrossRef] [PubMed]
- Schrödinger Release 2019-4: MacroModel; Schrödinger LLC: New York, NY, USA, 2019.
- Kores, K.; Lešnik, S.; Bren, U.; Janežič, D.; Konc, J. Discovery of novel potential human targets of resveratrol by inverse molecular docking. J. Chem. Inf. Modeling 2019, 59, 2467–2478. [Google Scholar] [CrossRef] [PubMed]


 | |||
|---|---|---|---|
| Compound | α4β2 Ki (μM) a | α3β4 Ki (μM) b | α3β4 Ki/α4β2 Ki |
| (S,R)-2 c | 0.012 | 0.310 | 25.8 |
| (S)-3 d | 0.0011 | 0.074 | 67.3 |
| (S)-4 e | 0.042 | n.a. | n.a. |
| (S)-5 f | 0.600 | 4.5 | 7.5 |
| (S)-6 f | 0.0312 | 0.946 | 30.3 |
| (S)-7 d | 0.0037 | 0.235 | 63.5 |
 | |||
|---|---|---|---|
| Compound | α4β2 Ki (μM) a | α3β4 Ki (μM) b | α3β4 Ki/α4β2 Ki |
| (S)-8 | 9.4 | 0.749 | 0.08 |
| (S)-9 | 0.0189 | 0.271 | 14.3 |
| (S,R)-10 | 1.55 | 1.3 | 0.84 |
| (S,R)-10 + (S,S)-10 | 4.59 | 1.4 | 0.31 |
| (S,R)-11 | 0.011 | 0.257 | 23.4 |
| (S,S)-11 | 0.192 | 0.752 | 3.9 |
| (S)-12 | 7.28 | 0.794 | 0.11 |
| (S)-13 | 0.255 | 2.1 | 8.2 |
| (S,R)-14 | 0.027 | 5.0 | 185 |
| (S,S)-14 | 0.877 | 5.6 | 6.4 |
 | |||
|---|---|---|---|
| Compound | α4β2 Ki (μM) a | α3β4 Ki (μM) b | α3β4 Ki/α4β2 Ki |
| (S)-15 | 0.0237 | 3.1 | 130.8 |
| (S)-16 | 0.0038 | 0.030 | 7.9 |
| (S)-17 | 0.528 | 0.200 | 0.4 |
| (S)-18 | 0.0142 | 1.200 | 84.5 |
| (S)-19 | 0.012 | 0.122 | 10.2 |
| (S)-20 | 0.330 | 0.947 | 2.9 |
 | |||
|---|---|---|---|
| Compound | α4β2 Ki (μM) a | α3β4 Ki (μM) b | α3β4 Ki/α4β2 Ki |
| (R,R)-21 | 43.8 c | - | - |
| (R,S)-21 | 12.5 c | - | - |
| (S,R)-21 | 0.26 c | 1.2 d | 4.6 |
| (S,S)-21 | 0.47 c | 8.2 d | 17.4 |
| (S,R)-2 e | 0.012 | 0.310 | 25.8 |
| (S,S)-2 e | 0.421 | 0.7 | 1.7 |
| (S,R)-22 e | 42 | - | - |
| (S,R)-23 e | 51 | - | - |
| (S,R)-24 e | 97 | - | - |
| (S,R)-25 e | 8.1 | - | - |
| (S,R)-26 e | 17 | - | - |
| (S,R)-27 e | 9.3 | - | - |
| (S,R)-28 e | 35 | - | - |
| (S,R)-29 f | 0.022 | 0.019 | 0.9 |
| (S,R)-30 f | 14 | 4.5 | 0.3 |
| (S,R)-31 f | 147 | 2.2 | 0.02 |
| (S,R)-32 f | 6.5 | 1.9 | 0.3 |
 | |||
|---|---|---|---|
| Compound | α4β2 Ki (μM) a | α3β4 Ki (μM) b | α3β4 Ki/α4β2 Ki |
| (S,R)-33 | 0.41 | 16.2 | 39.5 |
| (S,S)-33 | 30.4 | 22 | 0.7 |
| (S,R)-34/(S,S)-34 | 2.5 | 12.3 | 4.9 |
| (S,R)-35 | 1.64 | 5.8 | 3.5 |
| (S,S)-35 | 3.6 | 8.9 | 2.5 |
| (S,R)-36 | 43 | - | - |
| (S,S)-36 | 30 | - | - |
 | |||
|---|---|---|---|
| Compound | α4β2 Ki (μM) a | α3β4 Ki (μM) b | α3β4 Ki/α4β2 Ki |
| (S,R)-37 | 7.1 | 3.9 | 0.5 |
| (S,S)-37 | 0.131 | 13 | 100 |
| (S,R)-38 | 12.2 | 1.1 | 0.1 |
| (S,S)-38 | 0.335 | 6.7 | 20.0 |
| (S,R)-39 | 0.55 | 3.9 | 7.1 |
| (S,S)-39 | 1.7 | >100 | >59 |
| (S,R)-40 | 0.64 | 2.7 | 4.2 |
| (S,S)-40 | 7.3 | 5.3 | 0.7 |
| (S,R)-41 | 86 | 3.5 | 0.04 |
| (S,R)-42 | 46 | 15 | 0.3 |
| (S,R)-43 | 50 | 1.9 | 0.04 |
| (S,R)-44 | 59 | 5.4 | 0.1 |
Publisher’s Note: MDPI stays neutral with regard to jurisdictional claims in published maps and institutional affiliations. |
© 2021 by the authors. Licensee MDPI, Basel, Switzerland. This article is an open access article distributed under the terms and conditions of the Creative Commons Attribution (CC BY) license (https://creativecommons.org/licenses/by/4.0/).
Share and Cite
Bavo, F.; Pallavicini, M.; Appiani, R.; Bolchi, C. Determinants for α4β2 vs. α3β4 Subtype Selectivity of Pyrrolidine-Based nAChRs Ligands: A Computational Perspective with Focus on Recent cryo-EM Receptor Structures. Molecules 2021, 26, 3603. https://doi.org/10.3390/molecules26123603
Bavo F, Pallavicini M, Appiani R, Bolchi C. Determinants for α4β2 vs. α3β4 Subtype Selectivity of Pyrrolidine-Based nAChRs Ligands: A Computational Perspective with Focus on Recent cryo-EM Receptor Structures. Molecules. 2021; 26(12):3603. https://doi.org/10.3390/molecules26123603
Chicago/Turabian StyleBavo, Francesco, Marco Pallavicini, Rebecca Appiani, and Cristiano Bolchi. 2021. "Determinants for α4β2 vs. α3β4 Subtype Selectivity of Pyrrolidine-Based nAChRs Ligands: A Computational Perspective with Focus on Recent cryo-EM Receptor Structures" Molecules 26, no. 12: 3603. https://doi.org/10.3390/molecules26123603
APA StyleBavo, F., Pallavicini, M., Appiani, R., & Bolchi, C. (2021). Determinants for α4β2 vs. α3β4 Subtype Selectivity of Pyrrolidine-Based nAChRs Ligands: A Computational Perspective with Focus on Recent cryo-EM Receptor Structures. Molecules, 26(12), 3603. https://doi.org/10.3390/molecules26123603