
Moringa oleifera Lam. in Diabetes Mellitus: A Systematic Review and Meta-Analysis


Abstract
1. Introduction
2. Results
2.1. Search Results
2.2. Study Characteristics and Quality Assessment
2.3. MO Extracts Reduced Blood Glucose Levels in Some DM Rodent Models
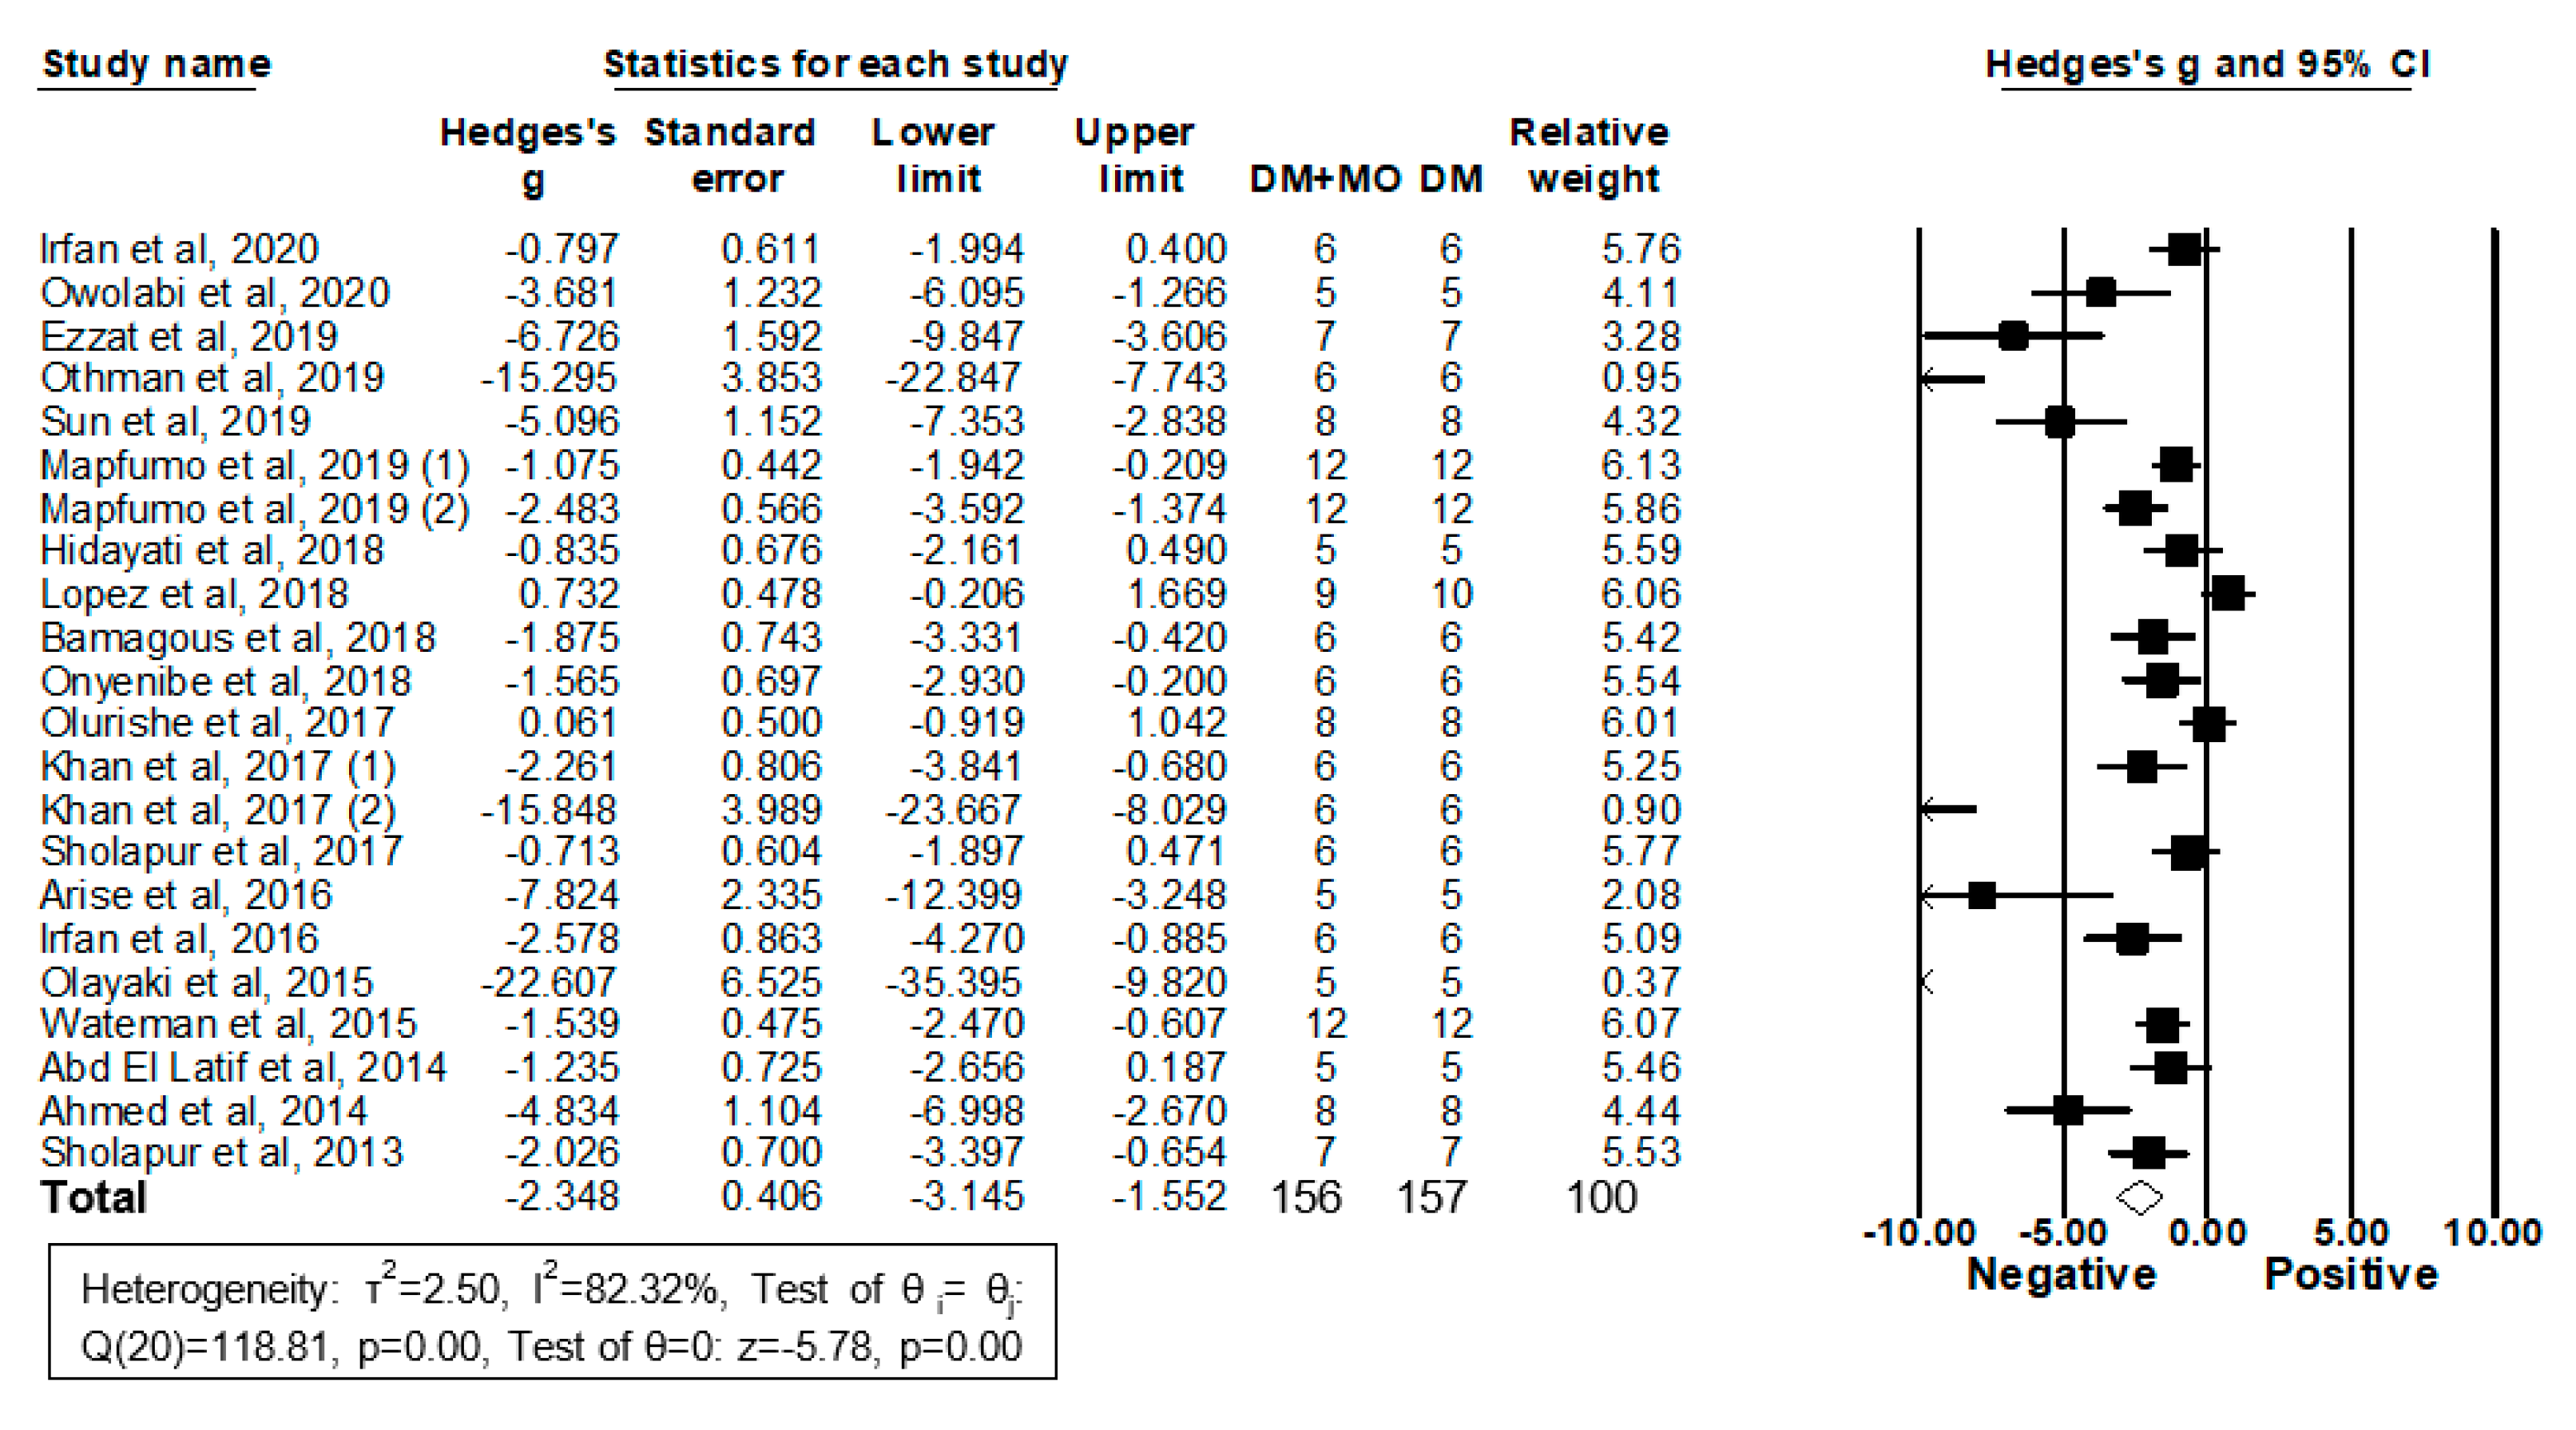
2.3.1. Forestplot Analysis
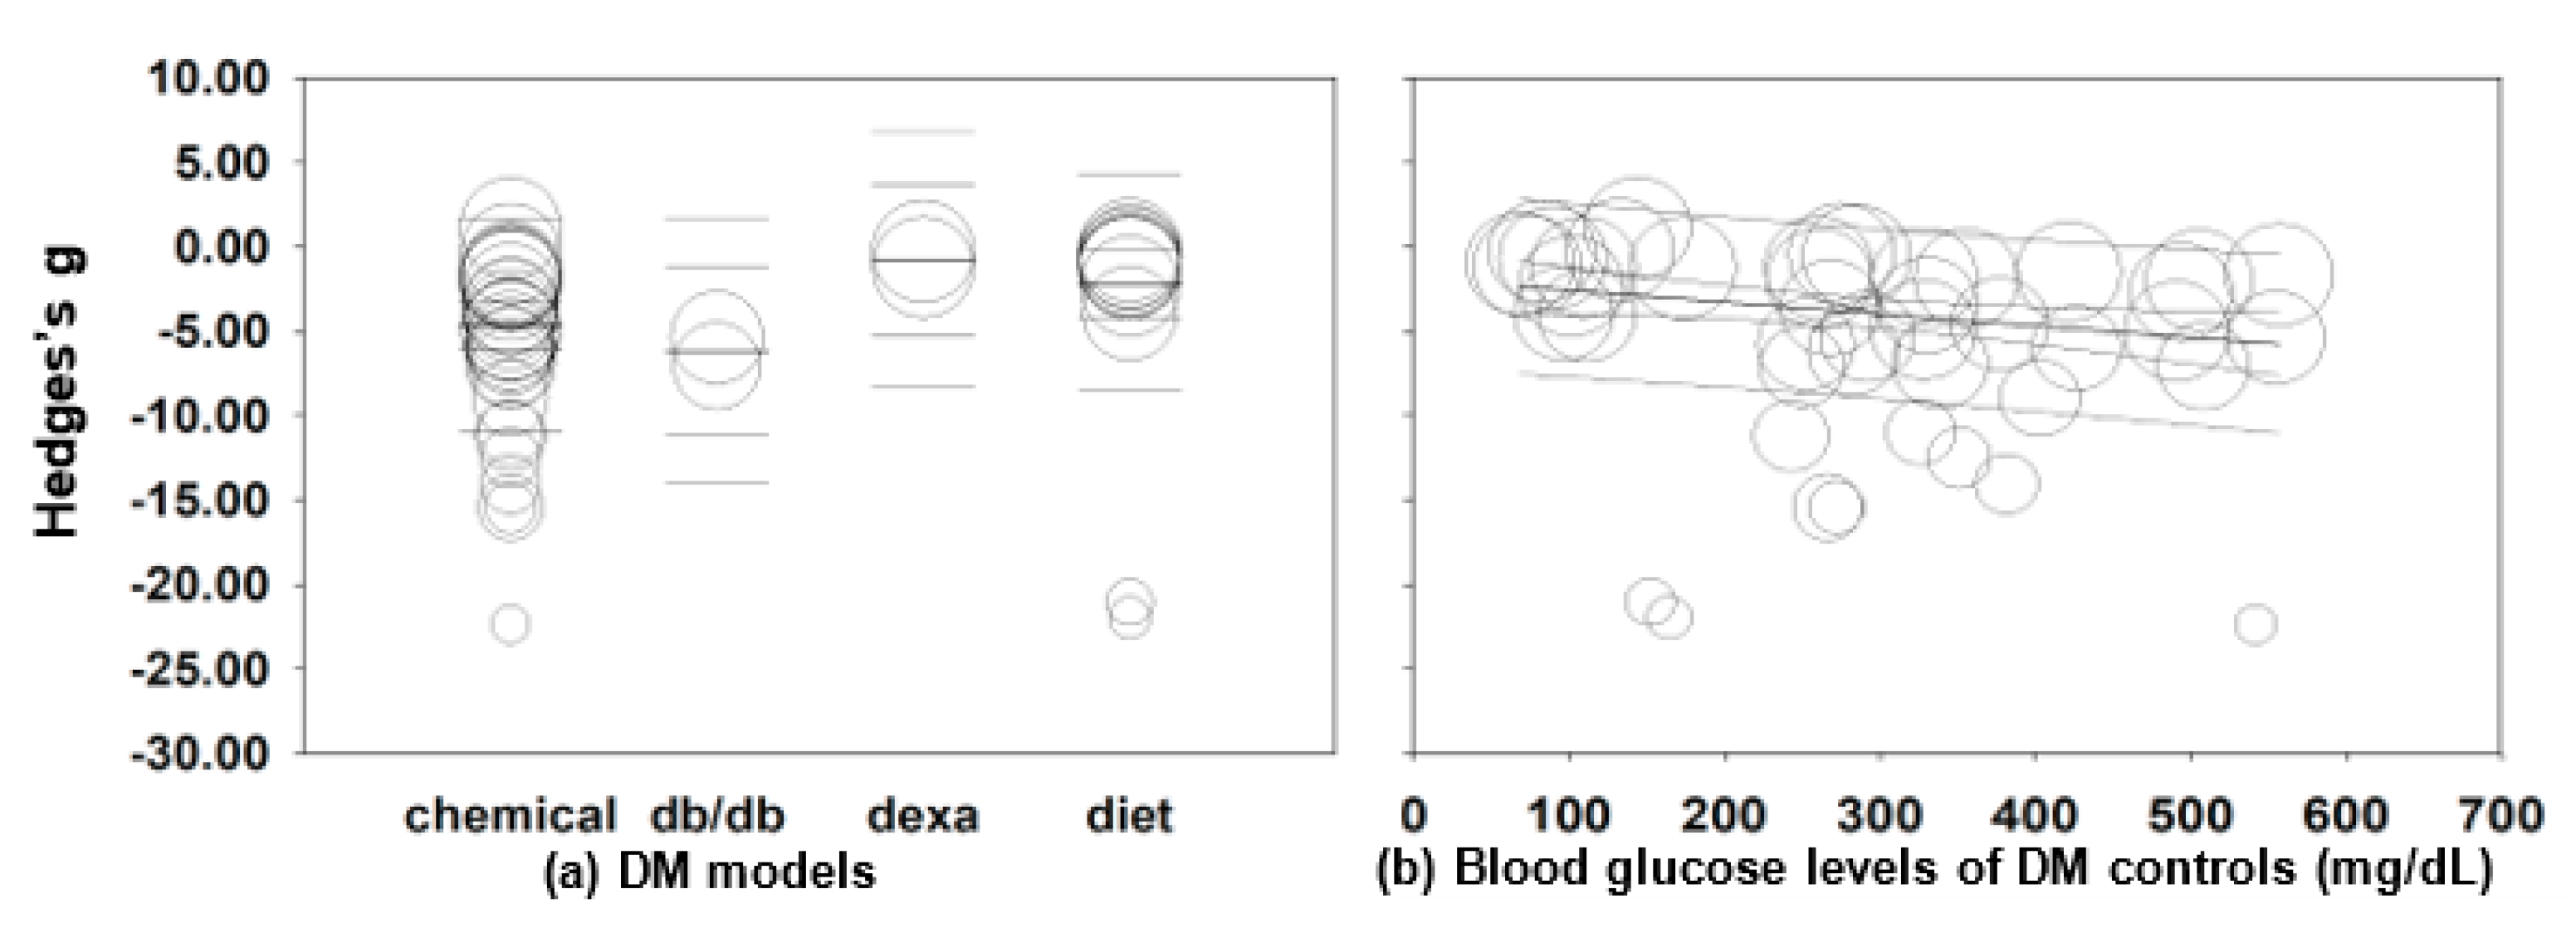
2.3.2. Subgroup and Meta-Regression Analyses
2.3.3. Subgroup and Meta-Regression Analyses in Chemical-Induced DM Rodents
2.3.4. Subgroup and Meta-Regression Analyses in Diet-Induced DM Rodents
2.3.5. Assessment of Publication Bias
2.4. The Administration of MO Extracts Improved Diabetic Dyslipidemia in DM Rodent Models
2.4.1. Triglyceride (TG) Levels
2.4.2. Total Cholesterol (TC) Levels
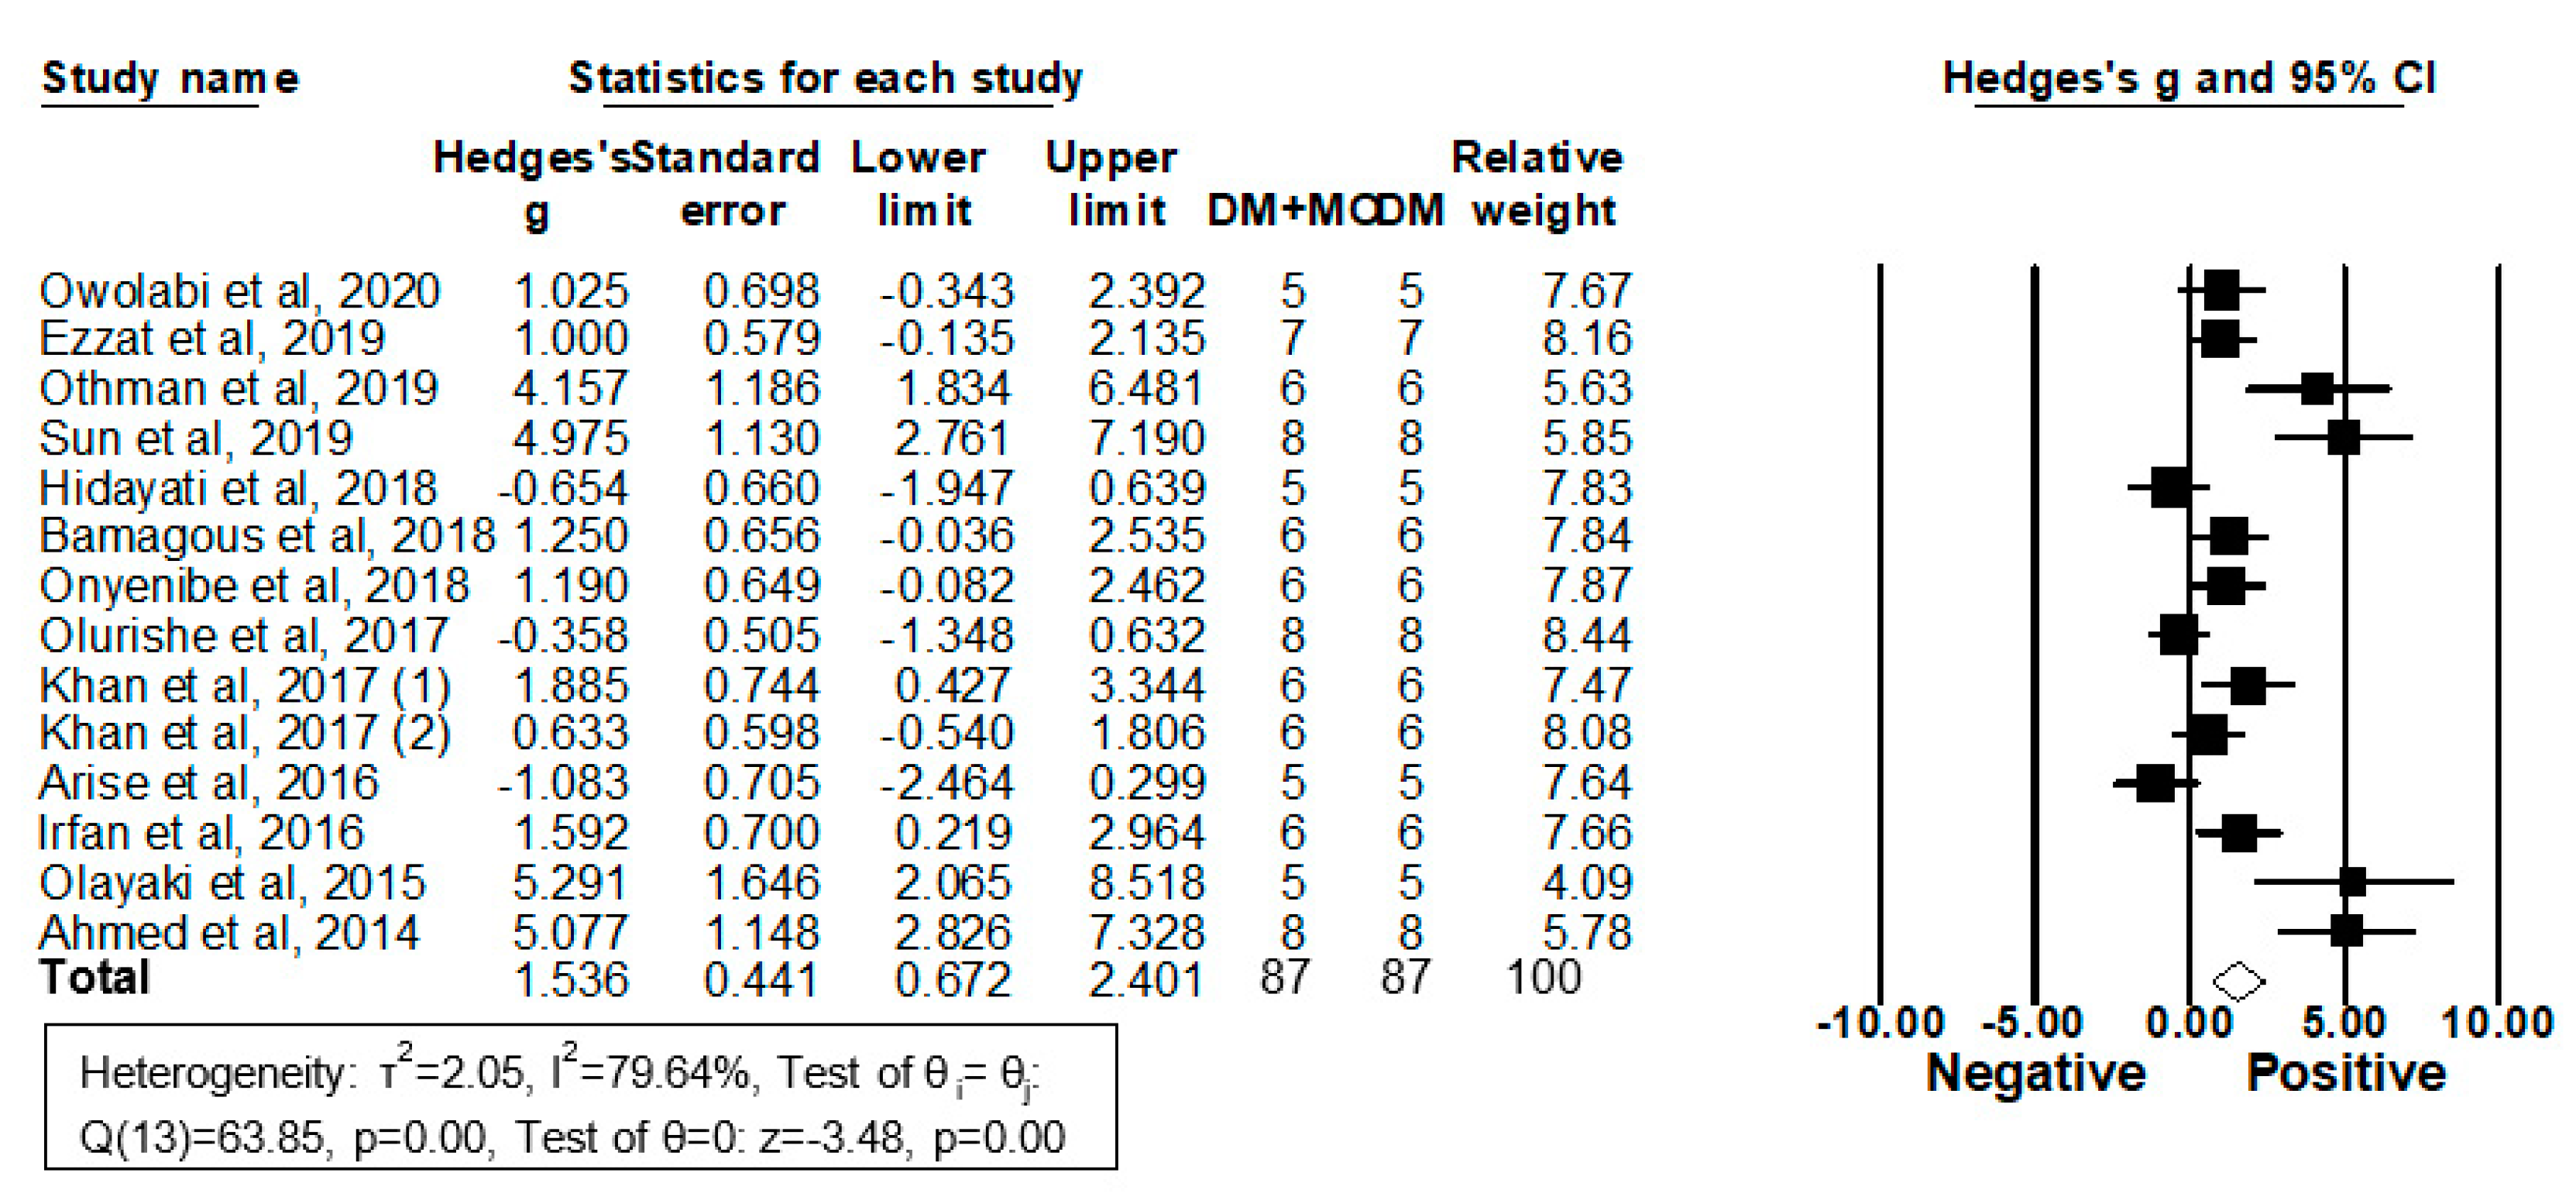
2.4.3. High-Density Lipoprotein Cholesterol (HDL-C) Levels
3. Discussion
3.1. Main Findings
3.2. Interpretation
3.2.1. Nutritional Characteristics of MO
3.2.2. Pharmacological Properties of MO Extracts
3.2.3. Strength and Limitations
4. Materials and Methods
4.1. Data Sources and Search Strategies
4.2. Inclusion and Exclusion Criteria
4.3. Data Extraction and Quality Assessment
4.4. Data Synthesis and Analysis
5. Conclusions
Supplementary Materials
Author Contributions
Funding
Conflicts of Interest
References
- International Diabetes Federation. IDF Diabetes Atlas, 9th ed.; International Diabetes Federation: Brussels, Belgium, 2019. [Google Scholar]
- Balunas, M.J.; Kinghorn, A.D. Drug discovery from medicinal plants. Life Sci. 2005, 78, 431–441. [Google Scholar] [CrossRef] [PubMed]
- Moringa oleifera. Available online: https://npgsweb.ars-grin.gov/gringlobal/taxon/taxonomydetail?id=24597 (accessed on 3 May 2021).
- Promkum, C.; Kupradinun, P.; Tuntipopipat, S.; Butryee, C. Nutritive evaluation and effect of Moringa oleifera pod on clastogenic potential in the mouse. Asian Pac. J. Cancer Prev. 2010, 11, 627–632. [Google Scholar] [PubMed]
- Mena, P.; Angelino, D. Plant Food, Nutrition, and Human Health. Nutrients 2020, 12, 2157. [Google Scholar] [CrossRef]
- Dhakad, A.K.; Ikram, M.; Sharma, S.; Khan, S.; Pandey, V.V.; Singh, A. Biological, nutritional, and therapeutic significance of Moringa oleifera Lam. Phytother. Res. 2019, 33, 2870–2903. [Google Scholar] [CrossRef] [PubMed]
- Kou, X.; Li, B.; Olayanju, J.B.; Drake, J.M.; Chen, N. Nutraceutical or Pharmacological Potential of Moringa oleifera Lam. Nutrients 2018, 10, 343. [Google Scholar] [CrossRef]
- Nova, E.; Redondo-Useros, N.; Martinez-Garcia, R.M.; Gomez-Martinez, S.; Diaz-Prieto, L.E.; Marcos, A. Potential of Moringa oleifera to Improve Glucose Control for the Prevention of Diabetes and Related Metabolic Alterations: A Systematic Review of Animal and Human Studies. Nutrients 2020, 12, 2050. [Google Scholar] [CrossRef]
- Leone, A.; Bertoli, S.; Di Lello, S.; Bassoli, A.; Ravasenghi, S.; Borgonovo, G.; Forlani, F.; Battezzati, A. Effect of Moringa oleifera Leaf Powder on Postprandial Blood Glucose Response: In Vivo Study on Saharawi People Living in Refugee Camps. Nutrients 2018, 10, 1494. [Google Scholar] [CrossRef] [PubMed]
- Taweerutchana, R.; Lumlerdkij, N.; Vannasaeng, S.; Akarasereenont, P.; Sriwijitkamol, A. Effect of Moringa oleifera Leaf Capsules on Glycemic Control in Therapy-Naive Type 2 Diabetes Patients: A Randomized Placebo Controlled Study. Evid. Based Complement Alternat. Med. 2017, 2017, 6581390. [Google Scholar] [CrossRef] [PubMed]
- Ngamukote, S.; Khannongpho, T.; Siriwatanapaiboon, M.; Sirikwanpong, S.; Dahlan, W.; Adisakwattana, S. Moringa oleifera leaf extract increases plasma antioxidant status associated with reduced plasma malondialdehyde concentration without hypoglycemia in fasting healthy volunteers. Chin. J. Integr. Med. 2016. [Google Scholar] [CrossRef]
- Kushwaha, S.; Chawla, P.; Kochhar, A. Effect of supplementation of drumstick (Moringa oleifera) and amaranth (Amaranthus tricolor) leaves powder on antioxidant profile and oxidative status among postmenopausal women. J. Food Sci. Technol. 2014, 51, 3464–3469. [Google Scholar] [CrossRef]
- Oldoni, T.L.C.; Merlin, N.; Bicas, T.C.; Prasniewski, A.; Carpes, S.T.; Ascari, J.; de Alencar, S.M.; Massarioli, A.P.; Bagatini, M.D.; Morales, R.; et al. Antihyperglycemic activity of crude extract and isolation of phenolic compounds with antioxidant activity from Moringa oleifera Lam. leaves grown in Southern Brazil. Food Res. Int. 2021, 141, 110082. [Google Scholar] [CrossRef]
- Anwer, T.; Safhi, M.M.; Makeen, H.A.; Alshahrani, S.; Siddiqui, R.; Sivakumar, S.M.; Shaheen, E.S.; Alam, M.F. Antidiabetic potential of Moringa oleifera Lam. leaf extract in type 2 diabetic rats, and its mechanism of action. Trop. J. Pharm. Res. 2021, 20, 97–104. [Google Scholar]
- Irfan, H.M.; Khan, N.A.K.; Asmawi, M.Z. Moringa oleifera Lam. leaf extracts reverse metabolic syndrome in Sprague Dawley rats fed high-fructose high fat diet for 60-days. Arch. Physiol. Biochem. 2020. [Google Scholar] [CrossRef]
- Kusumawati, E.; Sri Hidayati, L.; Lusiana, N.; Purnamasari, R.; Hadi, M.I.; Kosvianti, E. Analysis of the Moringa oleifera seed oil extract on insulin level in alloxan-induced diabetic rat (Rattus norvegicus). Indian J. Med. Forensic Med. Toxicol. 2020, 14, 1852–1857. [Google Scholar]
- Owolabi, M.A.; Ogah, C.O.; Adebayo, K.O.; Soremi, E.M. Evaluation of antidiabetic potential and biochemical parameters of aqueous pod extract of Moringa oleifera in alloxan diabetic rats. Trop. J. Nat. Prod. Res. 2020, 4, 50–57. [Google Scholar] [CrossRef]
- Ezzat, S.M.; El Bishbishy, M.H.; Aborehab, N.M.; Salama, M.M.; Hasheesh, A.; Motaal, A.A.; Rashad, H.; Metwally, F.M. Upregulation of MC4R and PPAR-alpha expression mediates the anti-obesity activity of Moringa oleifera Lam. in high-fat diet-induced obesity in rats. J. Ethnopharmacol 2020, 251, 112541. [Google Scholar] [CrossRef] [PubMed]
- Mohamed, M.A.; Ahmed, M.A.; El Sayed, R.A. Molecular effects of Moringa leaf extract on insulin resistance and reproductive function in hyperinsulinemic male rats. J. Diabetes Metab. Disord. 2019, 18, 487–494. [Google Scholar] [CrossRef] [PubMed]
- Aju, B.Y.; Rajalakshmi, R.; Mini, S. Protective role of Moringa oleifera leaf extract on cardiac antioxidant status and lipid peroxidation in streptozotocin induced diabetic rats. Heliyon 2019, 5, e02935. [Google Scholar] [CrossRef]
- Othman, A.I.; Amer, M.A.; Basos, A.S.; El-Missiry, M.A. Moringa oleifera leaf extract ameliorated high-fat diet-induced obesity, oxidative stress and disrupted metabolic hormones. Clin. Phytosci. 2019, 5, 48. [Google Scholar] [CrossRef]
- Sun, W.; Liu, J.; Wu, L.; Guo, X.; Zhang, L.; Fan, Y.; Yang, L.; Guo, X.; Hou, Y.; Mu, X.; et al. Transcriptome analysis of the effects of Moringa oleifera leaf extract in db/db mice with type 2 diabetes mellitus. Int. J. Clin. Exp. Med. 2019, 12, 6643–6658. [Google Scholar]
- Mapfumo, M.; Lembede, B.W.; Ndhlala, A.R.; Chivandi, E. Effect of crude Moringa oleifera Lam. seed extract on the blood markers of metabolic syndrome in high-fructose diet-fed growing Sprague-Dawley rats. J. Complement. Integr. Med. 2019, 17. [Google Scholar] [CrossRef]
- Hidayati, S.; Sulistyawati, R.; Nurani, L.H. Regulation of ethyl acetate fraction from Moringa oleifera leaves to improve lipid metabolism and insulin sensitivity in type 2 diabetes. Int. J. Pharm. Pharm. Sci. 2018, 10, 78–82. [Google Scholar] [CrossRef][Green Version]
- Jaja-Chimedza, A.; Zhang, L.; Wolff, K.; Graf, B.L.; Kuhn, P.; Moskal, K.; Carmouche, R.; Newman, S.; Salbaum, J.M.; Raskin, I. A dietary isothiocyanate-enriched moringa (Moringa oleifera) seed extract improves glucose tolerance in a high-fat-diet mouse model and modulates the gut microbiome. J. Funct. Foods 2018, 47, 376–385. [Google Scholar] [CrossRef]
- Azevedo, I.M.; Araujo-Filho, I.; Teixeira, M.M.A.; Moreira, M.; Medeiros, A.C. Wound healing of diabetic rats treated with Moringa oleifera extract. Acta Cir. Bras. 2018, 33, 799–805. [Google Scholar] [CrossRef] [PubMed]
- López, M.; Ríos-Silva, M.; Huerta, M.; Cárdenas, Y.; Bricio-Barrios, J.A.; Díaz-Reval, M.I.; Urzúa, Z.; Huerta-Trujillo, M.; López-Quezada, K.; Trujillo, X. Effects of Moringa oleifera leaf powder on metabolic syndrome induced in male Wistar rats: A preliminary study. J. Int. Med. Res. 2018, 46, 3327–3336. [Google Scholar] [CrossRef]
- Villarruel-Lopez, A.; Lopez-de la Mora, D.A.; Vazquez-Paulino, O.D.; Puebla-Mora, A.G.; Torres-Vitela, M.R.; Guerrero-Quiroz, L.A.; Nuno, K. Effect of Moringa oleifera consumption on diabetic rats. BMC Complement. Altern. Med. 2018, 18, 127. [Google Scholar] [CrossRef] [PubMed]
- Oboh, G.; Oyeleye, S.I.; Akintemi, O.A.; Olasehinde, T.A. Moringa oleifera supplemented diet modulates nootropic-related biomolecules in the brain of STZ-induced diabetic rats treated with acarbose. Metab. Brain Dis. 2018, 33, 457–466. [Google Scholar] [CrossRef] [PubMed]
- Bamagous, G.A.; Al Ghamdi, S.S.; Ibrahim, I.A.A.; Mahfoz, A.M.; Afify, M.A.; Alsugoor, M.H.M.; Shammah, A.A.; Arulselvan, P.; Rengarajan, T. Antidiabetic and antioxidant activity of ethyl acetate extract fraction of Moringa oleifera leaves in streptozotocin-induced diabetes rats via inhibition of inflammatory mediators. Asian Pac. J. Trop. Biomed. 2018, 8, 320–327. [Google Scholar] [CrossRef]
- Kamalrudin, A.; Jasamai, M.; Noor, M.M. Ameliorative effect of Moringa oleifera fruit extract on reproductive parameters in diabetic-induced male rats. Pharmacogn. J. 2018, 10, S54–S58. [Google Scholar] [CrossRef]
- Onyenibe, N.S.; Isreal, F.; Babatunji, O. Moringa oleifera leaves modulate blood glucose concentration, lipid profile and carbohydrate metabolizing enzymes in streptozotocin diabetic rats. World Heart J. 2018, 10, 213–222. [Google Scholar]
- Metwally, F.M.; Rashad, H.M.; Ahmed, H.H.; Mahmoud, A.A.; Abdol Raouf, E.R.; Abdalla, A.M. Molecular mechanisms of the anti-obesity potential effect of Moringa oleifera in the experimental model. Asian Pac. J. Trop. Biomed. 2017, 7, 214–221. [Google Scholar] [CrossRef]
- Olurishe, C.O.; Kwanashie, H.O.; Zezi, A.U.; Danjuma, N.M.; Mohammed, B. Sitagliptin-Moringa oleifera coadministration did not delay the progression nor ameliorated functional and morphological anomalies in alloxan-induced diabetic nephropathy. Indian J. Pharm. 2017, 49, 366–373. [Google Scholar]
- Raafat, K.; Hdaib, F. Neuroprotective effects of Moringa oleifera: Bio-guided GC-MS identification of active compounds in diabetic neuropathic pain model. Chin. J. Integr. Med. 2017. [Google Scholar] [CrossRef]
- Aa, A.B.; Om, J.; Ts, E.; Ga, A. Preliminary phytochemical screening, antioxidant and antihyperglycaemic activity of Moringa oleifera leaf extracts. Pak. J. Pharm. Sci. 2017, 30, 2217–2222. [Google Scholar] [PubMed]
- Khan, W.; Parveen, R.; Chester, K.; Parveen, S.; Ahmad, S. Hypoglycemic Potential of Aqueous Extract of Moringa oleifera Leaf and In Vivo GC-MS Metabolomics. Front. Pharmacol. 2017, 8, 577. [Google Scholar] [CrossRef]
- Joung, H.; Kim, B.; Park, H.; Lee, K.; Kim, H.H.; Sim, H.C.; Do, H.J.; Hyun, C.K.; Do, M.S. Fermented Moringa oleifera Decreases Hepatic Adiposity and Ameliorates Glucose Intolerance in High-Fat Diet-Induced Obese Mice. J. Med. Food 2017, 20, 439–447. [Google Scholar] [CrossRef] [PubMed]
- Tang, Y.; Choi, E.J.; Han, W.C.; Oh, M.; Kim, J.; Hwang, J.Y.; Park, P.J.; Moon, S.H.; Kim, Y.S.; Kim, E.K. Moringa oleifera from Cambodia Ameliorates Oxidative Stress, Hyperglycemia, and Kidney Dysfunction in Type 2 Diabetic Mice. J. Med. Food 2017, 20, 502–510. [Google Scholar] [CrossRef] [PubMed]
- Abd Eldaim, M.A.; Shaban Abd Elrasoul, A.; Abd Elaziz, S.A. An aqueous extract from Moringa oleifera leaves ameliorates hepatotoxicity in alloxan-induced diabetic rats. Biochem. Cell Biol. 2017, 95, 524–530. [Google Scholar] [CrossRef]
- Omodanisi, E.I.; Aboua, Y.G.; Chegou, N.N.; Oguntibeju, O.O. Hepatoprotective, Antihyperlipidemic, and Anti-inflammatory Activity of Moringa oleifera in Diabetic-induced Damage in Male Wistar Rats. Pharm. Res. 2017, 9, 182–187. [Google Scholar]
- Omodanisi, E.I.; Aboua, Y.G.; Oguntibeju, O.O. Assessment of the Anti-Hyperglycaemic, Anti-Inflammatory and Antioxidant Activities of the Methanol Extract of Moringa oleifera in Diabetes-Induced Nephrotoxic Male Wistar Rats. Molecules 2017, 22, 439. [Google Scholar] [CrossRef]
- Sholapur, H.N.; Patil, B.M. Effect of fractions of alcoholic extract of Moringa oleifera lam. Bark on dexamethasone induced insulin resistance in rats. J. Young Pharm. 2017, 9, 410–416. [Google Scholar] [CrossRef]
- Irfan, H.M.; Asmawi, M.Z.; Khan, N.A.K.; Sadikun, A.; Mordi, M.N. Anti-diabetic activity-guided screening of aqueous-ethanol Moringa oleifera extracts and fractions: Identification of marker compounds. Trop. J. Pharm. Res. 2017, 16, 543–552. [Google Scholar] [CrossRef]
- Arise, R.O.; Aburo, O.R.; Farohunbi, S.T.; Adewale, A.A. Antidiabetic and Antioxidant Activities of Ethanolic Extract of Dried Flowers of Moringa oleifera in Streptozotocin-induced Diabetic Rats. Acta Fac. Med. Naissensis 2016, 33, 259–272. [Google Scholar] [CrossRef][Green Version]
- Irfan, H.M.; Asmawi, M.Z.; Khan, N.A.K.; Sadikun, A. Effect of ethanolic extract of Moringa oleifera lam. Leaves on body weight and hyperglycemia of diabetic rats. Pak. J. Nutr. 2016, 15, 112–117. [Google Scholar] [CrossRef]
- Olayaki, L.A.; Irekpita, J.E.; Yakubu, M.T.; Ojo, O.O. Methanolic extract of Moringa oleifera leaves improves glucose tolerance, glycogen synthesis and lipid metabolism in alloxan-induced diabetic rats. J. Basic Clin. Physiol. Pharmacol. 2015, 26, 585–593. [Google Scholar] [CrossRef] [PubMed]
- Al-Malki, A.L.; El Rabey, H.A. The antidiabetic effect of low doses of Moringa oleifera lam. Seeds on streptozotocin induced diabetes and diabetic nephropathy in male rats. BioMed Res. Int. 2015, 2015, 381040. [Google Scholar] [CrossRef] [PubMed]
- Waterman, C.; Rojas-Silva, P.; Tumer, T.B.; Kuhn, P.; Richard, A.J.; Wicks, S.; Stephens, J.M.; Wang, Z.; Mynatt, R.; Cefalu, W.; et al. Isothiocyanate-rich Moringa oleifera extract reduces weight gain, insulin resistance, and hepatic gluconeogenesis in mice. Mol. Nutr. Food Res. 2015, 59, 1013–1024. [Google Scholar] [CrossRef]
- Abd El Latif, A.; El Bialy Bel, S.; Mahboub, H.D.; Abd Eldaim, M.A. Moringa oleifera leaf extract ameliorates alloxan-induced diabetes in rats by regeneration of beta cells and reduction of pyruvate carboxylase expression. Biochem. Cell Biol. 2014, 92, 413–419. [Google Scholar] [CrossRef]
- Yassa, H.D.; Tohamy, A.F. Extract of Moringa oleifera leaves ameliorates streptozotocin-induced Diabetes mellitus in adult rats. Acta Histochem. 2014, 116, 844–854. [Google Scholar] [CrossRef]
- Ahmed, H.H.; Metwally, F.M.; Rashad, H.; Zaazaa, A.M.; Ezzat, S.M.; Salama, M.M. Moringa oleifera offers a multi-mechanistic approach for management of obesity in rats. Int. J. Pharm. Sci. Rev. Res. 2014, 29, 98–106. [Google Scholar]
- Oseni, O.A.; Idowu, A.S.K. Inhibitory activity of aqueous extracts of horseradiash Moringa oleifera (Lam) and nutmeg Myristica fragrans (Houtt) on oxidative stress in alloxan induced diabetic male wistar albino rats. Am. J. Biochem. Mol. Biol. 2014, 4, 64–75. [Google Scholar] [CrossRef]
- Sholapur, H.N.; Patil, B.M. Effect of Moringa oleifera bark extracts on dexamethasone-induced insulin resistance in rats. Drug Res. 2013, 63, 527–531. [Google Scholar] [CrossRef] [PubMed][Green Version]
- Kumar Gupta, S.; Kumar, B.; Srinivasan, B.P.; Nag, T.C.; Srivastava, S.; Saxena, R.; Aggarwal, A. Retinoprotective effects of Moringa oleifera via antioxidant, anti-inflammatory, and anti-angiogenic mechanisms in streptozotocin-induced diabetic rats. J. Ocul. Pharm. Ther. 2013, 29, 419–426. [Google Scholar] [CrossRef] [PubMed]
- Gupta, R.; Mathur, M.; Bajaj, V.K.; Katariya, P.; Yadav, S.; Kamal, R.; Gupta, R.S. Evaluation of antidiabetic and antioxidant activity of Moringa oleifera in experimental diabetes. J. Diabetes 2012, 4, 164–171. [Google Scholar] [CrossRef]
- Kar, A.; Choudhary, B.K.; Bandyopadhyay, N.G. Comparative evaluation of hypoglycaemic activity of some Indian medicinal plants in alloxan diabetic rats. J. Ethnopharmacol. 2003, 84, 105–108. [Google Scholar] [CrossRef]
- Moyo, B.; Masika, P.J.; Hugo, A.; Muchenje, V. Nutritional characterization of Moringa (Moringa oleifera Lam.) leaves. Afr. J. Biotechnol. 2011, 10, 12925–12933. [Google Scholar]
- FoodData Central: Moringa oleifera. US Department of Agriculture. Available online: https://fdc.nal.usda.gov/fdc-app.html#/food-details/168416/nutrients (accessed on 15 May 2021).
- Trigo, C.; Castello, M.L.; Ortola, M.D.; Garcia-Mares, F.J.; Desamparados Soriano, M. Moringa oleifera: An Unknown Crop in Developed Countries with Great Potential for Industry and Adapted to Climate Change. Foods 2020, 10, 31. [Google Scholar] [CrossRef]
- The Nutrient Content of Moringa oleifera Leaves. ECHO Research Note no. 1. 2013. Available online: https://miracletrees.org/moringa-doc/nutrient-content-of-moringa-oleifera-leaves.pdf (accessed on 15 May 2021).
- Olson, M.E.; Sankaran, R.P.; Fahey, J.W.; Grusak, M.A.; Odee, D.; Nouman, W. Leaf Protein and Mineral Concentrations across the “Miracle Tree” Genus Moringa. PLoS ONE 2016, 11, e0159782. [Google Scholar] [CrossRef]
- Leone, A.; Spada, A.; Battezzati, A.; Schiraldi, A.; Aristil, J.; Bertoli, S. Cultivation, Genetic, Ethnopharmacology, Phytochemistry and Pharmacology of Moringa oleifera Leaves: An Overview. Int. J. Mol. Sci. 2015, 16, 12791–12835. [Google Scholar] [CrossRef]
- Leone, A.; Fiorillo, G.; Criscuoli, F.; Ravasenghi, S.; Santagostini, L.; Fico, G.; Spadafranca, A.; Battezzati, A.; Schiraldi, A.; Pozzi, F.; et al. Nutritional Characterization and Phenolic Profiling of Moringa oleifera Leaves Grown in Chad, Sahrawi Refugee Camps, and Haiti. Int. J. Mol. Sci. 2015, 16, 18923–18937. [Google Scholar] [CrossRef]
- Bennett, R.N.; Mellon, F.A.; Foidl, N.; Pratt, J.H.; Dupont, M.S.; Perkins, L.; Kroon, P.A. Profiling glucosinolates and phenolics in vegetative and reproductive tissues of the multi-purpose trees Moringa oleifera L. (horseradish tree) and Moringa stenopetala L. J. Agric. Food Chem. 2003, 51, 3546–3553. [Google Scholar] [CrossRef] [PubMed]
- Siddhuraju, P.; Becker, K. Antioxidant properties of various solvent extracts of total phenolic constituents from three different agroclimatic origins of drumstick tree (Moringa oleifera Lam.) leaves. J. Agric. Food Chem. 2003, 51, 2144–2155. [Google Scholar] [CrossRef] [PubMed]
- Safe, S.; Jayaraman, A.; Chapkin, R.S.; Howard, M.; Mohankumar, K.; Shrestha, R. Flavonoids: Structure-function and mechanisms of action and opportunities for drug development. Toxicol. Res. 2021, 37, 147–162. [Google Scholar] [CrossRef]
- Glucosinolate Metabolism. Available online: https://homepage.ruhr-uni-bochum.de/markus.piotrowski/Research_Glucosinolate.html (accessed on 16 May 2021).
- Fahey, J.W.; Wade, K.L.; Stephenson, K.K.; Shi, Y.; Liu, H.; Panjwani, A.A.; Warrick, C.R.; Olson, M.E. A Strategy to Deliver Precise Oral Doses of the Glucosinolates or Isothiocyanates from Moringa oleifera Leaves for Use in Clinical Studies. Nutrients 2019, 11, 1547. [Google Scholar] [CrossRef]
- Waterman, C.; Cheng, D.M.; Rojas-Silva, P.; Poulev, A.; Dreifus, J.; Lila, M.A.; Raskin, I. Stable, water extractable isothiocyanates from Moringa oleifera leaves attenuate inflammation in vitro. Phytochemistry 2014, 103, 114–122. [Google Scholar] [CrossRef] [PubMed]
- Singh, D.; Arya, P.V.; Aggarwal, V.P.; Gupta, R.S. Evaluation of Antioxidant and Hepatoprotective Activities of Moringa oleifera Lam. Leaves in Carbon Tetrachloride-Intoxicated Rats. Antioxidants 2014, 3, 569–591. [Google Scholar] [CrossRef]
- Verma, A.R.; Vijayakumar, M.; Mathela, C.S.; Rao, C.V. In vitro and in vivo antioxidant properties of different fractions of Moringa oleifera leaves. Food Chem. Toxicol. 2009, 47, 2196–2201. [Google Scholar] [CrossRef]
- Coskun, O.; Kanter, M.; Korkmaz, A.; Oter, S. Quercetin, a flavonoid antioxidant, prevents and protects streptozotocin-induced oxidative stress and beta-cell damage in rat pancreas. Pharmacol. Res. 2005, 51, 117–123. [Google Scholar] [CrossRef] [PubMed]
- Jimoh, T.O. Enzymes inhibitory and radical scavenging potentials of two selected tropical vegetable (Moringa oleifera and Telfairia occidentalis) leaves relevant to type 2 diabetes mellitus. Rev. Bras. Farmacogn. 2018, 28, 73–79. [Google Scholar] [CrossRef]
- Perry, G.H.; Dominy, N.J.; Claw, K.G.; Lee, A.S.; Fiegler, H.; Redon, R.; Werner, J.; Villanea, F.A.; Mountain, J.L.; Misra, R.; et al. Diet and the evolution of human amylase gene copy number variation. Nat. Genet. 2007, 39, 1256–1260. [Google Scholar] [CrossRef]
- Chen, G.L.; Xu, Y.B.; Wu, J.L.; Li, N.; Guo, M.Q. Hypoglycemic and hypolipidemic effects of Moringa oleifera leaves and their functional chemical constituents. Food Chem. 2020, 333, 127478. [Google Scholar] [CrossRef] [PubMed]
- Tadera, K.; Minami, Y.; Takamatsu, K.; Matsuoka, T. Inhibition of alpha-glucosidase and alpha-amylase by flavonoids. J. Nutr. Sci. Vitaminol. 2006, 52, 149–153. [Google Scholar] [CrossRef]
- Oboh, G.; Ogunbadejo, M.D.; Ogunsuyi, O.B.; Oyeleye, S.I. Can gallic acid potentiate the antihyperglycemic effect of acarbose and metformin? Evidence from streptozotocin-induced diabetic rat model. Arch. Physiol. Biochem. 2020, 1–9. [Google Scholar] [CrossRef] [PubMed]
- Oboh, G.; Agunloye, O.M.; Adefegha, S.A.; Akinyemi, A.J.; Ademiluyi, A.O. Caffeic and chlorogenic acids inhibit key enzymes linked to type 2 diabetes (in vitro): A comparative study. J. Basic Clin. Physiol. Pharmacol. 2015, 26, 165–170. [Google Scholar] [CrossRef]
- Turk, E.; Zabel, B.; Mundlos, S.; Dyer, J.; Wright, E.M. Glucose/galactose malabsorption caused by a defect in the Na+/glucose cotransporter. Nature 1991, 350, 354–356. [Google Scholar] [CrossRef]
- Ndong, M.; Uehara, M.; Katsumata, S.I.; Suzuki, K. Effects of oral administration of Moringa oleifera Lam on glucose tolerance in Goto-Kakizaki and wistar rats. J. Clin. Biochem. Nutr. 2007, 40, 229–233. [Google Scholar] [CrossRef]
- Wright, E.M.; Hirayama, B.A.; Loo, D.F. Active sugar transport in health and disease. J. Intern. Med. 2007, 261, 32–43. [Google Scholar] [CrossRef] [PubMed]
- Dyer, J.; Wood, I.S.; Palejwala, A.; Ellis, A.; Shirazi-Beechey, S.P. Expression of monosaccharide transporters in intestine of diabetic humans. Am. J. Physiol. Gastrointest Liver Physiol. 2002, 282, G241–G248. [Google Scholar] [CrossRef]
- Alfarouk, K.O.; Ahmed, S.B.M.; Elliott, R.L.; Benoit, A.; Alqahtani, S.S.; Ibrahim, M.E.; Bashir, A.H.H.; Alhoufie, S.T.S.; Elhassan, G.O.; Wales, C.C.; et al. The Pentose Phosphate Pathway Dynamics in Cancer and Its Dependency on Intracellular pH. Metabolites 2020, 10, 285. [Google Scholar] [CrossRef]
- Mathupala, S.P.; Ko, Y.H.; Pedersen, P.L. Hexokinase II: Cancer’s double-edged sword acting as both facilitator and gatekeeper of malignancy when bound to mitochondria. Oncogene 2006, 25, 4777–4786. [Google Scholar] [CrossRef] [PubMed]
- Weickert, M.O.; Pfeiffer, A.F.H. Impact of Dietary Fiber Consumption on Insulin Resistance and the Prevention of Type 2 Diabetes. J. Nutr. 2018, 148, 7–12. [Google Scholar] [CrossRef] [PubMed]
- Entrez Gene: FASN Fatty Acid Synthase. Available online: https://www.ncbi.nlm.nih.gov/gene?Db=gene&Cmd=ShowDetailView&TermToSearch=2194 (accessed on 10 May 2021).
- Entrez Gene: HMGCR 3-Hydroxy-3-methylglutaryl-Coenzyme a Reductase. Available online: https://www.ncbi.nlm.nih.gov/gene?Db=gene&Cmd=ShowDetailView&TermToSearch=3156 (accessed on 10 May 2021).
- Goldstein, J.L.; Brown, M.S.; Krieger, M.; Anderson, R.G.; Mintz, B. Demonstration of low density lipoprotein receptors in mouse teratocarcinoma stem cells and description of a method for producing receptor-deficient mutant mice. Proc. Natl. Acad. Sci. USA 1979, 76, 2843–2847. [Google Scholar] [CrossRef] [PubMed]
- Cochrane Handbook for Systematic Reviews of Interventions Version 6.2 (Updated February 2021). Available online: www.training.cochrane.org/handbook (accessed on 30 April 2021).
- Hoftiezer, V.; Carpenter, A.M. Comparison of streptozotocin and alloxan-induced diabetes in the rat, including volumetric quantitation of the pancreatic islets. Diabetologia 1973, 9, 178–184. [Google Scholar] [CrossRef] [PubMed]


| Authors (Year) | Parts | Dose (mg/kg BW) | Duration Exposed to MO | Animal Models | Sex | n (T/no-T) | Age or Weight at the Baseline | Diet | Blood Sample for BS | Measurements |
|---|---|---|---|---|---|---|---|---|---|---|
| Oldoni et al. (2021) [13] | leaves | 500 | 45 days | rats, STZ 55 mg/kg | males | 6/6 | 90 days, 200–250 g | control | NS | BS |
| Anwer et al. (2021) [14] | leaves | 400 | 21 days | rats, STZ 40 mg/kg | males | 6/6 | 100–120 g | HFD | serum | BS |
| Irfan et al. (2020) [15] | leaves | 1000 | 30 days | rats | males | 6/6 | 6 wks old | HFD, 20% fructose in water | whole blood | BS, TC |
| Kusumawati et al. (2020) [16] | seeds | 300 | 2 weeks | rats, alloxan 150 mg/kg | females | 5/5 | NS | control | whole blood | BS |
| Owolabi et al. (2020) [17] | pods | 200 | 3 weeks | rats, alloxan 100 mg/kg | both | 5/5 | 130–150 g | control | plasma | BS, TG, TC, HDL-C |
| Ezzat et al. (2020) [18] | leaves | 400 | 1 month | rats | males | 7/7 | 100 ± 20 g | HFD | serum | BS, TG, TC, HDL-C |
| Mohamed et al. (2019) [19] | leaves | 300 | 4 weeks | rats | males | 10/10 | 140–320 g | high fructose diet | serum | BS |
| Aju et al. (2019) [20] | leaves | 300 | 60 days | rats, STZ 30 mg/kg | males | 6/6 | 170–180 g | high energy diet | serum | BS |
| Othman et al. (2019) [21] | leaves | 300 | 6 weeks | rats | males | 6/6 | 200–230 g | HFD | serum | BS, TG, TC, HDL-C |
| Sun et al. (2019) [22] | leaves | 120 | 8 weeks | db/db mice | males | 8/8 | 6 wks old | control | serum | BS, TG, TC, HDL-C |
| Mapfumo et al. (2019) (1) (2) [23] | seeds | 500 | 12 weeks | rats | females/males | 12/12 | 3 wks old | high fructose diet | whole blood | BS, TG, TC |
| Hidayati et al. (2018) [24] | leaves | 50 | 10 days | rats, STZ 65 mg/kg | males | 5/5 | NS | control | NS | BS, TG, TC, HDL-C |
| Jaja-Chimedza et al. (2018) [25] | seeds | 0.54% in diet | 12 weeks | mice | males | 12/12 | 5 wks old | HFD | whole blood | BS |
| Azevedo et al. (2018) [26] | leaves | 100 | 10 days | rats, STZ 45 mg/kg, | NS | 6/6 | 280 ± 23 g | control | whole blood | BS |
| López et al. (2018) [27] | leaves | 700 | 3 weeks | rats | males | 9/10 | 250 ± 50 g | HFD, 10% fructose in water | whole blood | BS, TG, TC |
| Villarruel-Lopez et al. (2018) [28] | leaves | 50 | 8 weeks | rats, alloxan 150 mg/kg | males | 6/6 | 180–200 g | control | whole blood | BS |
| Oboh et al. (2018) [29] | leaves | 4% in diet | 14 days | rats, STZ 60 mg/kg | males | 8/8 | 260–280 g | control | whole blood | BS |
| Bamagous et al. (2018) [30] | leaves | 200 | 30 days | rats, STZ 55 mg/kg | males | 6/6 | 8–12 wks old, 200–250 g | control | whole blood | BS, TG, TC, HDL-C |
| Kamalrudin et al. (2018) [31] | fruits | 500 | 21 days | rats, STZ 50 mg/kg | males | 5/5 | 10–12 wks old, 300–500 g | control | whole blood | BS |
| Onyenibe et al. (2018) [32] | leaves | 400 | 30 days | rats, STZ 60 mg/kg | males | 6/6 | 2 wks old, 120–140 g | control | whole blood | BS, TG, TC, HDL-C |
| Metwally et al. (2017) [33] | aerial parts | 600 | 12 weeks | rats | females | 8/8 | 13 wks old, 130 ± 10 g | high cholesterol diet | serum | BS |
| Olurische et al. (2017) [34] | leaves | 300 | 6 weeks | rats, alloxan 150 mg/kg | both | 8/8 | NS | control | NA | TG, TC, HDL-C |
| Raafat et al. (2017) [35] | seeds | 40–80 | 8 days | mice, alloxan 180 mg/kg | males | 7/7 | 18–29 g | control | whole blood | BS |
| Aa et al. (2017) [36] | leaves | 400 | 24 days | rats, alloxan 150 mg/kg | both | 5/5 | 12 wks old, 100 g | control | whole blood | BS |
| Khan et al. (2017) (1) (2) [37] | leaves | 100 | 3 weeks | rats, STZ 45 mg/kg | females | 6/6 | 200–250 g | control | NA | TG, TC, HDL-C |
| 200 | mice | 6/6 | 6 wks old | HFD | NA | |||||
| Joung et al. (2017) [38] | leaves | 250 | 10 weeks | mice | males | 9/9 | 4 wks old | HFD | whole blood | BS |
| Tang et al. (2017) [39] | leaves | 150 | 5 weeks | db/db mice | males | 8/8 | 7 wks old | control | plasma | BS, TG |
| Abd Eldaim et al. (2017) [40] | leaves | 250 | 18 days | rats, alloxan 150 mg/kg | both | 20/20 | 110–170 g | control | plasma | BS |
| Omodanisi et al. (2017) (1) [41] | leaves | 250 | 6 weeks | rats, STZ 55 mg/kg | males | 12/12 | 200–250 g | control | serum | BS |
| Omodanisi et al. (2017) (2) [42] | leaves | 250 | 6 weeks | rats, STZ 55 mg/kg | males | 12/12 | 10 wks old, 200–250 g | control | plasma | BS |
| Sholapur et al. (2017) [43] | stem bark | 140 | 11 days | rats, dexa 1 mg/kg | males | 6/6 | 180–200 g | control | serum | BS, TG, TC |
| Irfan et al. (2017) [44] | leaves | 1000 | 14 days | rats, STZ 45 mg/kg | males | 6/6 | 8–9 wks old, 230 ± 30 g | control | whole blood | BS |
| Olurishe et al. (2016) [34] | leaves | 300 | 6 weeks | rats, alloxan 150 mg/kg | both | 8/8 | NS | control | whole blood | BS |
| Arise et al. (2016) [45] | flowers | 300 | 21 days | rats, STZ 45 mg/kg | males | 5/5 | 151 ± 5 g | control | whole blood | BS, TG, TC, HDL-C |
| Irfan et al. (2016) [46] | leaves | 500 | 14 days | rats, STZ 45 mg/kg | males | 6/6 | 5–6 wks old, 170–200 g | control | whole blood | BS, TG, TC, HDL-C |
| Olayaki et al. (2015) [47] | leaves | 600 | 6 weeks | rats, alloxan 120 mg/kg | males | 5/5 | 6 wks, 150–180 g | control | whole blood | BS, TG, TC, HDL-C |
| Al-Malki et al. (2015) [48] | seeds | 100 | 4 weeks | rats, STZ 60 mg/kg | males | 10/10 | 180–200 g | control | serum | BS |
| Waterman et al. (2015) [49] | leaves | 5% extracts in diet | 12 weeks | mice | males | 12/12 | 5 wks old | HFD | whole blood | BS, TG, TC |
| Abd El Latif et al. (2014) [50] | leaves | 250 | 18 days | rats, alloxan 100 mg/kg | females | 5/5 | 130–170 g | control | serum | BS, TG, TC |
| Yassa et al. (2014) [51] | leaves | 200 | 8 weeks | rats, STZ 60 mg/kg | males | 10/10 | 12 months old, 180–200 g | control | plasma | BS |
| Ahmed et al. (2014) [52] | aerial parts | 600 | 12 weeks | rats | female | 8/8 | 13 wks old, 130 ± 10 g | high cholesterol diet | NA | TG, TC, HDL-C |
| Oseni et al. (2014) [53] | leaves | 30% in 0.5 mL water | 1 week | rats, alloxan 35 mg/kg | males | 5/5 | 74.6–87.3 g | control | whole blood | BS |
| Sholapur et al. (2013) [54] | stem bark | 250 | 11 days | rats, dexa 1 mg/kg | males | 7/7 | 180–200 g | control | plasma | BS, TG, TC |
| Kumar Gupta et al. (2013) [55] | leaves | 100 | 24 weeks | rats, STZ 45 mg/kg | both | 20/20 | 200–250 g | control | whole blood | BS |
| Gupta et al. (2012) [56] | pods | 300 | 21 days | rats, STZ 50 mg/kg | both | 7/7 | 170–230 g | control | serum | BS |
| Kar et al. (2003) [57] | stem bark | 250 | 1 week | rats, alloxan 100 mg/kg | males | 5/5 | 150–200 g | control | serum | BS |
| Subgroups | Effect Size | Heterogeneity (I2) | Test of Group Difference (p) | ||||
|---|---|---|---|---|---|---|---|
| No. of Studies | g | 95% CI | p-Value | ||||
| DM rodent models | |||||||
| Chemical | 29 | −4.65 | −5.51 | −3.78 | <0.001 | 89.80 | 0.00 |
| db/db | 2 | −6.15 | −9.35 | −2.95 | <0.001 | <0.001 | |
| Dexa | 2 | −0.73 | −3.57 | 2.12 | 0.62 | 32.13 | |
| Diet | 11 | −2.13 | −3.44 | −0.82 | 0.001 | 84.82 | |
| Sex | |||||||
| Male | 33 | −4.33 | −5.21 | −3.46 | <0.001 | 89.84 | 0.05 |
| Females | 4 | −1.33 | −3.58 | 0.92 | 0.25 | 42.56 | |
| Both | 6 | −4.27 | −6.37 | −2.16 | <0.001 | 95.15 | |
| Parts | |||||||
| Leaves | 30 | −4.09 | −5.00 | −3.18 | <0.001 | 90.69 | 0.82 |
| Seeds | 6 | −3.38 | −5.36 | −1.39 | 0.001 | 91.12 | |
| Others | 8 | −3.98 | −5.77 | −2.19 | <0.001 | 87.62 | |
| Rodent type | |||||||
| mice | 6 | −3.66 | −5.60 | −1.72 | <0.001 | 91.18 | 0.75 |
| rats | 38 | −4.01 | −4.81 | −3.20 | <0.001 | 90.66 | |
| Blood sample | |||||||
| Plasma | 6 | −4.67 | −6.71 | −2.63 | <0.001 | 93.17 | 0.42 |
| Serum | 13 | −4.71 | −6.18 | −3.24 | <0.001 | 91.18 | |
| Whole blood | 23 | −3.64 | −4.69 | −2.59 | <0.001 | 89.82 | |
| DM Type | Subgroups | Effect Size | Heterogeneity (I2) | Test of Group Difference (p) | ||||
|---|---|---|---|---|---|---|---|---|
| No. of Studies | g | 95% CI | p-Value | |||||
| Chemical-induced | Sex | |||||||
| Males | 20 | −5.78 | −7.12 | −4.44 | <0.001 | 86.71 | 0.06 | |
| Females | 2 | −0.93 | −4.74 | 2.87 | 0.63 | 31.22 | ||
| Both | 6 | −4.64 | −7.11 | −2.16 | <0.001 | 95.15 | ||
| Parts | ||||||||
| Leaves | 21 | −4.46 | −5.74 | −3.17 | <0.001 | 89.79 | 0.15 | |
| Seeds | 3 | −7.40 | −11.06 | −3.74 | <0.001 | 96.35 | ||
| Others | 5 | −6.76 | −9.61 | −3.90 | <0.001 | 87.93 | ||
| Blood sample | ||||||||
| Plasma | 4 | −5.74 | −8.88 | −2.60 | <0.001 | 90.90 | 0.71 | |
| Serum | 6 | −6.37 | −8.98 | −3.66 | <0.001 | 91.36 | ||
| Whole blood | 17 | −5.05 | −6.60 | −3.49 | <0.001 | 90.87 | ||
| Diet-induced | Sex | |||||||
| Males | 9 | −1.73 | −2.77 | −0.68 | 0.001 | 86.98 | 0.98 | |
| Females | 2 | −1.70 | −3.68 | 0.28 | 0.09 | 59.05 | ||
| Parts | ||||||||
| Leaves | 7 | −2.04 | −3.32 | −0.76 | 0.002 | 90.16 | 0.63 | |
| Seeds | 3 | −1.11 | −2.75 | 0.53 | 0.18 | 0.00 | ||
| Others | 1 | −2.32 | −5.30 | 0.65 | 0.13 | 0.00 | ||
| Blood sample | ||||||||
| Serum | 4 | −3.15 | −5.06 | −1.24 | 0.001 | 94.47 | 0.10 | |
| Whole blood | 7 | −1.29 | −2.36 | −0.25 | 0.02 | 47.90 | ||
| Subgroups | Effect Size | Heterogeneity (I2) | Test of Group Difference (p) | ||||
|---|---|---|---|---|---|---|---|
| No. of Studies | g | 95% CI | p-Value | ||||
| DM rodent models | |||||||
| Chemical | 9 | 0.85 | −0.11 | 1.82 | 0.084 | 71.63 | 0.03 |
| db/db | 1 | 4.98 | 1.64 | 8.31 | 0.003 | 0.00 | |
| Diet | 4 | 2.33 | 0.82 | 3.84 | 0.002 | 82.86 | |
| Sex | |||||||
| Males | 9 | 1.63 | 0.48 | 2.78 | 0.005 | 81.02 | 0.42 |
| Females | 3 | 2.30 | 0.33 | 4.26 | 0.022 | 83.18 | |
| Both | 2 | 0.30 | −1.97 | 2.58 | 0.794 | 61.19 | |
| MO parts | |||||||
| Leaves | 11 | 1.60 | 0.59 | 2.61 | 0.00 | 76.47 | ND |
| Others | 3 | 1.39 | −0.56 | 3.34 | 0.16 | 90.53 | |
Publisher’s Note: MDPI stays neutral with regard to jurisdictional claims in published maps and institutional affiliations. |
© 2021 by the authors. Licensee MDPI, Basel, Switzerland. This article is an open access article distributed under the terms and conditions of the Creative Commons Attribution (CC BY) license (https://creativecommons.org/licenses/by/4.0/).
Share and Cite
Watanabe, S.; Okoshi, H.; Yamabe, S.; Shimada, M. Moringa oleifera Lam. in Diabetes Mellitus: A Systematic Review and Meta-Analysis. Molecules 2021, 26, 3513. https://doi.org/10.3390/molecules26123513
Watanabe S, Okoshi H, Yamabe S, Shimada M. Moringa oleifera Lam. in Diabetes Mellitus: A Systematic Review and Meta-Analysis. Molecules. 2021; 26(12):3513. https://doi.org/10.3390/molecules26123513
Chicago/Turabian StyleWatanabe, Shihori, Hiyori Okoshi, Shizuko Yamabe, and Masako Shimada. 2021. "Moringa oleifera Lam. in Diabetes Mellitus: A Systematic Review and Meta-Analysis" Molecules 26, no. 12: 3513. https://doi.org/10.3390/molecules26123513
APA StyleWatanabe, S., Okoshi, H., Yamabe, S., & Shimada, M. (2021). Moringa oleifera Lam. in Diabetes Mellitus: A Systematic Review and Meta-Analysis. Molecules, 26(12), 3513. https://doi.org/10.3390/molecules26123513