
The Stool Volatile Metabolome of Pre-Term Babies

 , , , , , and
Abstract
1. Introduction
2. Results
2.1. Patients Demographics
2.2. Metabolomic Profile of Stool Samples from Pre-Term Babies
3. Discussion
4. Materials and Methods
4.1. Patients
4.2. Extraction of VOCs
4.3. Downstream Data Processing and Analysis
5. Conclusions
Author Contributions
Funding
Institutional Review Board Statement
Informed Consent Statement
Data Availability Statement
Conflicts of Interest
Sample Availability
Appendix A

| Prevalence in Each Age Group (%) | Mean Prevalence (%) | ||||
|---|---|---|---|---|---|
| G1 | G2 | G3 | G4 | ||
| Acetic acid | 88.9 | 86.4 | 92.9 | 94.1 | 90.8 |
| Hexanal | 100.0 | 86.4 | 91.1 | 82.4 | 88.8 |
| Nonanal | 66.7 | 68.2 | 87.5 | 94.1 | 80.9 |
| Isovaleraldehyde | 88.9 | 77.3 | 78.6 | 76.5 | 78.9 |
| Heptanal | 66.7 | 63.6 | 82.1 | 85.3 | 75.7 |
| 2,3-butanedione | 11.1 | 63.6 | 85.7 | 94.1 | 72.4 |
| Octanal | 77.8 | 54.5 | 71.4 | 91.2 | 71.7 |
| 2-methylbutyraldehyde | 66.7 | 63.6 | 73.2 | 70.6 | 69.1 |
| 4-heptanone | 55.6 | 70.5 | 69.6 | 73.5 | 69.1 |
| 2-pentylfuran | 72.2 | 61.4 | 69.6 | 73.5 | 68.4 |
| Isovaleric acid | 16.7 | 70.5 | 69.6 | 70.6 | 63.8 |
| 1-octen-3-ol | 66.7 | 56.8 | 60.7 | 76.5 | 63.8 |
| 6-methyl-5-hepten-2-one | 33.3 | 59.1 | 66.1 | 82.4 | 63.8 |
| 2-ethylhexanol | 50.0 | 59.1 | 60.7 | 70.6 | 61.2 |
| 2-heptanone | 66.7 | 59.1 | 62.5 | 52.9 | 59.9 |
| Propanol | 0.0 | 38.6 | 78.6 | 88.2 | 59.9 |
| 1-pentanol | 61.1 | 54.5 | 51.8 | 64.7 | 56.6 |
| 2-methylbutanoic acid | 16.7 | 61.4 | 50.0 | 73.5 | 54.6 |
| Propionic acid | 38.9 | 40.9 | 64.3 | 58.8 | 53.3 |
| Acetoin | 5.6 | 54.5 | 60.7 | 61.8 | 52.6 |
| Benzaldehyde | 38.9 | 45.5 | 42.9 | 76.5 | 50.7 |
| Phenylacetaldehyde | 11.1 | 38.6 | 55.4 | 70.6 | 48.7 |
| Acetone | 16.7 | 54.5 | 48.2 | 41.2 | 44.7 |
| Butanoic acid | 11.1 | 31.8 | 48.2 | 61.8 | 42.1 |
| Propyl propionate | 0.0 | 11.4 | 57.1 | 67.6 | 39.5 |
| Methoxy-phenyl-oxime | 44.4 | 27.3 | 37.5 | 52.9 | 38.8 |
| Ethyl acetate | 0.0 | 27.3 | 48.2 | 55.9 | 38.2 |
| Propyl acetate | 0.0 | 13.6 | 53.6 | 64.7 | 38.2 |
| Ethanol | 0.0 | 43.2 | 48.2 | 35.3 | 38.2 |
| Isobutyraldehyde | 16.7 | 36.4 | 37.5 | 47.1 | 36.8 |
| Ethyl propionate | 5.6 | 13.6 | 44.6 | 58.8 | 34.2 |
| 1,4-xylene | 11.1 | 43.2 | 41.1 | 20.6 | 33.6 |
| 1-hexanol | 27.8 | 38.6 | 33.9 | 29.4 | 33.6 |
| D-limonene | 0.0 | 22.7 | 39.3 | 47.1 | 31.6 |
| Ethylbenzene | 27.8 | 29.5 | 28.6 | 38.2 | 30.9 |
| 2-ethylfuran | 33.3 | 25.0 | 25.0 | 26.5 | 26.3 |
| Common Name | IUPAC Name | CID Number |
|---|---|---|
| Acetic acid | Acetic acid | 176 |
| Propionic acid | Propanoic acid | 1032 |
| Butanoic acid | Butanoic acid | 264 |
| 2-methylbutanoic acid | 2-methylbutanoic acid | 8314 |
| Isovaleric acid | 3-methylbutanoic acid | 10,430 |
| Isovaleraldehyde | 3-methylbutanal | 11,552 |
| 2-methylbutyraldehyde | 2-methylbutanal | 7284 |
| Isobutyraldehyde | 2-methylpropanal | 6561 |
| Ethyl acetate | Ethyl acetate | 8857 |
| Propyl acetate | Propyl acetate | 7997 |
| Ethyl propionate | Ethyl propanoate | 7749 |
| Propyl propionate | Propyl propanoate | 7803 |
| Hexanal | Hexanal | 6184 |
| Heptanal | Heptanal | 8130 |
| Octanal | Octanal | 454 |
| Nonanal | Nonanal | 31,289 |
| Benzaldehyde | Benzaldehyde | 240 |
| Phenylacetaldehyde | 2-phenylacetaldehyde | 998 |
| Ethanol | Ethanol | 702 |
| Propanol | Propan-1-ol | 1031 |
| 1-pentanol | Pentan-1-ol | 6276 |
| 1-hexanol | Hexan-1-ol | 8103 |
| 1-octen-3-ol | Oct-1-en-3-ol | 18,827 |
| 2-ethylhexanol | 2-ethylhexan-1-ol | 7720 |
| Acetone | Propan-2-one | 180 |
| 2-heptanone | Heptan-2-one | 8051 |
| 4-heptanone | Heptan-4-one | 31,246 |
| 6-methyl-5-hepten-2-one | 6-methylhept-5-en-2-one | 9862 |
| Acetoin | 3-hydroxybutan-2-one | 179 |
| 2,3-butanedione | Butane-2,3-dione | 650 |
| 2-ethylfuran | 2-ethylfuran | 18,554 |
| 2-pentylfuran | 2-pentylfuran | 19,602 |
| D-limonene | (4R)-1-methyl-4-prop-1-en-2-ylcyclohexene | 440,917 |
| Methoxy-phenyl-oxime | methyl (Z)-N-hydroxybenzenecarboximidate | 9,602,988 |
| 1,4-xylene | 1,4-xylene | 7809 |
| Ethylbenzene | Ethylbenzene | 7500 |
References
- Underwood, M.A.; Gilbert, W.M.; Sherman, M.P. Amniotic fluid: Not just fetal urine anymore. J. Perinatol. 2005, 25, 341–348. [Google Scholar] [CrossRef] [PubMed]
- Collado, M.C.; Rautava, S.; Aakko, J.; Isolauri, E.; Salminen, S. Human gut colonisation may be initiated in utero by distinct microbial communities in the placenta and amniotic fluid. Sci. Rep. 2016, 6, 23129. [Google Scholar] [CrossRef]
- Minet-Quinard, R.; Ughetto, S.; Gallot, D.; Bouvier, D.; Lemery, D.; Goncalves-Menses, N.; Blanchon, L.; Sapin, V. Volatile organic compounds in amniotic fluid during normal human pregnancy. Placenta 2014, 35, A19. [Google Scholar] [CrossRef]
- Hunt, K.M.; Foster, J.A.; Forney, L.J.; Schütte, U.M.E.; Beck, D.L.; Abdo, Z.; Fox, L.K.; Williams, J.E.; McGuire, M.K.; McGuire, M.A. Characterization of the diversity and temporal stability of bacterial communities in human milk. PLoS ONE 2011, 6, e21313. [Google Scholar] [CrossRef]
- Huurre, A.; Kalliomäki, M.; Rautava, S.; Rinne, M.; Salminen, S.; Isolauri, E. Mode of Delivery—Effects on Gut Microbiota and Humoral Immunity. Neonatology 2008, 93, 236–240. [Google Scholar] [CrossRef]
- De Lacy Costello, B.; Ewen, R.; Ewer, A.K.; Garner, C.E.; Probert, C.S.J.; Ratcliffe, N.M.; Smith, S. An analysis of volatiles in the headspace of the faeces of neonates. J. Breath Res. 2008, 2, 037023. [Google Scholar] [CrossRef] [PubMed]
- Garner, C.E.; Ewer, A.K.; Elasouad, K.; Power, F.; Greenwood, R.; Ratcliffe, N.M.; Costello, B.D.L.; Probert, C.S. Analysis of Faecal Volatile Organic Compounds in Preterm Infants Who Develop Necrotising Enterocolitis: A Pilot Study. J. Pediatr. Gastroenterol. Nutr. 2009, 49, 559–565. [Google Scholar] [CrossRef] [PubMed]
- De Meij, T.G.J.; Van Der Schee, M.P.C.; Berkhout, D.J.C.; Van De Velde, M.E.; Jansen, A.E.; Kramer, B.W.; Van Weissenbruch, M.M.; Van Kaam, A.H.; Andriessen, P.; Van Goudoever, J.B.; et al. Early Detection of Necrotizing Enterocolitis by Fecal Volatile Organic Compounds Analysis. J. Pediatr. 2015, 167, 562–567.e1. [Google Scholar] [CrossRef]
- Embleton, N.D.; Berrington, J.E.; Dorling, J.; Ewer, A.K.; Juszczak, E.; Kirby, J.A.; Lamb, C.A.; Lanyon, C.V.; McGuire, W.; Probert, C.S.; et al. Mechanisms Affecting the Gut of Preterm Infants in Enteral Feeding Trials. Front. Nutr. 2017, 4, 14. [Google Scholar] [CrossRef]
- Combet, E.; Henderson, J.; Eastwood, D.C.; Burton, K.S. Eight-carbon volatiles in mushrooms and fungi: Properties, analysis, and biosynthesis. Mycoscience 2006, 47, 317–326. [Google Scholar] [CrossRef]
- Hung, R.; Lee, S.; Bennett, J.W. Fungal volatile organic compounds and their role in ecosystems. Appl. Microbiol. Biotechnol. 2015, 99, 3395–3405. [Google Scholar] [CrossRef] [PubMed]
- Chambers, S.T.; Syhre, M.; Murdoch, D.R.; McCartin, F.; Epton, M.J. Detection of 2-Pentylfuran in the breath of patients with Aspergillus fumigatus. Med. Mycol. 2009, 47, 468–476. [Google Scholar] [CrossRef] [PubMed]
- Sasaki, K.; Sasaki, D.; Okai, N.; Tanaka, K.; Nomoto, R.; Fukuda, I.; Yoshida, K.; Kondo, A.; Osawa, R. Taurine does not affect the composition, diversity, or metabolism of human colonic microbiota simulated in a single-batch fermentation system. PLoS ONE 2017, 12, e0180991. [Google Scholar] [CrossRef]
- Fritz, K.S.; Petersen, D.R. An overview of the chemistry and biology of reactive aldehydes. Free Radic. Biol. Med. 2013, 59, 85–91. [Google Scholar] [CrossRef]
- Rizzo, W.B. Fatty aldehyde and fatty alcohol metabolism: Review and importance for epidermal structure and function. Biochim. Biophys. Acta Mol. Cell Biol. Lipids 2014, 1841, 377–389. [Google Scholar] [CrossRef] [PubMed]
- Engels, W.J.M.; Alting, A.C.; Arntz, M.M.T.G.; Gruppen, H.; Voragen, A.G.J.; Smit, G.; Visser, S. Partial purification and characterization of two aminotransferases from Lactococcus lactis subsp. cremoris B78 involved in the catabolism of methionine and branched-chain amino acids. Int. Dairy J. 2000, 10, 443–452. [Google Scholar] [CrossRef]
- Smit, B.A.; Engels, W.J.M.; Smit, G. Branched chain aldehydes: Production and breakdown pathways and relevance for flavour in foods. Appl. Microbiol. Biotechnol. 2009, 81, 987–999. [Google Scholar] [CrossRef]
- El Hadi, M.A.M.; Zhang, F.J.; Wu, F.F.; Zhou, C.H.; Tao, J. Advances in fruit aroma volatile research. Molecules 2013, 18, 8200–8229. [Google Scholar] [CrossRef]
- Garner, C.E.; Smith, S.; de Lacy Costello, B.; White, P.; Spencer, R.; Probert, C.S.J.; Ratcliffe, N.M. Volatile organic compounds from feces and their potential for diagnosis of gastrointestinal disease. FASEB J. 2007, 21, 1675–1688. [Google Scholar] [CrossRef]
- Shao, Y.; Forster, S.C.; Tsaliki, E.; Vervier, K.; Strang, A.; Simpson, N.; Kumar, N.; Stares, M.D.; Rodger, A.; Brocklehurst, P.; et al. Stunted microbiota and opportunistic pathogen colonization in caesarean-section birth. Nature 2019, 574, 117–121. [Google Scholar] [CrossRef]
- Heisel, T.; Nyaribo, L.; Sadowsky, M.J.; Gale, C.A. Breastmilk and NICU surfaces are potential sources of fungi for infant mycobiomes. Fungal Genet. Biol. 2019, 128, 29–35. [Google Scholar] [CrossRef] [PubMed]
- Rao, C.; Coyte, K. Multi-kingdom ecological drivers of microbiota assemby in preterm infants. Nature 2021. [Google Scholar] [CrossRef] [PubMed]
- Cilieborg, M.S.; Boye, M.; Sangild, P.T. Bacterial colonization and gut development in preterm neonates. Early Hum. Dev. 2012, 88, S41–S49. [Google Scholar] [CrossRef]
- Reade, S.; Mayor, A.; Aggio, R.; Khalid, T.; Pritchard, D.; Ewer, A.; Probert, C. Optimisation of Sample Preparation for Direct SPME-GC-MS Analysis of Murine and Human Faecal Volatile Organic Compounds for Metabolomic Studies. J. Anal. Bioanal. Tech. 2014, 5. [Google Scholar] [CrossRef]
- Aggio, R.; Villas-Bôas, S.G.; Ruggiero, K. Metab: An R package for high-throughput analysis of metabolomics data generated by GC-MS. Bioinformatics 2011, 27, 2316–2318. [Google Scholar] [CrossRef] [PubMed]
- Henri, A.; Favre, W.H.P. Nomenclature of Organic Chemistry: IUPAC Recommendations and Preferred Names 2013; Royal Society of Chemistry: Cambridge, UK, 2014. [Google Scholar]
- R Core Team. R: A Language And Environment for Statistical Computing. Vienna, Austria. 2020. Available online: https://www.R-project.org/ (accessed on 27 May 2021).
- RStudio Team. RStudio: Integrated Development for R; RStudio, PBC: Boston, MA, USA,, 2020; Available online: http://www.rstudio.com/ (accessed on 27 May 2021).
- Oksanen, J.; Blanchet, F.G.; Kindt, R.; Legendre, P.; Minchin, P.R.; O’Hara, R.B.; Simpson, G.L.; Solymos, P.; Henry, M.; Stevens, M.H.H.; et al. Package ‘Vegan’: Community Ecology Package. 2015. Available online: https://cran.r-project.org/web/packages/vegan/index.html (accessed on 27 May 2021).
- Bates, D.; Mächler, M.; Bolker, B.M.; Walker, S.C. Fitting linear mixed-effects models using lme4. J. Stat. Softw. 2015, 67, 1–48. [Google Scholar] [CrossRef]
- Wickham, H. ggplot2: Elegant Graphics for Data Analysis; Springer: New York, NY, USA, 2016; ISBN 978-0-387-98141-3. [Google Scholar]


| Median | Range | |
|---|---|---|
| Gestational age (weeks) | 29 | 23–31 + 6 d |
| Birthweight (g) | 1095 | 585–1820 |
| Samples per donor | 3 | 2–6 |
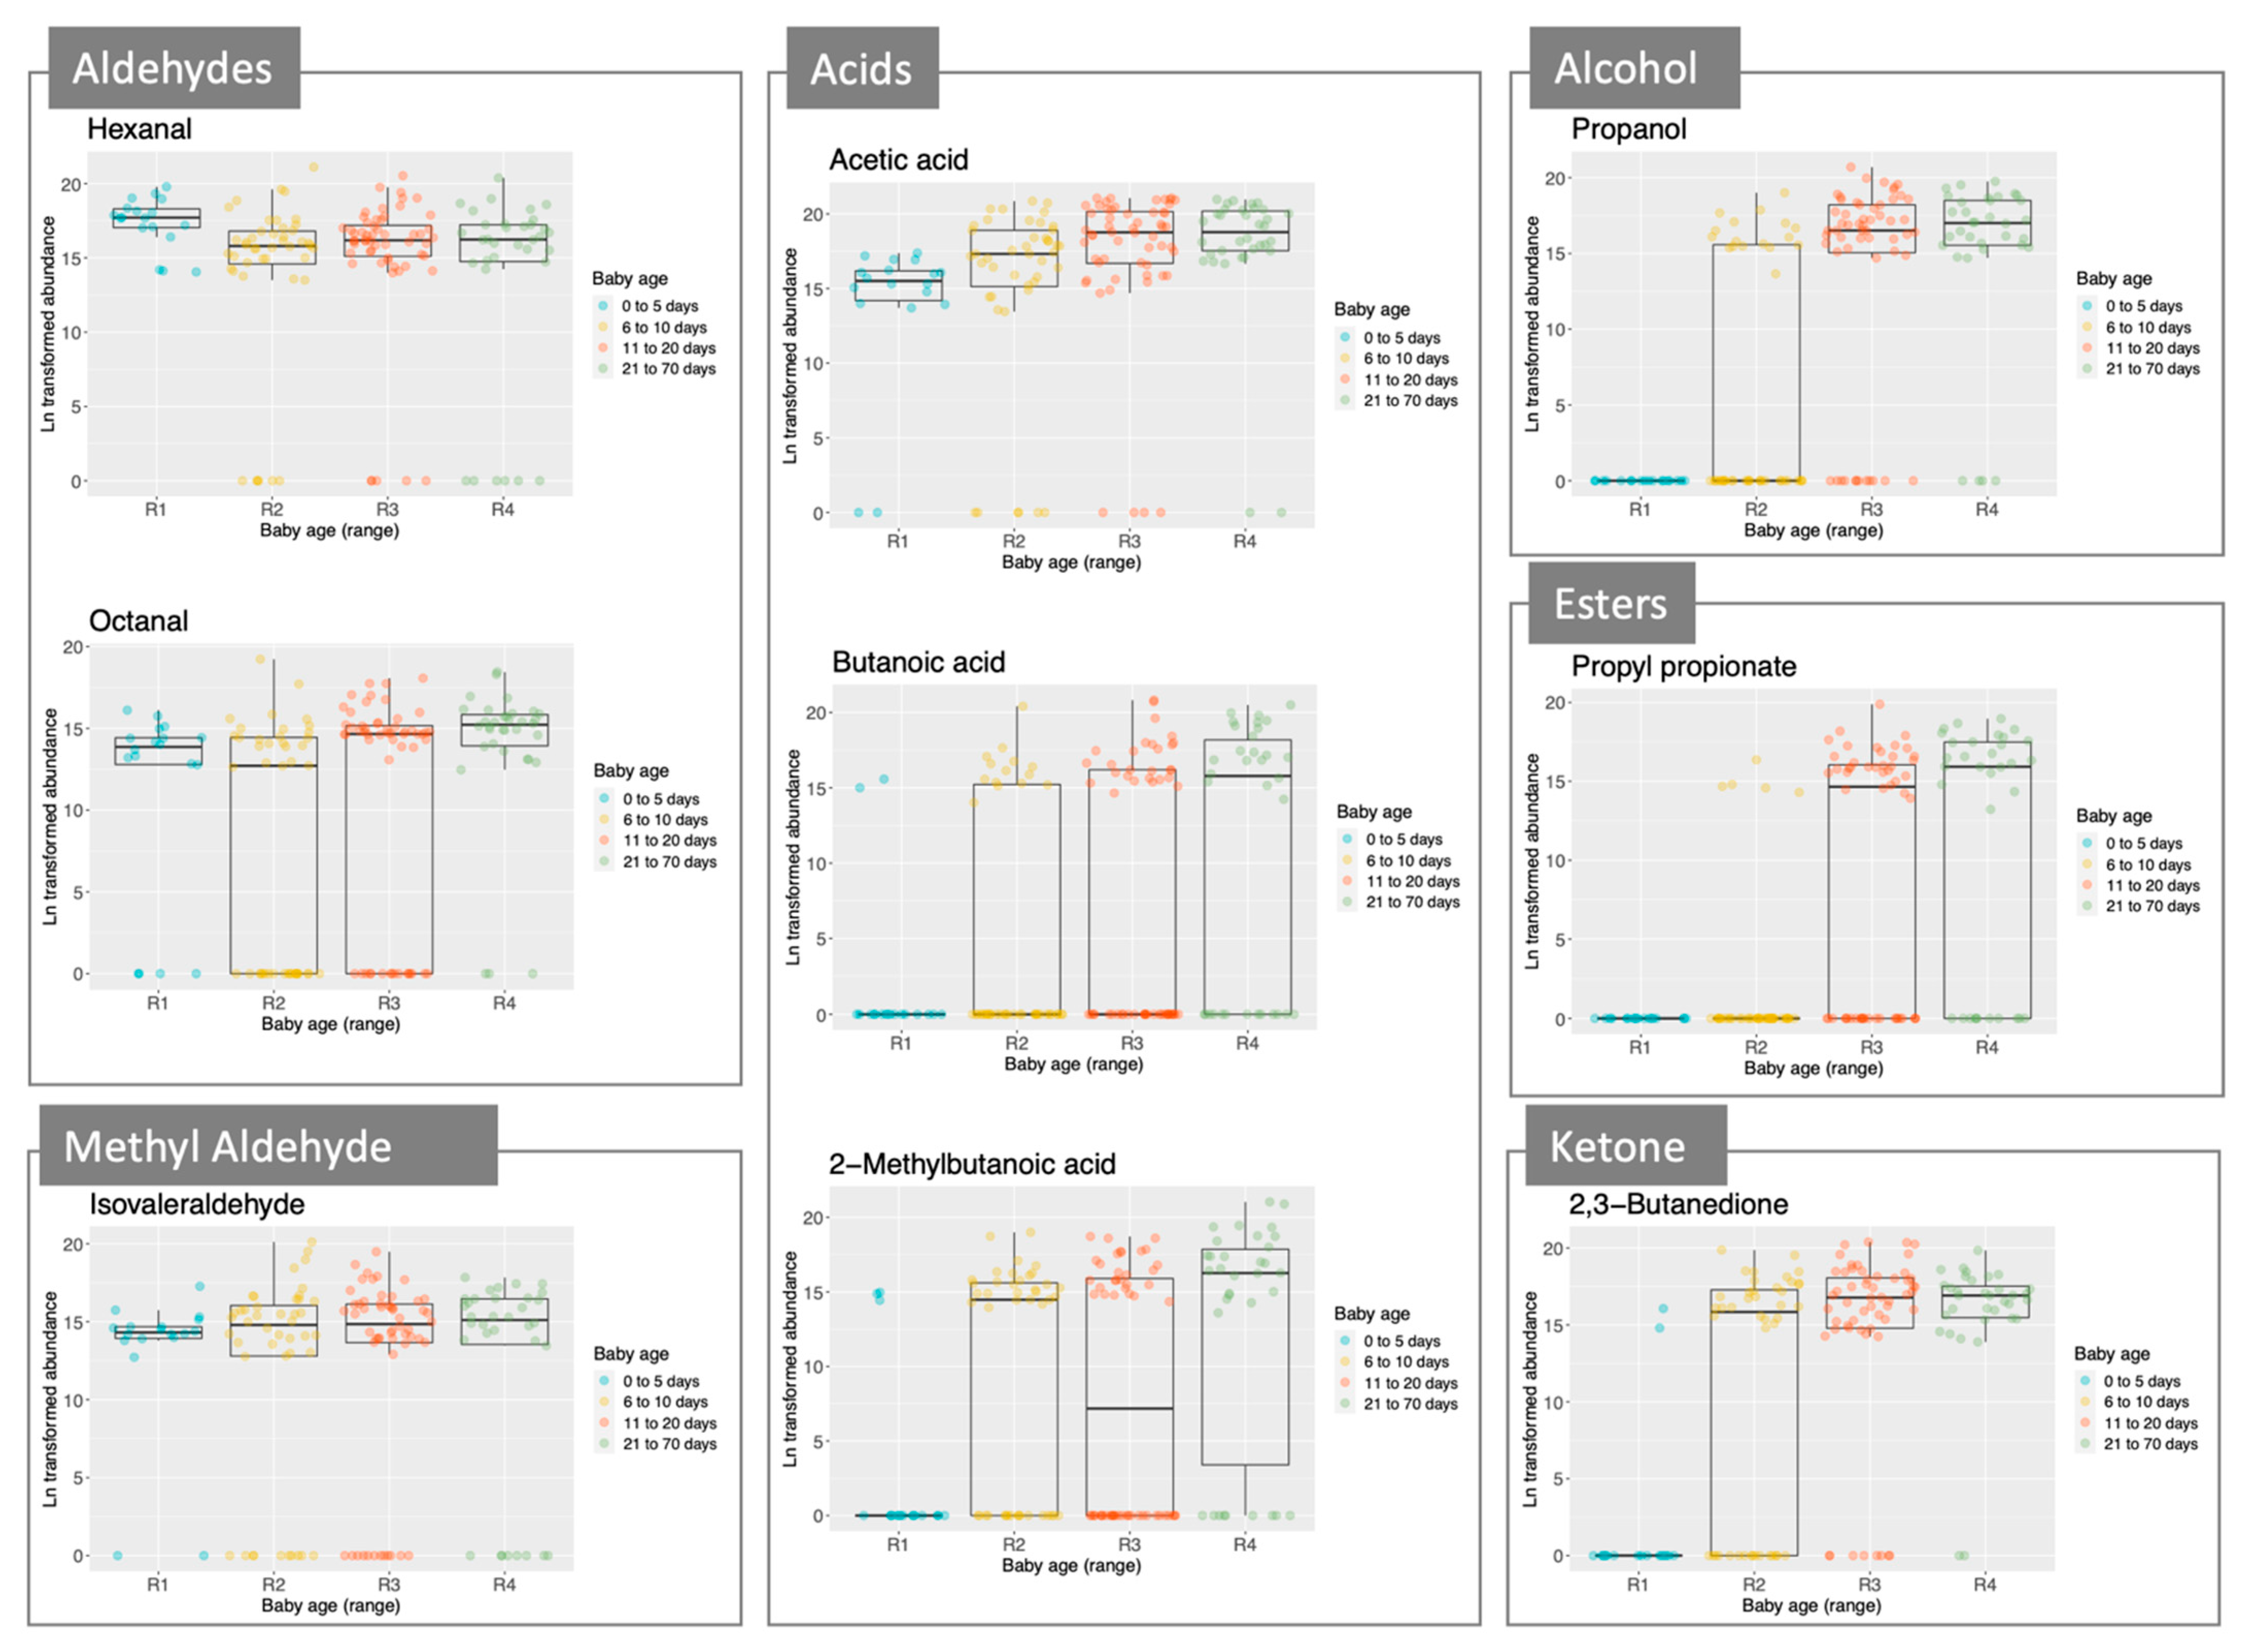
| Short Chain Fatty Acids | Branched Chain Fatty Acids | Methylated Aldehydes | Esters |
| Acetic acid | 2-methylbutanoic acid | Isovaleraldehyde | Ethyl acetate |
| Propionic acid | Isovaleric acid | 2-methylbutyraldehyde | Propyl acetate |
| Butanoic acid | Isobutyraldehyde | Ethyl propionate | |
| Propyl propionate | |||
| Aldehydes | Alcohols | Ketones/Diketones | Others |
| Hexanal | Ethanol | 2-heptanone | 2-ethylfuran |
| Heptanal | Propanol | 4-heptanone | 2-pentylfuran |
| Octanal | 1-pentanol | 6-methyl-5-hepten-2-one | D-limonene |
| Nonanal | 1-hexanol | Acetoin | Methoxy-phenyl-oxime |
| Benzaldehyde | 1-octen-3-ol | 2,3-butanedione | 1,4-xylene |
| Phenylacetaldehyde | 2-ethylhexanol | Ethylbenzene |
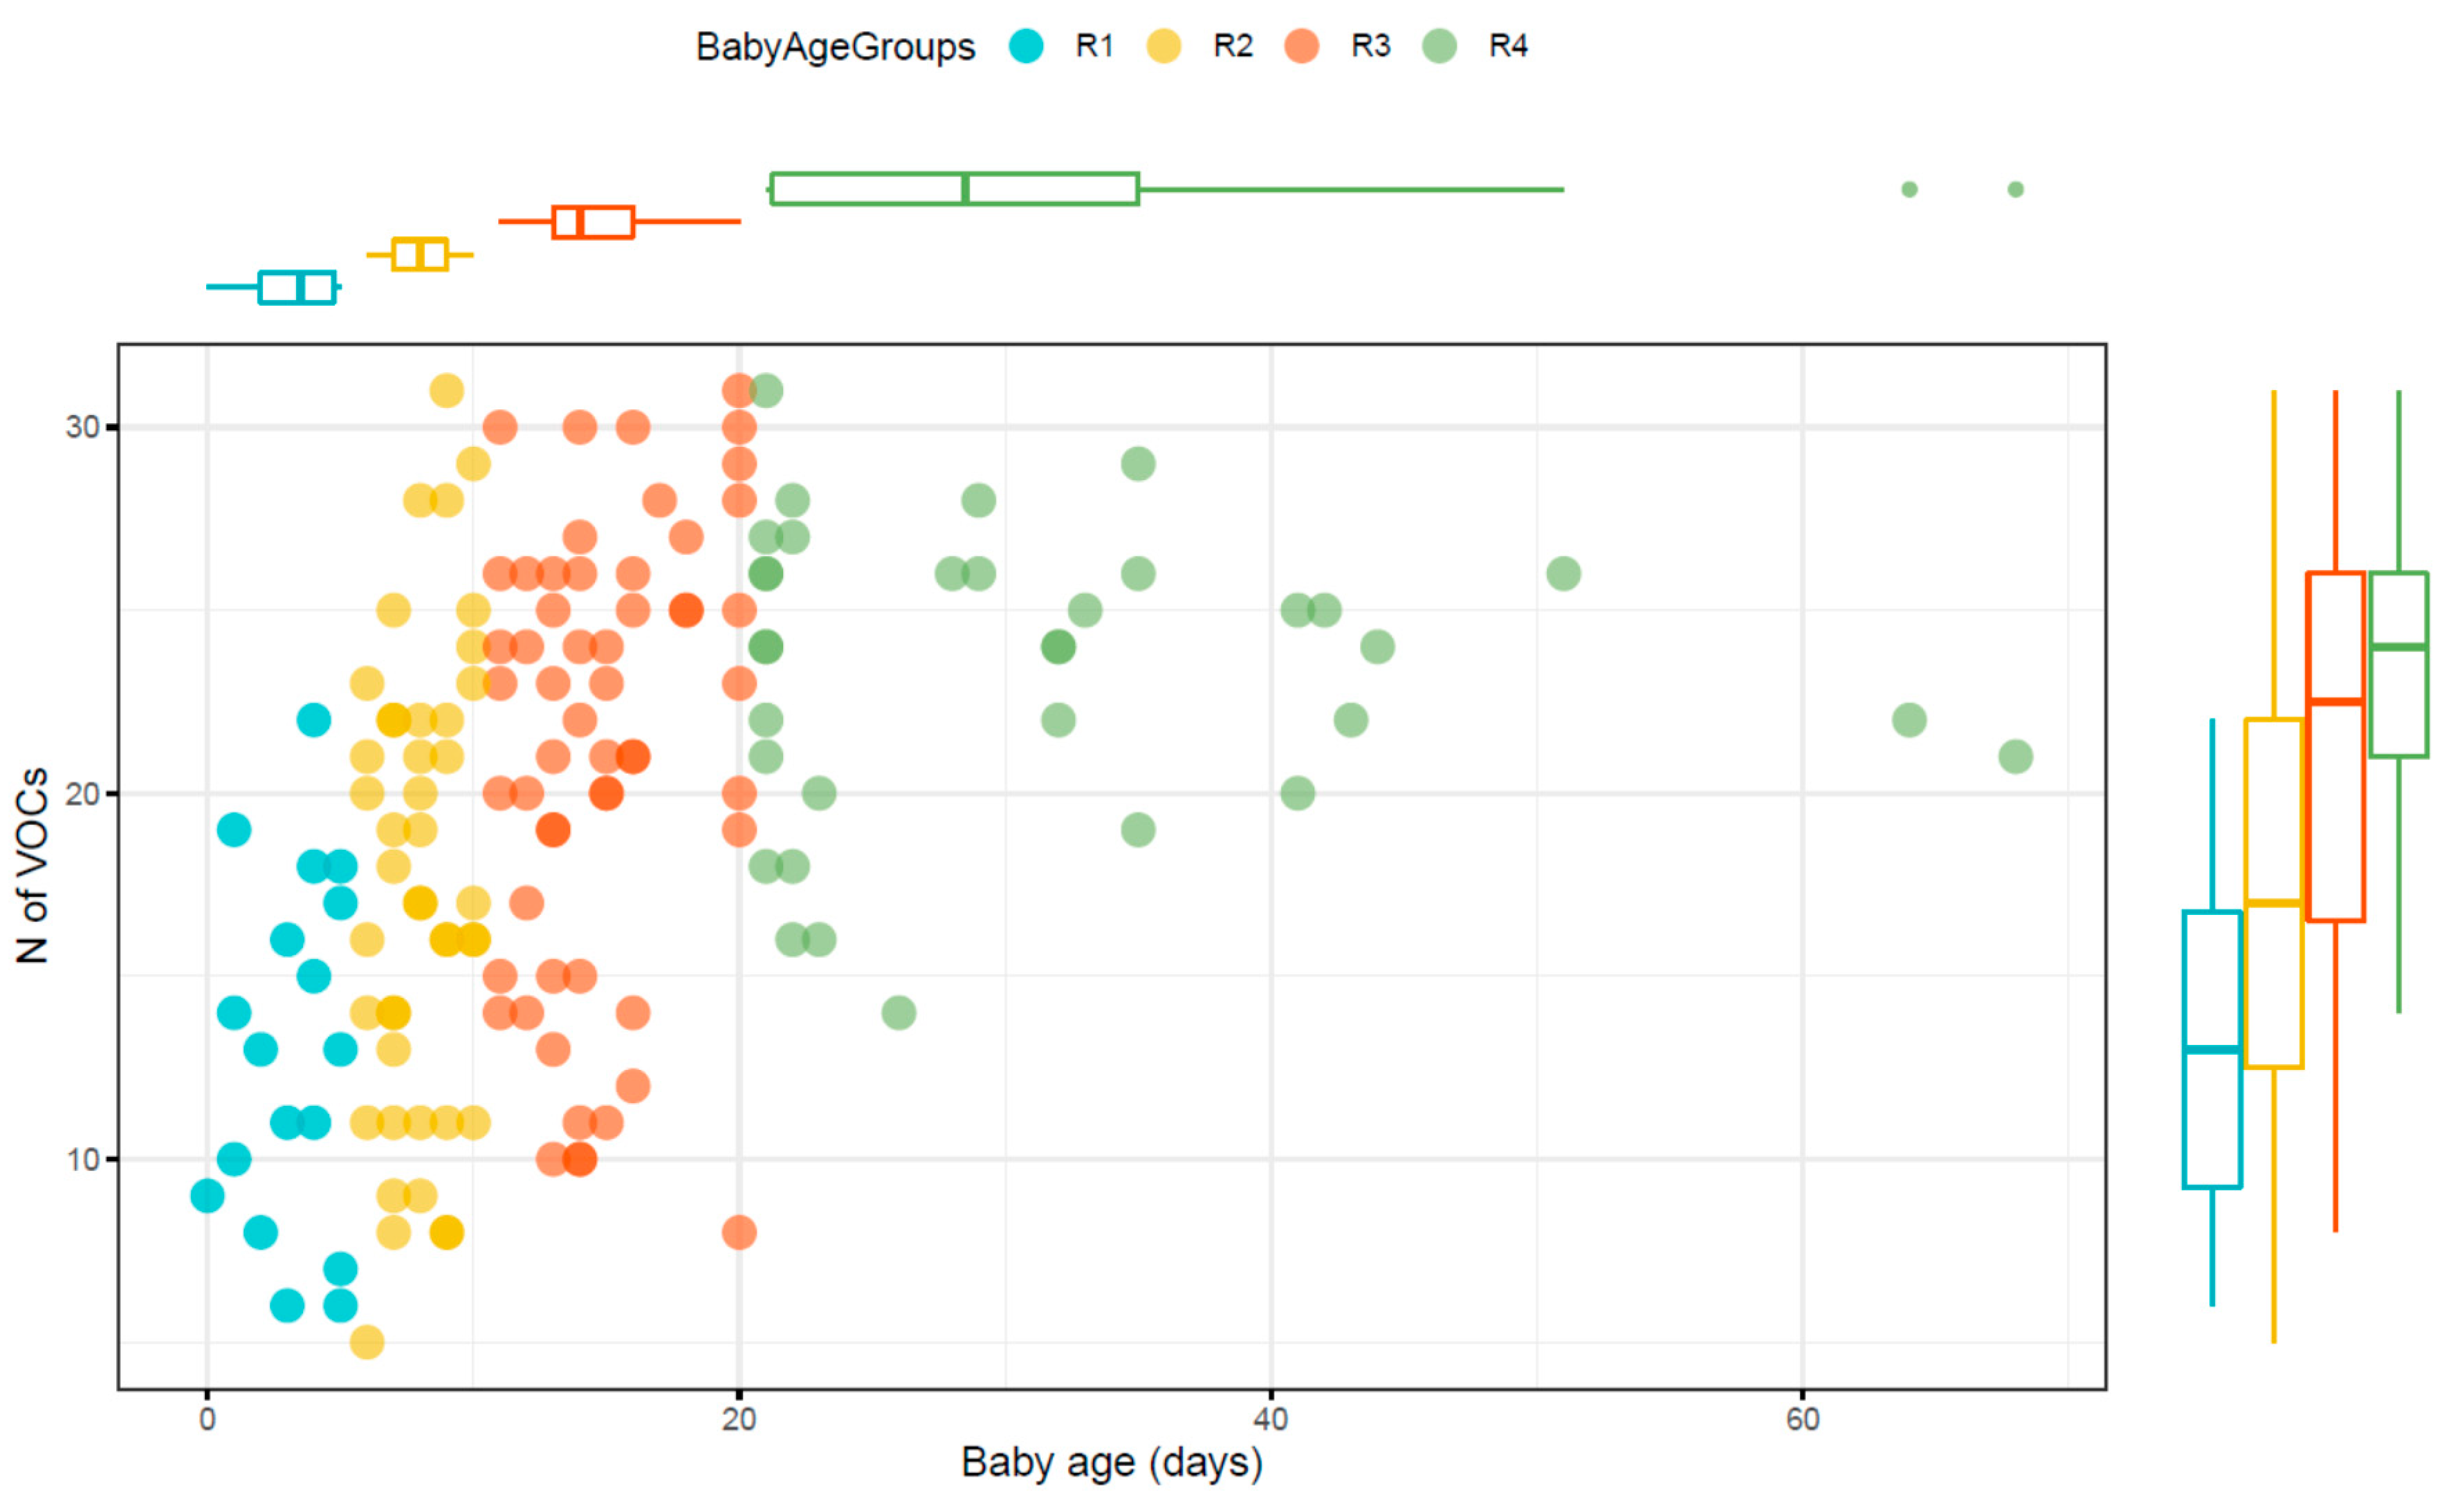
| Age Range (d) | Number Samples | Median Number of VOCs (Range) | |
|---|---|---|---|
| Samples from R1 | 0–5 | 18 | 13 (6–22) |
| Samples from R2 | 6–10 | 44 | 17 (8–31) |
| Samples from R3 | 11–20 | 56 | 22.5 (8–30) |
| Samples from R4 | 21–70 | 34 | 24 (13–31) |
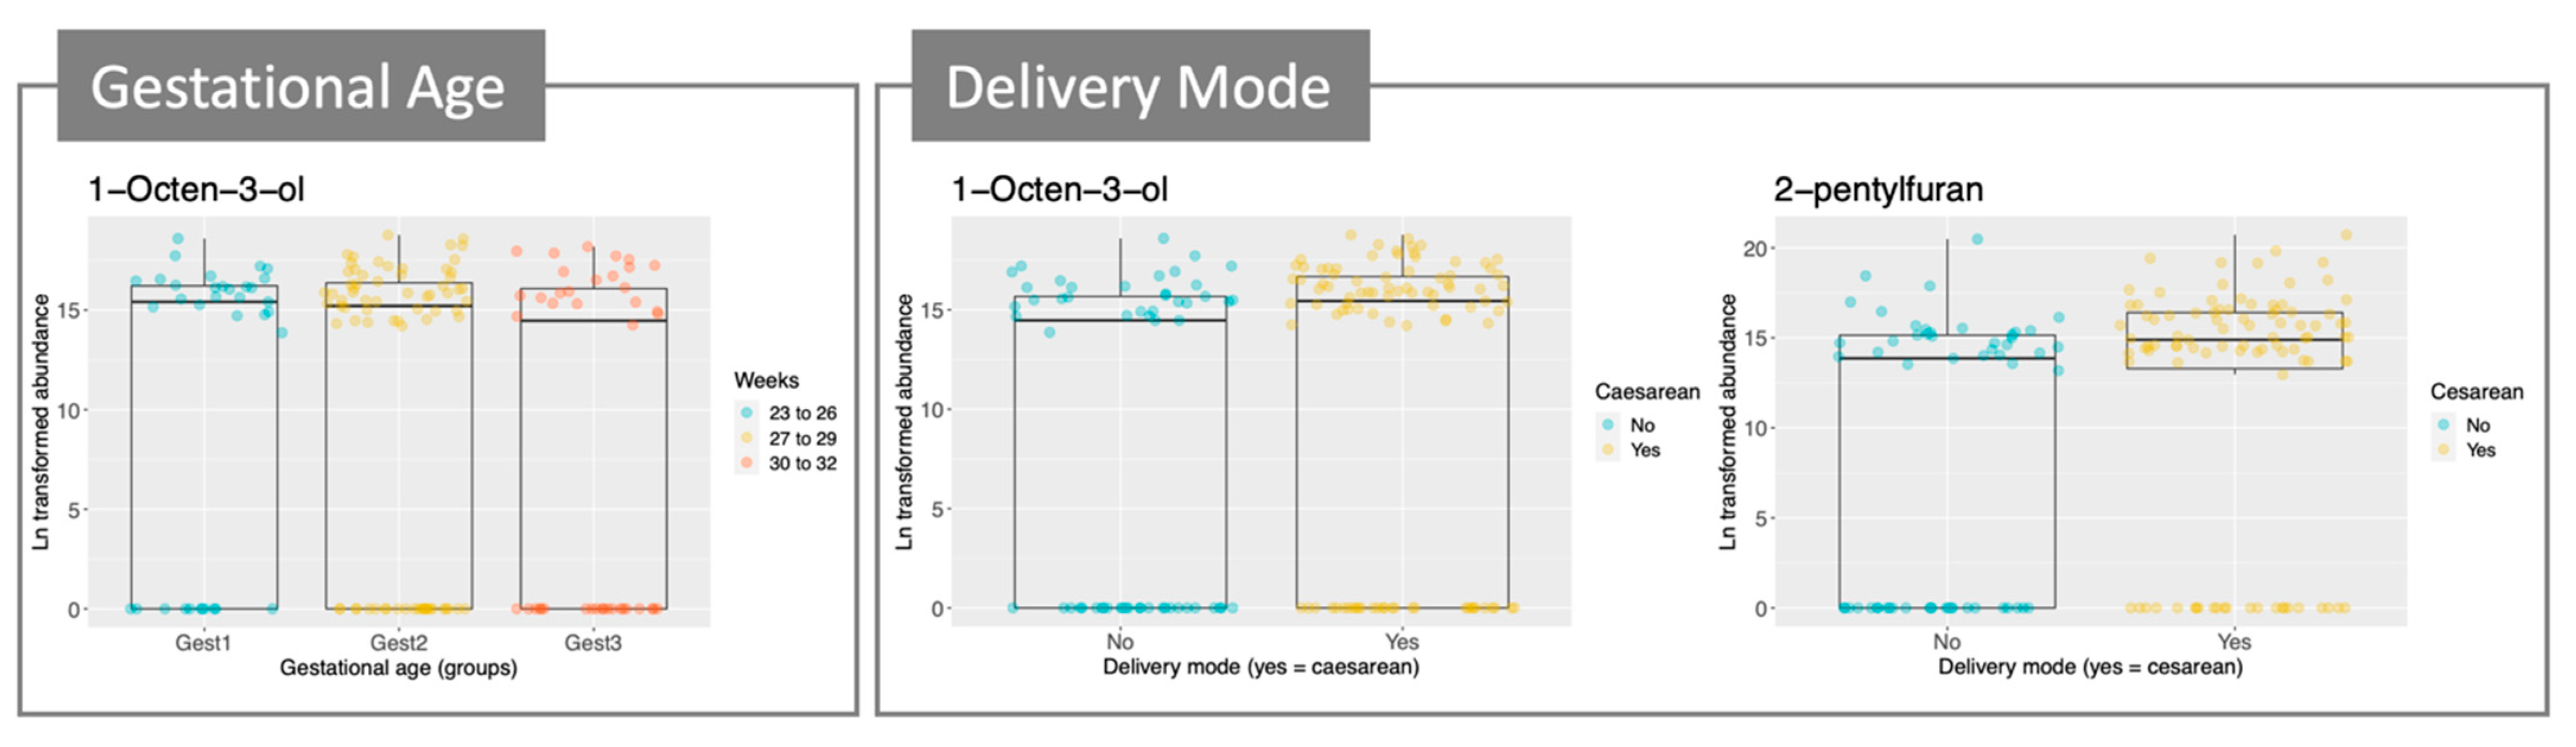
| Compound | Postnatal Age (Days) | Gestational Age (Weeks) | Delivery Mode | |||
|---|---|---|---|---|---|---|
| Slope | p-Value | Parameter | p-Value | Parameter | p-Value | |
| Short chain fatty acids | ||||||
| Butanoic acid | 0.28 | *** | − | − | − | − |
| Acetic acid | 0.08 | * | − | − | − | − |
| Propionic acid | 0.15 | * | − | − | − | − |
| Branched chain fatty acids | ||||||
| Isovaleric acid | 0.2 | ** | − | − | − | − |
| 2-methylbutanoic acid | 0.24 | *** | − | − | − | − |
| Esters | ||||||
| Ethyl acetate | 0.19 | ** | 0.87 | * | −4.07 | * |
| Propyl acetate | 0.36 | *** | 1.15 | * | − | − |
| Ethyl propionate | 0.27 | *** | 0.88 | * | − | − |
| Propyl propionate | 0.36 | *** | 1.02 | * | − | − |
| Aldehydes | ||||||
| Heptanal | 0.11 | * | − | − | − | − |
| Octanal | 0.13 | * | − | − | 3.17 | * |
| Nonanal | 0.14 | ** | − | − | − | − |
| Benzaldehyde | 0.15 | ** | − | − | − | − |
| Phenylacetaldehyde | 0.2 | *** | − | − | − | − |
| Alcohols | ||||||
| Propanol | 0.38 | *** | − | − | − | − |
| 1-octen-3-ol | − | − | −0.76 | * | 3.45 | ** |
| Ketones/diketones | ||||||
| 2-heptanone | − | − | − | − | 3.95 | ** |
| 4-heptanone | − | − | −1.38 | *** | − | − |
| 6-methyl-5-hepten-2-one | 0.18 | *** | − | − | − | − |
| Acetoin | 0.18 | ** | − | − | − | − |
| 2,3-butanedione | 0.27 | *** | − | − | − | − |
| Others | ||||||
| 2-ethylfuran | − | − | − | − | 2.66 | * |
| 2-pentylfuran | − | − | − | − | 4.11 | ** |
| Methoxy-phenyl-oxime | 0.15 | ** | − | − | − | − |
Publisher’s Note: MDPI stays neutral with regard to jurisdictional claims in published maps and institutional affiliations. |
© 2021 by the authors. Licensee MDPI, Basel, Switzerland. This article is an open access article distributed under the terms and conditions of the Creative Commons Attribution (CC BY) license (https://creativecommons.org/licenses/by/4.0/).
Share and Cite
Frau, A.; Lett, L.; Slater, R.; Young, G.R.; Stewart, C.J.; Berrington, J.; Hughes, D.M.; Embleton, N.; Probert, C. The Stool Volatile Metabolome of Pre-Term Babies. Molecules 2021, 26, 3341. https://doi.org/10.3390/molecules26113341
Frau A, Lett L, Slater R, Young GR, Stewart CJ, Berrington J, Hughes DM, Embleton N, Probert C. The Stool Volatile Metabolome of Pre-Term Babies. Molecules. 2021; 26(11):3341. https://doi.org/10.3390/molecules26113341
Chicago/Turabian StyleFrau, Alessandra, Lauren Lett, Rachael Slater, Gregory R. Young, Christopher J. Stewart, Janet Berrington, David M. Hughes, Nicholas Embleton, and Chris Probert. 2021. "The Stool Volatile Metabolome of Pre-Term Babies" Molecules 26, no. 11: 3341. https://doi.org/10.3390/molecules26113341
APA StyleFrau, A., Lett, L., Slater, R., Young, G. R., Stewart, C. J., Berrington, J., Hughes, D. M., Embleton, N., & Probert, C. (2021). The Stool Volatile Metabolome of Pre-Term Babies. Molecules, 26(11), 3341. https://doi.org/10.3390/molecules26113341