
The Isoelectric Point of an Exotic Oxide: Tellurium (IV) Oxide


Abstract
:1. Introduction
2. Results and Discussion
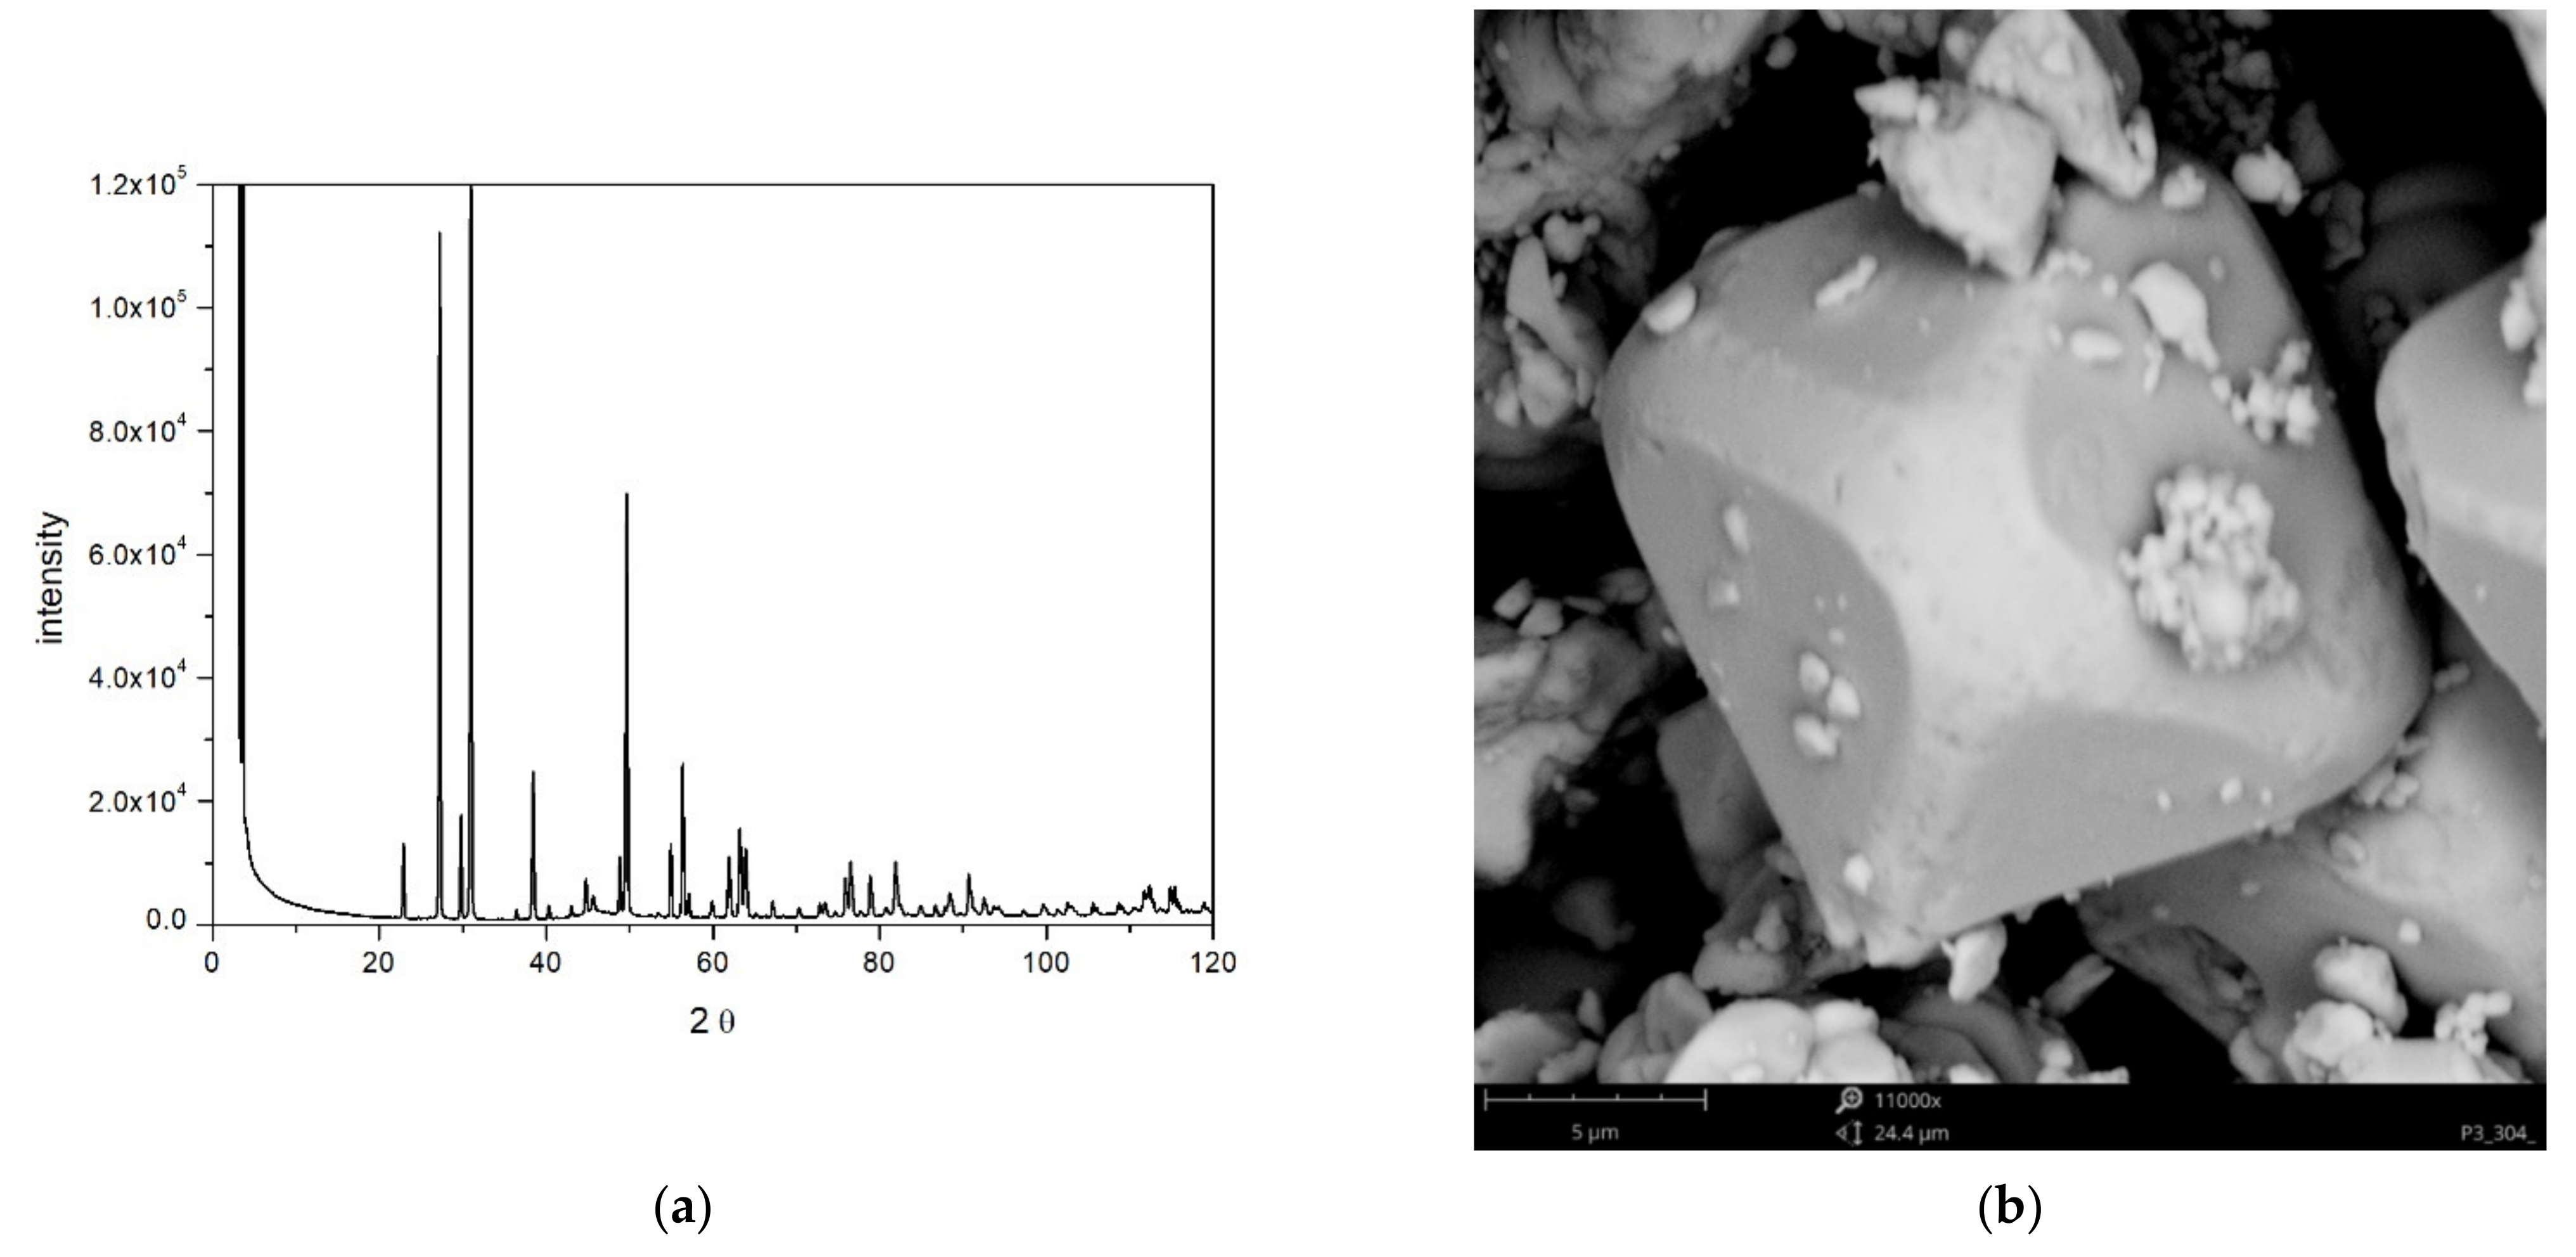
2.1. BET and XRD
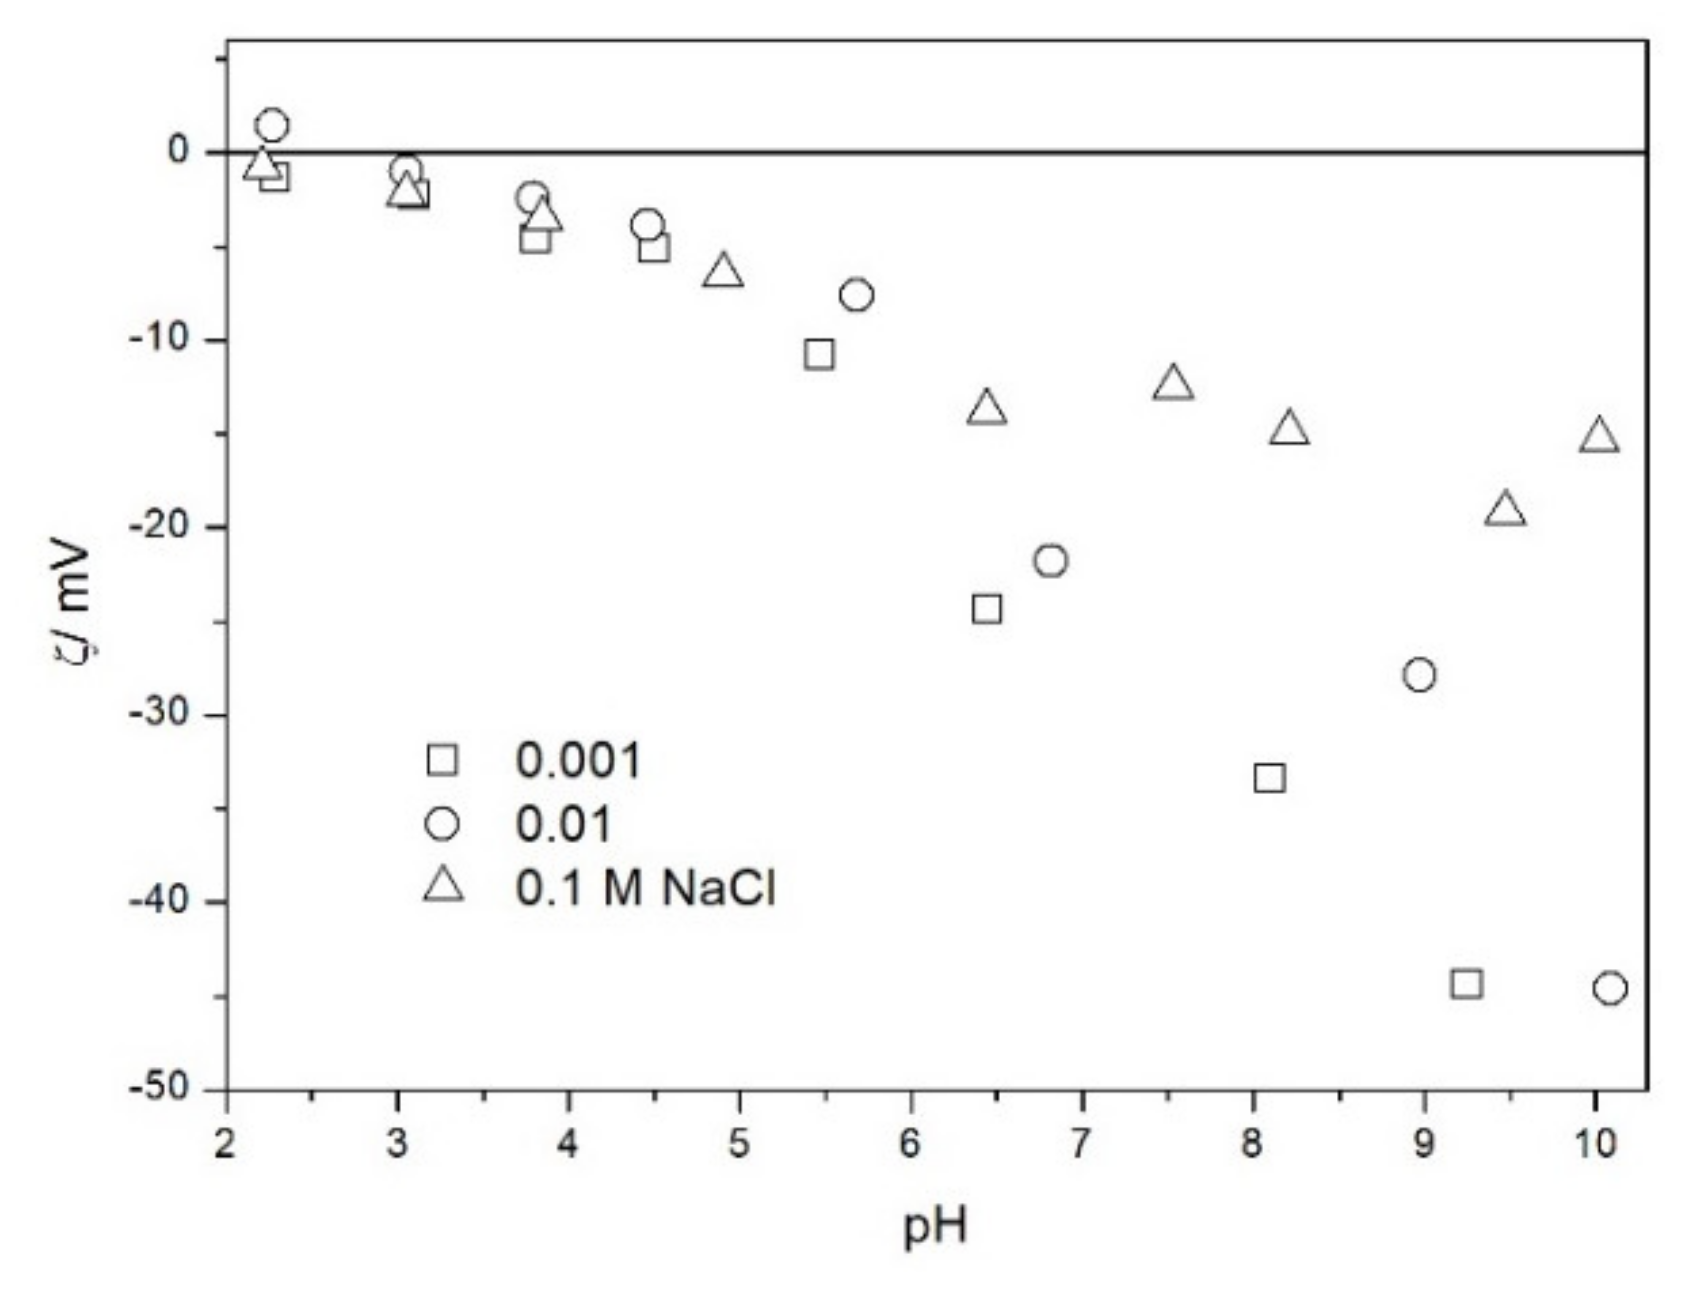
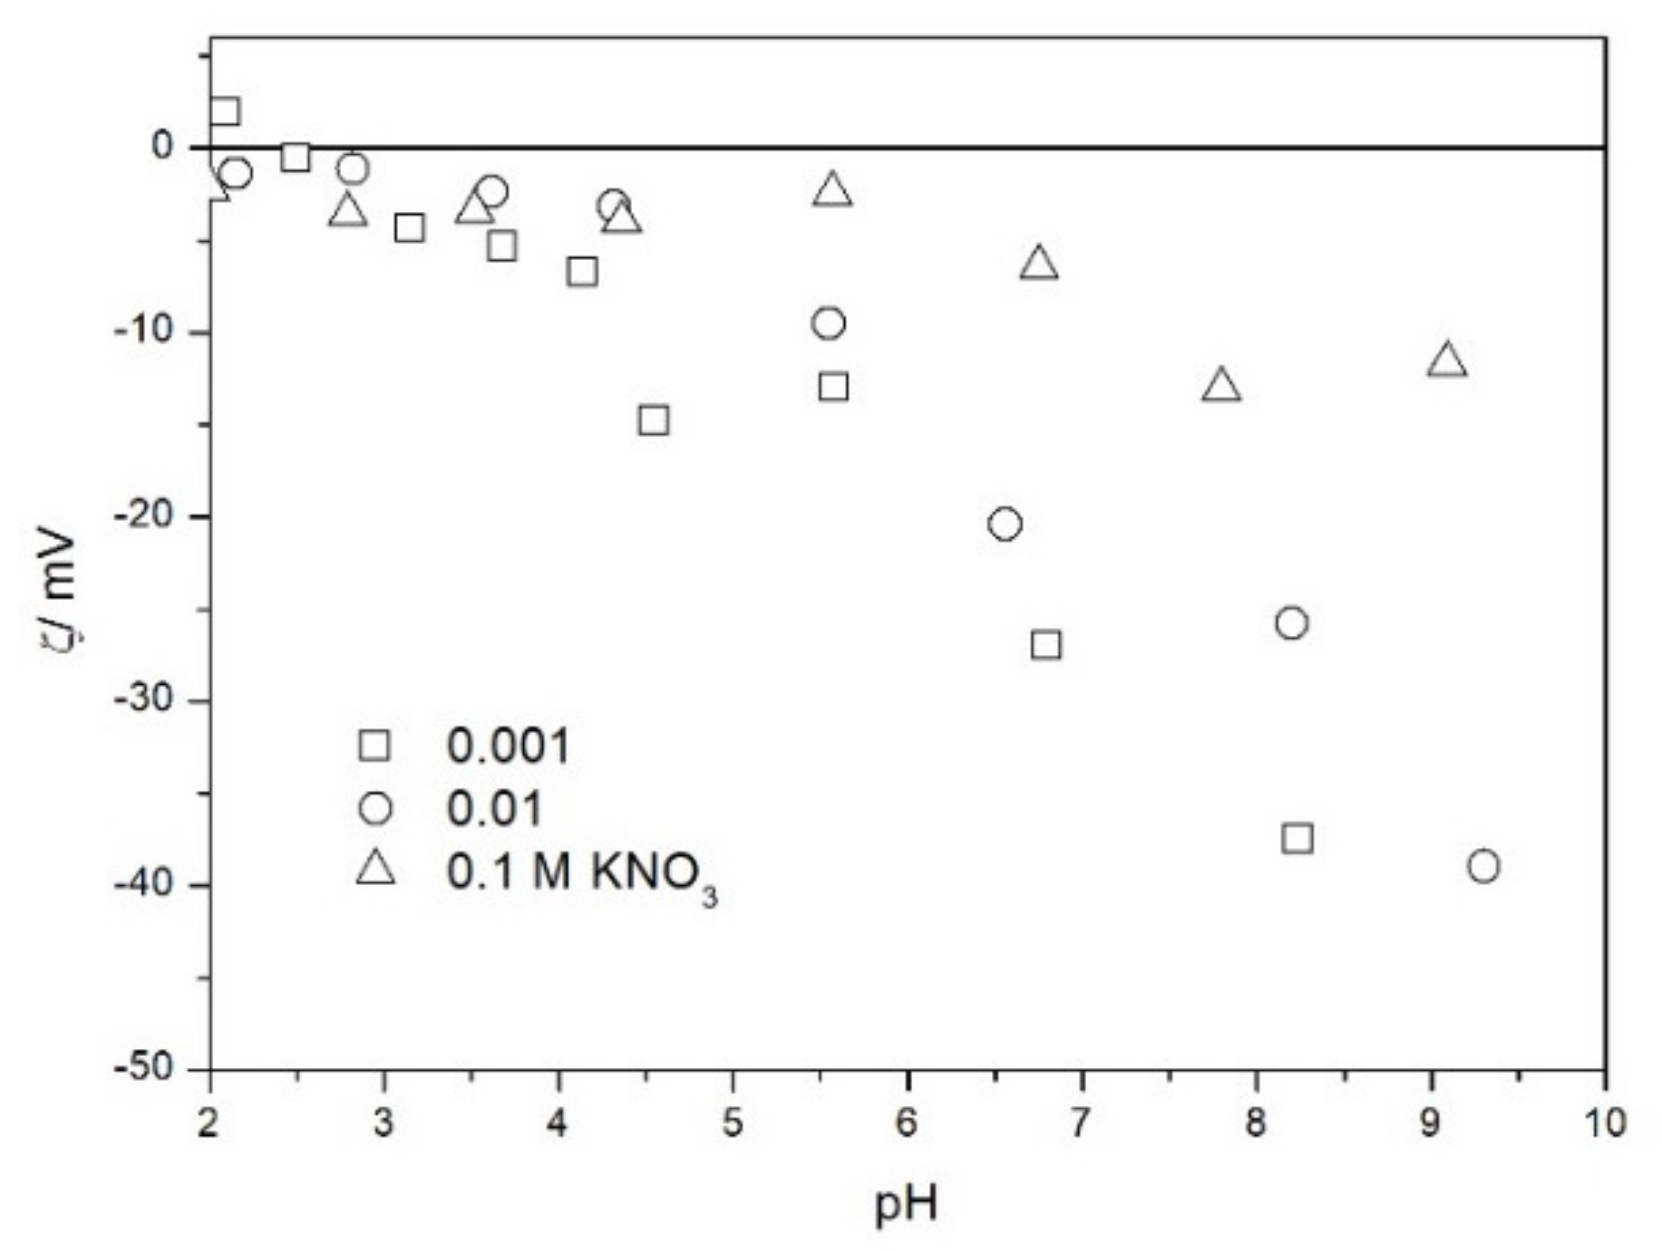
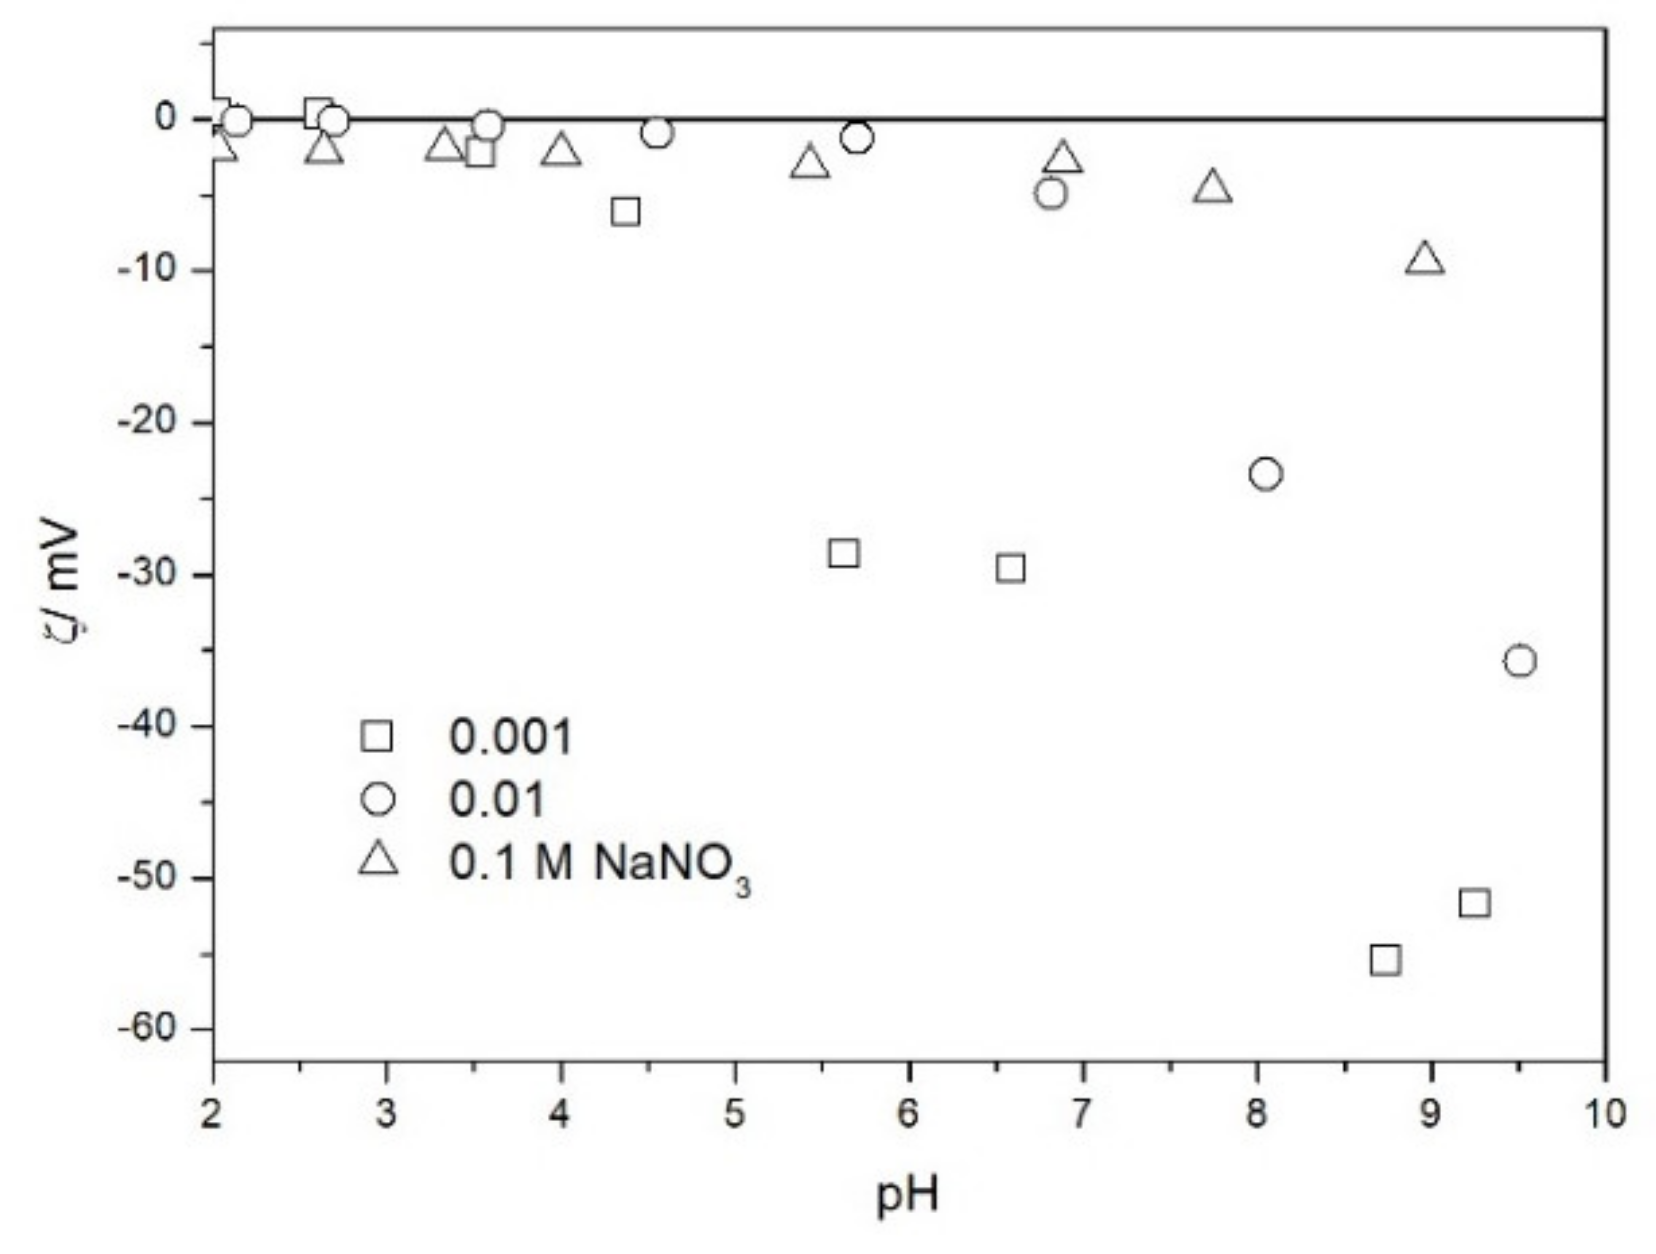
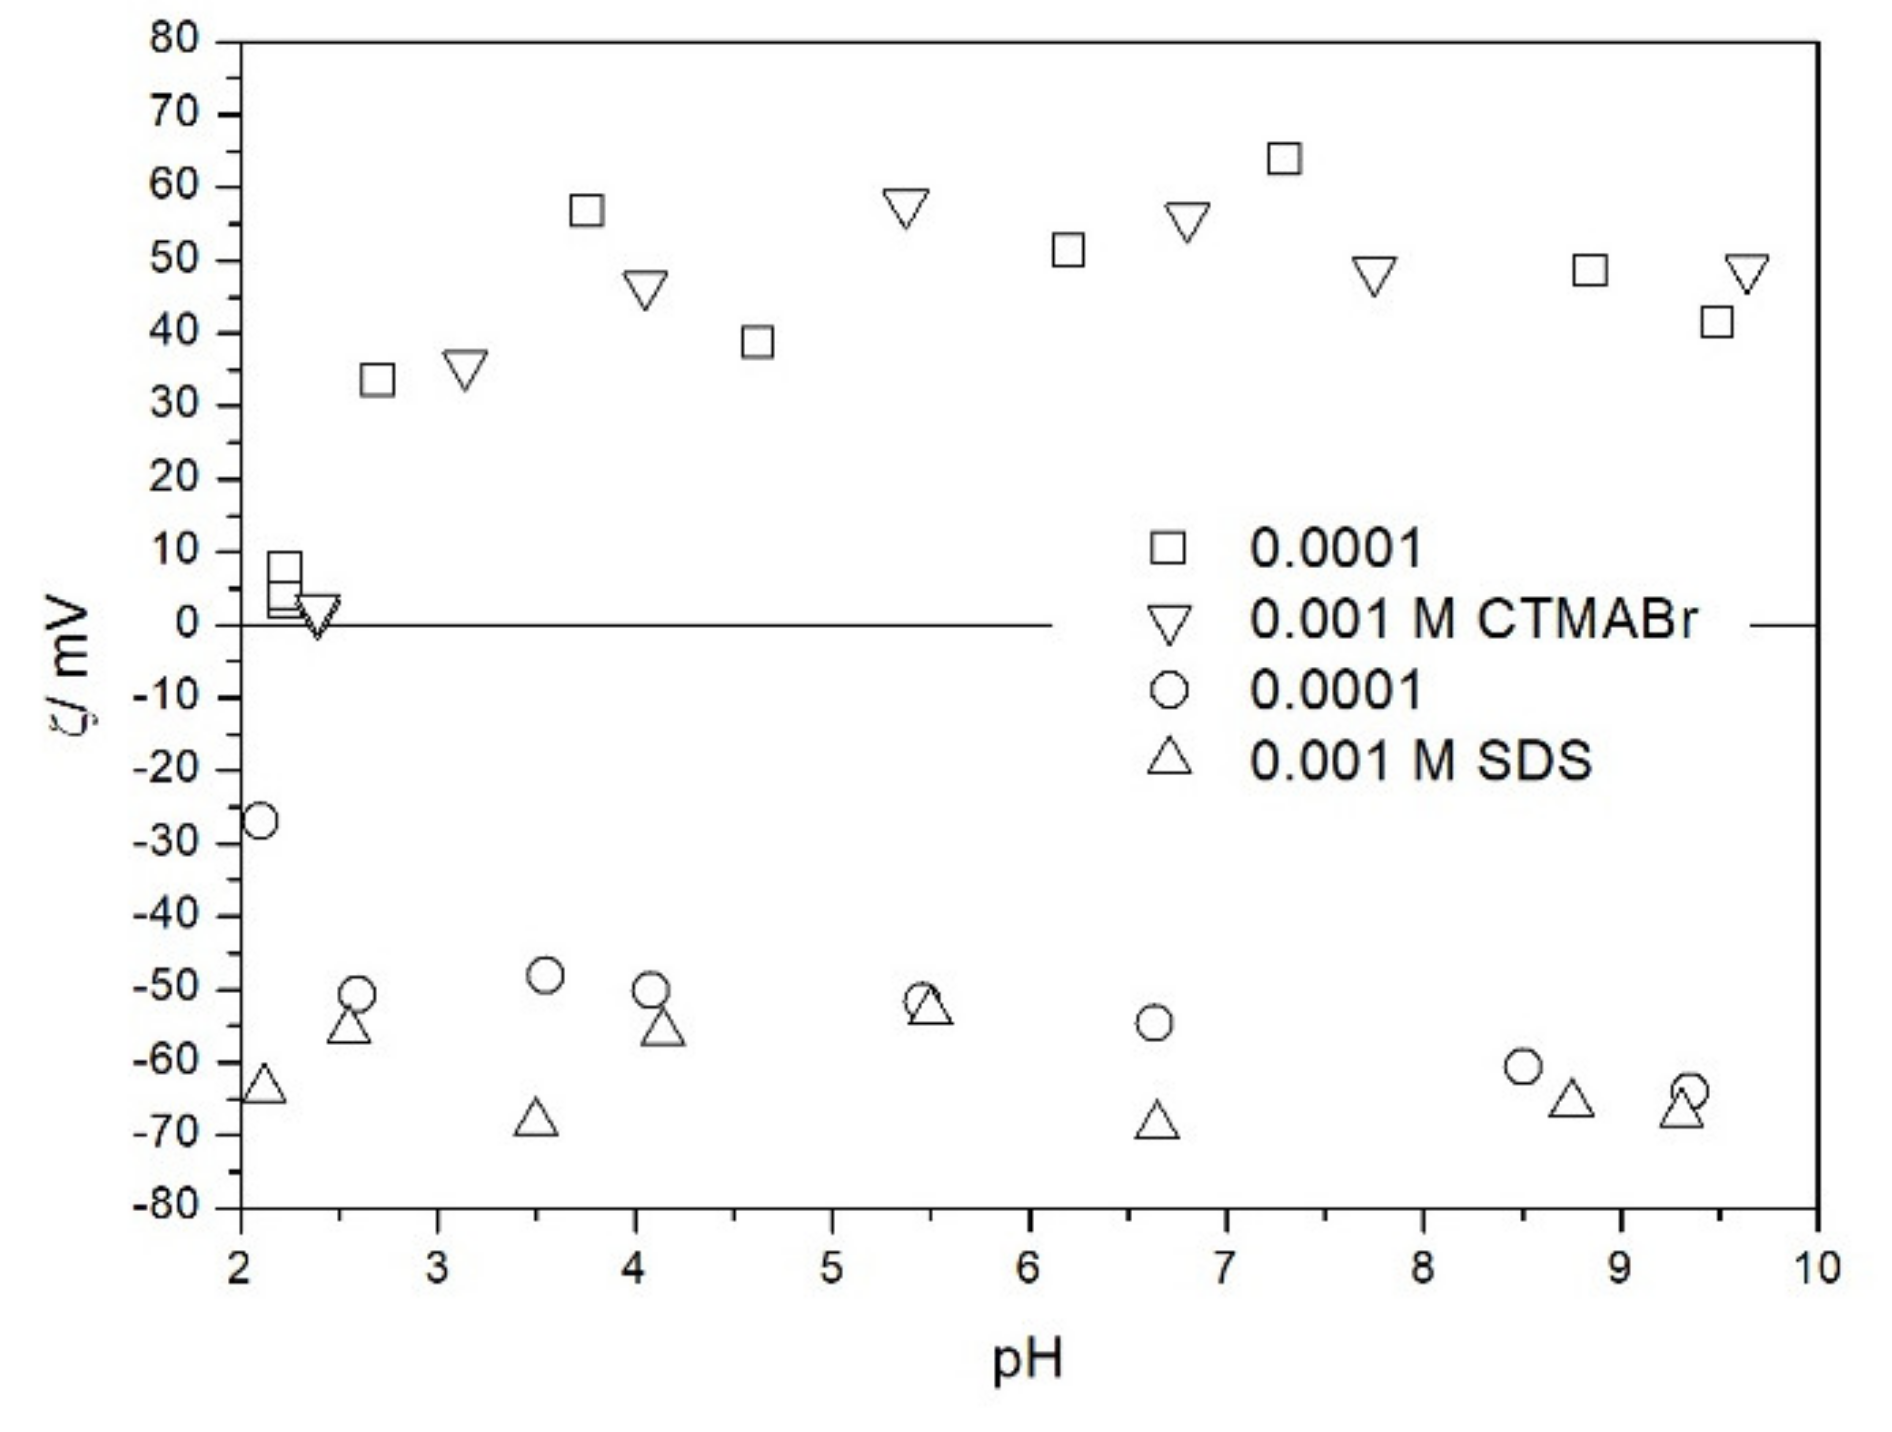
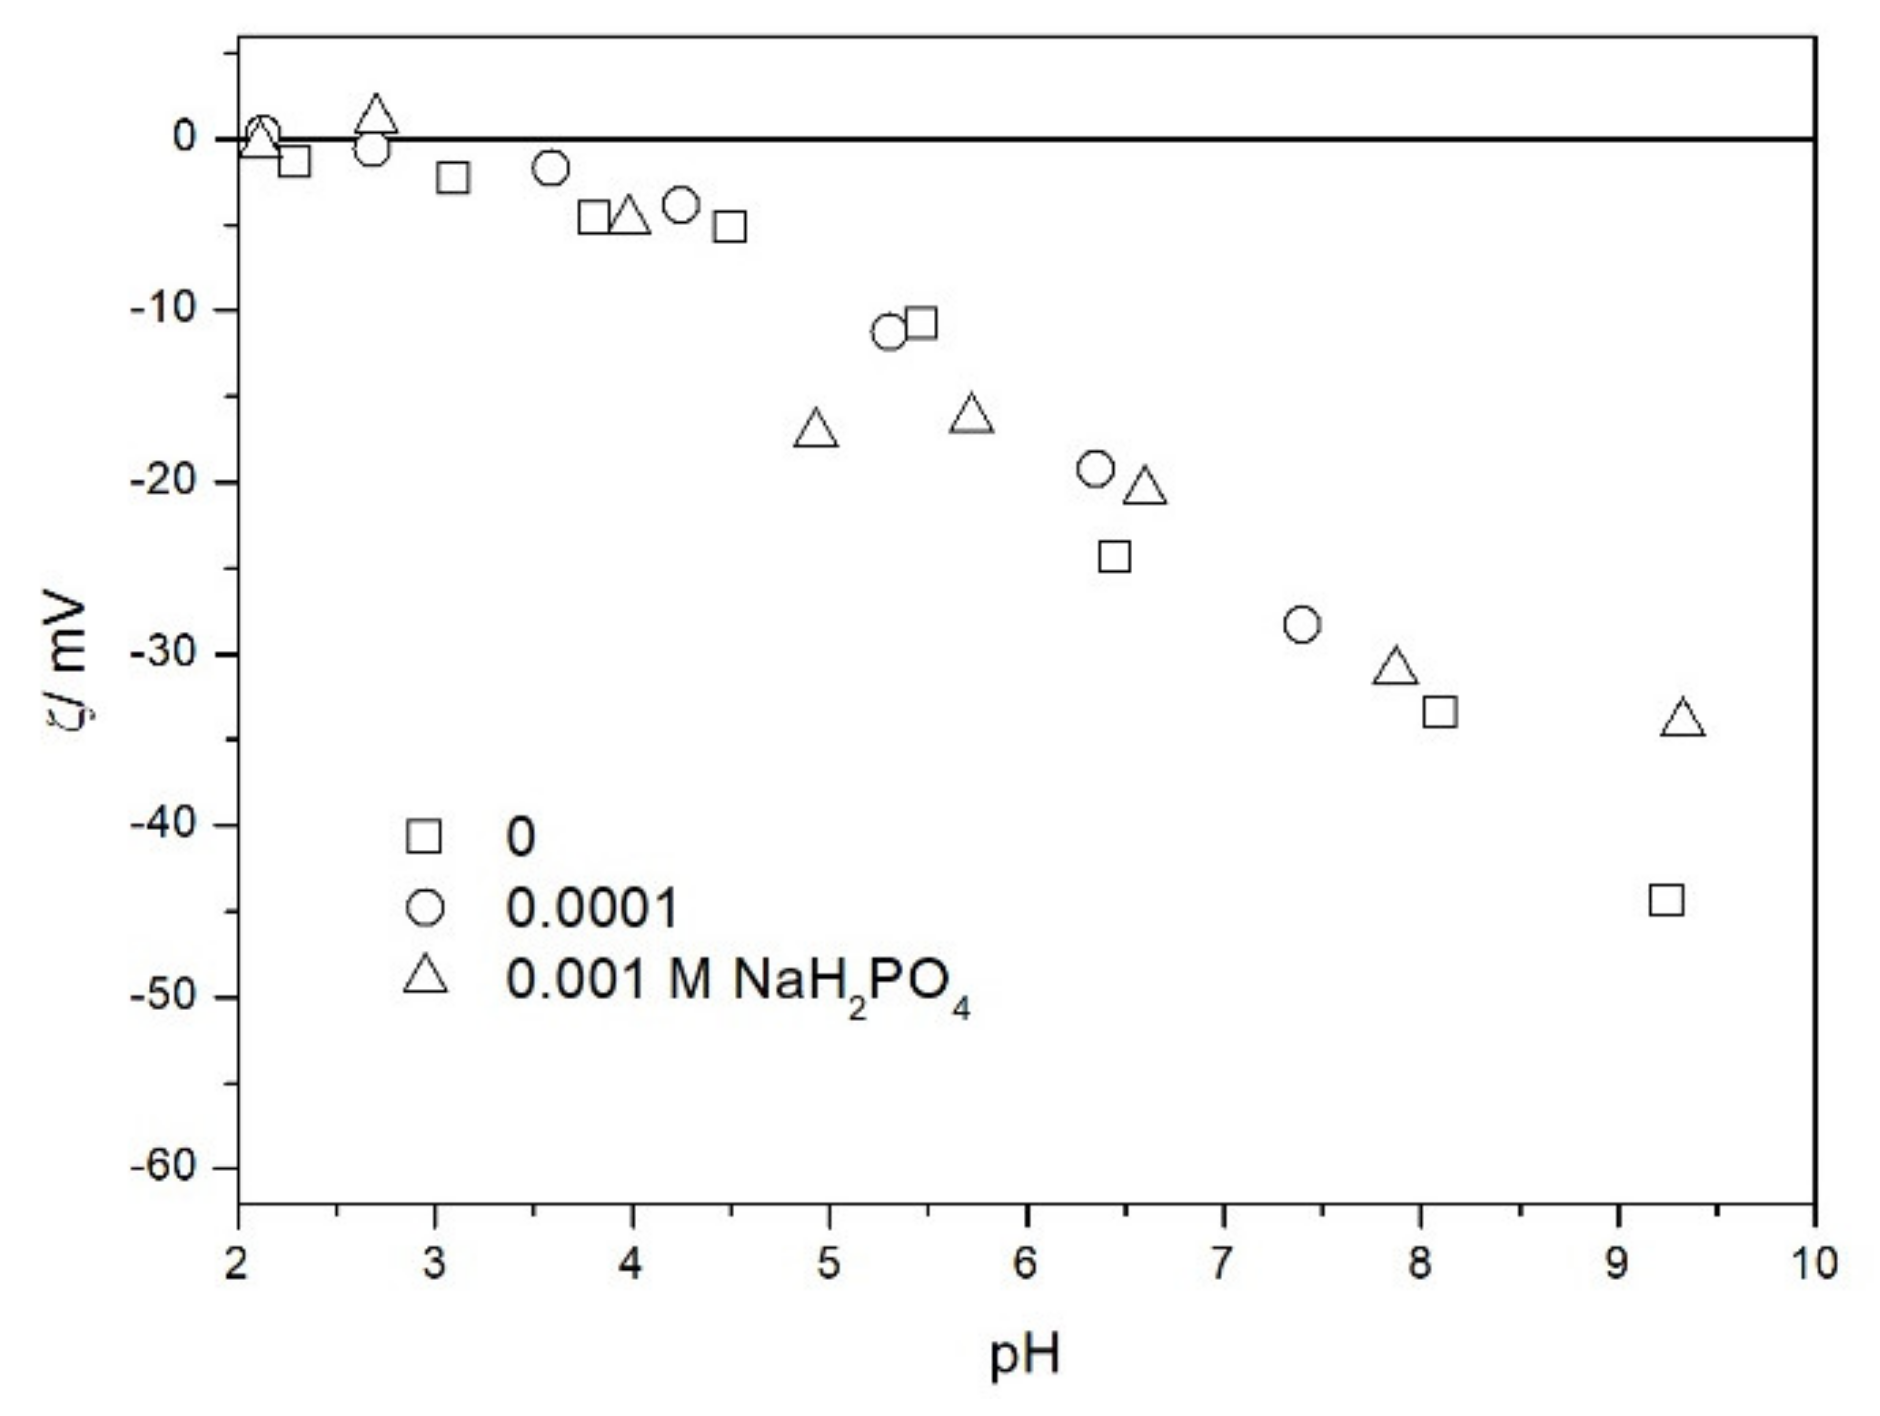
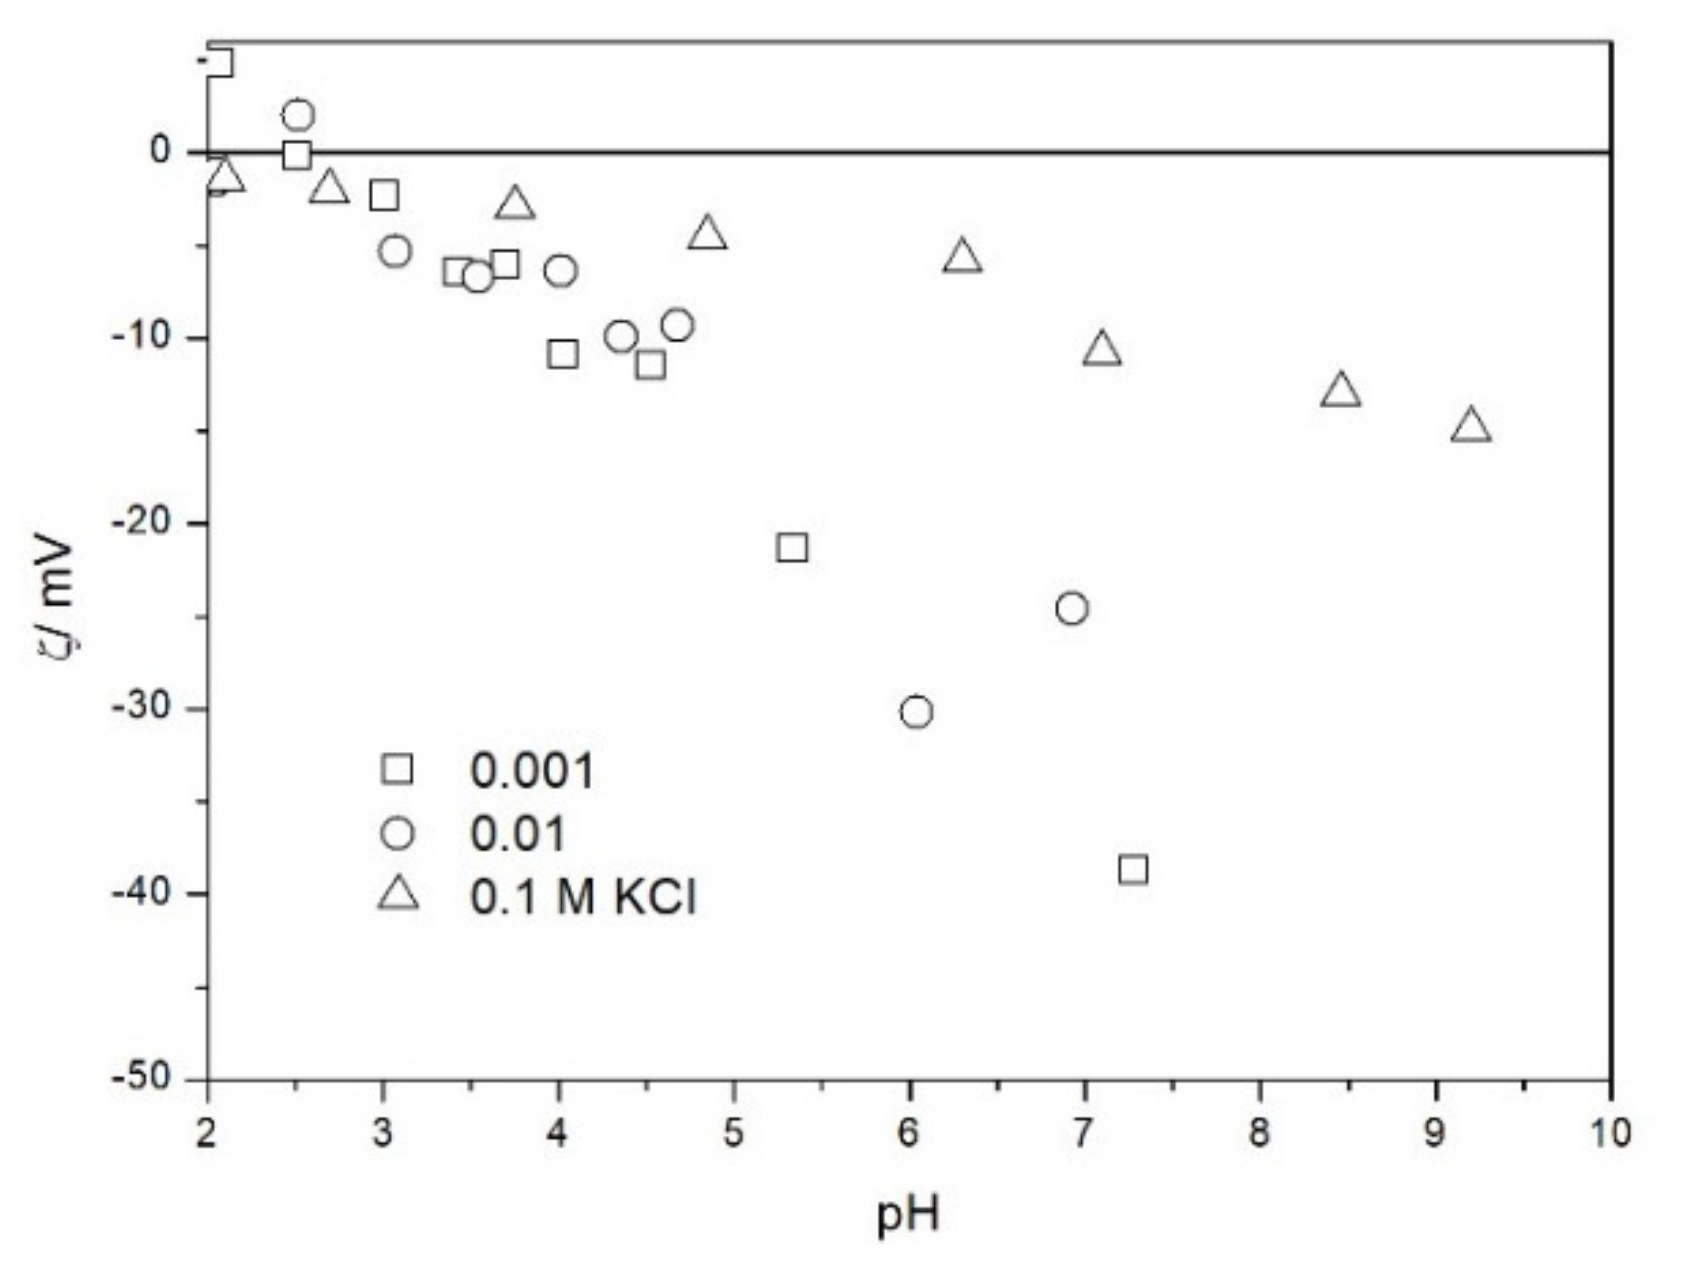
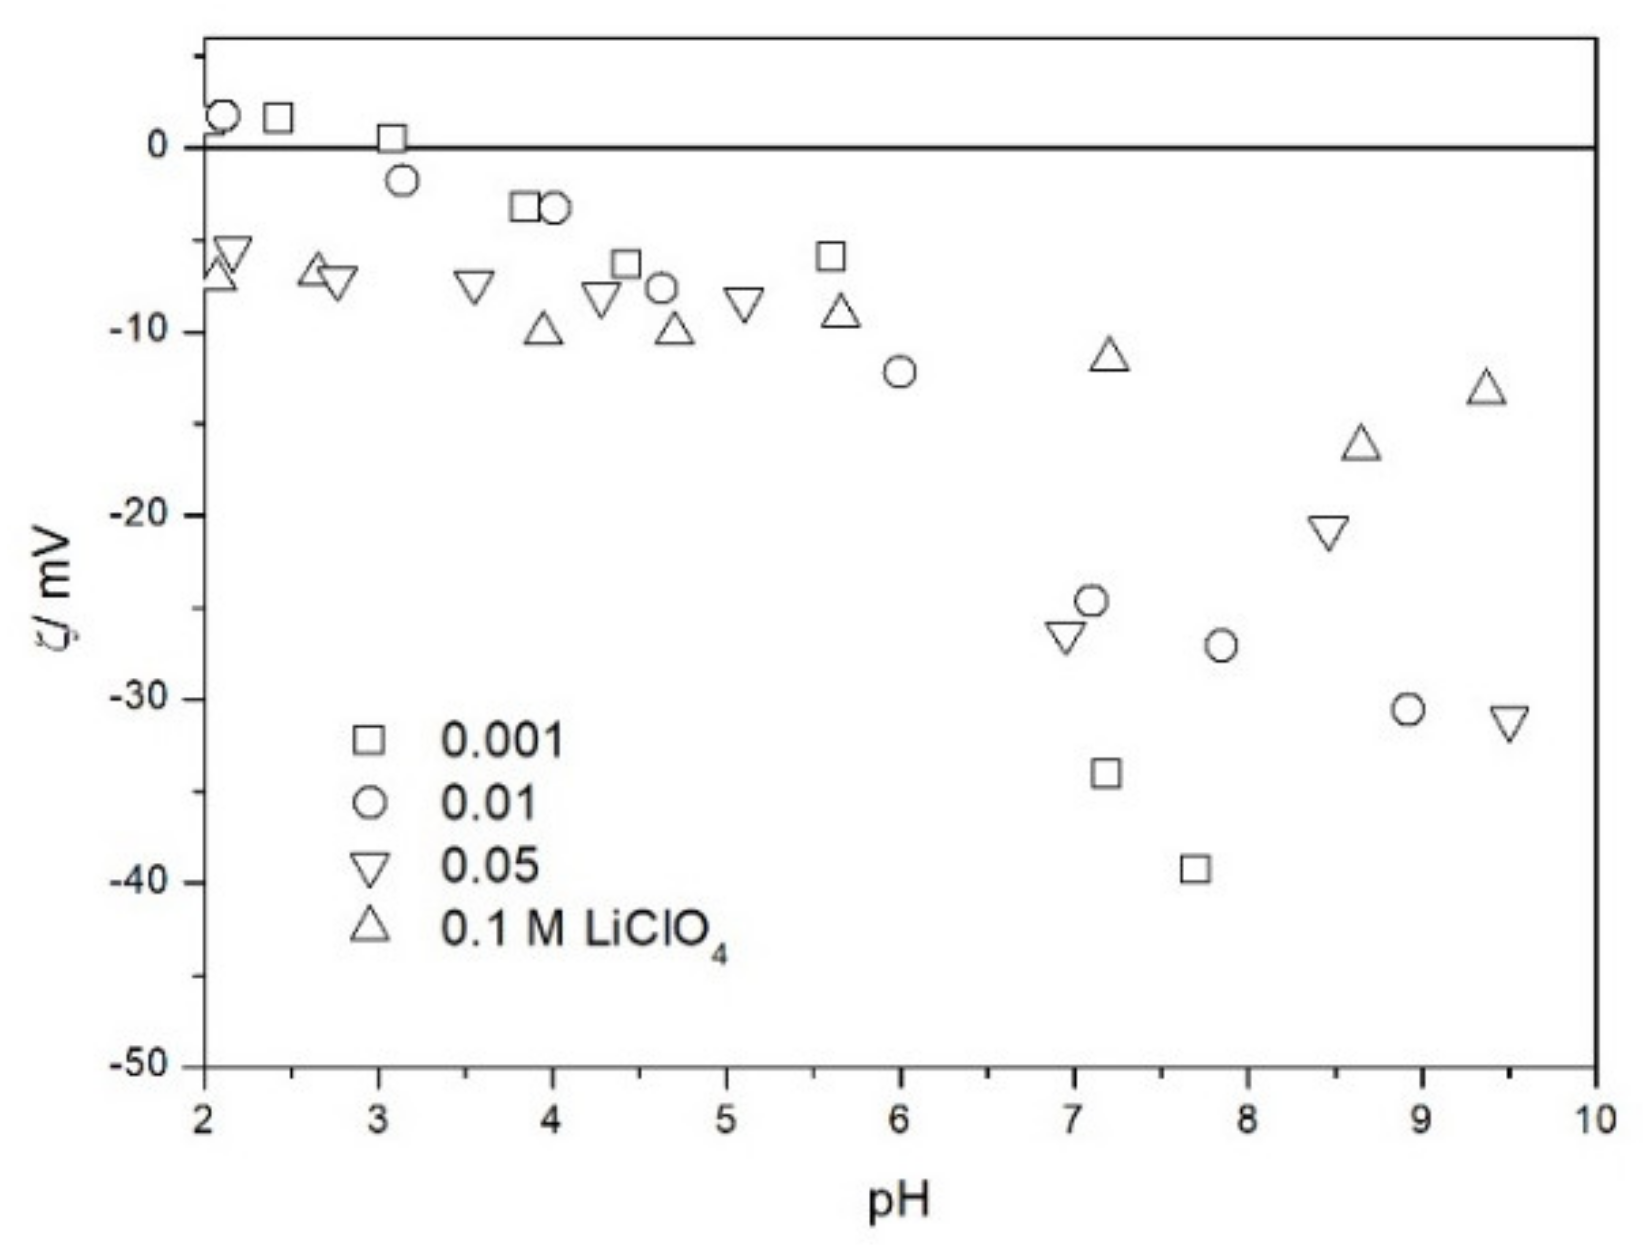
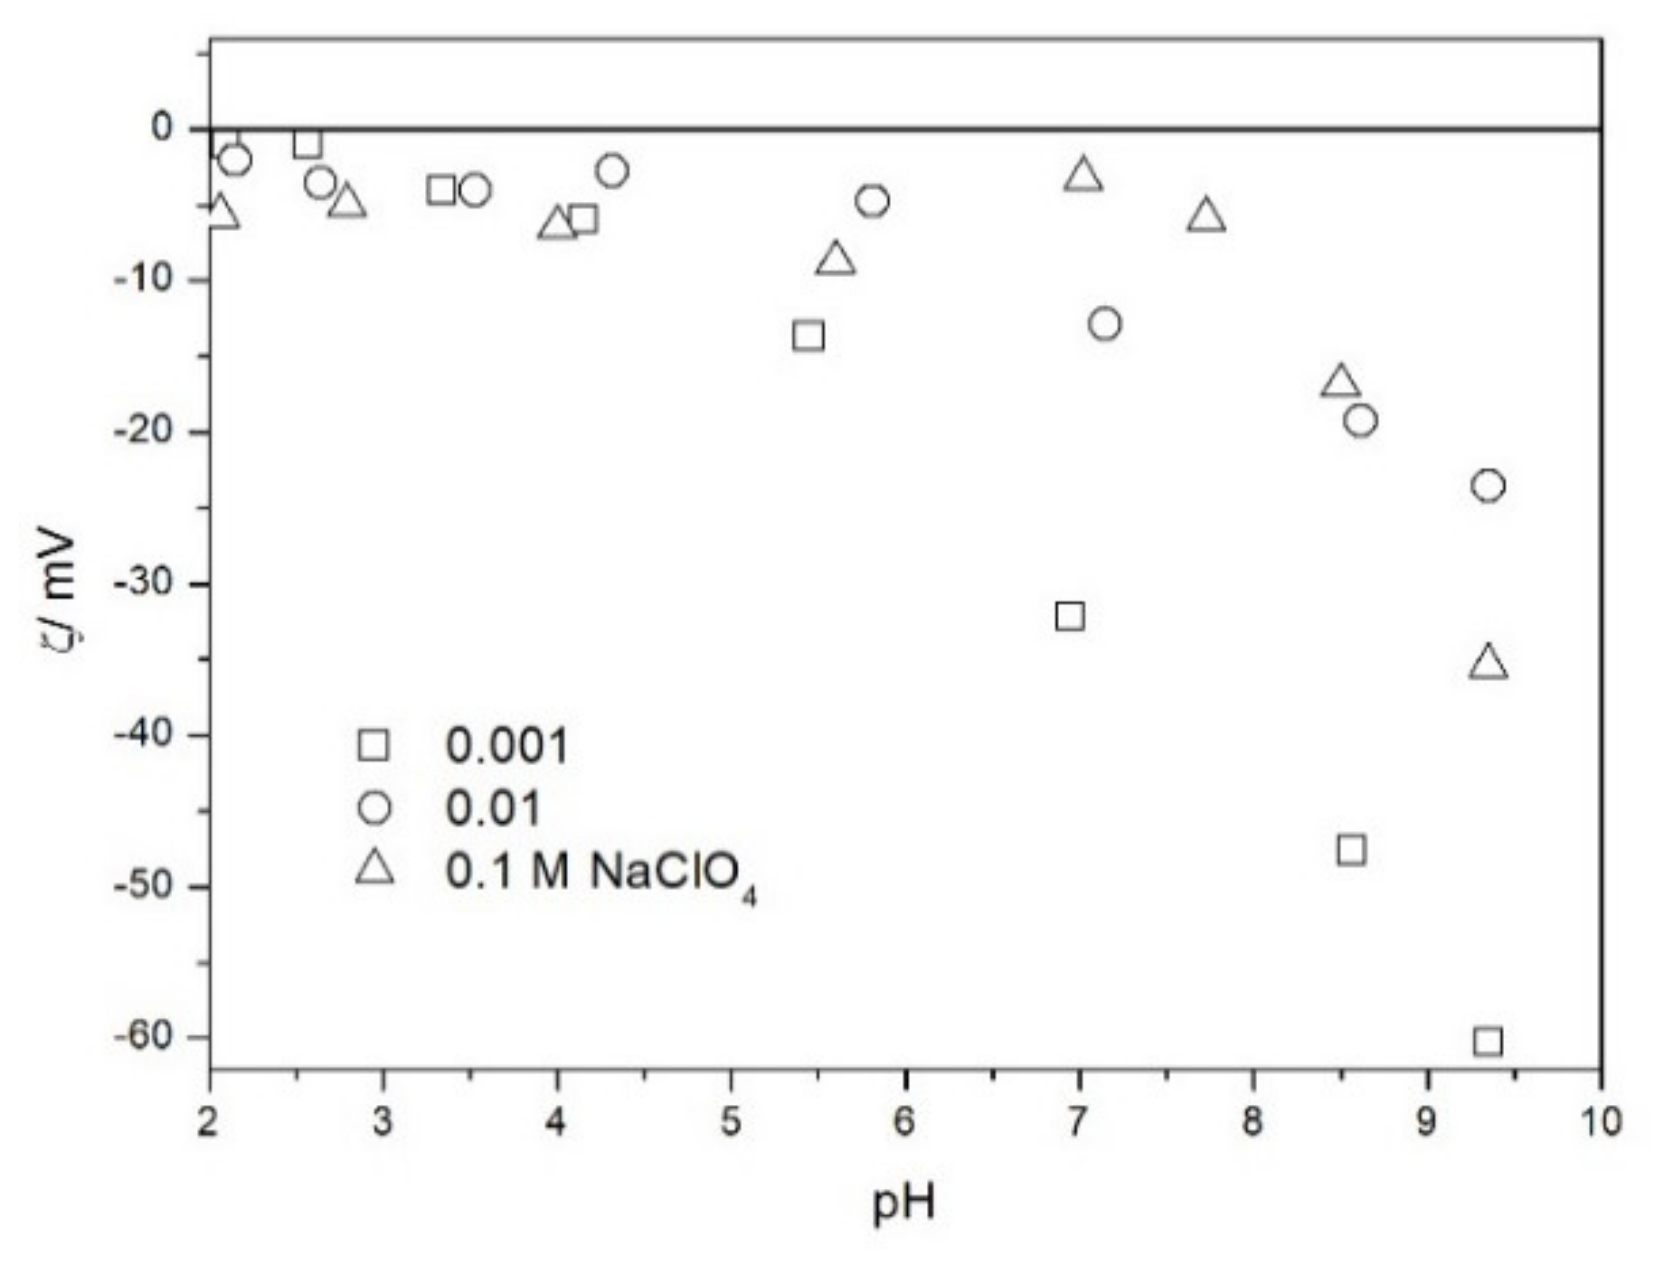
2.2. Zeta Potential and Particle Size
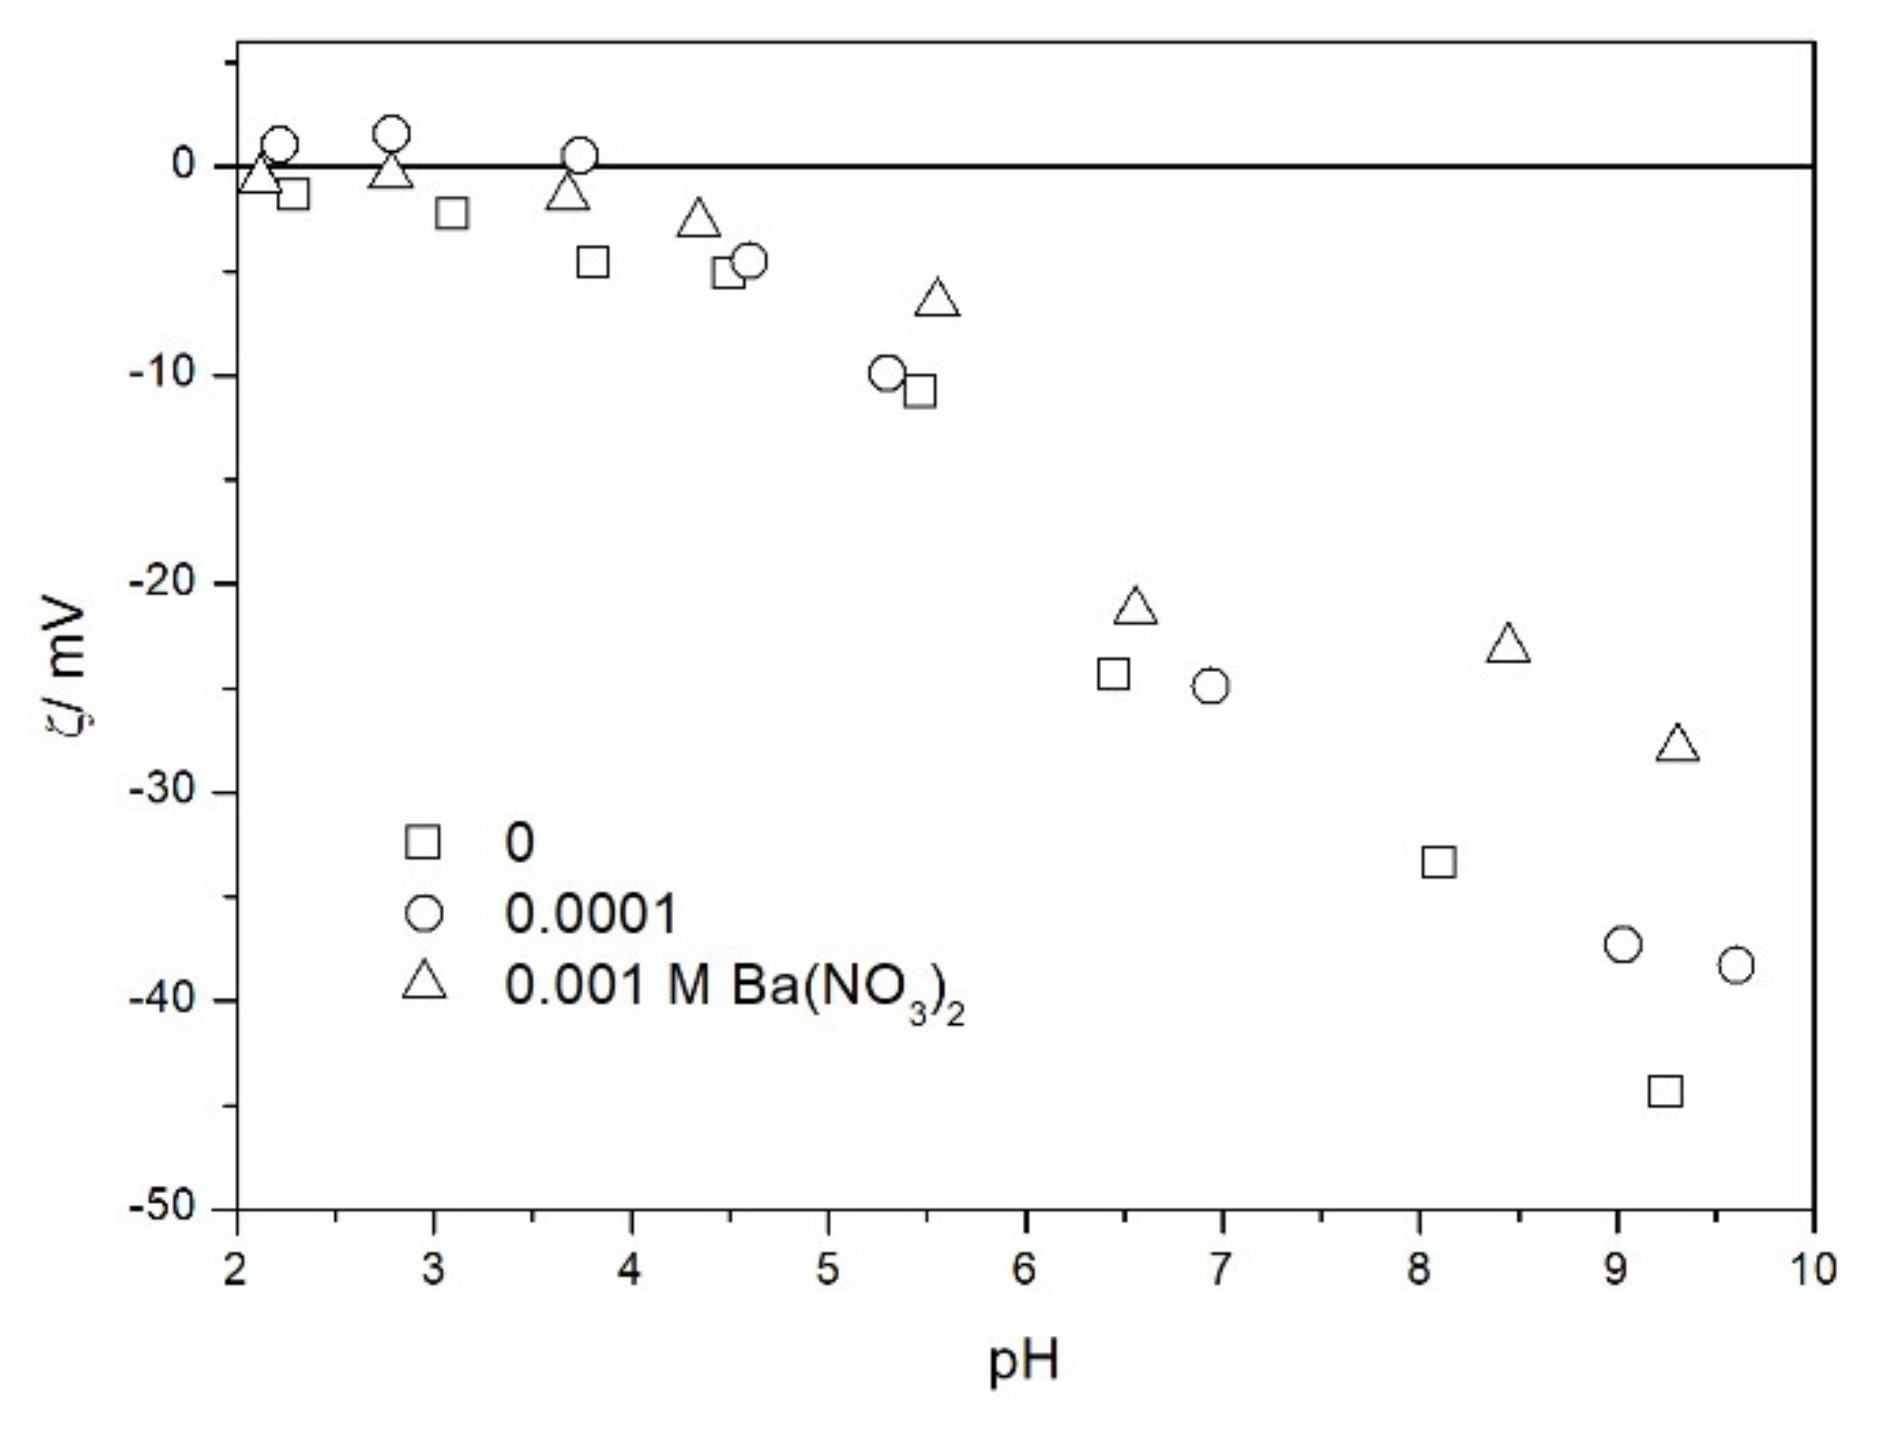
2.3. Salt Titration
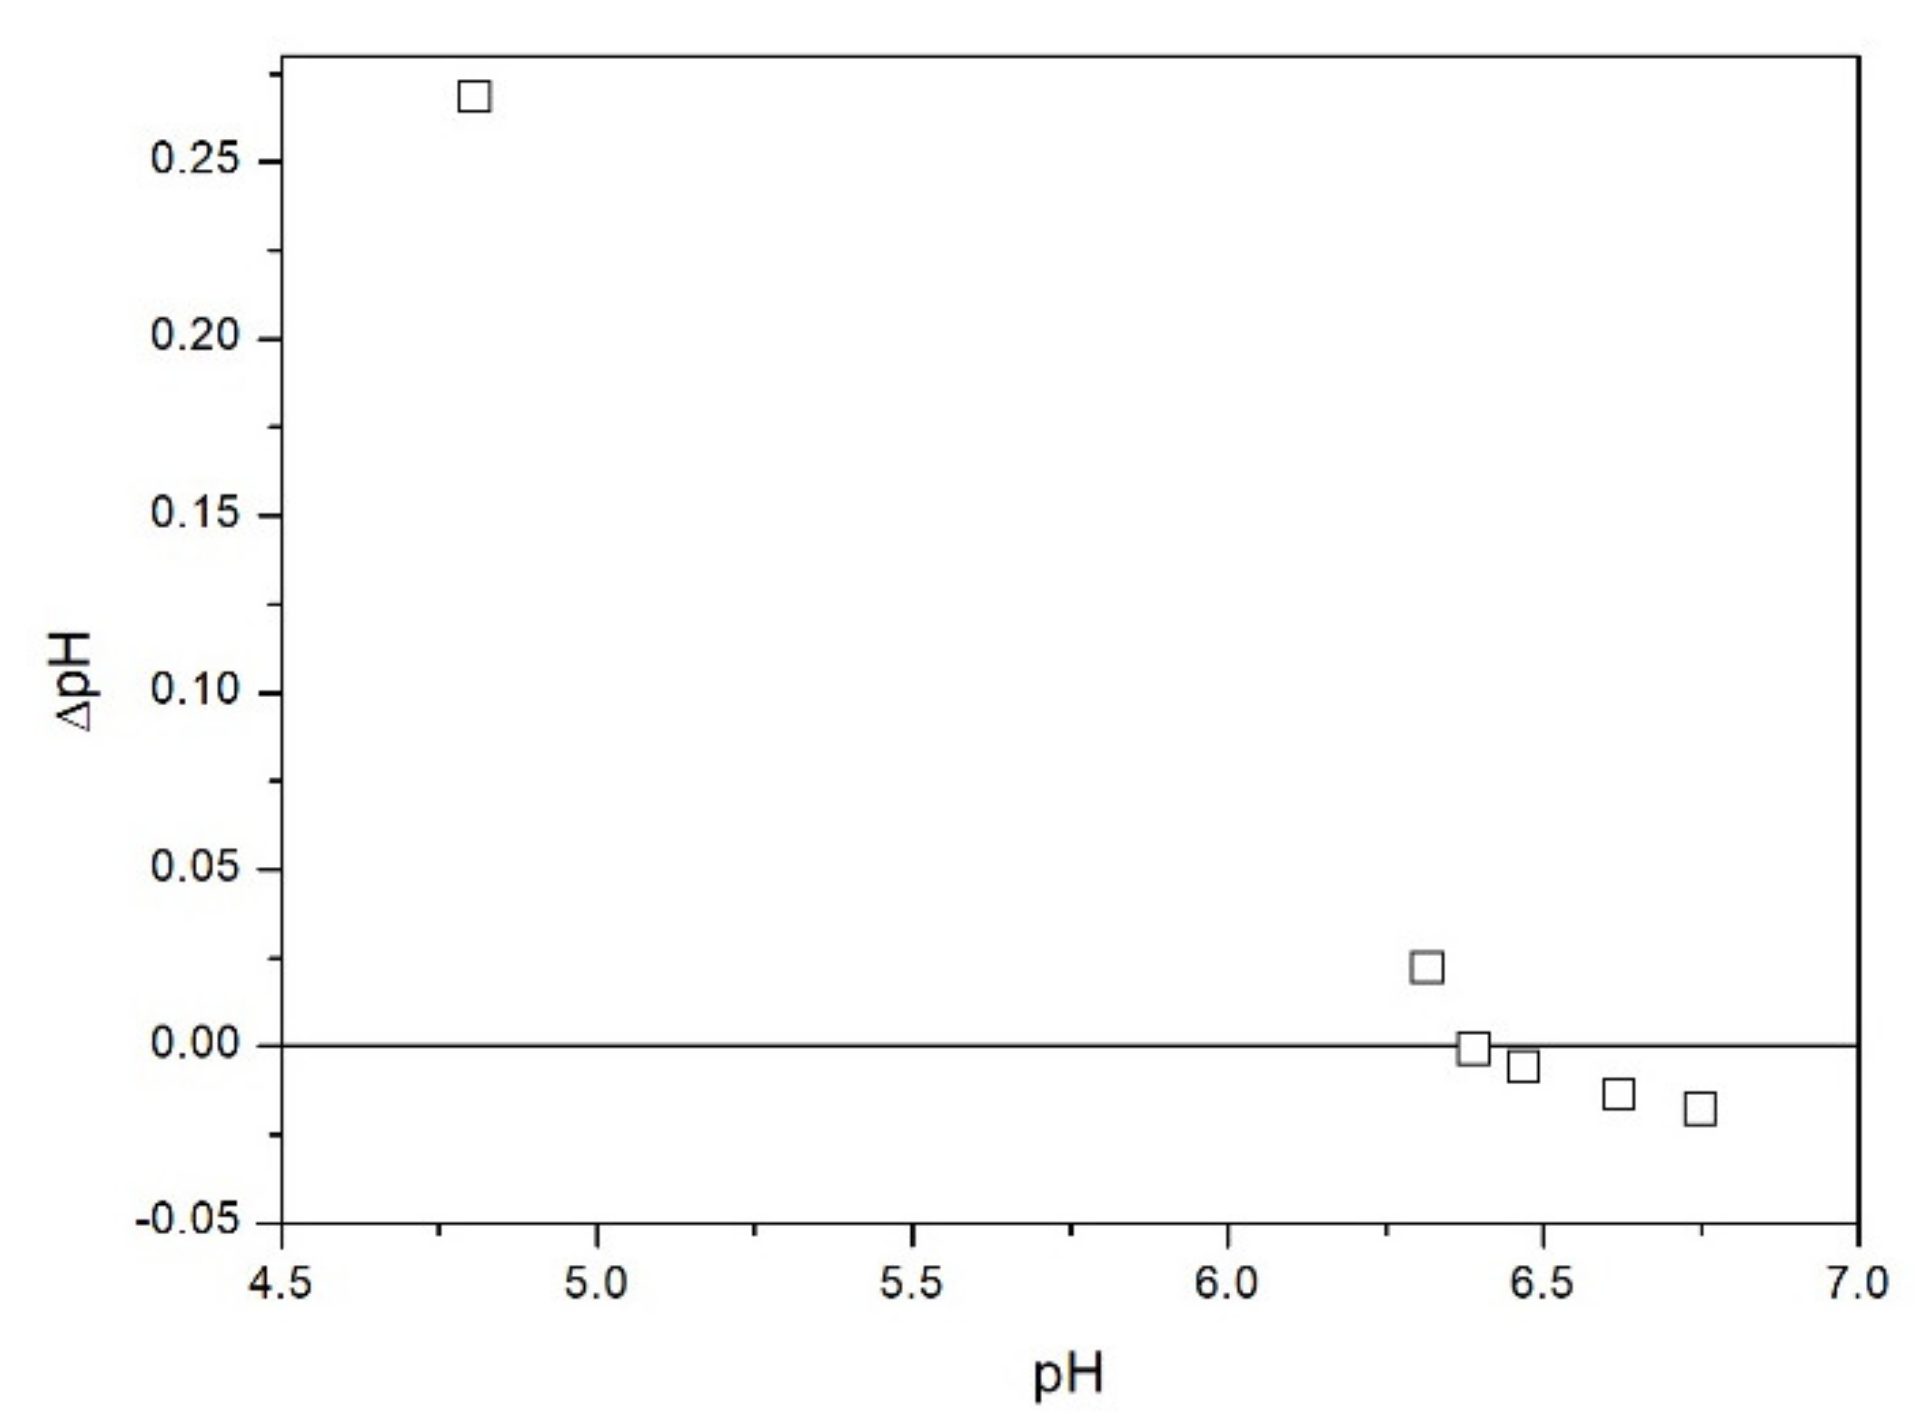
2.4. Solubility
3. Materials and Methods
4. Conclusions
Author Contributions
Funding
Institutional Review Board Statement
Informed Consent Statement
Data Availability Statement
Conflicts of Interest
References
- Stepien, R.; Buczynski, R.; Pysz, D.; Kujawa, I.; Mirkowska, M. Tellurite glasses for microstructured optical fibers manufacturing. Photonics Lett. Pol. 2010, 2, 16–18. [Google Scholar] [CrossRef]
- Jose, R.; Suzuki, T.; Ohishi, Y. Thermal and optical properties of TeO2–BaO–SrO–Nb2O5 based glasses: New broadband Raman gain media. J. Non-Crystall. Solids 2006, 352, 5564–5571. [Google Scholar] [CrossRef]
- Jiang, M.; Xu, K.; Liao, N.; Zhou, H. First principles investigation on selective hydrogen sensing properties of α-phase TeO2. Int. J. Hydrog. Energy 2021, 46, 4666–4672. [Google Scholar] [CrossRef]
- Qin, B.; Bai, Y.; Zhou, Y.; Liu, J.; Xie, X.; Zheng, W. Structure and characterization of TeO2 nanoparticles prepared in acid medium. Mater. Lett. 2009, 63, 1949–1951. [Google Scholar] [CrossRef]
- Gupta, P.K.; Sharma, P.P.; Sharma, A.; Khan, Z.H.; Solanki, P.R. Electrochemical and antimicrobial activity of tellurium oxide nanoparticles. Mater. Sci. Eng. B 2016, 211, 166–172. [Google Scholar] [CrossRef]
- Parks, G.A. The Isoelectric Points of Solid Oxides, Solid Hydroxides, and Aqueous Hydroxo Complex Systems. Chem. Rev. 1965, 65, 177–198. [Google Scholar] [CrossRef]
- Kosmulski, M. Isoelectric points and points of zero charge of metal (hydr)oxides: 50 years after Parks’ review. Adv. Colloid Interf. Sci. 2016, 238, 1–61. [Google Scholar] [CrossRef]
- Kosmulski, M.; Matysiak, J.; Szczypa, J. Solvent Effects on Standard Thermodynamic Functions of Surface Dissociation of Oxides. J. Colloid Interface Sci. 1994, 164, 280–284. [Google Scholar] [CrossRef]
- Cheon, S.; Yong, C.; Han, C.H.; Uhm, S. TeO2 nanoparticles synthesized by evaporation of tellurium in atmospheric microwave-plasma torch-flame. Chem. Phys. Lett. 2006, 429, 214–218. [Google Scholar] [CrossRef]
- Zhang, H.; Swihart, M.T. Synthesis of Tellurium Dioxide Nanoparticles by Spray Pyrolysis. Chem. Mater. 2007, 19, 1290–1301. [Google Scholar] [CrossRef]
- Amari, A.; Al Mesfer, M.K.; Alsaiari, N.S.; Danish, M.; Alshahrani, A.M.; Tahoon, M.A.; Rebah, F.B. Electrochemical and Optical Properties of Tellurium Dioxide (TeO2) Nanoparticles. Int. J. Electrochem. Sci. 2021, 16, 210235. [Google Scholar] [CrossRef]
- Grishechkin, M.; Islam, A.; Khomyakov, A.; Zykova, M.; Mozhevitina, E.; Avetisov, R.; Ermochenkov, I.; Avetissov, I. Extra pure tellurium oxide for the growth of high quality paratellurite crystals. IOP Conf. Ser. Mater. Sci. Eng. 2019, 613, 012021. [Google Scholar] [CrossRef]
- Arab, F.; Mousavi-Kamazani, M.; Salavati-Niasari, M. Synthesis, characterization, and optical properties of Te, Te/TeO2 and TeO2 nanostructures via a onepot hydrothermal method. RSC Adv. 2016, 6, 71472–71480. [Google Scholar] [CrossRef]
- Kosmulski, M.; Rosenholm, J.B. High Ionic Strength Electrokinetics. Adv. Colloid Interface Sci. 2004, 112, 93–107. [Google Scholar] [CrossRef] [PubMed]
- Laven, J.; Stein, H.N. The Electroviscous Behavior of Aqueous Dispersions of Amorphous Silica (Ludox). J. Colloid Interface Sci. 2001, 238, 8–15. [Google Scholar] [CrossRef]
- Grządka, E. Adsorption and electrokinetic properties in the system: Beta-cyclodextrin/alumina in the presence of ionic and non-ionic surfactants. Colloids Surf. A 2015, 481, 261–268. [Google Scholar] [CrossRef]
- Del Nero, M.; Galindo, C.; Barillon, R.; Halter, E.; Madé, B. Surface reactivity of α-Al2O3 and mechanisms of phosphate sorption: In situ ATR-FTIR spectroscopy and ζ potential studies. J. Colloid Interface Sci. 2010, 342, 437–444. [Google Scholar] [CrossRef]
- Kosmulski, M. Chemical Properties of Materials Surfaces; Taylor and Francis: Boca Raton, FL, USA, 2001. [Google Scholar] [CrossRef]
- Escudey, M.; Gil-Llambias, F. Effect of cation and anion adsorption on the electrophoretic behavior of MoO3/γ-Al2O3 catalysts. J. Colloid Interface Sci. 1985, 107, 272–275. [Google Scholar] [CrossRef]
- Huang, C.P.; Stumm, W. Specific adsorption of cations on hydrous γ-Al2O3. J. Colloid Interface Sci. 1973, 43, 409–420. [Google Scholar] [CrossRef]
- Murase, K.; Suzuki, T.; Umenaka, Y.; Hirato, T.; Awakura, Y. Thermodynamics of Cathodic ZnTe Electrodeposition Using Basic Ammoniacal Electrolytes: Why CdTe Can Deposit While ZnTe Cannot. High Temp. Mater. Proc. 2011, 30, 451–458. [Google Scholar] [CrossRef]
- Hiemstra, T.; van Riemsdijk, W.H.; Bolt, G.H. Multisite proton adsorption modeling at the solid/solution interface of (hydr)oxides: A new approach: I. Model description and evaluation of intrinsic reaction constants. J. Colloid Interface Sci. 1989, 133, 91–104. [Google Scholar] [CrossRef]


| Quantity | Not Weighted | Weighted |
|---|---|---|
| valence | 6.20 | 6.00 |
| electronegativity of oxide | 5.54 | 5.33 |
| z/r | 8.51 | 8.57 |
| z/R | 6.80 | 6.70 |
Publisher’s Note: MDPI stays neutral with regard to jurisdictional claims in published maps and institutional affiliations. |
© 2021 by the authors. Licensee MDPI, Basel, Switzerland. This article is an open access article distributed under the terms and conditions of the Creative Commons Attribution (CC BY) license (https://creativecommons.org/licenses/by/4.0/).
Share and Cite
Kosmulski, M.; Mączka, E. The Isoelectric Point of an Exotic Oxide: Tellurium (IV) Oxide. Molecules 2021, 26, 3136. https://doi.org/10.3390/molecules26113136
Kosmulski M, Mączka E. The Isoelectric Point of an Exotic Oxide: Tellurium (IV) Oxide. Molecules. 2021; 26(11):3136. https://doi.org/10.3390/molecules26113136
Chicago/Turabian StyleKosmulski, Marek, and Edward Mączka. 2021. "The Isoelectric Point of an Exotic Oxide: Tellurium (IV) Oxide" Molecules 26, no. 11: 3136. https://doi.org/10.3390/molecules26113136
APA StyleKosmulski, M., & Mączka, E. (2021). The Isoelectric Point of an Exotic Oxide: Tellurium (IV) Oxide. Molecules, 26(11), 3136. https://doi.org/10.3390/molecules26113136