
A Family of Ethyl N-Salicylideneglycinate Dyes Stabilized by Intramolecular Hydrogen Bonding: Photophysical Properties and Computational Study


Abstract
1. Introduction
2. Results and Discussion
3. Materials and Methods
3.1. Materials
3.2. Physical Measurements
3.3. Computational Details
4. Conclusions
Supplementary Materials
Author Contributions
Funding
Institutional Review Board Statement
Informed Consent Statement
Data Availability Statement
Conflicts of Interest
Sample Availability
References
- Sacconi, L. Tetrahedral complexes of nickel (II) and copper (II) with schiff bases. Coord. Chem. Rev. 1996, 1, 126–132. [Google Scholar] [CrossRef]
- Yamada, S. Recent aspects of the stereochemistry of schiff-base-metal complexes. Coord. Chem. Rev. 1966, 1, 415–437. [Google Scholar] [CrossRef]
- Nath, M.; Goyal, S. Organotin (Iv) complexes of schiff bases: A review. Main Group Met. Chem. 1996, 19, 75–102. [Google Scholar] [CrossRef]
- Aggarwal, N.; Kumar, R.; Dureja, P.; Diwan, S.; Rawat, D.S. Schiff bases as potential fungicides and nitrification inhibitors. J. Agric. Food Chem. 2009, 57, 8520–8525. [Google Scholar] [CrossRef] [PubMed]
- Weng, Q.; Yi, J.; Chen, X.; Luo, D.; Wang, Y.; Sun, W.; Kang, J.; Han, Z. Controllable Synthesis and Biological Application of Schiff Bases from d-Glucosamine and Terephthalaldehyde. ACS Omega 2020, 5, 24864–24870. [Google Scholar] [CrossRef] [PubMed]
- Ferraz de Paiva, R.E.; Marçal Neto, A.; Santos, I.A.; Jardim, A.C.G.; Corbi, P.P.; Bergamini, F.R.G. What is holding back the development of antiviral metallodrugs? A literature overview and implications for SARS-CoV-2 therapeutics and future viral outbreaks. Dalton Trans. 2020, 49, 16004–16033. [Google Scholar] [CrossRef]
- Wang, P.H.; Keck, G.J.; Lien, E.J.; Lai, M.M.C. Design, Synthesis, Testing, and Quantitative Structure-Activity Relationship Analysis of Substituted Salicylaldehyde Schiff Bases of 1-Amino-3-Hydroxyguani-dine Tosylate as New Antiviral Agents against Coronavirus. J. Med. Chem. 1990, 33, 608–614. [Google Scholar] [CrossRef]
- Safin, D.A.; Robeyns, K.; Garcia, Y. Crown ether-containing N-salicylidene aniline derivatives: Synthesis, characterization and optical properties. CrystEngComm 2012, 14, 5523–5529. [Google Scholar] [CrossRef]
- Safin, D.A.; Robeyns, K.; Garcia, Y. Solid-state thermo- and photochromism in N,N′-bis(5-X-salicylidene)diamines (X = H, Br). RSC Adv. 2012, 2, 11379–11388. [Google Scholar] [CrossRef]
- Safin, D.A.; Garcia, Y. First evidence of thermo- and two-step photochromism of tris-anils. RSC Adv. 2013, 3, 6466–6471. [Google Scholar] [CrossRef]
- Safin, D.A.; Bolte, M.; Garcia, Y. Photoreversible solid state negative photochromism of N-(3,5-dichlorosalicylidene)-1-aminopyrene. CrystEngComm 2014, 16, 5524–5526. [Google Scholar] [CrossRef]
- Safin, D.A.; Babashkina, M.G.; Robeyns, K.; Bolte, M.; Garcia, Y. N-Salicylidene aniline derivatives based on the N′-thiophosphorylated thiourea scaffold. CrystEngComm 2014, 16, 7053–7061. [Google Scholar] [CrossRef]
- Safin, D.A.; Bolte, M.; Garcia, Y. Solid-state photochromism and thermochromism of N-salicylidene pyrene derivatives. CrystEngComm 2014, 16, 8786–8793. [Google Scholar] [CrossRef]
- Safin, D.A.; Babashkina, M.G.; Robeyns, K.; Garcia, Y. C–H⋯Br–C vs. C–Br⋯Br–C vs. C–Br⋯N bonding in molecular self-assembly of pyridine-containing dyes. RSC Adv. 2016, 6, 53669–53678. [Google Scholar] [CrossRef]
- Safin, D.A.; Robeyns, K.; Babashkina, M.G.; Filinchuk, Y.; Rotaru, A.; Jureschi, C.; Mitoraj, M.P.; Hooper, J.; Brela, M.; Garcia, Y. Polymorphism driven optical properties of an anil dye. CrystEngComm 2016, 18, 7249–7259. [Google Scholar] [CrossRef]
- Safin, D.A.; Robeyns, K.; Garcia, Y. 1,2,4-Triazole-based molecular switches: Crystal structures, Hirshfeld surface analysis and optical properties. CrystEngComm 2016, 18, 7284–7294. [Google Scholar] [CrossRef]
- Shapenova, D.S.; Shiryaev, A.A.; Bolte, M.; Kukułka, M.; Szczepanik, D.W.; Hooper, J.; Babashkina, M.G.; Mahmoudi, G.; Mitoraj, M.P.; Safin, D.A. Resonance Assisted Hydrogen Bonding Phenomenon Unveiled from Both Experiment and Theory–an Example of New Family of Ethyl N-salicylideneglycinate Dyes. Chem. Eur. J. 2020, 26, 12987–12995. [Google Scholar] [CrossRef]
- Shiryaev, A.A.; Burkhanova, T.M.; Mahmoudi, G.; Babashkina, M.G.; Safin, D.A. Photophysical properties of ethyl N-(5-bromosalicylidene)glycinate and ethyl N-(5-nitrosalicylidene)glycinate in CH2Cl2. J. Lumin. 2020, 226, 117454. [Google Scholar] [CrossRef]
- Hadjoudis, E.; Vittorakis, M.; Moustakali-Mavridis, I. Photochromism and thermochromism of schiff bases in the solid state and in rigid glasses. Tetrahedron 1987, 43, 1345–1360. [Google Scholar] [CrossRef]
- Hadjoudis, E.; Mavridis, I.M. Photochromism and thermochromism of Schiff bases in the solid state: Structural aspects. Chem. Soc. Rev. 2004, 33, 579–588. [Google Scholar] [CrossRef]
- Amimoto, K.; Kawato, T. Photochromism of organic compounds in the crystal state. J. Photochem. Photobiol. C 2005, 6, 207–226. [Google Scholar] [CrossRef]
- Haneda, T.; Kawano, M.; Kojima, T.; Fujita, M. Thermo-to-photo-switching of the chromic behavior of salicylideneanilines by inclusion in a porous coordination network. Angew. Chem. Int. Ed. 2007, 46, 6643–6645. [Google Scholar] [CrossRef]
- Filarowski, A.; Koll, A.; Sobczyk, L. Intramolecular Hydrogen Bonding in o-hydroxy Aryl Schiff Bases. Curr. Org. Chem. 2009, 13, 172–193. [Google Scholar] [CrossRef]
- Bertolasi, V.; Gilli, P.; Gilli, G. Crystal Chemistry and Prototropic Tautomerism in 2-(1-Iminoalkyl)- phenols (or naphthols) and 2-Diazenyl-phenols (or naphthols). Curr. Org. Chem. 2009, 13, 250–268. [Google Scholar] [CrossRef]
- Hadjoudis, E.; Chatziefthimiou, S.D.; Mavridis, I.M. Anils: Photochromism by H-transfer. Curr. Org. Chem. 2009, 13, 269–286. [Google Scholar] [CrossRef]
- Minkin, V.I.; Tsukanov, A.V.; Dubonosov, A.D.; Bren, V.A. Tautomeric Schiff bases: Iono-, solvato-, thermo-and photochromism. J. Mol. Struct. 2011, 998, 179–191. [Google Scholar] [CrossRef]
- Inokuma, Y.; Kawano, M.; Fujita, M. Crystalline molecular flasks. Nat. Chem. 2011, 3, 349–358. [Google Scholar] [CrossRef]
- Mahmudov, K.T.; Pombeiro, A.J.L. Resonance-Assisted Hydrogen Bonding as a Driving Force in Synthesis and a Synthon in the Design of Materials. Chem. Eur. J. 2016, 22, 16356–16398. [Google Scholar] [CrossRef] [PubMed]
- Jana, S.; Dalapati, S.; Guchhait, N. Proton Transfer Assisted Charge Transfer Phenomena in Photochromic Schiff Bases and Effect of–NEt2 Groups to the Anil Schiff Bases. J. Phys. Chem. A 2012, 116, 10948–10958. [Google Scholar] [CrossRef]
- Germino, J.C.; Barboza, C.A.; Quites, F.J.; Vazquez, P.A.M.; Atvars, T.D.Z. Dual Emissions of Salicylidene-5-chloroaminepyridine Due to Excited State Intramolecular Proton Transfer: Dynamic Photophysical and Theoretical Studies. J. Phys. Chem. C 2015, 119, 27666–27675. [Google Scholar] [CrossRef]
- Zhao, L.; Sui, D.; Chai, J.; Wang, Y.; Jiang, S. Digital Logic Circuit Based on a Single Molecular System of Salicylidene Schiff Base. J. Phys. Chem. B 2006, 110, 24299–24304. [Google Scholar] [CrossRef] [PubMed]
- Kleij, A.W. New Templating Strategies with Salen Scaffolds (Salen = N,N′-Bis(salicylidene)ethylenediamine Dianion). Chem. Eur. J. 2008, 14, 10520–10529. [Google Scholar] [CrossRef] [PubMed]
- Cheng, J.; Ma, X.; Zhang, Y.; Liu, J.; Zhou, X.; Xiang, H. Optical Chemosensors Based on Transmetalation of Salen-Based Schiff Base Complexes. Inorg. Chem. 2014, 53, 3210–3219. [Google Scholar] [CrossRef] [PubMed]
- Martín, C.; Fiorani, G.; Kleij, A.W. Recent Advances in the Catalytic Preparation of Cyclic Organic Carbonates. ACS Catal. 2015, 5, 1353–1370. [Google Scholar] [CrossRef]
- Fiorani, G.; Guo, W.; Kleij, A.W. Sustainable conversion of carbon dioxide: The advent of organocatalysis. Green Chem. 2015, 17, 1375–1389. [Google Scholar] [CrossRef]
- Beens, H.; Grellmann, K.H.; Gurr, M.; Weller, A.H. Effect of solvent and temperature on proton transfer reactions of excited molecules. Discuss. Faraday Soc. 1965, 39, 183–193. [Google Scholar] [CrossRef]
- Zhao, J.; Ji, S.; Chen, Y.; Guo, H.; Yang, P. Excited state intramolecular proton transfer (ESIPT): From principal photophysics to the development of new chromophores and applications in fluorescent molecular probes and luminescent materials. Phys. Chem. Chem. Phys. 2012, 14, 8803–8817. [Google Scholar] [CrossRef]
- Padalkar, V.S.; Seki, S. Excited-state intramolecular proton-transfer (ESIPT)-inspired solid state emitters. Chem. Soc. Rev. 2016, 45, 169–202. [Google Scholar] [CrossRef]
- Spackman, M.A.; Jayatilaka, D. Hirshfeld surface analysis. CrystEngComm 2009, 11, 19–32. [Google Scholar] [CrossRef]
- Spackman, M.A.; McKinnon, J.J. Fingerprinting intermolecular interactions in molecular crystals. CrystEngComm 2002, 4, 378–392. [Google Scholar] [CrossRef]
- Wolff, S.K.; Grimwood, D.J.; McKinnon, J.J.; Turner, M.J.; Jayatilaka, D.; Spackman, M.A. CrystalExplorer 3.1; University of Western Australia: Perth, Australia, 2012. [Google Scholar]
- Jelsch, C.; Ejsmont, K.; Huder, L. The enrichment ratio of atomic contacts in crystals, an indicator derived from the Hirshfeld surface analysis. IUCrJ 2014, 1, 119–128. [Google Scholar] [CrossRef] [PubMed]
- Alarcón, S.H.; Olivieri, A.C.; Sanz, D.; Claramunt, R.M.; Elguero, J. Substituent and solvent effects on the proton transfer equilibrium in anils and azo derivatives of naphthol. Multinuclear NMR study and theoretical calculations. J. Mol. Struct. 2004, 705, 1–9. [Google Scholar] [CrossRef]
- Nagy, P.I.; Fabian, W.M.F. Theoretical Study of the Enol Imine ↔ Enaminone Tautomeric Equilibrium in Organic Solvents. J. Phys. Chem. B 2006, 110, 25026–25032. [Google Scholar] [CrossRef] [PubMed]
- Krygowski, T.M.; Woźniak, K.; Anulewicz, R.; Pawlak, D.; Kolodziejski, W.; Grech, E.; Szady, A. Through-Resonance Assisted Ionic Hydrogen Bonding in 5-Nitro-N-salicylideneethylamine. J. Phys. Chem. A 1997, 101, 9399–9404. [Google Scholar] [CrossRef]
- Geerlings, P.; De Proft, F.; Langenaeker, W. Conceptual Density Functional Theory. Chem. Rev. 2003, 103, 1793–1873. [Google Scholar] [CrossRef]
- Dennington, R.; Keith, T.A.; Millam, J.M. GaussView, Version 6.0; Semichem Inc., Shawnee Mission: Shawnee, Kansas, 2016. [Google Scholar]
- Frisch, M.J.; Trucks, G.W.; Schlegel, H.B.; Scuseria, G.E.; Robb, M.A.; Cheeseman, J.R.; Scalmani, G.; Barone, V.; Mennucci, B.; Petersson, G.A.; et al. Gaussian 09, Revision D.01; Gaussian, Inc.: Pittsburgh, PA, USA, 2016. [Google Scholar]
- Krishnan, R.; Binkley, J.S.; Seeger, R.; Pople, J.A. Self-consistent molecular orbital methods. XX. A basis set for correlated wave functions. J. Chem. Phys. 1980, 72, 650–654. [Google Scholar] [CrossRef]
- Becke, A.D. Density-functional thermochemistry. III. The role of exact exchange. J. Chem. Phys. 1993, 98, 5648–5652. [Google Scholar] [CrossRef]
- Frisch, M.J.; Pople, J.A.; Binkley, J.S. Self-consistent molecular orbital methods 25. Supplementary functions for Gaussian basis sets. J. Chem. Phys. 1984, 8, 3265–3269. [Google Scholar] [CrossRef]


 |  |  |  | ||||||||||||||
| H | C | N | O | H | C | N | O | H | C | N | O | Br | H | C | N | O | |
| Contacts (C, %) 1 | |||||||||||||||||
| H | 48.3 | – | – | – | 45.5 | – | – | – | 35.4 | – | – | – | – | 30.0 | – | – | – |
| C | 22.6 | 0.0 | – | – | 20.9 | 0.6 | – | – | 13.7 | 4.1 | – | – | – | 11.5 | 4.9 | – | – |
| N | 2.4 | 0.0 | 0.0 | – | 2.4 | 0.0 | 0.0 | – | 1.9 | 0.4 | 0.0 | – | – | 3.3 | 0.6 | 0.0 | – |
| O | 24.9 | 1.2 | 0.0 | 0.6 | 30.1 | 0.3 | 0.0 | 0.3 | 23.4 | 1.6 | 0.5 | 0.2 | – | 44.1 | 1.8 | 1.7 | 2.1 |
| Br | – | – | – | – | – | – | – | – | 17.4 | 0.5 | 0.0 | 0.0 | 0.9 | – | – | – | – |
| Surface (S, %) | |||||||||||||||||
| 73.3 | 11.9 | 1.2 | 13.7 | 72.2 | 11.2 | 1.2 | 15.5 | 63.6 | 12.2 | 1.4 | 13.0 | 9.9 | 59.5 | 11.9 | 2.8 | 25.9 | |
| Random contacts (R, %) | |||||||||||||||||
| H | 53.7 | – | – | – | 52.1 | – | – | – | 40.4 | – | – | – | – | 35.4 | – | – | – |
| C | 17.4 | 1.4 | – | – | 16.2 | 1.3 | – | – | 15.5 | 1.5 | – | – | – | 14.2 | 1.4 | – | – |
| N | 1.8 | 0.0 | 0.0 | – | 1.7 | 0.0 | 0.0 | – | 1.8 | 0.3 | 0.0 | – | – | 3.3 | 0.0 | 0.1 | – |
| O | 20.1 | 3.3 | 0.3 | 1.9 | 22.4 | 3.5 | 0.4 | 2.4 | 16.5 | 3.2 | 0.4 | 1.7 | – | 30.8 | 6.2 | 1.5 | 6.7 |
| Br | – | – | – | – | – | – | – | – | 12.6 | 2.4 | 0.3 | 2.6 | 1.0 | – | – | – | – |
| Enrichment (E) 2 | |||||||||||||||||
| H | 0.90 | – | – | – | 0.87 | – | – | – | 0.88 | – | – | – | – | 0.85 | – | – | – |
| C | 1.30 | 0.0 | – | – | 1.29 | 0.46 | – | – | 0.88 | 2.73 | – | – | – | 0.81 | 3.50 | – | – |
| N | 1.33 | – | – | – | 1.41 | – | – | – | 1.06 | – | – | – | – | 1.00 | – | – | – |
| O | 1.24 | 0.36 | – | 0.32 | 1.34 | 0.09 | – | 0.13 | 1.42 | 0.50 | – | 0.12 | – | 1.43 | 0.29 | 1.13 | 0.31 |
| Br | – | – | – | – | – | – | – | – | 1.38 | 0.21 | – | 0.0 | 0.90 | – | – | – | – |
| 1 | 2 | 3 | 4 | |
|---|---|---|---|---|
| Bond lengths | ||||
| C=N | 1.2816 | 1.2821 | 1.2800 | 1.2787 |
| C–O(H) | 1.3410 | 1.3448 | 1.3390 | 1.3298 |
| C=O | 1.2034 | 1.2036 | 1.2030 | 1.2031 |
| C–O(Et) | 1.3462 | 1.3461 | 1.8529 | 1.3440 |
| Bond angles | ||||
| C=N–C | 119.04 | 118.98 | 119.17 | 119.43 |
| Dihedral angles 2 | ||||
| N–C–C=O | 29.12 | −31.15 | 24.53 | 21.83 |
| O=C–O–C | 1.54 | −1.44 | 1.53 | 1.46 |
| C–O–C–C | −179.86 | 179.95 | −0.21 | 179.87 |
| Hydrogen bonds | ||||
| O–H | 0.9927 | 0.9913 | 0.9933 | 0.9985 |
| H∙∙∙N | 1.7472 | 1.7546 | 1.7464 | 1.7200 |
| O∙∙∙N | 5.6362 | 2.6395 | 2.6342 | 2.6160 |
| ∠(O–H∙∙∙N) | 147.05 | 146.66 | 146.79 | 147.22 |
| 1 | 2 | 3 | 4 | |
|---|---|---|---|---|
| enol-imine tautomer | ||||
| Total energy (eV) | −19,255.75967 | −22,372.91079 | −89,285.41965 | −24,822.27922 |
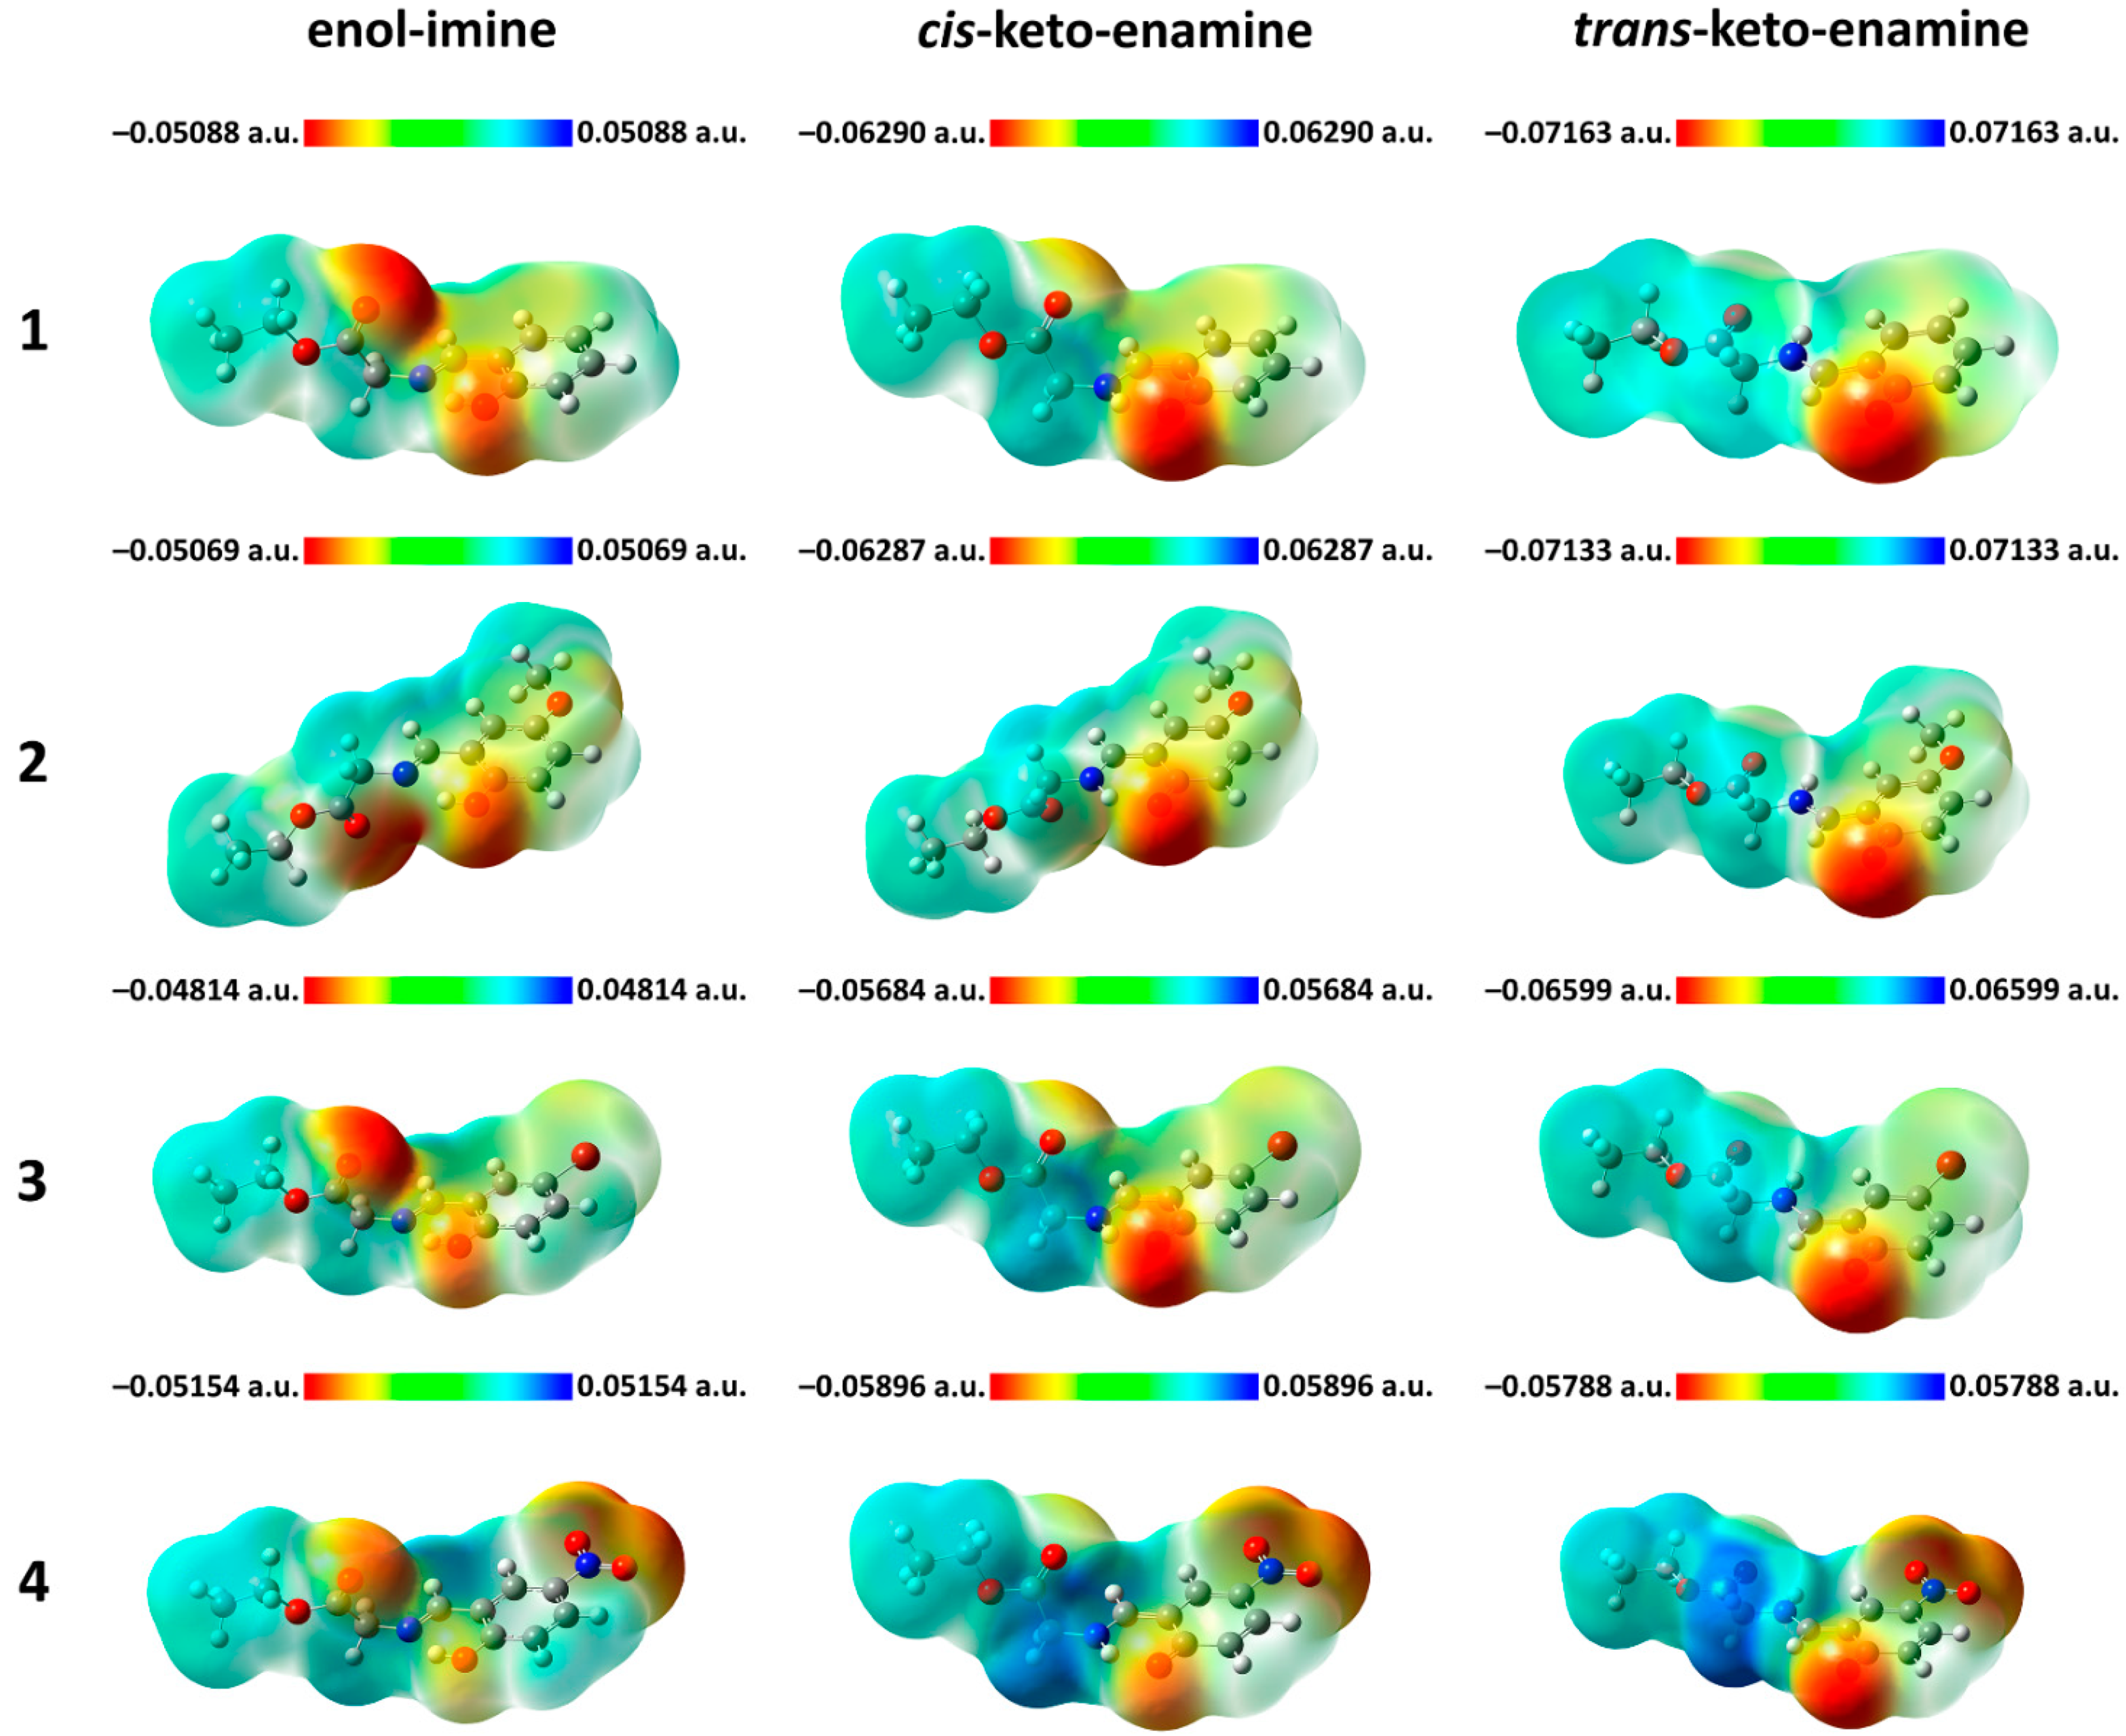
| Dipole moment (Debye) | 3.279813 | 4.290475 | 4.070018 | 6.97922 |
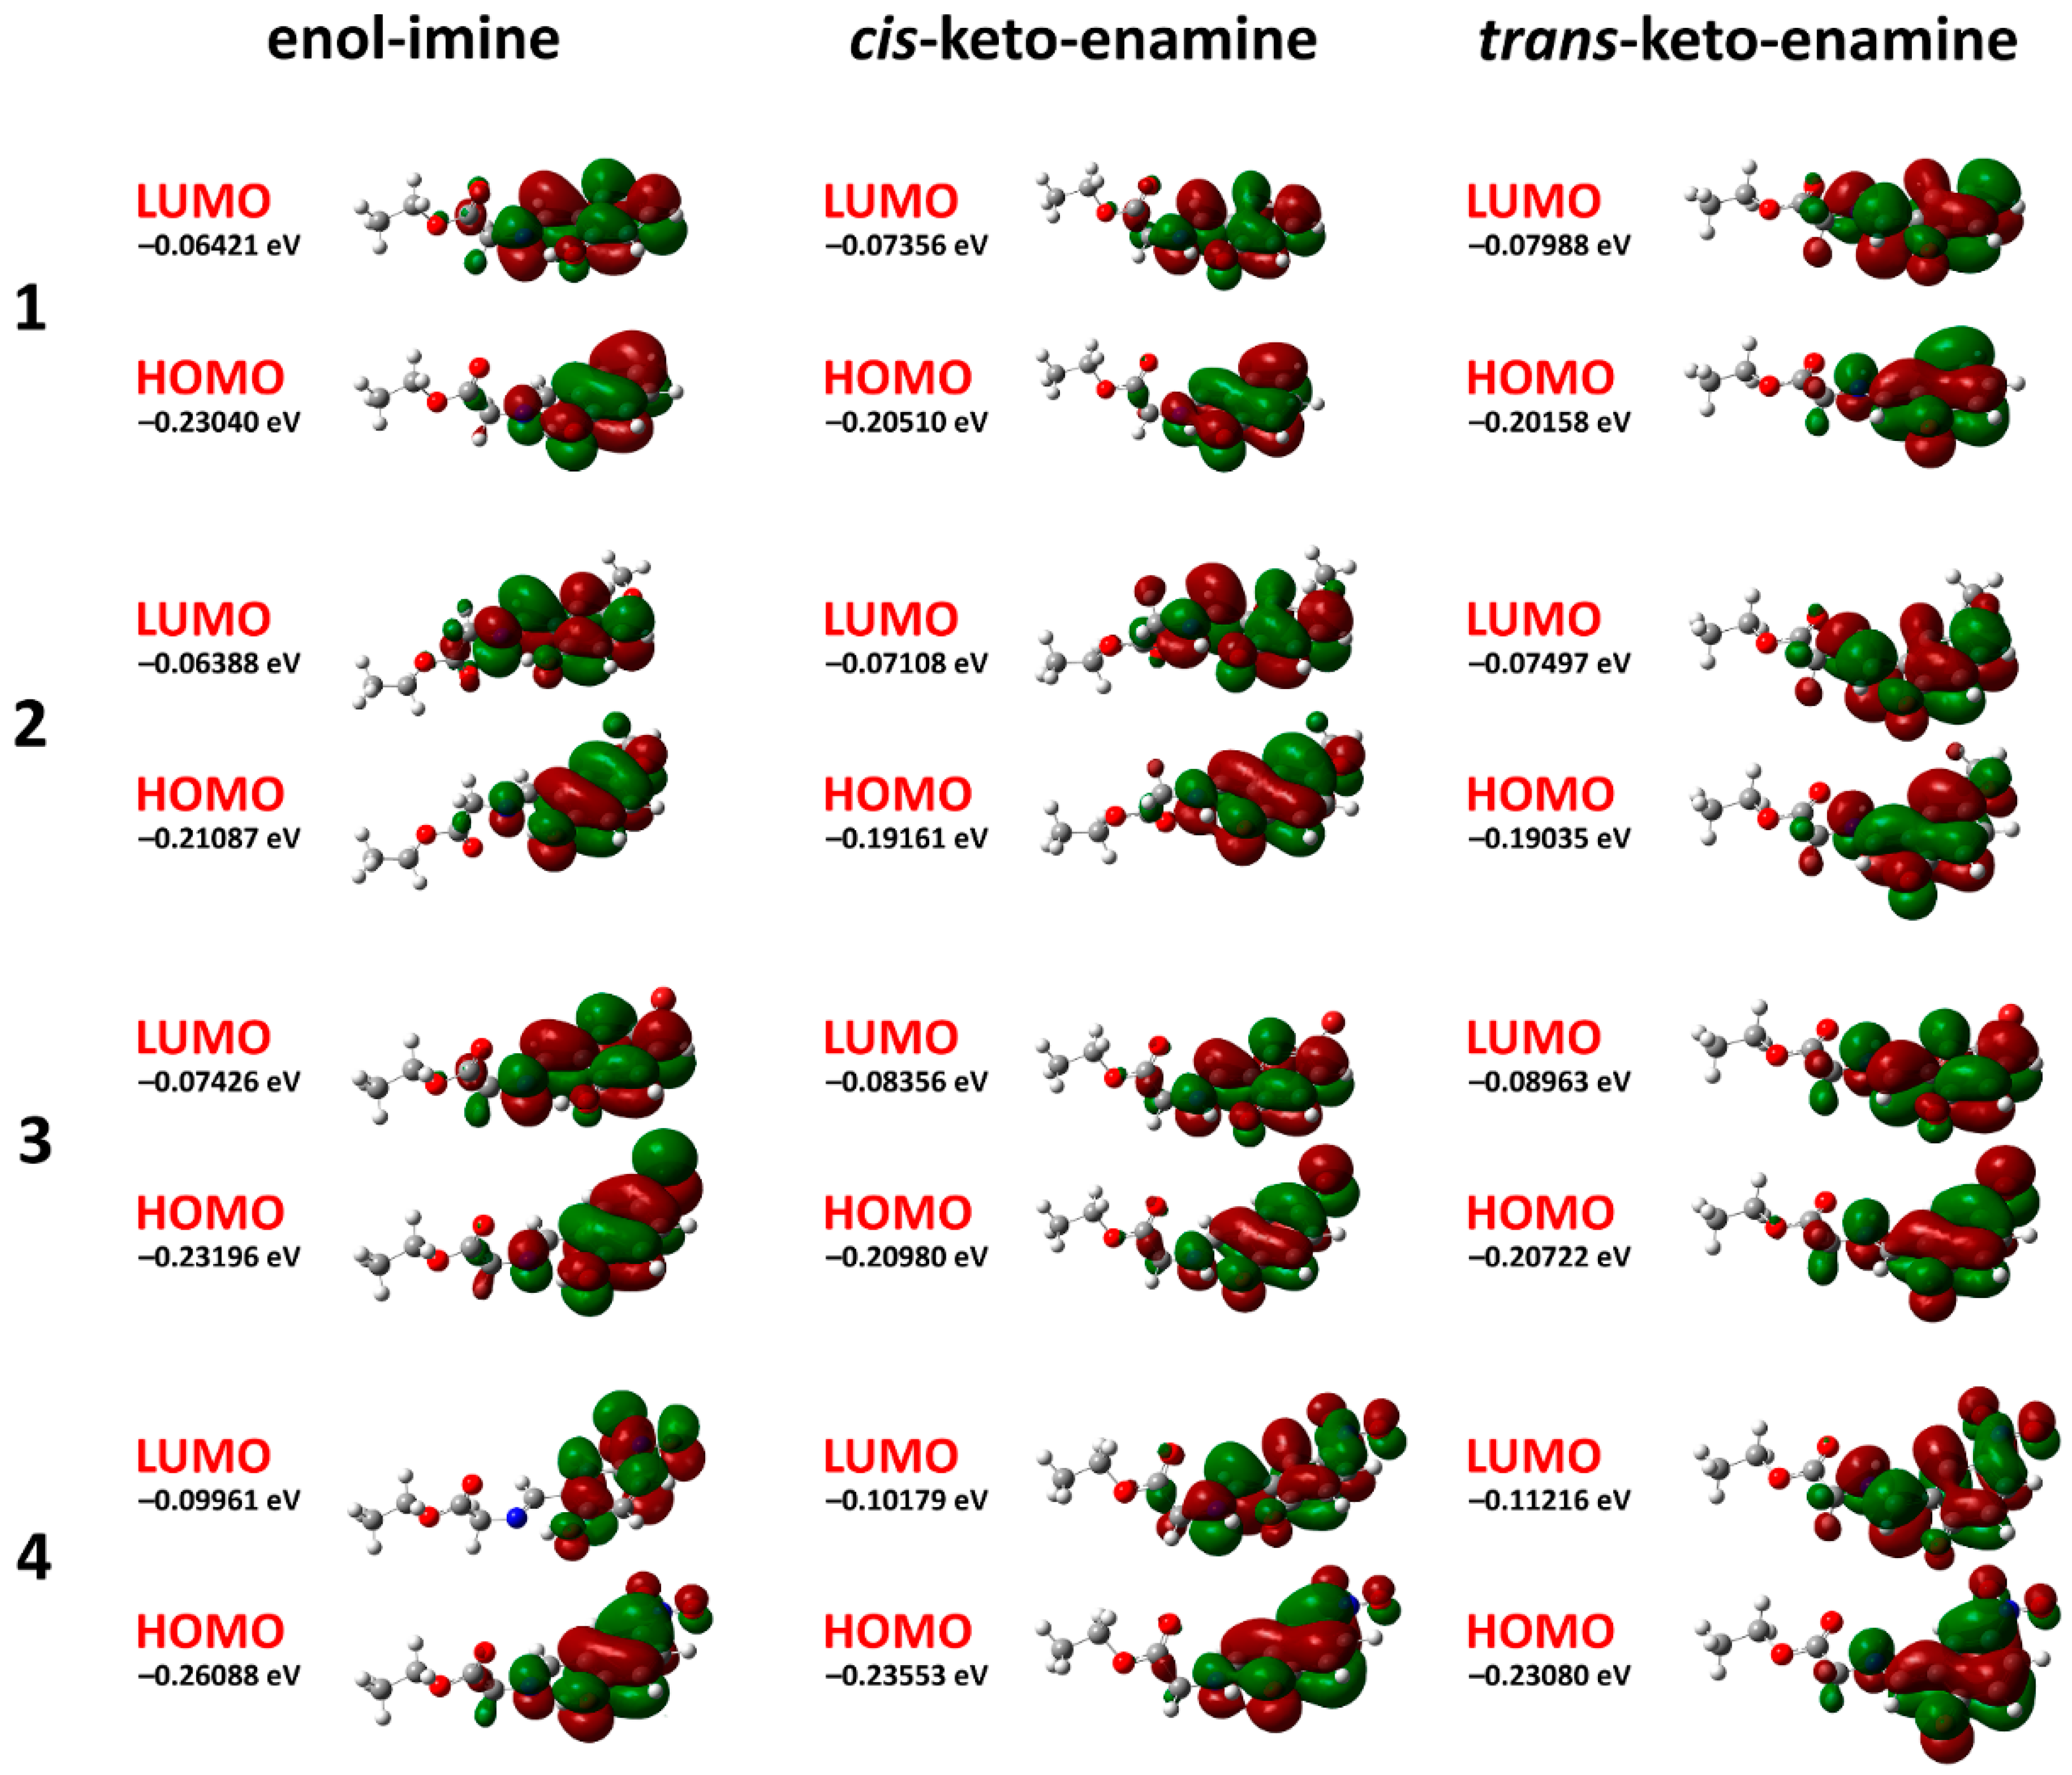
| EHOMO (eV) | −0.23040 | −0.21087 | −0.23196 | −0.26088 |
| ELUMO (eV) | −0.06421 | −0.06388 | −0.07426 | −0.09961 |
| ΔELUOMO–HOMO = ELUMO−EHOMO (eV) | 0.16619 | 0.14699 | 0.15770 | 0.16127 |
| Ionization energy, I = −EHOMO (eV) | 0.23040 | 0.21087 | 0.23196 | 0.26088 |
| Electron affinity, A = −ELUMO (eV) | 0.06421 | 0.06388 | 0.07426 | 0.09961 |
| Electronegativity, χ = (I + A)/2 (eV) | 0.14731 | 0.13738 | 0.15311 | 0.18025 |
| Chemical potential, μ = −χ (eV) | −0.14731 | −0.13738 | −0.15311 | −0.18025 |
| Global chemical hardness, η = (I−A)/2 (eV) | 0.08310 | 0.07350 | 0.07885 | 0.08064 |
| Global chemical softness, S = 1/(2η) (eV−1) | 6.01721 | 6.80318 | 6.34115 | 6.20078 |
| Global electrophilicity index, ω = μ2/(2η) (eV) | 0.13057 | 0.12839 | 0.14865 | 0.20145 |
| Global nucleophilicity index, E = μ × η (eV2) | −0.01224 | −0.01010 | −0.01207 | −0.01453 |
| Maximum additional electric charge, ΔNmax = −μ/ƞ | 1.77273 | 1.86917 | 1.94179 | 2.23532 |
| cis-keto-enamine tautomer | ||||
| Total energy (eV) | −19,255.55920 | −22,372.72632 | −89,285.24115 | −24,822.17304 |
| Dipole moment (Debye) | 5.623354 | 6.171161 | 6.678792 | 10.089039 |
| EHOMO (eV) | −0.20510 | −0.19161 | −0.20980 | −0.23553 |
| ELUMO (eV) | −0.07356 | −0.07108 | −0.08356 | −0.10179 |
| ΔELUOMO–HOMO = ELUMO−EHOMO (eV) | 0.13154 | 0.12053 | 0.12624 | 0.13374 |
| Ionization energy, I = −EHOMO (eV) | 0.20510 | 0.19161 | 0.20980 | 0.23553 |
| Electron affinity, A = −ELUMO (eV) | 0.07356 | 0.07108 | 0.08356 | 0.10179 |
| Electronegativity, χ = (I + A)/2 (eV) | 0.13933 | 0.13135 | 0.14668 | 0.16866 |
| Chemical potential, μ = −χ (eV) | −0.13933 | −0.13135 | −0.14668 | −0.16866 |
| Global chemical hardness, η = (I−A)/2 (eV) | 0.06577 | 0.06027 | 0.06312 | 0.06687 |
| Global chemical softness, S = 1/(2η) (eV−1) | 7.60225 | 8.29669 | 7.92142 | 7.47719 |
| Global electrophilicity index, ω = μ2/(2η) (eV) | 0.14758 | 0.14313 | 0.17043 | 0.21270 |
| Global nucleophilicity index, E = μ × η (eV2) | −0.00916 | −0.00792 | −0.00926 | −0.01128 |
| Maximum additional electric charge, ΔNmax = −μ/ƞ | 2.11844 | 2.17946 | 2.32383 | 2.52221 |
| trans-keto-enamine tautomer | ||||
| Total energy (eV) | −19,255.22025 | −22,372.44811 | −89,284.91121 | −24,821.82359 |
| Dipole moment (Debye) | 7.396322 | 7.781535 | 7.644000 | 10.221661 |
| EHOMO (eV) | −0.20158 | −0.19035 | −0.20722 | −0.23080 |
| ELUMO (eV) | −0.07988 | −0.07497 | −0.08963 | −0.11216 |
| ΔELUOMO–HOMO = ELUMO−EHOMO (eV) | 0.12170 | 0.11538 | 0.11759 | 0.11864 |
| Ionization energy, I = −EHOMO (eV) | 0.20158 | 0.19035 | 0.20722 | 0.23080 |
| Electron affinity, A = −ELUMO (eV) | 0.07988 | 0.07497 | 0.08963 | 0.11216 |
| Electronegativity, χ = (I + A)/2 (eV) | 0.14073 | 0.13266 | 0.14843 | 0.17148 |
| Chemical potential, μ = −χ (eV) | −0.14073 | −0.13266 | −0.14843 | −0.17148 |
| Global chemical hardness, η = (I−A)/2 (eV) | 0.06085 | 0.05769 | 0.05880 | 0.05932 |
| Global chemical softness, S = 1/(2η) (eV−1) | 8.21693 | 8.66701 | 8.50412 | 8.42886 |
| Global electrophilicity index, ω = μ2/(2η) (eV) | 0.16274 | 0.15253 | 0.18735 | 0.24785 |
| Global nucleophilicity index, E = μ × η (eV2) | −0.00856 | −0.00765 | −0.00873 | −0.01017 |
| Maximum additional electric charge, ΔNmax = –μ/ƞ | 2.31274 | 2.29953 | 2.52445 | 2.89076 |
| 1 | 2 | ||||
| λmax (nm) | Oscillator strength | Transitions | λmax (nm) | Oscillator strength | Transitions |
| 220.6 | 0.1419 | HOMO–3 → LUMO (14.0%) | 239.1 | 0.2994 | HOMO–3 → LUMO (9.0%) |
| HOMO–1 → LUMO (8.1%) | HOMO–1 → LUMO (26.8%) | ||||
| HOMO–1 → LUMO+3 (2.5%) | HOMO → LUMO+3 (50.2%) | ||||
| HOMO–1 → LUMO+9 (2.0%) | HOMO → LUMO+10 (3.4%) | ||||
| HOMO → LUMO+1 (2.7%) | HOMO → LUMO+13 (2.3%) | ||||
| HOMO → LUMO+2 (10.7%) | |||||
| HOMO → LUMO+3 (44.7%) | |||||
| HOMO → LUMO+9 (7.2%) | |||||
| 222.6 | 0.0311 | HOMO → LUMO+1 (5.6%) | 244.3 | 0.0188 | HOMO–1 → LUMO (2.8%) |
| HOMO → LUMO+2 (45.0%) | HOMO → LUMO+1 (3.7%) | ||||
| HOMO → LUMO+3 (24.2%) | HOMO → LUMO+2 (85.9%) | ||||
| HOMO → LUMO+4 (8.6%) | HOMO → LUMO+5 (3.9%) | ||||
| HOMO → LUMO+5 (7.5%) | |||||
| 228.5 | 0.0315 | HOMO–3 → LUMO (70.8%) | 251.2 | 0.0720 | HOMO–1 → LUMO (21.3%) |
| HOMO–3 → LUMO+1 (4.0%) | HOMO → LUMO+1 (7.1%) | ||||
| HOMO–3 → LUMO+3 (2.4%) | HOMO → LUMO+3 (45.5%) | ||||
| HOMO → LUMO+2 (12.3%) | HOMO → LUMO+4 (23.2%) | ||||
| HOMO → LUMO+3 (3.5%) | |||||
| 252.8 | 0.2896 | HOMO–1 → LUMO (76.5%) | 256.6 | 0.0742 | HOMO–1 → LUMO (33.4%) |
| HOMO → LUMO (3.2%) | HOMO → LUMO+3 (49.0%) | ||||
| HOMO → LUMO+1 (4.7%) | HOMO → LUMO+4 (10.9%) | ||||
| HOMO → LUMO+2 (9.8%) | |||||
| 312.1 | 0.1055 | HOMO–1 → LUMO (2.3%) | 350.5 | 0.1086 | HOMO → LUMO (96.9%) |
| HOMO → LUMO (93.9%) | |||||
| 3 | 4 | ||||
| λmax (nm) | Oscillator strength | Transitions | λmax (nm) | Oscillator strength | Transitions |
| 224.7 | 0.0487 | HOMO–5 → LUMO (10.6%) | 240.4 | 0.0556 | HOMO–3 → LUMO (85.4%) |
| HOMO → LUMO+4 (57.1%) | HOMO–1 → LUMO+1 (9.6%) | ||||
| HOMO → LUMO+5 (23.2%) | |||||
| 228.4 | 0.2498 | HOMO–5 → LUMO (3.1%) | 244.8 | 0.2633 | HOMO–3 → LUMO (8.1%) |
| HOMO–4 → LUMO (32.2%) | HOMO–3 → LUMO+1 (29.7%) | ||||
| HOMO–1 → LUMO (16.9%) | HOMO–1 → LUMO+1 (55.7%) | ||||
| HOMO → LUMO+1 (17.2%) | |||||
| HOMO → LUMO+2 (6.0%) | |||||
| HOMO → LUMO+3 (7.5%) | |||||
| HOMO → LUMO+5 (2.3%) | |||||
| HOMO → LUMO+8 (3.9%) | |||||
| 237.8 | 0.2157 | HOMO–4 → LUMO (28.8%) | 273.4 | 0.1054 | HOMO–1 → LUMO (77.0%) |
| HOMO–3 → LUMO (2.9%) | HOMO → LUMO+1 (18.3%) | ||||
| HOMO–1 → LUMO (16.3%) | |||||
| HOMO → LUMO+1 (32.7%) | |||||
| HOMO → LUMO+2 (2.6%) | |||||
| HOMO → LUMO+3 (9.3%) | |||||
| HOMO → LUMO+4 (2.1%) | |||||
| 252.7 | 0.1308 | HOMO–1 → LUMO (57.9%) | 299.4 | 0.0744 | HOMO–1 → LUMO (13.6%) |
| HOMO → LUMO+1 (35.1%) | HOMO → LUMO (34.4%) | ||||
| HOMO → LUMO+1 (48.9%) | |||||
| 329.3 | 0.0858 | HOMO → LUMO (95.7%) | 308.7 | 0.2162 | HOMO–1 → LUMO (5.1%) |
| HOMO–1 → LUMO+1 (3.1%) | |||||
| HOMO → LUMO (61.8%) | |||||
| HOMO → LUMO+1 (28.9%) | |||||
Publisher’s Note: MDPI stays neutral with regard to jurisdictional claims in published maps and institutional affiliations. |
© 2021 by the authors. Licensee MDPI, Basel, Switzerland. This article is an open access article distributed under the terms and conditions of the Creative Commons Attribution (CC BY) license (https://creativecommons.org/licenses/by/4.0/).
Share and Cite
Alkhimova, L.E.; Babashkina, M.G.; Safin, D.A. A Family of Ethyl N-Salicylideneglycinate Dyes Stabilized by Intramolecular Hydrogen Bonding: Photophysical Properties and Computational Study. Molecules 2021, 26, 3112. https://doi.org/10.3390/molecules26113112
Alkhimova LE, Babashkina MG, Safin DA. A Family of Ethyl N-Salicylideneglycinate Dyes Stabilized by Intramolecular Hydrogen Bonding: Photophysical Properties and Computational Study. Molecules. 2021; 26(11):3112. https://doi.org/10.3390/molecules26113112
Chicago/Turabian StyleAlkhimova, Larisa E., Maria G. Babashkina, and Damir A. Safin. 2021. "A Family of Ethyl N-Salicylideneglycinate Dyes Stabilized by Intramolecular Hydrogen Bonding: Photophysical Properties and Computational Study" Molecules 26, no. 11: 3112. https://doi.org/10.3390/molecules26113112
APA StyleAlkhimova, L. E., Babashkina, M. G., & Safin, D. A. (2021). A Family of Ethyl N-Salicylideneglycinate Dyes Stabilized by Intramolecular Hydrogen Bonding: Photophysical Properties and Computational Study. Molecules, 26(11), 3112. https://doi.org/10.3390/molecules26113112