1. Introduction
Amlodipine (AML) belongs to a 1,4-dihydropyridine (DHP) family of L-Type Ca
2+-channels (LCC) blockers [
1,
2,
3,
4,
5]. The drug is widely used to treat high blood pressure, coronary artery disease, and angina pectoris [
3]. Recent data show that AML has potent anti-SARS-CoV-2 activity [
6,
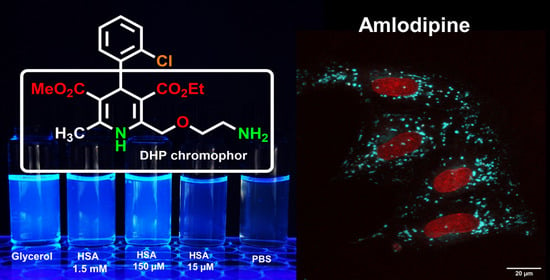
7]. Its physicochemical, pharmacological and pharmacokinetic properties differ from those of other LCC blockers in DHP group, mainly due to the presence of 2-(2-aminoethoxy)methyl side group in the 1,4-dihydropyridine residue (
Figure 1a) [
1,
5]. One of these properties is very slow rate of AML interaction with the Ca
V1.2α, a membrane subunit of LCC that forms a Ca
2+-selective pore and regulates the Ca
2+ influx into the cell [
1,
2,
8]. The long-lasting Ca
2+ antagonistic activity of AML is attributed to its slow on/off- kinetics and to its electrostatic interactions with the phospholipid head groups leading to drug concentration in the membrane [
8]. AML has weak fluorescence in aqueous solutions (λ
ex = 365 nm; λ
em = 450 nm;
Φ ~ 0.04); but shows up to 9-fold fluorescence enhancement in human serum albumin (HSA) and human plasma [
9,
10].
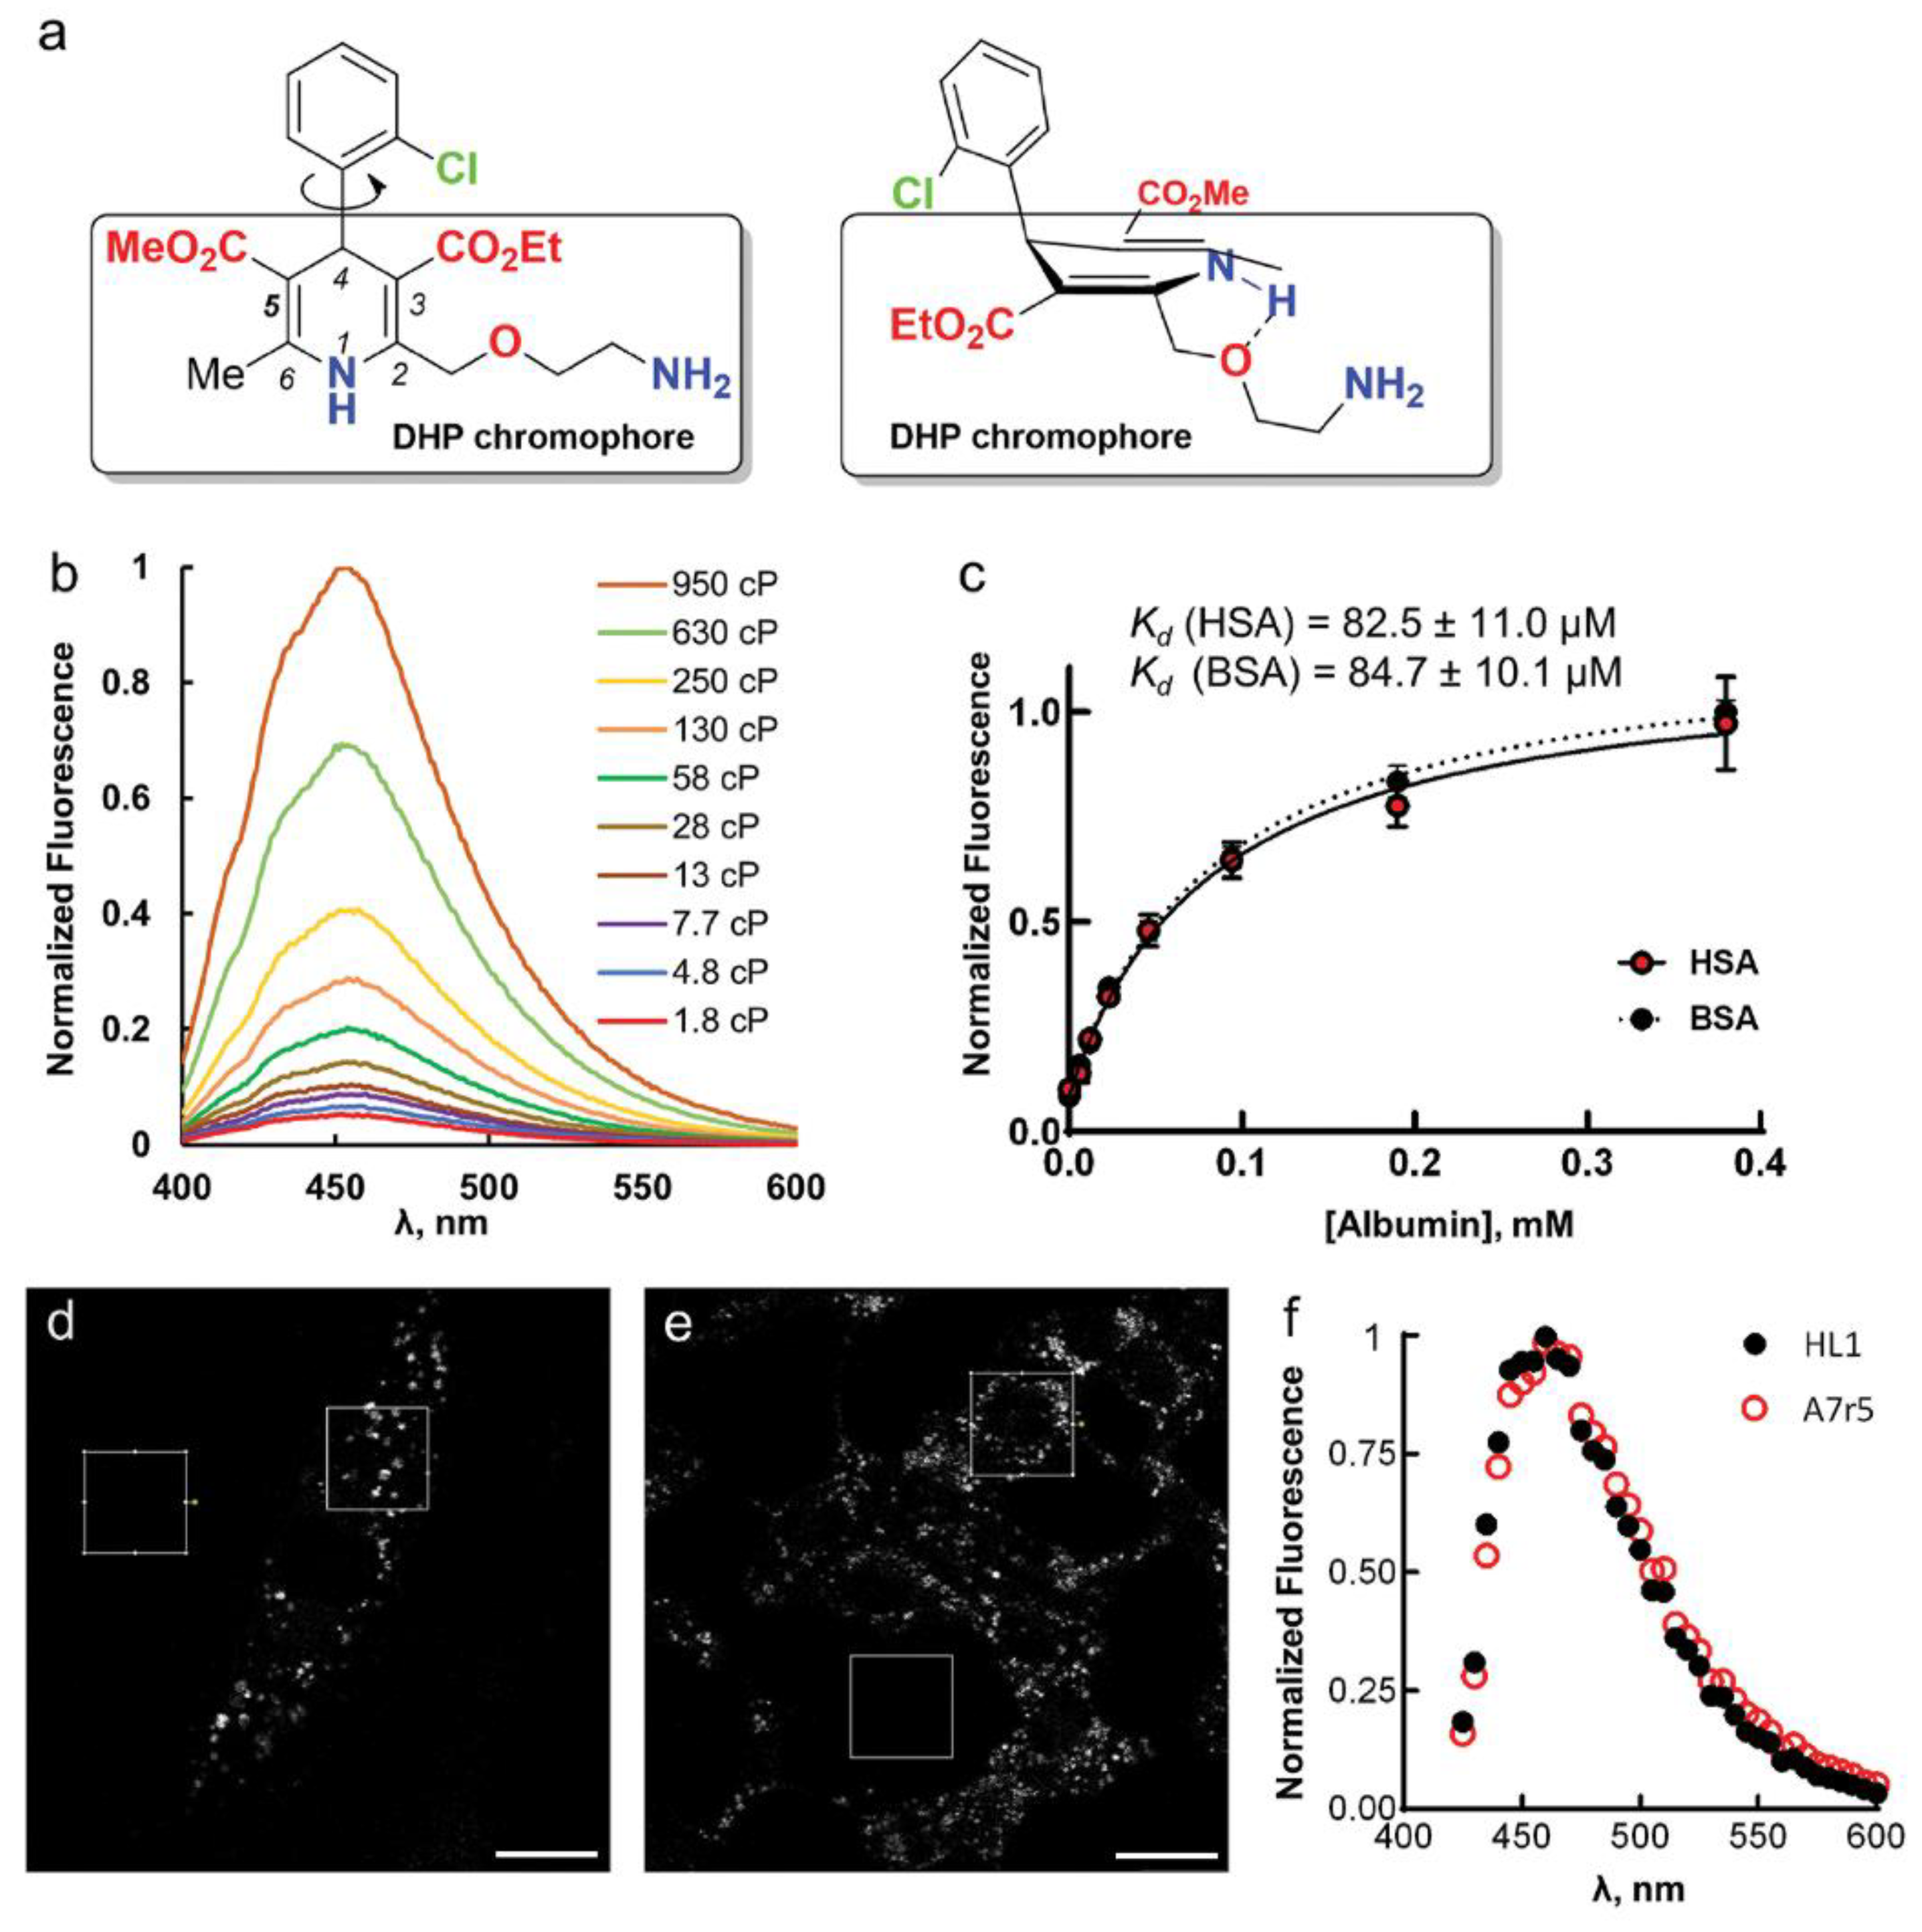
Our calculations show that the fluorescence loss in aqueous solutions is caused by the nonradiative relaxation and proceeds through the conical intersection between the ground state (S
0) and the lowest excited singlet state (S
1). This is achieved by the rotation of 2-chlorophenyl ring followed by the DHP fragment deformation. Suppression of such large amplitude motion in AML, for example by a viscous medium, leads to the fluorescence enhancement. When bound to a protein, the motion of the ligand is severely limited [
11]. If the binding event is accompanied with the emission increase, it becomes easily detectable. Using fluorescence saturation assay, we were able to measure the binding affinity of AML to Bovine Serum Albumin (BSA) and HSA. Though the fluorescence of AML has been previously reported [
9,
10], no attempt has been made so far to use its emission for visualization of the drug distribution in living cells. We found that the AML fluorescence is sufficiently bright and stable to allow its visualization inside living cells by confocal microscopy. We demonstrated that AML is rapidly sequestered into acidic compartments—late endosomes and lysosomes, and propose that these compartments serve as drug pools, which contribute to the long-lasting activity of AML.
2. Results
Upon AML binding to the BSA/HSA hydrophobic pocket, the fluorescence intensity (
Ifl) increases (
Figure S1, Supplementary Materials) [
9]. We observed that the quantum yield (
Φ) and the lifetime (
τ) of AML fluorescence were significantly higher in the presence of BSA or HSA than for a free drug (
Table 1). The self-aggregation of AML is not responsible for this emission enhancement, as addition of anionic surfactant, sodium dodecyl sulfate (SDS), had little effect on
Ifl of AML (
Figure S2, Supplementary Materials). To study whether the ligand translocation from the polar solvent to nonpolar binding site can lead to fluorescence enhancement, we recorded AML absorption and emission spectra in different solvents and found no correlation between dielectric constant and fluorescence increase. In general, the
Ifl enhancement, compared with aqueous AML solutions, was stronger in polar, aprotic solvents and glycerol (
Figure S3, Supplementary Materials). The bathofluoric shift (~80 nm) in DMSO, DMF and DMAA solutions is presumably related to an intermolecular N-H…O hydrogen bond between AML and a solvent [
13]. The double-peak emission band (430 and 445 nm) observed in BSA/HSA solutions may be a vibronic effect, which is supported by quantum chemical calculations on the model compound, dimethyl 4-(2-chlorophenyl)-2,6-dimethyl-1,4-dihydropyridine-3,5-dicarboxylate (
Figure S4a).
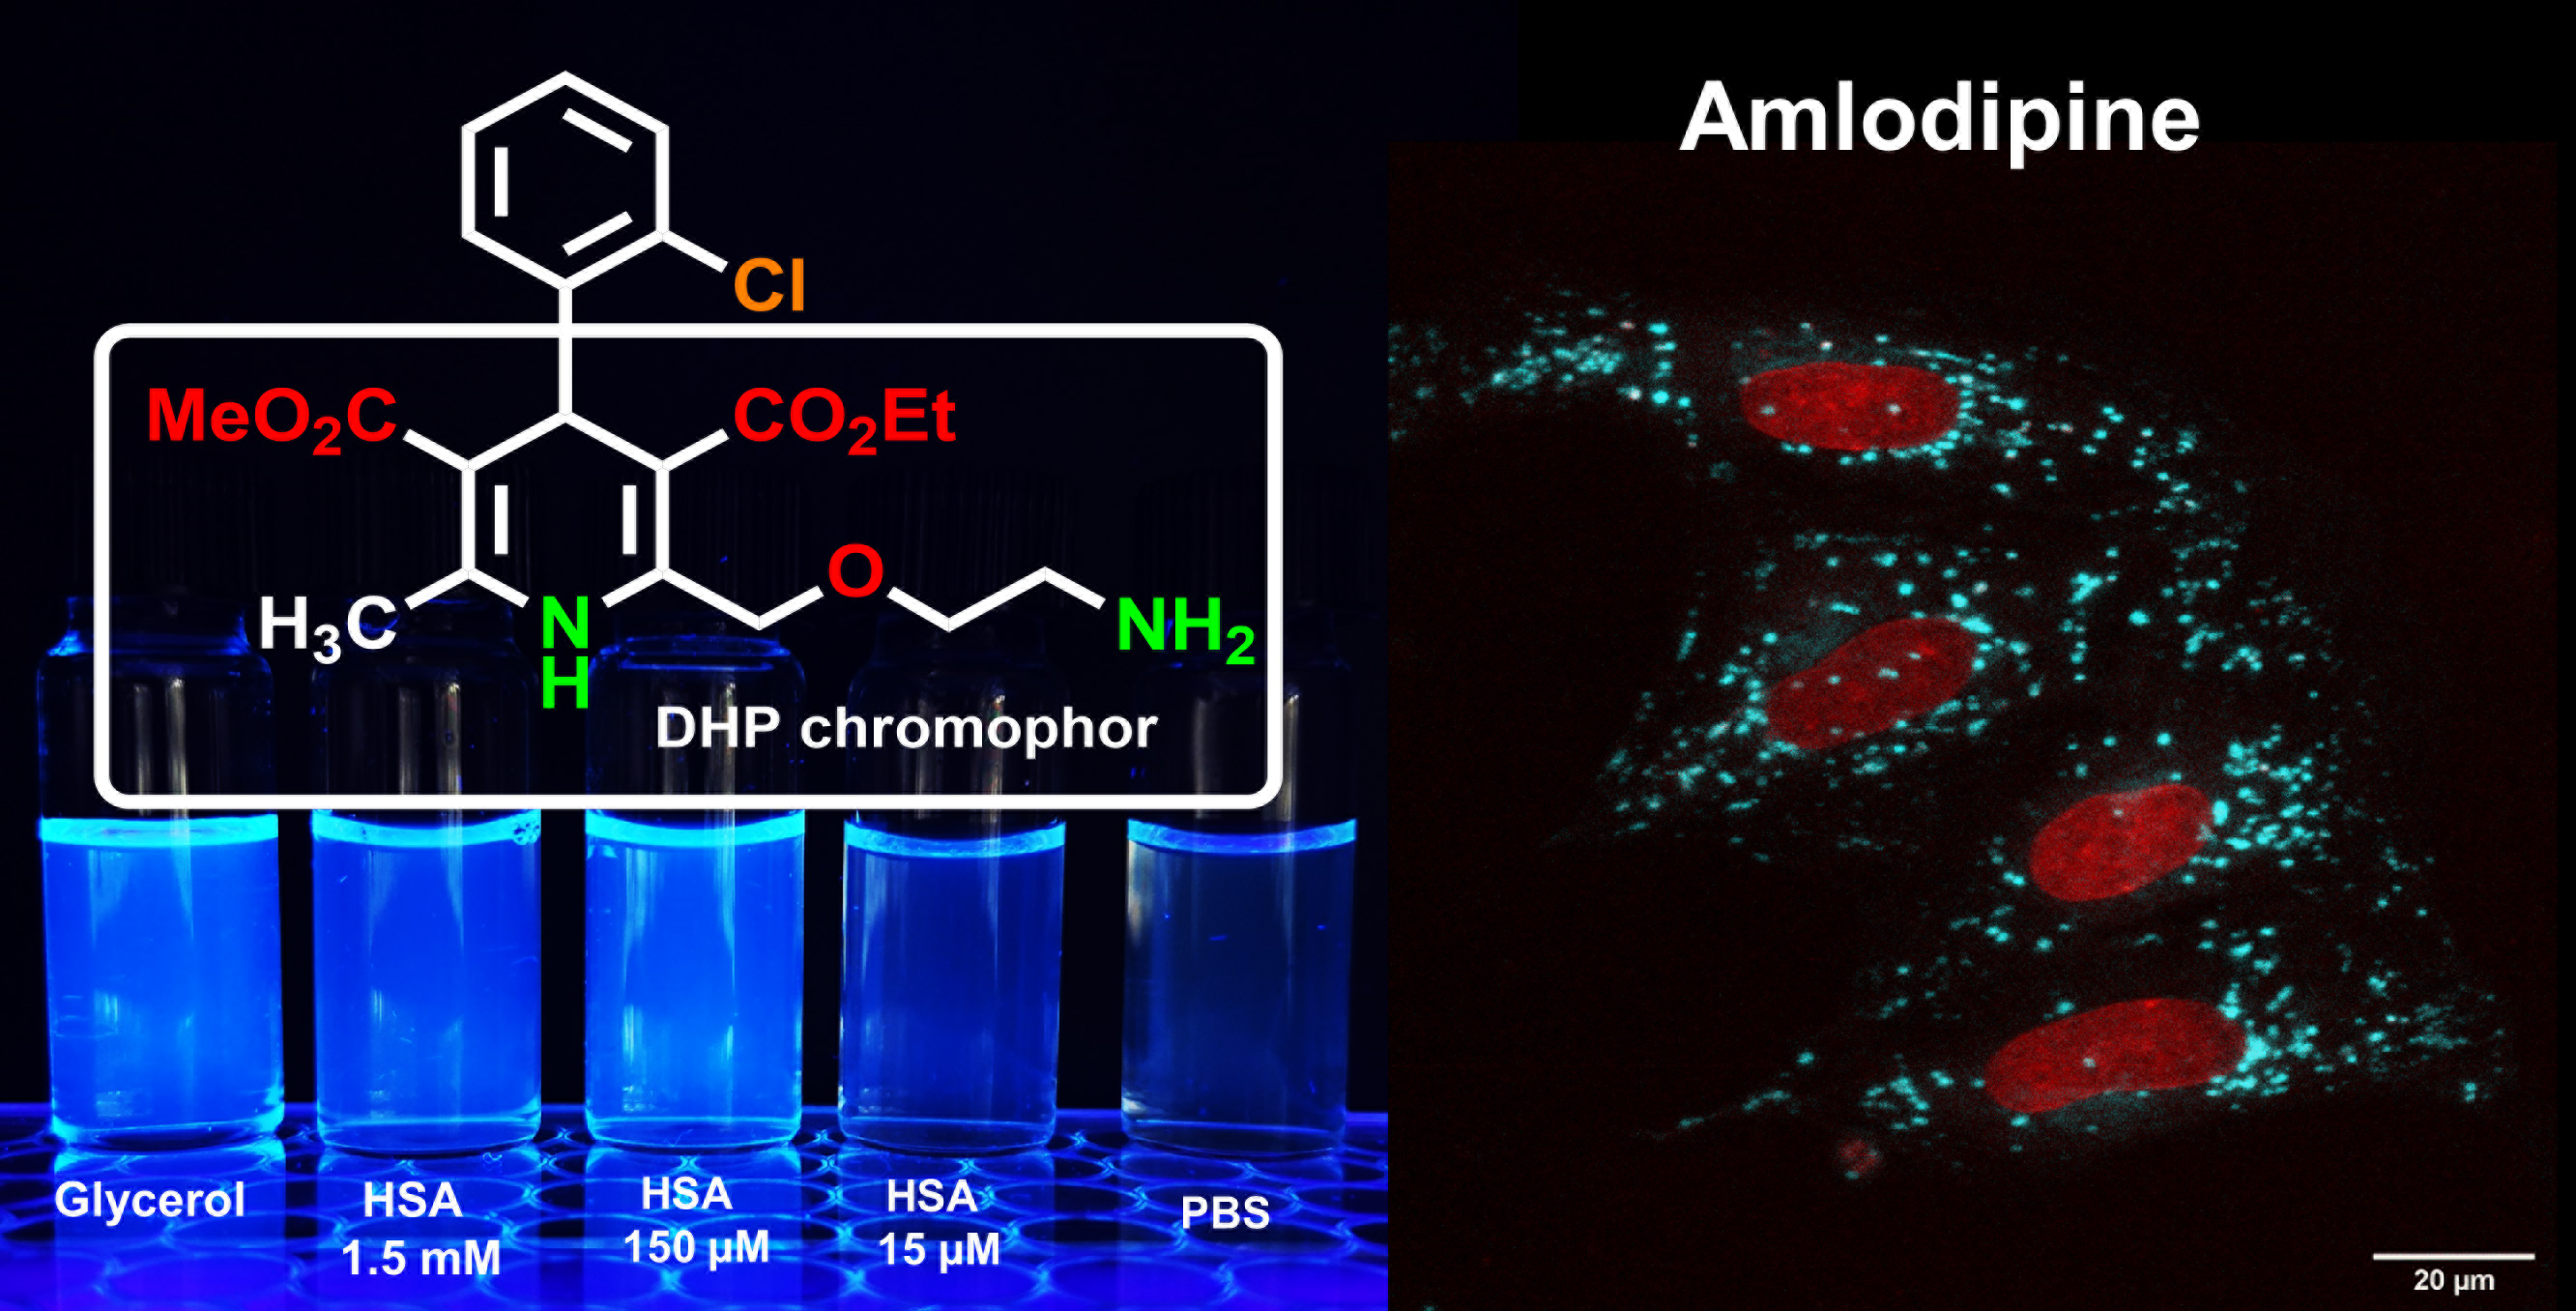
Fluorescence enhancement in glycerol may be due to high viscosity, which leads to a slower deactivation through non-radiative processes [
14,
15]. To test this, we performed fluorescence measurements of AML in methanol/glycerol mixtures of different viscosities (
η); their dielectric constants 32.6 and 42.5 respectively (
Figure 1b).
Ifl and
Φ increased dramatically with increasing
η (
Figure S5, Supplementary Materials). The calculated radiative (
k0) and non-radiative (
knr) decay constants illustrate this effect with
k0 remaining almost constant and decreasing
knr with increasing viscosity of the medium (
Figure S5d, Supplementary Materials). Thus, partial constraining of AML molecular twisting and rotations by a viscous medium prevents its transition to a non-emissive “dark” state. In a similar fashion, the specific interactions between the ligand and the protein’s backbone may restrict molecular flexibility of AML and enhance its fluorescence in BSA/HSA solutions.
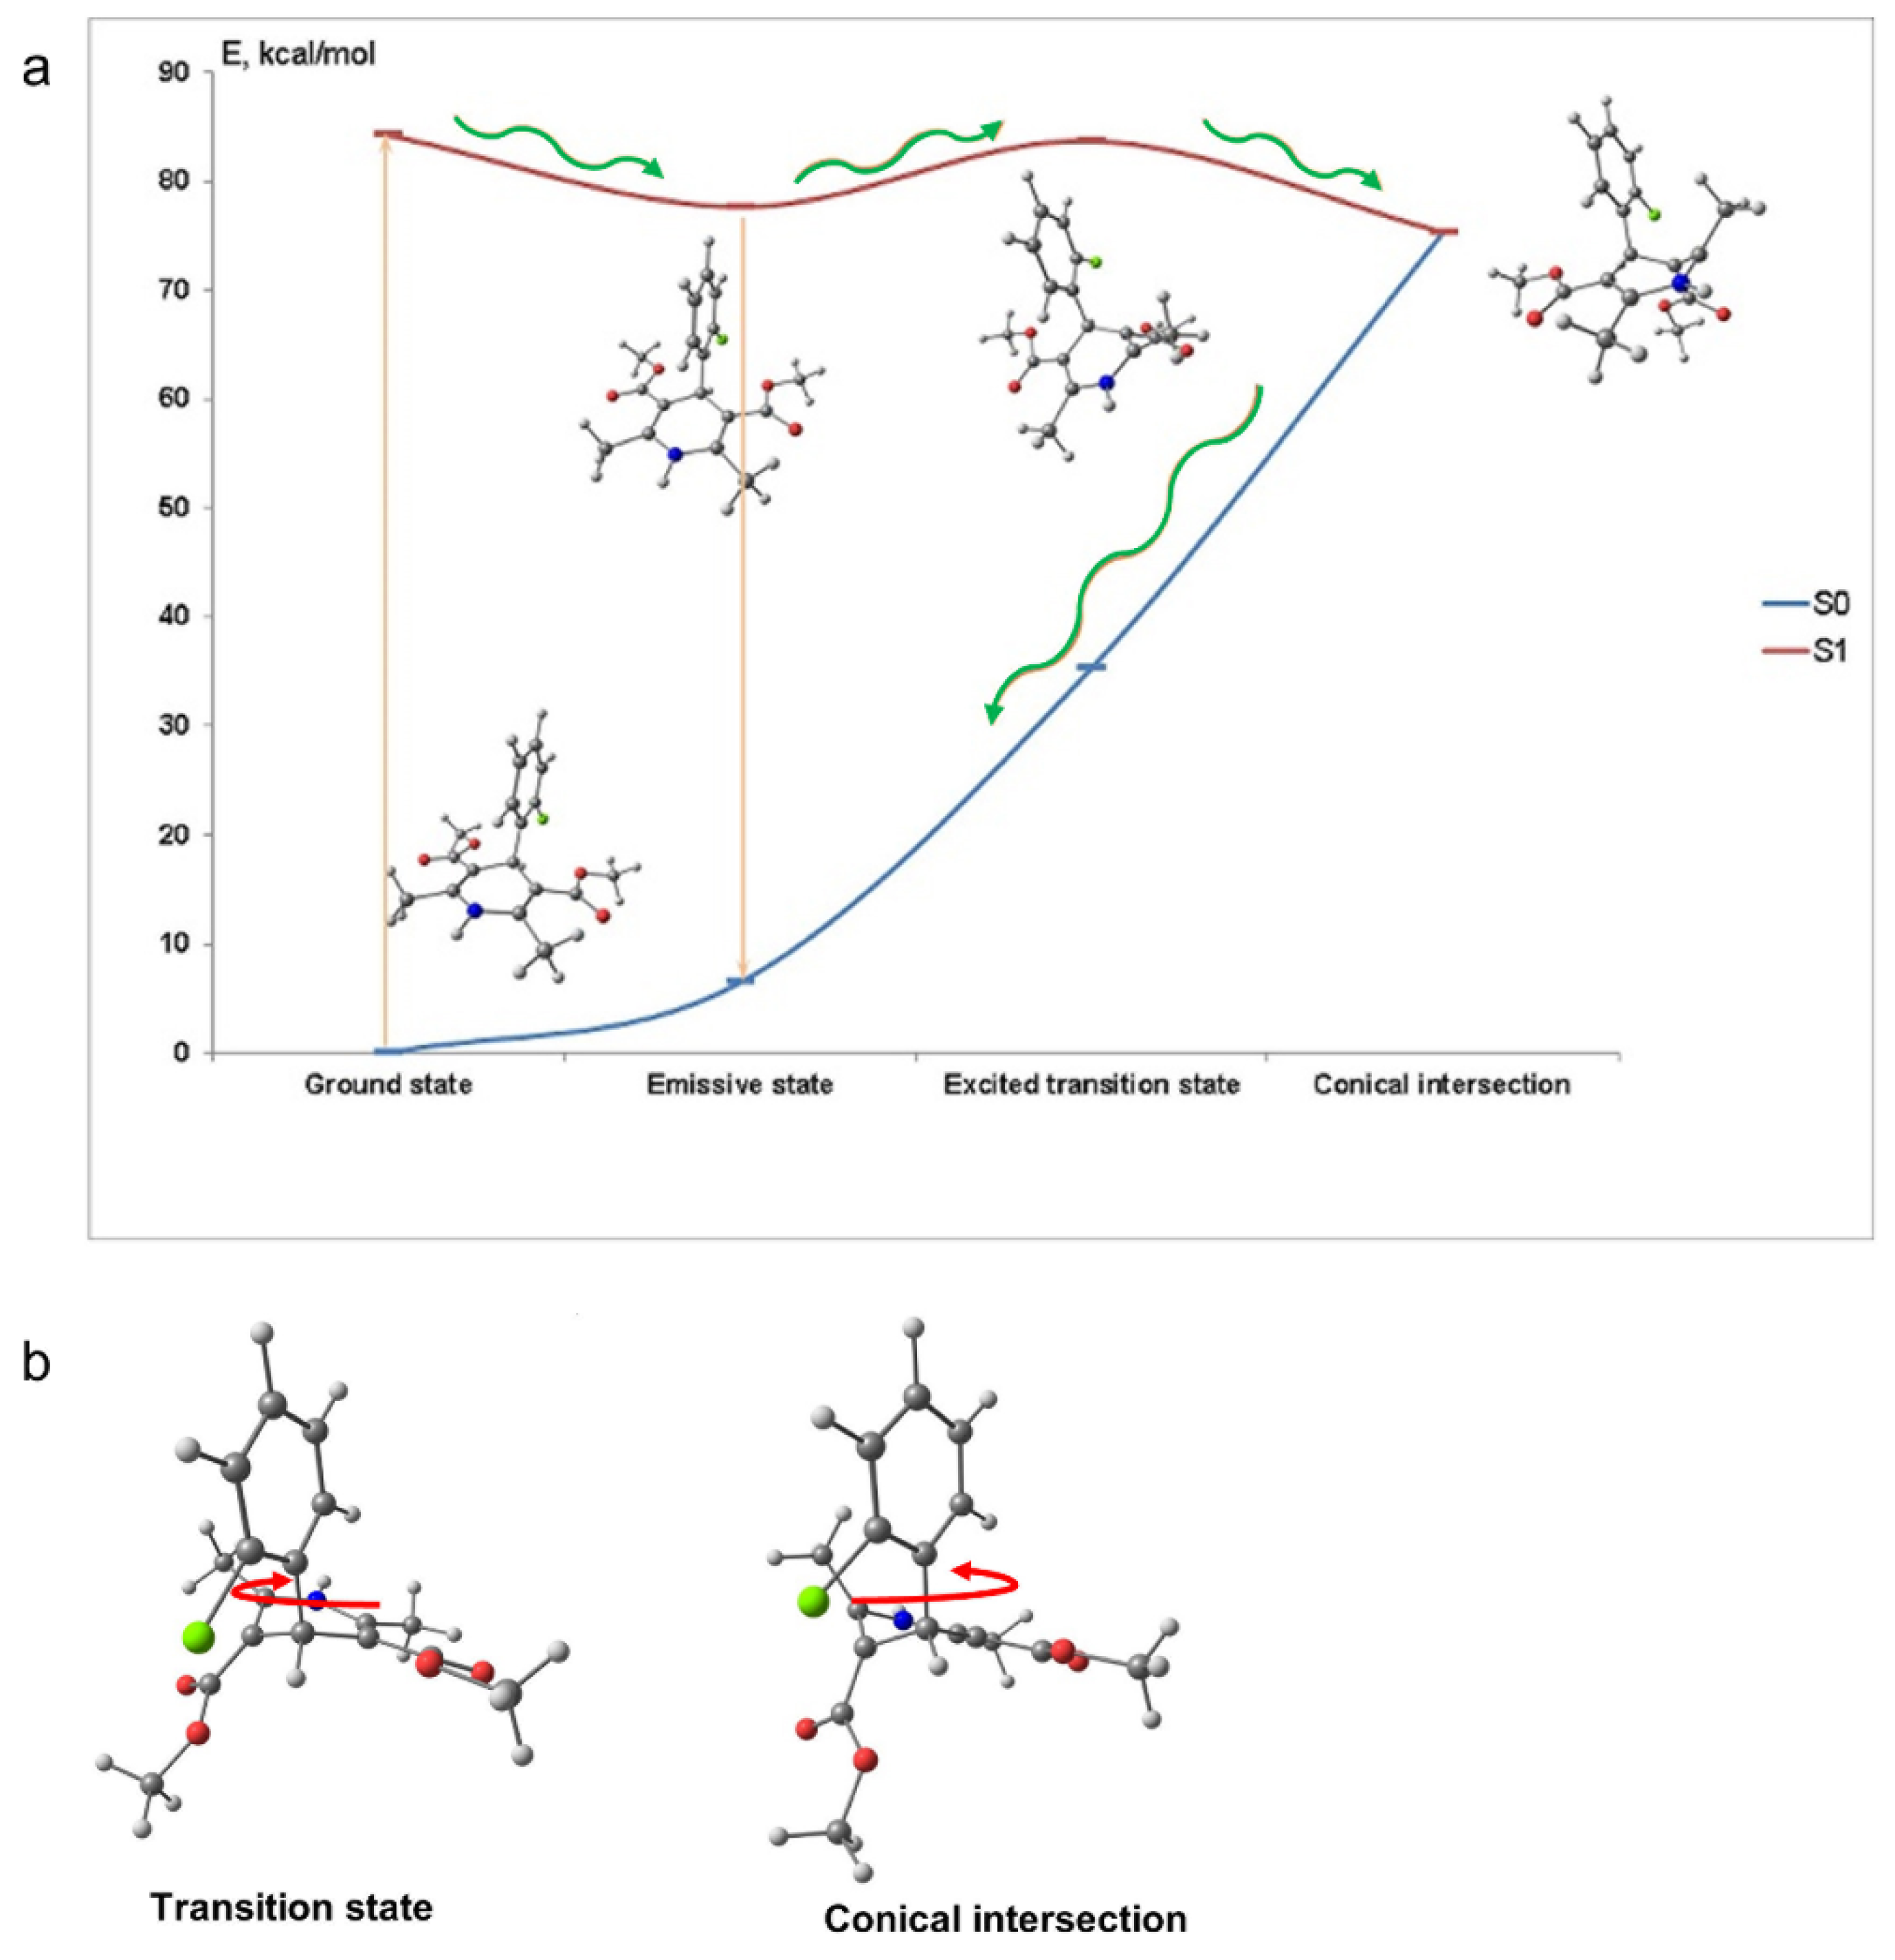
To assess the mechanism of the fluorescence quenching in aqueous solutions we performed quantum-chemical calculations of AML in the ground and exited states. In the ground state (S
0) the calculated molecular structure of AML is similar to the one obtained by single crystal X-ray analysis [
12]. The DHP and 2-chlorophenyl moieties almost perpendicular to each other due to the presence of the bulky ester groups and the DHP fragment has a boat conformation (
Figure 1a). After absorption of the light, the exited molecule relaxes to the lowest excited singlet state S
1, from which it emits a photon and the fluorescence occurs. The molecular geometry of AML in S
1 does not change significantly from the one in the S
0 (
Table S1, Supplementary Materials). The dissipation of energy responsible for the fluorescence loss in aqueous solutions can occur because of the 2-chlorophenyl group rotation. However, our computations showed that the rotation of 2-chlorophenyl group alone could not lead to the fluorescence quenching. We found a conical intersection between the lowest excited singlet state S
1 and S
0 separated from S
1 by the 6.1 kcal/mol barrier. With such barrier and the calculated frequency of the reorganizational mode 61 cm
−1, the molecule may achieve the conical intersection point in ~15 ns.
Figure 2 depicts the molecular conformations and potential energy surface of AML and the structures of the transition state and the conical intersection of AML. The structure of the conical intersection involves 2-chlorophenyl ring twist with simultaneous DHP ring puckering (
Figure 2b). This conical intersection is only accessible through the large-amplitude motion, which is hindered in viscous media. In non-viscous media, the barrier can be overcome at a rate comparable with the radiative relaxation channel, which leads to fluorescence quenching. The calculated radiative
τrad for AML is ~22 ns, which is in rather good agreement with the measured values in glycerol, 14.0 ± 0.2 ns, and in 10% HSA, 16.8 ± 0.3 ns (
Table 1).
We performed laser-flash photolysis measurements to test whether atmospheric oxygen can change the spectrum or kinetics of the photo-induced absorption of AML. The measurements indicate the presence of intersystem crossing to the triplet state in both PBS and PBS-containing 10% BSA (
Figure S6, Supplementary Materials). We have not detected any phosphorescence of AML in these solutions at room temperature. The presence of a non-emissive triplet state of AML in 10% BSA solution is evidenced by the fact that its delayed fluorescence spectrum measured in the phosphorescence mode (delay 200 μs) is similar to its prompt fluorescence spectrum.
In order to ascertain whether AML fluorescence is sensitive to intramolecular charge transfer between DHP and aryl moieties, we synthesized the 2-chloro-5-carboxy AML derivative (AML-5-COOH, for the synthesis see
Supplementary Materials), which differs from AML in an additional carboxyl group attached to the 2-chlorophenyl moiety. In contrast to AML, AML-5-COOH does not fluoresce. The calculated absorption and emission spectra (
Table S2, Supplementary Materials) agree with the experimental results: the oscillator strengths (f) of both absorption and emission of AML are 2–5 times higher than those of AML-5-COOH. The quantum-chemical calculations showed that both electron density of the highest occupied (HOMO) and lowest unoccupied (LUMO) molecular orbitals of AML are localized mainly on DHP, while in AML-5-COOH, containing the electron-withdrawing substituent COOH, LUMO is localized on both DHP and aromatic ring (
Figure S4b, Supplementary Materials). This fact indirectly confirms that the light absorption by AML does not lead to the intramolecular charge transfer, but, taking into account the delayed fluorescence, includes the intersystem crossing into a DHP localized triplet state.
The enhancement of AML fluorescence upon binding to BSA or HSA allowed us to determine the AML-protein binding affinities by fluorescence titration experiments. For that, we recorded the fluorescence spectra of 5 µM AML or (
S)-AML in the 0–750 µM protein (BSA or HSA) solutions and observed the fluorescence intensity changes at the emission maximum (
Figure S1, Supplementary Materials). The fluorescence signal saturated above 200 µM of protein concentration (
Figure 1c and
Figure S1, Supplementary Materials), and the calculated dissociation constants (
Kd) were in a good agreement with previous studies where the tryptophan (Trp) fluorescence quenching was used for the binding constant determinations [
9,
16]. The measuring of AML emission with longer excitation wavelength (λ), than
λem (Trp) = 350 nm helps to minimize autofluorescence.
Next, we tested whether AML fluorescence is suitable for microscopy experiments on live cells and used the A7r5 vascular smooth muscle cells and HL-1 cardiomyocytes. These cells express the main AML target, Ca
V1.2, in cardiac cells. Time-lapse confocal microscopy showed a drug accumulation in the cytosol as punctate structures associated with cytoplasmic vesicles (
Movie S1, Supplementary Materials). The emission maximum measured on cells was equivalent to AML emission in BSA/HSA solutions (
Figure 1f). The time-lapse confocal imaging revealed that AML fluorescence is stable; we detected almost no photobleaching after imaging of 18 frames using 2.5 mW laser power; measured power density 17 kW/cm
2 (
Figure S7, Supplementary Materials). However, the labelling pattern was markedly different from the immunostaining with anti Ca
V1.2α antibody (
Figure S8, Supplementary Materials and Reference [
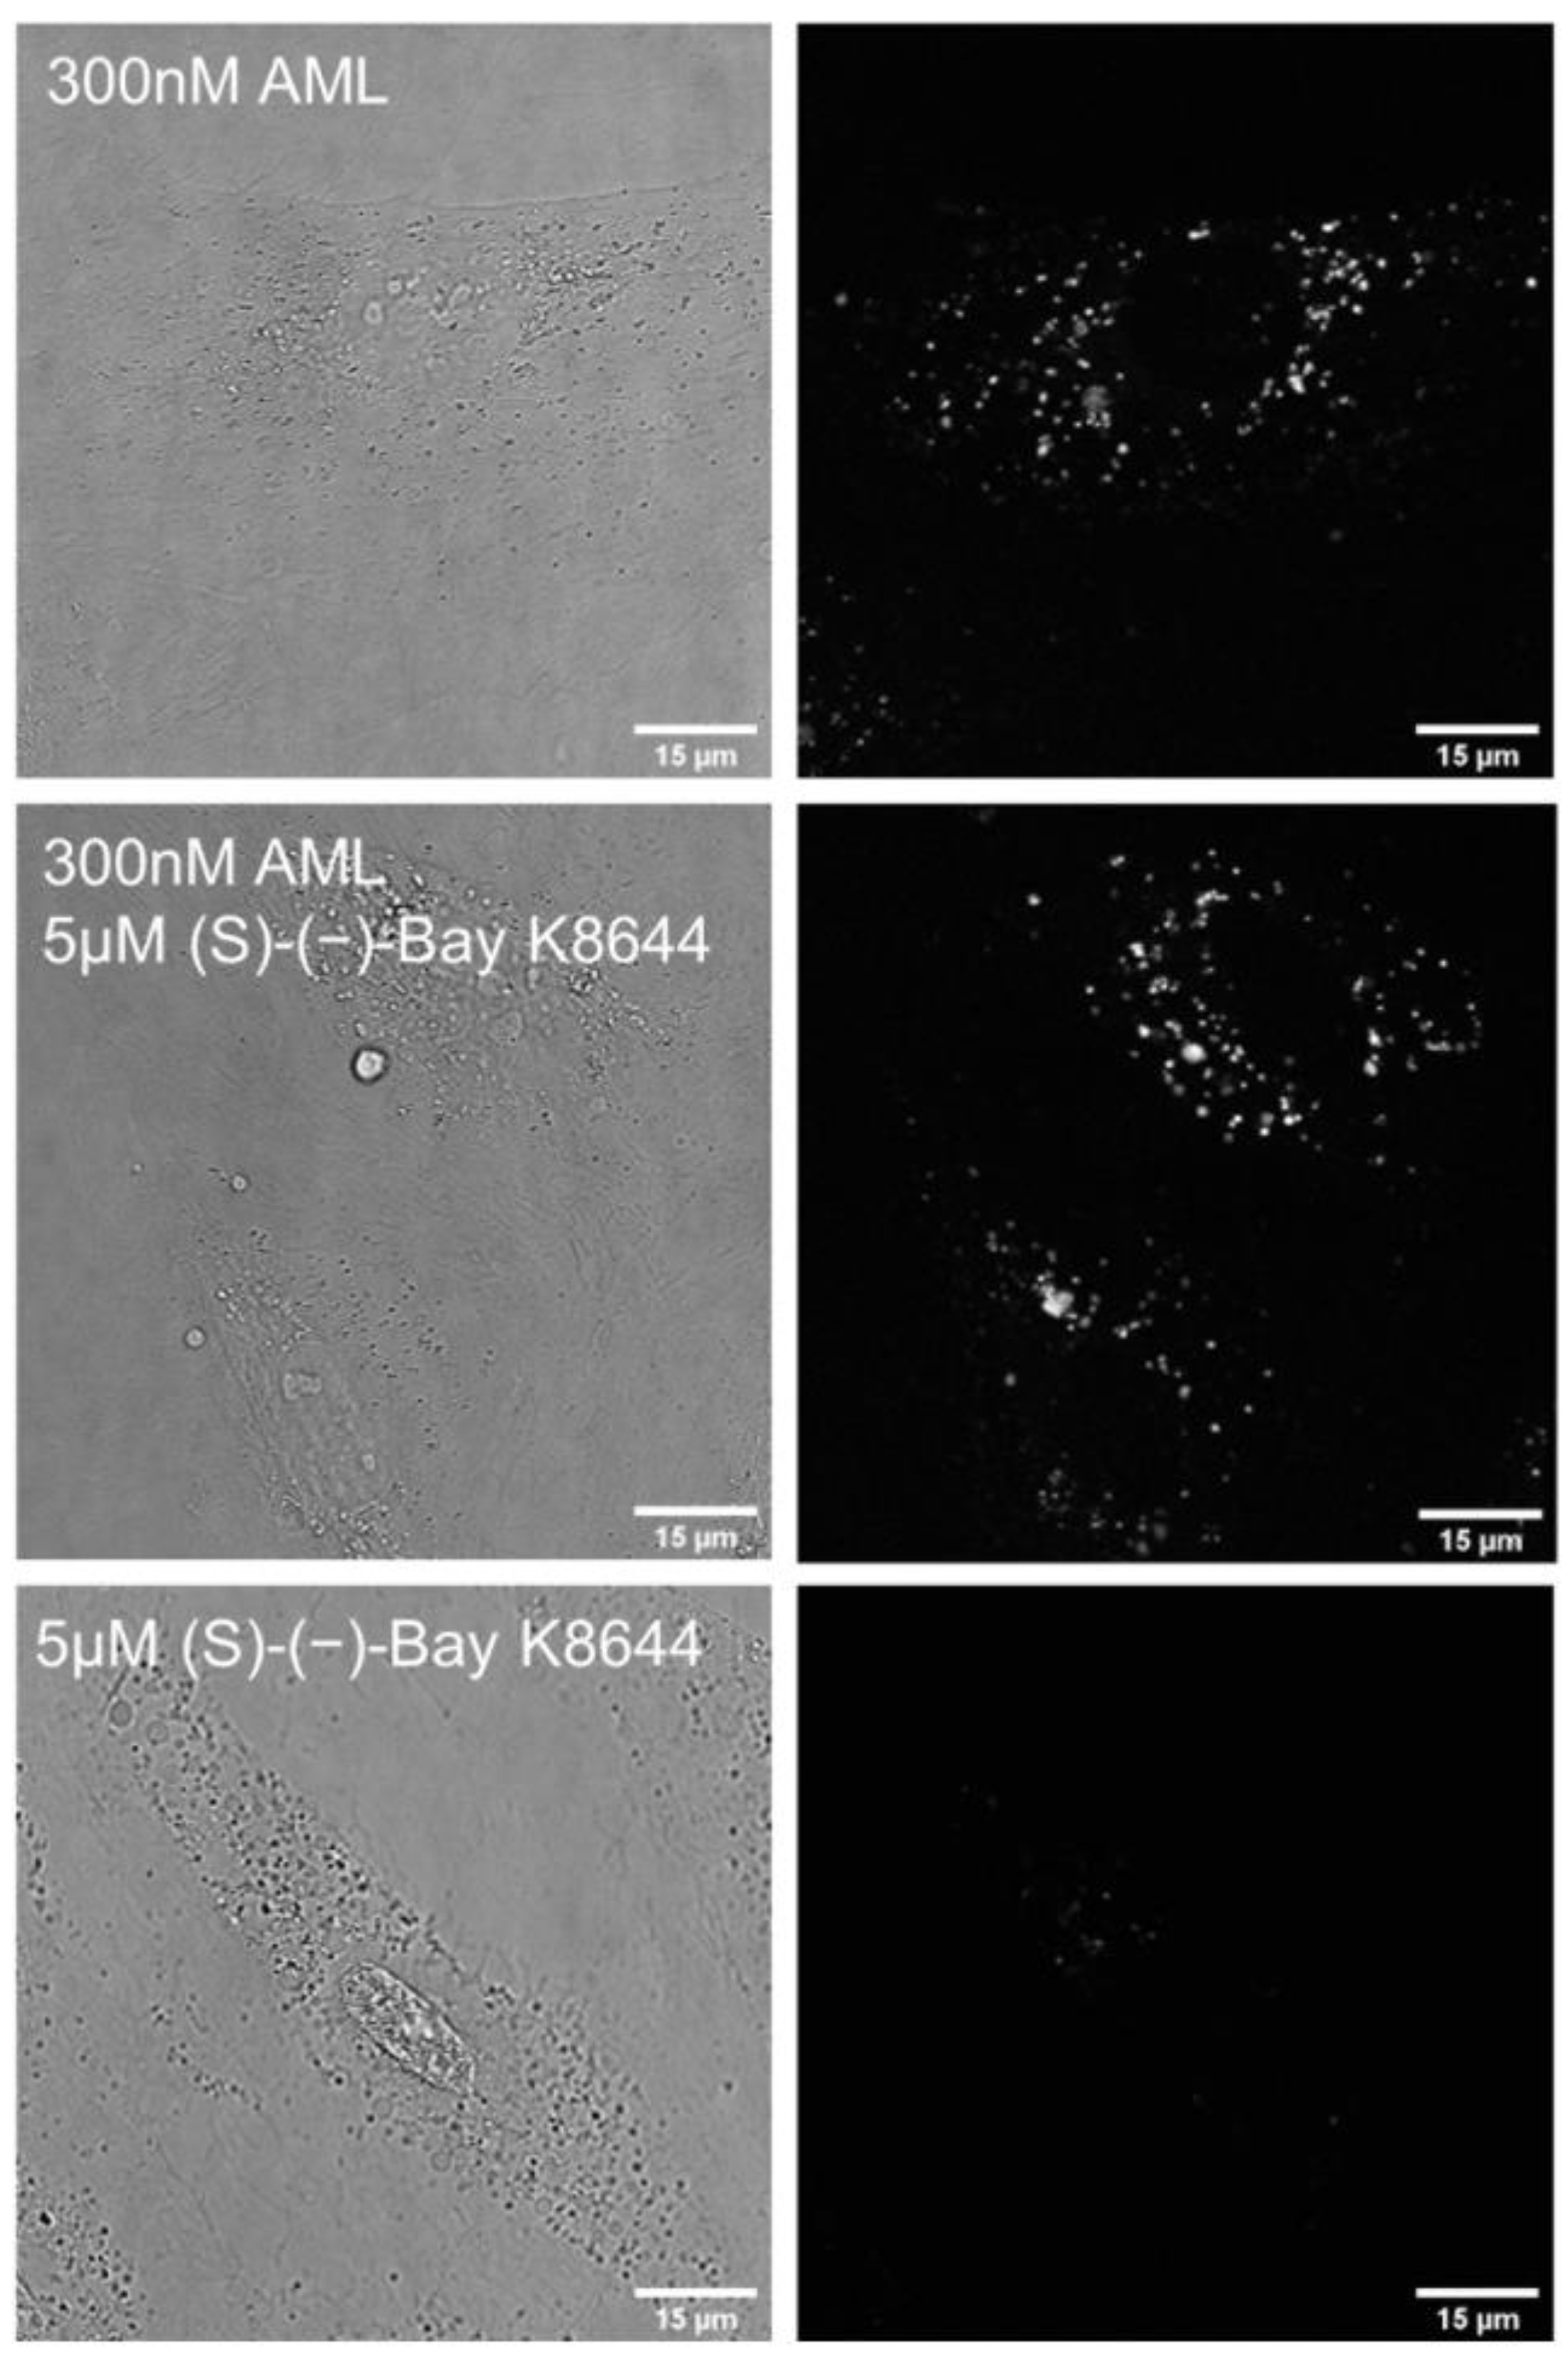
17]). In order to elucidate whether internalization of AML depends on the interaction with Ca
V1.2, we repeated the staining in the presence of non-fluorescent DHP agonist (
S)-(−)-Bay K8644.12. (
S)-(−)-Bay K8644 had no effect on cell staining by AML (
Figure 3), indicating that AML clusters are not associated with Ca
V1.2. In addition, we did not observe any differences in AML staining using confocal microscopy on live HEK-293 and HEK-293 Ca
V1.2 cells, containing inducible genes of human Ca
V1.2 (
Figure S9, Supplementary Materials). Although HEK-293 cells produce some DHP-sensitive Ca
2+ currents, their magnitude considerably increases upon expression of recombinant Ca
V1.2α [
18]. If interaction with receptors is required for AML internalization, overexpression of Ca
V1.2 should increase the staining efficiency.
Altogether, our data show that unbound AML accumulates in the intracellular compartments independently of its interaction with CaV1.2 channels, the main DHP target in cardiac cells. There are two possibilities why we could not observe staining of CaV1.2 by AML: either interaction with the channel does not lead to fluorescence increase, presumably because AML takes the molecular conformation with lower fluorescence emission than in a stabilized form in BSA/HSA solutions, or the density of receptors is too low for the detection and is masked by receptor-independent staining.
Importantly, the shape and the size of HEK-293 Ca
V1.2 cells, before and after Ca
V1.2 expression induction with doxycycline, are remarkably different. We noticed the enlargement of the cells after the induction; some of them appeared as multinucleated giant cells (
Figure S8, Supplementary Materials).
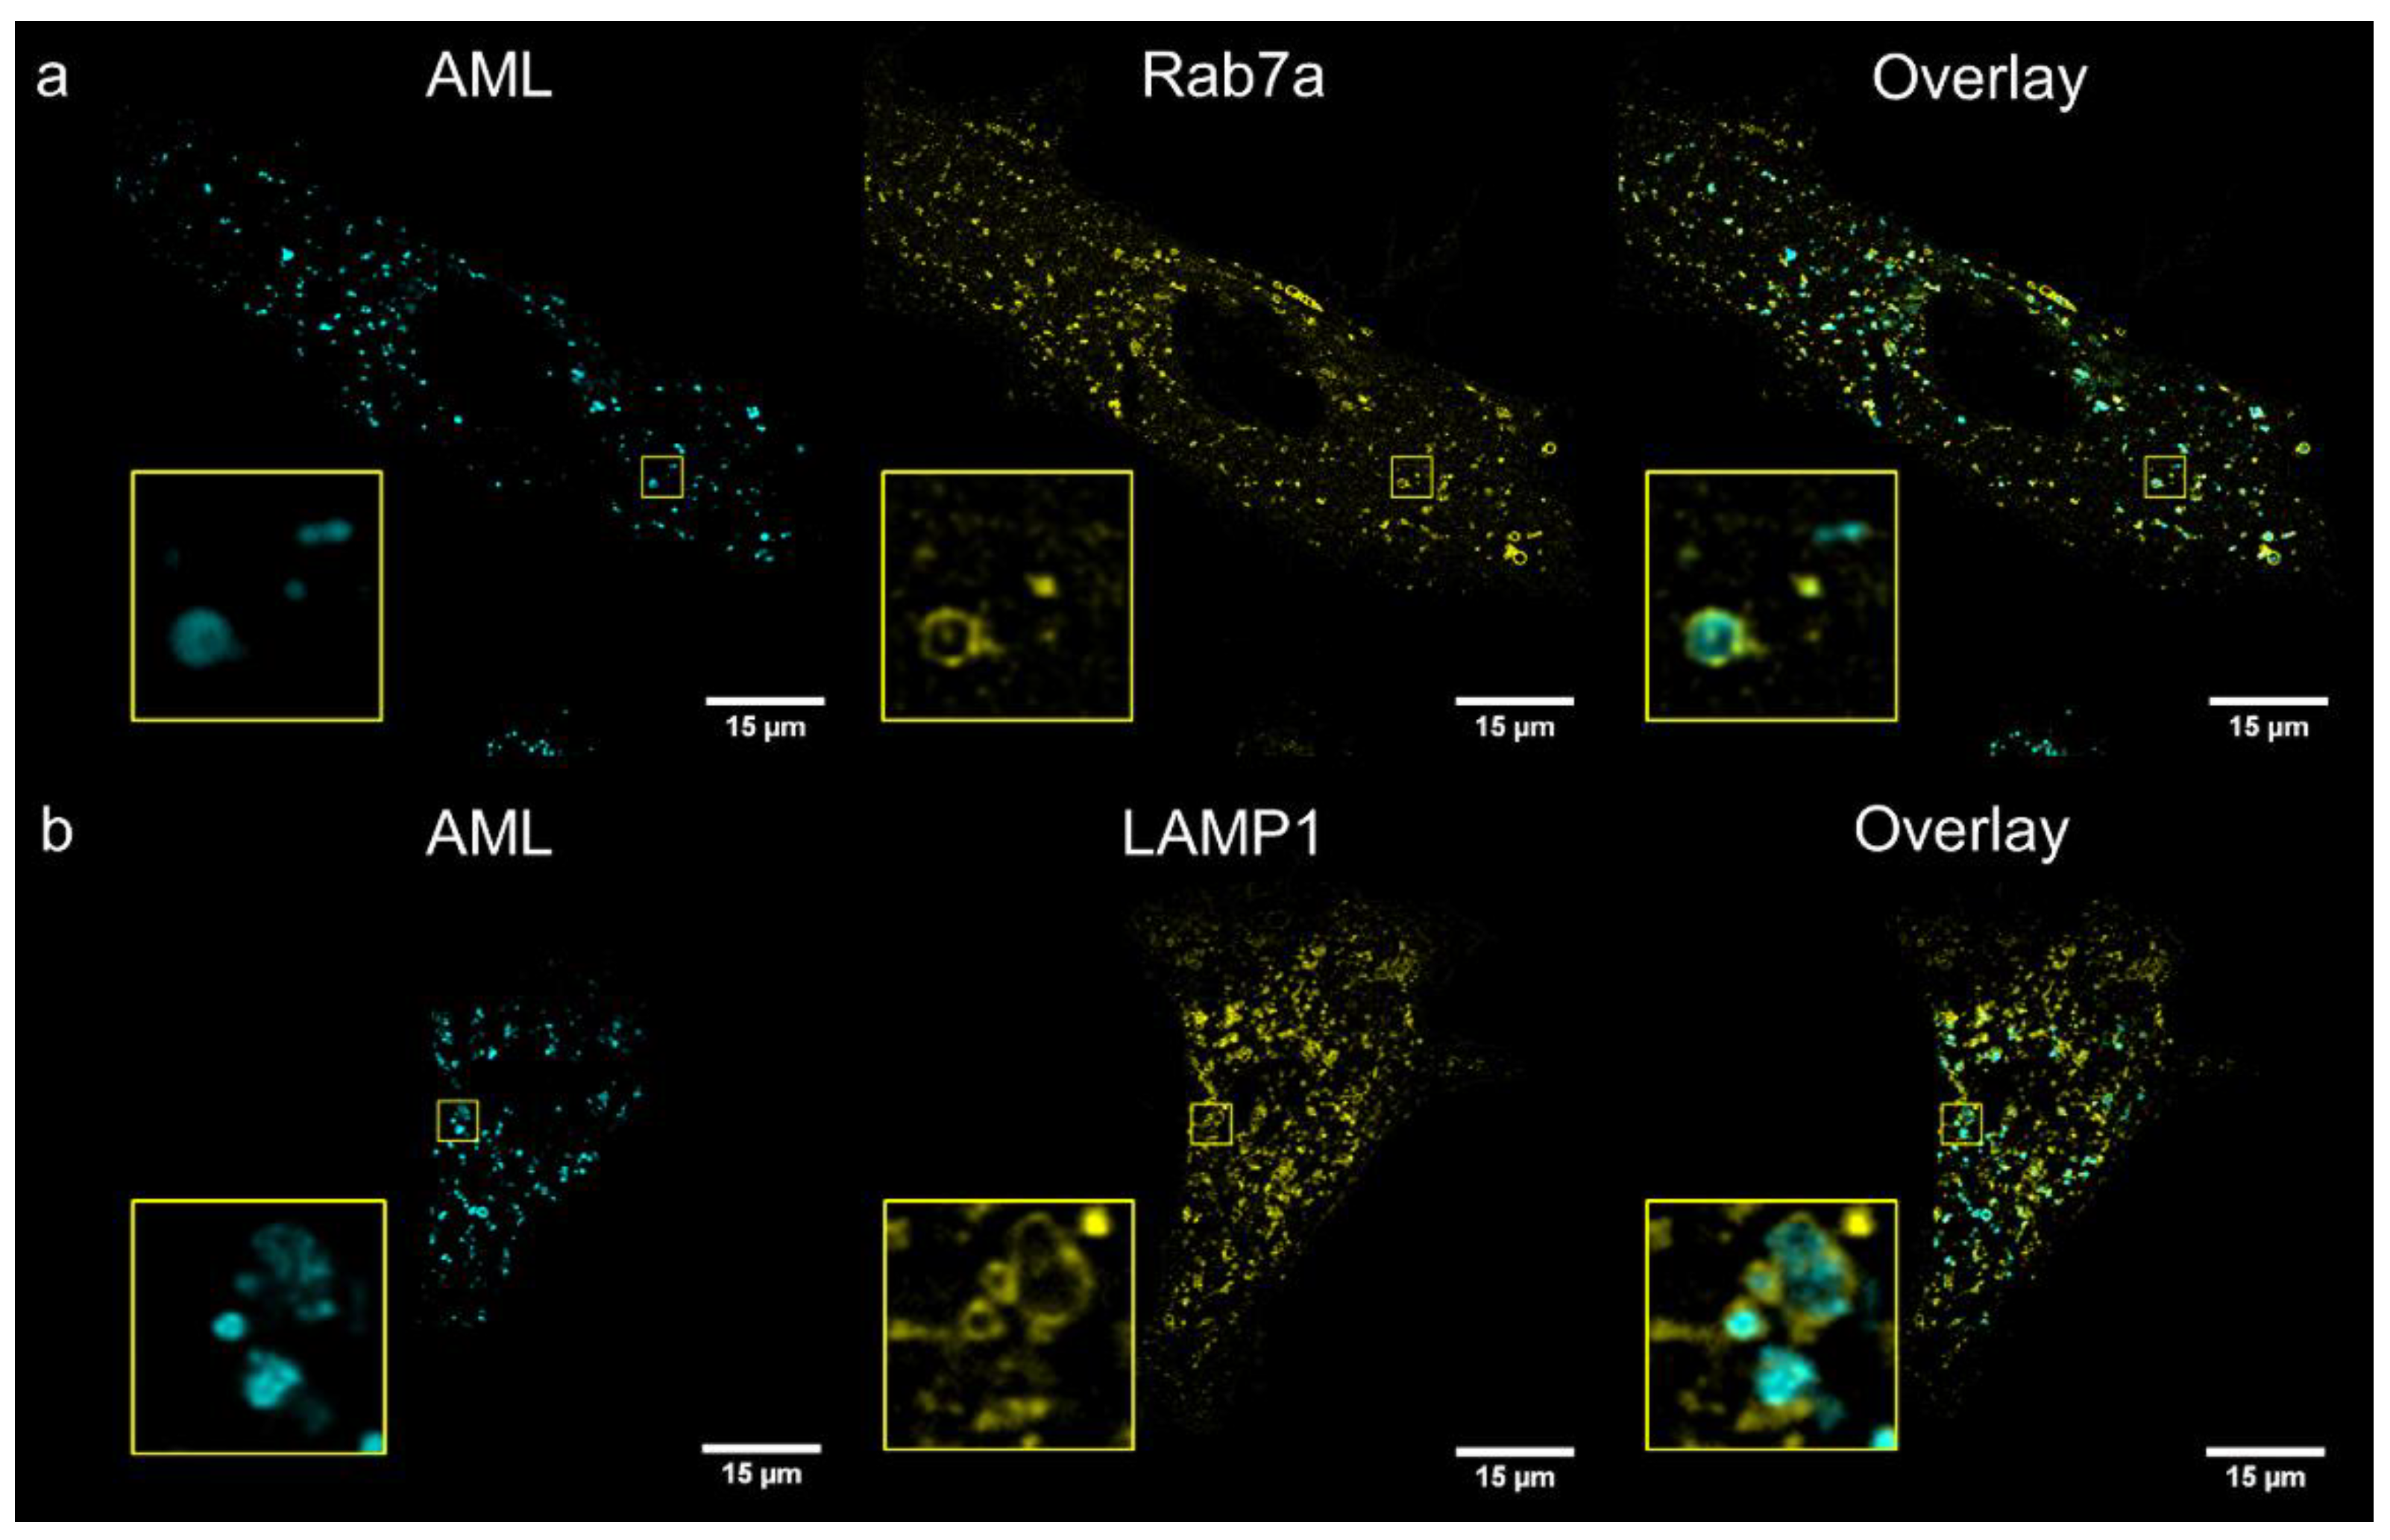
To identify compartments stained with AML, we performed co-localization study with several cellular live-cell stains: MitoTracker
® Orange (mitochondria), ER-Tracker
® Red (endoplasmic reticulum); and genetic markers: Golgi-emGFP, Rab7a-emGFP (late endosomes), Rab5a-emGFP (early endosomes) and LAMP1-emGFP (lysosomes). We treated living A7r5 cells with the respective marker and AML, and then visualized using a confocal Leica SP8 microscope. After 1 h incubation, the late endosomal and lysosomal labelling showed the co-occurrence of the cyan (AML) and green channel (emGFP) emissions with calculated Pearson’s co-localization coefficients (
R) above threshold:
R ~0.4 (
Figure 4). Rather modest
R value can be explained by the fact that Rab7a/LAMP1-emGFP are membrane markers of late endo-/lysosomes, while AML mainly accumulates inside the acidic lumen of these organelles (
Figure 4, for Z-stack see
Movie S2, Supplementary Materials). AML staining displays no correlation with Golgi or early endosome trackers and only a weak positive correlation with the ER and mitochondria after 1 h incubation with the drug (
R = 0.07, 0.08, 0.22 and 0.26, respectively,
Figure S10, Supplementary Materials). These findings allow us to conclude that AML–associated structures in the perinuclear region are late endocytic organelles.
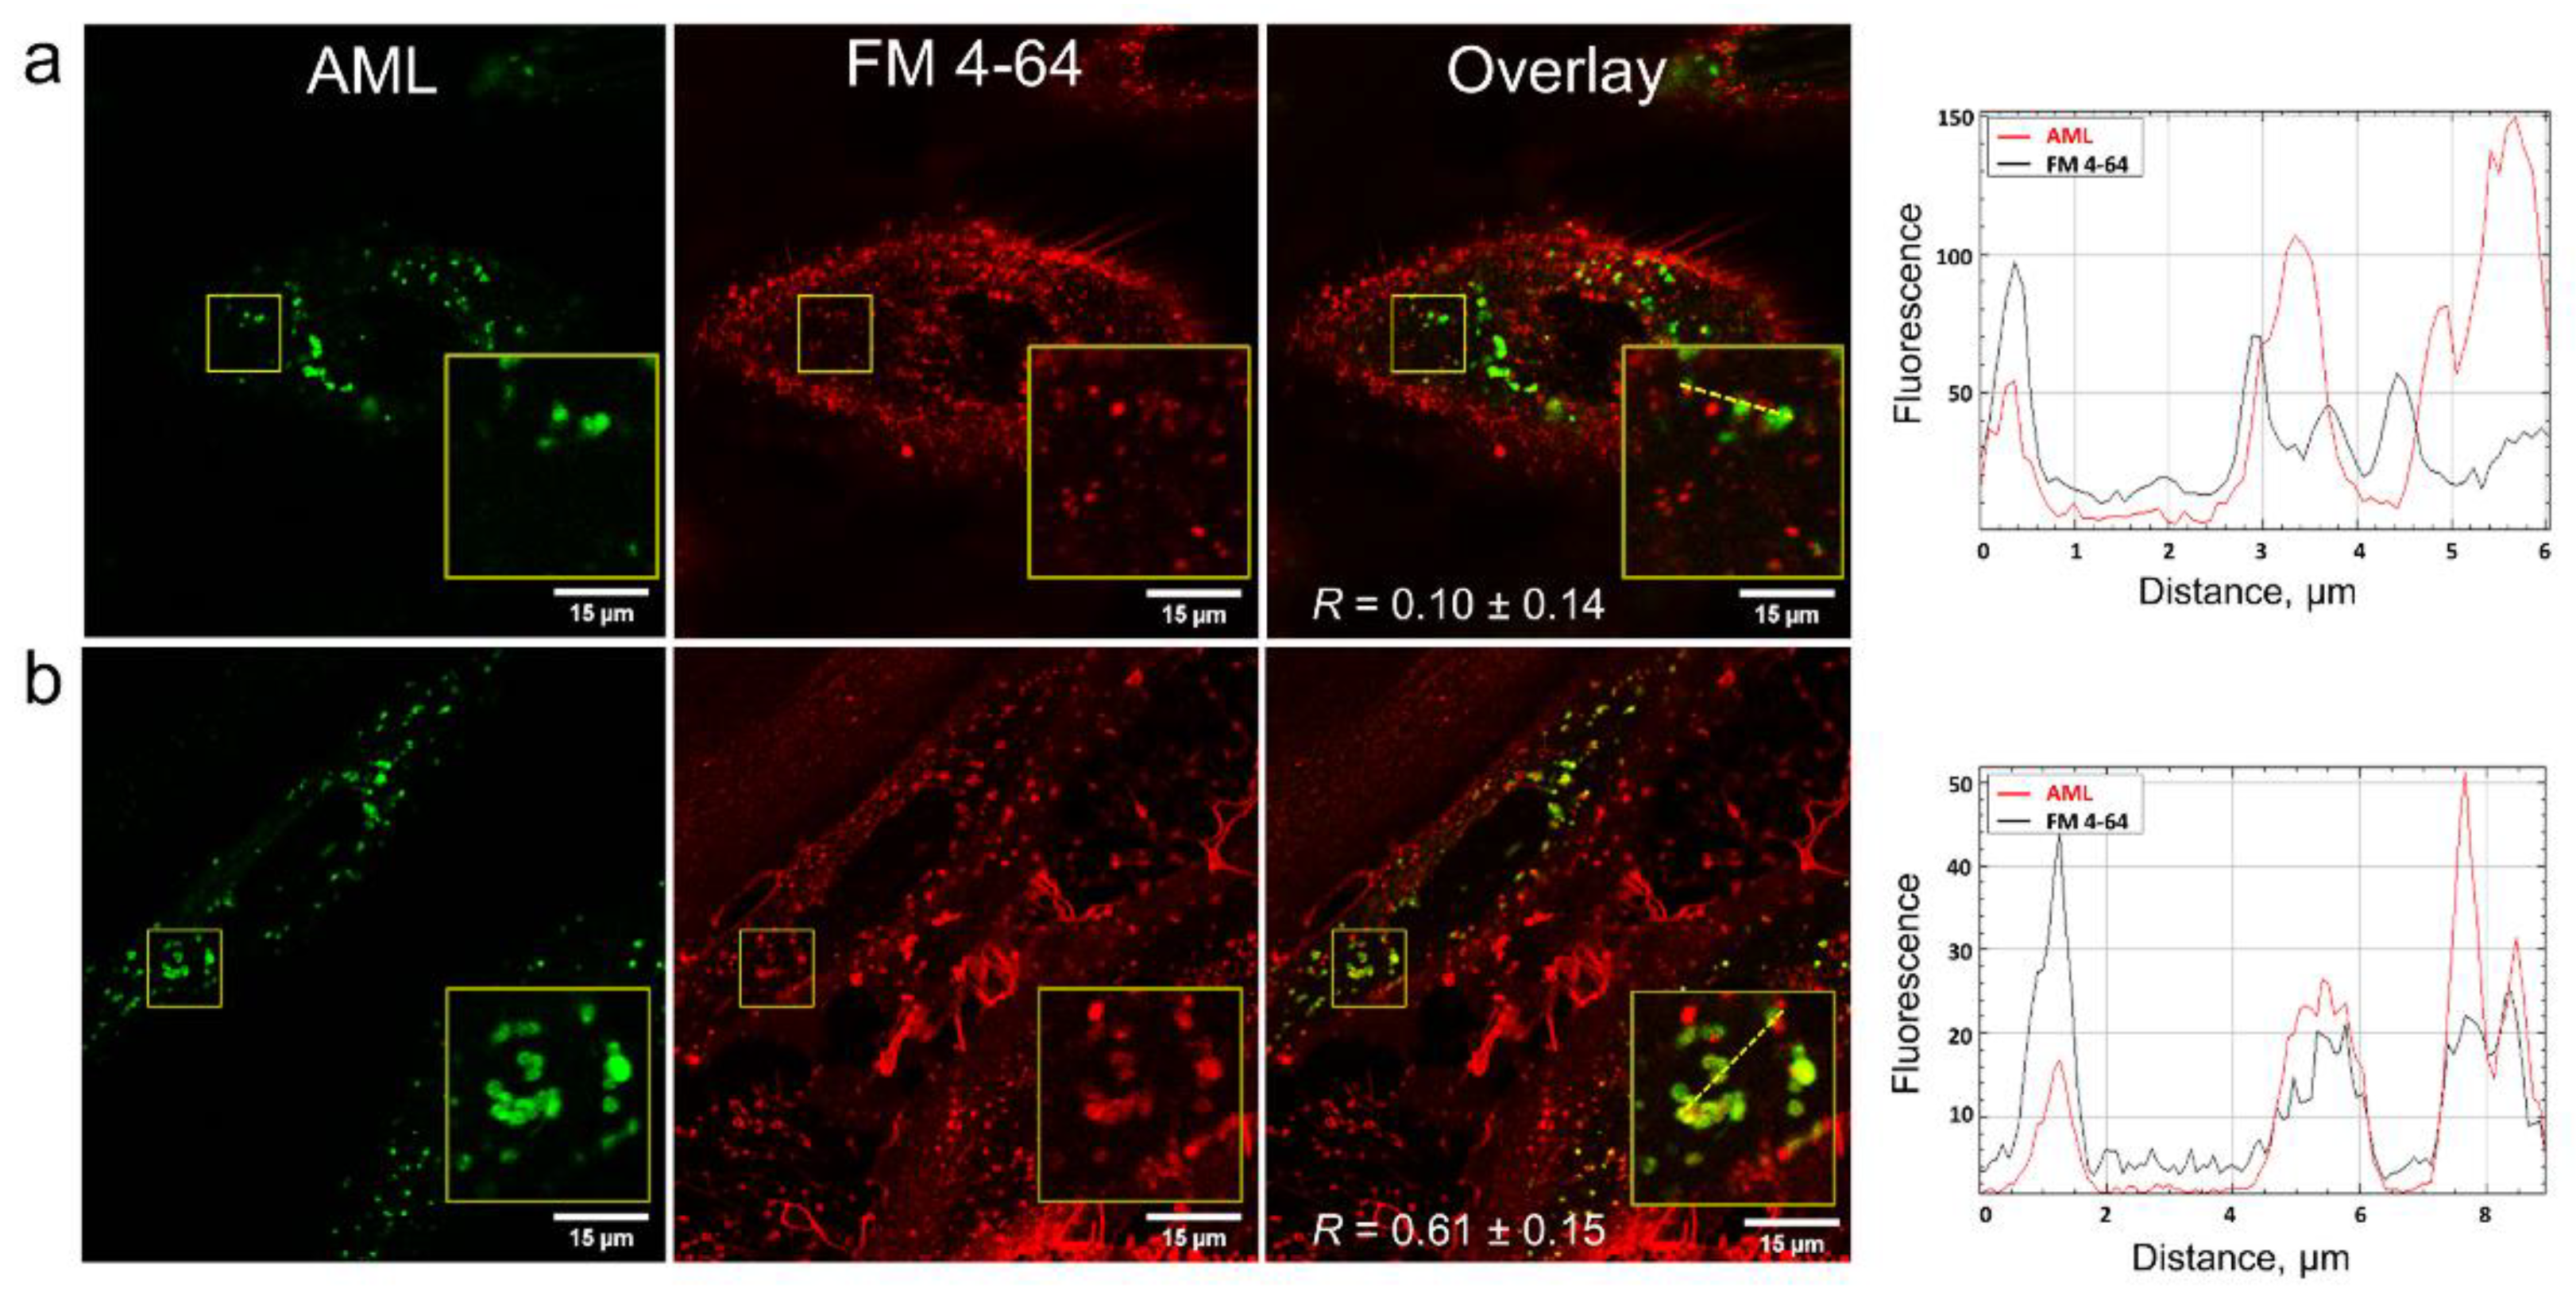
In order to clarify how AML crosses the membrane, we stained A7r5 cells with the endocytosis tracer FM 4-64 [
19]. FM 4-64 is a lipophilic fluorogenic dye with emission in a hydrophobic environment. After 15 min incubation of the cells with AML and FM 4-64, we observed both compounds inside the cells, but they did not co-localize (
Figure 5), which suggested different mechanism of their entry. On the contrary, after 75 min of incubation, FM 4-64 and AML co-localized with
R = 0.61 ± 0.15 (
Figure 5 and
Movies S3 and S4, Supplementary Materials). Due to its positively charged tetraalkyl ammonium group, FM 4-64 does not diffuse through the membranes and thus travels through the endocytic route from early to late endosomes and then to lysosomes [
20]. In contrast, the direct AML loading to the A7r5 cells stained with endo-/lysosomal markers revealed that AML accumulates in lysosomes from the very beginning (
Movie S1, Supplementary Materials). This strongly indicates that endocytosis is not the main route for AML to enter the cells. This fact goes in line with the lysosomal sequestration mechanism discovered by De Duve et al. [
21]. Upon diffusion into acidic compartments, such as late endo-/lysosomes, the equilibrium between charged and uncharged forms of a cationic drug shifts toward the protonated form and its membrane permeability decreases, which facilitates its retention within the compartments [
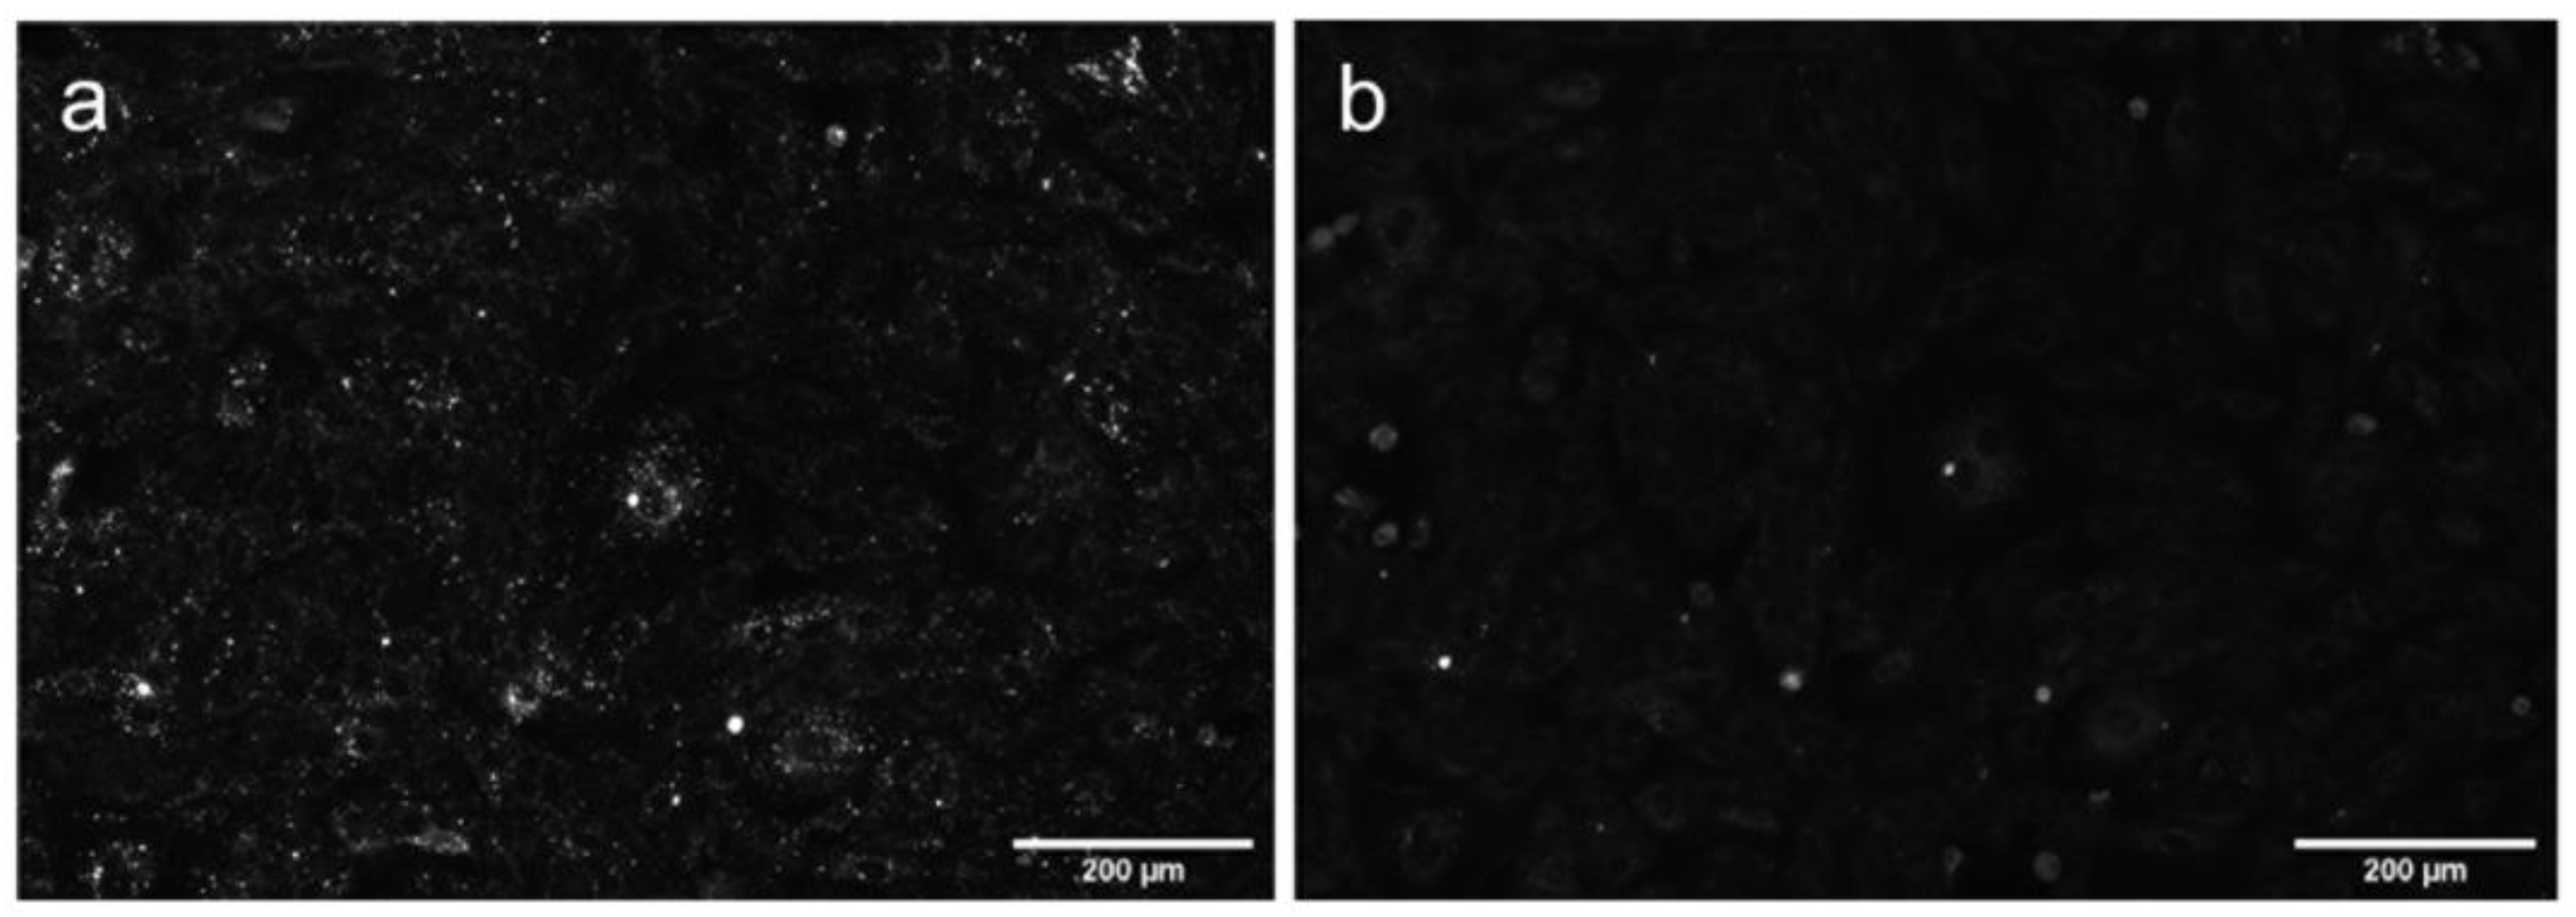
22]. To further test this hypothesis, we checked whether AML accumulation could be reversed by addition of NH
4Cl, the inhibitor of lysosomal trapping [
22]. As expected, the addition of 10 mM NH
4Cl to the AML treated cells substantially reduced AML staining (
Figure 6).
3. Discussion
In hydrophobic environments, AML has poor fluorescence and cannot be readily detected, while incorporated into a lipid bilayer. Consistently, we see no fluorescence on the plasma membrane. Upon accumulation in the acidic compartments, the internalized drug is exposed to considerably lower pH, and this can be a reason for fluorescence enhancement. We evaluated the pH sensitivity of AML and found that the fluorescence of AML did not change significantly in the physiological pH range (
Figure S11, Supplementary Materials). Because suppression of the large amplitude motion in AML (and other fluorophores) leads to the fluorescence enhancement, the viscosity of cellular compartments can contribute to its visibility. In the highly heterogeneous environment of a live cell, the microviscosity in cell vesicles can reach 140 cP, while in the cellular cytoplasm it is less than 35 cP [
23,
24].
Figure 7 depicts a simplified model of AML translocation into the cytosol and its lysosomal sequestration. AML molecules in an extracellular region exist in both non-protonated and protonated forms. Under physiological conditions, the cytosolic pH is only slightly acidic (7.0–7.2) compared to the extracellular pH (7.2–7.4). Upon AML internalization into a cytosol, its non-protonated fraction remains almost the same according to the Henderson–Hasselbalch relationship [
22]. In a phospholipid membrane, AML molecules are non-fluorescent, at least until they are immobilized in a specific configuration favoring the fluorescence emission. In the concentrations used in our study, AML acts as a long-lasting Ca
2+ channel blocker (
Figure S12, Supplementary Materials), but apparently locates not exclusively to its target, Ca
V1.2. The substance penetrates rapidly into a cytosol where it can be detected as a dim staining; already in the first 3–5 min of the fluorescence readout. After diffusion into the late endo-/lysosomal lumen, the drug gets protonated and trapped inside. The elevated viscosity of the acidic compartments suppresses the high amplitude movements of excited AML molecules, and the emission of light occurs. Upon accumulation of the drug in the late endo-/lysosomal compartments, the fluorescence increases indicating high concentrative capacity of the acidic vesicles. The rapid entry of AML and its intracellular distribution, observed in live cells by means of optical microscopy, allow us to assume that the acidic compartments might serve as an additional drug pool. Because the small amount of uncharged AML molecules is always present, they may escape the lysosomes and reach their target Ca
V1.2 on the plasma membrane.
One can speculate that AML fluorescence might appear as a result of lysosomal enzymatic activities, but, contrary to that, the primary pathway of AML metabolism in humans and animals is an oxidation to the non-fluorescent pyridine analogs [
25,
26]. The metabolites with DHP structures as the products of the ester cleavage or oxidative deamination of the 2-aminoethoxymethyl side chain were found in rats and dogs. These metabolites as zwitterionic or negatively charged molecules would not interfere with negatively charged intralysosomal vesicles responsible for the lysosomal trapping mechanism, and most probably will be released into the cytosol. Remarkably, no AML metabolites show any Ca
2+ channel blocking activities [
25,
27].
In summary, we examined the fluorescence properties of the well-known antihypertensive drug amlodipine in the viscous media and upon binding to transport proteins. We demonstrated that amlodipine fluorescence enhancement in cellular environment can be used for its visualization inside living cells by confocal microscopy. A weakly basic amlodipine rapidly enters the cell and accumulates inside Rab7a-positive late endosomes and LAMP1-positive lysosomes, in its “stabilized” form, that favors its fluorescence. The molecule of the drug achieves this “stabilized” form by suppression of the 2-chlorophenyl ring rotation followed by the DHP fragment deformation. We propose that accumulation of amlodipine in the acidic compartments might contribute to its slow onset and long-lasting action.
4. Materials and Methods
4.1. General Materials and Methods
Racemic amlodipine besylate (97+%) was purchased from Alfa Aesar (Kandel, Germany). (S)-(–)-amlodipine ((S)-AML) besylate (98 +%) was purchased from Carbosynth (Berkshire, UK). (S)-(−)-Bay K8644 was purchased from Tocris Bioscience (Wiesbaden-Nordenstadt, Germany). BSA (98 +%), HSA (Fraction V) and Phosphate Buffered Saline tablets for 0.01 M phosphate buffer (PBS) were purchased from Merck, Darmstadt, Germany. All reagents were used without further purification. To prepare 20 mL of 10% BSA/HSA solutions in phosphate buffered saline (PBS, pH 7.4), 2 g of protein was dissolved in a 20 mL volumetric flask with the previously prepared PBS. The protein solution was kept in a refrigerator until use.
Fluorescence emission and absorption spectra were recorded on a multiwell plate reader TECAN Spark 20M in 96-well glass bottom plates (MatTek Corporation; Cat. No. PBK96G-1.5-5-F) at room temperature (25 °C). Fluorescence emission of AML was recorded from 390 nm to 600 nm with excitation at 360 nm. The emission bandwidth was set to 10 nm, excitation bandwidth—7.5 or 10 nm, gain—100, number of flashes—20. The absorption spectra were recorded: from 300 to 430 nm. The background absorption of a glass bottom plate was measured in wells containing only buffer and subtracted from the spectra of the samples. The spectra were averaged from three individual experiments. The absorption spectra of AML in glycerol/methanol mixtures were recorded on a Varian Cary 4000 UV-Vis spectrophotometer in quartz cuvettes (3 mL) with a 1 cm path length. Fluorescence spectra of 5 µM AML in PBS solutions of different pH (3–9) were recorded on a Varian Cary Eclipse fluorescence spectrometer.
Absolute fluorescence quantum yields (
Φ) were obtained on a Quantaurus-QY absolute PL quantum yield spectrometer (model C11347-12, Hamamatsu Hamamatsu Photonics Deutschland GmbH, Herrsching am Ammersee, Germany) at ambient temperature (25 °C), excitation wavelength 370 nm; all measurements were performed in triplicates. Fluorescence lifetimes (
τ) were measured with a Quantaurus-Tau fluorescence lifetime spectrometer (model C11367-32, Hamamatsu, Hamamatsu Photonics Deutschland GmbH, Herrsching am Ammersee, Germany). All measurements were performed in air-saturated solvents at ambient temperature. Radiative fluorescence lifetime (
Table 1,
τrad) was calculated by the formula:
τrad =
τ/
Φ.
4.2. Laser-Flash Photolysis Experiments
LFP experiments were performed using a Q-switched Nd:YAG laser (355 nm, 70 mJ per pulse, 10 ns half width, SOLAR laser system, Minsk, Republic of Belarus). All transient spectra were recorded using 10 × 10 mm quartz cells with a capacity of 4 mL and were bubbled for 30 min with argon before acquisition. All the experiments were conducted at room temperature.
4.3. Quantum Chemical Calculations
The molecular geometry of the compound and its spectra were calculated using the FireFly program package [
28] partially based on GAMESS [
29]. The geometry was optimized by the density functional theory (PBE0/6-31+G(d,p)); the spectra, excited-state geometry, transition states and conical intersection points were calculated by the time dependent density functional theory with the same functional and basis set.
The radiative rate constant was calculated by the formula: , where ν is the transition frequency in cm−1 and f is its oscillator strength. The rate of achieving the conical intersection via the barrier was calculated by the Arrhenius formula: , where ω is the frequency of the reorganizational mode in s−1 and A is the barrier height.
4.4. Determination of the Apparent Dissociation Constants (Kd) by Fluorescence Enhancement
The tested compounds were dissolved in the PBS containing different concentrations of BSA or HSA (0–10% in PBS, pH 7.4 + 0.1 v/v% DMSO). The obtained solutions were incubated for 1 h at room temperature to ensure ligand binding to the proteins. Emission spectra of BSA and HSA solutions, as well as the spectra of BSA/HSA solutions containing AML or (S)-AML (5 µM), were measured on a multiwell plate reader as given in “General materials and methods” section; the emission wavelength step size was 1–2 nm. The fluorescence intensities at 450 nm were measured for the calculation of the AML fluorescence increase upon binding to BSA/HSA. The fluorescence increase of compounds in BSA or HSA in relative fluorescence units (RFU) was plotted vs. proteins concentrations. Binding constants were calculated using the software package GraphPad Prism version 8.3.1 (GraphPad Software, San Diego, CA, USA). Y = (Bmax × X/(Kd + X)) + off was used, where Bmax is the maximum specific binding.
4.5. Cell Culture
HEK-293 CaV1.2 cells with stable expression of human CaV1.2 calcium channels (B’SYS, Witterswil, Switzerland) were cultured in DMEM/F-12 (Dulbecco’s Modified Eagle medium, Thermo Fisher Scientific, Darmstadt, Germany) supplemented with GlutaMAX-1 (Thermo Fisher Scientific), 10% fetal bovine serum (FBS) (Thermo Fisher Scientific, Darmstadt, Germany) and 0.9% Penicillin/Streptomycin (Merck, Darmstadt, Germany) in a humidified 5% CO2 incubator at 37 °C. In addition, we used a reduced antibiotic pressure for the cultivation of the cells; 100 µg/mL hygromycin B (Thermo Fisher Scientific, Invitrogen), 15 µg/mL Blasticidin (Invivogen, Toulouse, France), 0.4 µg/mL puromycin (Invivogen, Toulouse, France). To induce the expression of CaV1.2, 0.1 µg/mL doxycycline (Merck, Darmstadt, Germany) was added 24 h before experiments.
A7r5 cells (ATCC, Wesel, Germany) were cultured in DMEM Medium supplemented with 10% FBS, 0.9% penicillin/streptomycin in a humidified 5% CO2 atmosphere at 37 °C. Cells were split every 3–5 days or at confluence.
HL-1 cells (Merck Millipore, SCC065) were cultivated in Claycomb’s Medium (Sigma), supplemented with Glutamax, 10% fetal bovine serum, 0.9% penicillin/streptomycin and 0.1 mM noradrenaline (Sigma) on Fibronectin/Gelatine (Sigma) coated culture bottles or plates.
4.6. Ca2+ Assay
For fluorescent plate reader Ca2+ assay, HEK-293 CaV1.2 cells (20,000 per well) or HL-1 cells (25,000 per well) were cultivated for 24 h in black-walled, clear-bottom 96-well microplates (Corning, Amsterdam, The Netherlands) covered with fibronectin (10 μg/mL, Roche, Mannheim, Germany). Cells were grown in a humidified incubator at 37 °C and 5% CO2.
Changes in Ca2+ concentration were measured on a multiwell plate reader TECAN Spark 20M using FLIPR 6 Calcium Assay Kit from Molecular Devices (Molecular Devices LLC, München, Germany) at room temperature (25 °C). The 1000× stock solutions of AML were prepared in DMSO. Briefly, the culture medium was removed and the 100 µL loading buffer was added to the cells together with 100 µL AML solutions of different concentrations in Hanks’ balanced salt solution (HBSS, Lonza) containing 20 mM 4-(2-hydroxyethyl)-1-piperazineethanesulfonic acid (HEPES). Then the cells were incubated for 2 h at 37 °C. The cells were washed 2 times with 200 µL HBSS containing AML or (S)-AML (1 nM–5 µM) and 20 mM HEPES. The time courses were recorded in each well. Fluorescence was evoked by 485 nm excitation wavelength and collected in a bottom-read mode at 525 nm. Data was recorded every 2 s (exposure—20 flashes, excitation—10 nm, emission bandwidth—15 nm). To initiate Ca2+ influx, 50 µL of 400 mM KCl solution in HBSS was injected in each well (speed 100 µL/s) at 10 s time point. To get a fluorescence maximum, 15 of 30 µM Ionomycin (Merck, Darmstadt, Germany) solution in HBSS was injected in each well (speed 100 µL/s) at 50 s time point. The ratios between the KCl induced peak minus basal fluorescence, ΔF(KCl), were taken and expressed as a quotient of the maximal increase induced by ionomycin, ΔF (Ionomycin). The dose response curves of AML were calculated using the software package GraphPad Prism version 8.3.1. All data are presented as mean ± SD in 4 independent experiments. Y = Bottom + (Top-Bottom)/(1 + 10^((LogIC50 − X) × HillSlope)) was used where HillSlope describes the steepness of the curve, Top and Bottom are plateaus in the units of the Y axis.
4.7. Cells Preparation for Live-Cell-Imaging Experiments
For the wide-field microscopy experiments cells were seeded in µ-24 well plates (Ibidi, Gräfelfing, Germany) or glass bottom 12-well plates (MatTek Corporation, Bratislava, Slovak Republic) at 25,000 (A7r5 and HL-1) or 12,500 (HEK-293 Ca
V1.2) cells per well. For the confocal imaging cells were seeded in CELLview™ Slides (Greiner Bio-One, Frickenhausen, Germany); 8000 cells per well or in 35 mm glass bottom dish (Cellvis, USA); well 14 mm, glass thickness #1.5, 30,000 cells per well. The induction of HEK-293 Ca
V1.2 cells was done by 24 h incubation in doxycycline solution (0.1 µg/mL). For cellular imaging, cells were incubated at 37 °C with 0.1–2 µM AML prepared in Hanks’ balanced salt solution (HBSS) supplemented with 20 mM 4-(2-hydroxyethyl)-1-piperazineethanesulfonic acid (HEPES) pH 7.4, from a 10 mM stock solution prepared in DMSO. For co-staining experiments cell were labeled with CellLight
® Golgi-emGFP (fusion construct of Human Golgi-resident enzyme
N-acetylgalactosaminyltransferase 2 and emGFP), MitoTracker
® Orange, ER-Tracker
® Red, CellLight
® Early Endosomes-emGFP (fusion construct of Rab5a and emGFP), CellLight
® Late Endosomes-emGFP (fusion construct of Rab7a and emGFP), BacMam 2.0 (ThermoFisher Scientific, Schwerte, Germany) according to the manufactures instructions. 5 µM SynaptoRed C2
® (FM 4-64, Tocris, Wiesbaden-Nordenstadt, Germany) was used for membrane staining. For the nucleus staining, we used 1 µM TMR-Hoechst and 100 nM
610CP-5-COOH-Hoechst probe [
30]. Samples were washed two times with HBSS/HEPES, and imaged in the same buffer.
4.8. Fluorescence Microscopy
Confocal imaging was performed on a Leica SP8 (Leica Microsystems, Mannheim, Germany) inverted confocal microscope equipped with an HC PL APO CS2 63x/1.40 Oil objective. All live-cell images shown in the main text were acquired using a 700 Hz bidirectional scanner, and a 92.26 × 92.26-μm field of view (1024 × 1024 pixels and 90 nm pixels), pinhole of 95.6 µm diameter (1 AU), pixel dwell time—325 ns. AML was excited with 405 nm laser (3% intensity) and detected with a regular PMT in the 420–470 nm range. CellLight® Golgi-emGFP, CellLight® EarlyEndosomes-emGFP and Late Endosomes-emGFP (fusion construct of Rab7a and emGFP) were excited with a 488 nm laser (5% intensity) and detected with a regular PMT in the 510–560 nm range. ER-Tracker® Red was excited with a 561 nm laser and detected with the Leica HyD detector set within the spectral range of 600–650 nm. SynaptoRed C2 (FM 4-64) was exited with a 405 or 561 nm laser and detected with the Leica HyD detector set within the spectral range of 590–650 nm. 610CP-5-COOH-Hoechst probe was excited with 610 nm laser and detected with a regular PMT in the 635–650 nm range. For wide-field imaging we used Lionheart FX automated microscope (Biotek) equipped with dry air objectives 4×, 20× and 40× and sample injection system. 16 fields of view in 3 focusing planes, spanning 6 μm in thickness, were acquired per well. Image stitching and focus stacking was performed using in-built Gene 5 software (Biotek). The final images encompassed 1380 × 950 μm field of view and contained at least 220 and up to 2000 cells.
The images in
Figure 4 were deconvolved with Huygens Essential version 20.10 (Scientific Volume Imaging, The Netherlands,
http://svi.nl, accessed on 19 February 2021). All acquired or reconstructed images were processed and visualized using Huygens Essential 20.10 or ImageJ 1.53c software [
31]. Co-localization analysis was carried out on whole images (Huygens Essential 20.10) or on five to ten randomly selected regions of interest (ROIs, ImageJ 1.53c). Co-localization was established for pixels whose intensities were higher than threshold.


 ,
, 


