
Classification of Unifloral Honeys from SARDINIA (Italy) by ATR-FTIR Spectroscopy and Random Forest

 ,
, 
 , and
, and 
Abstract
1. Introduction
2. Results
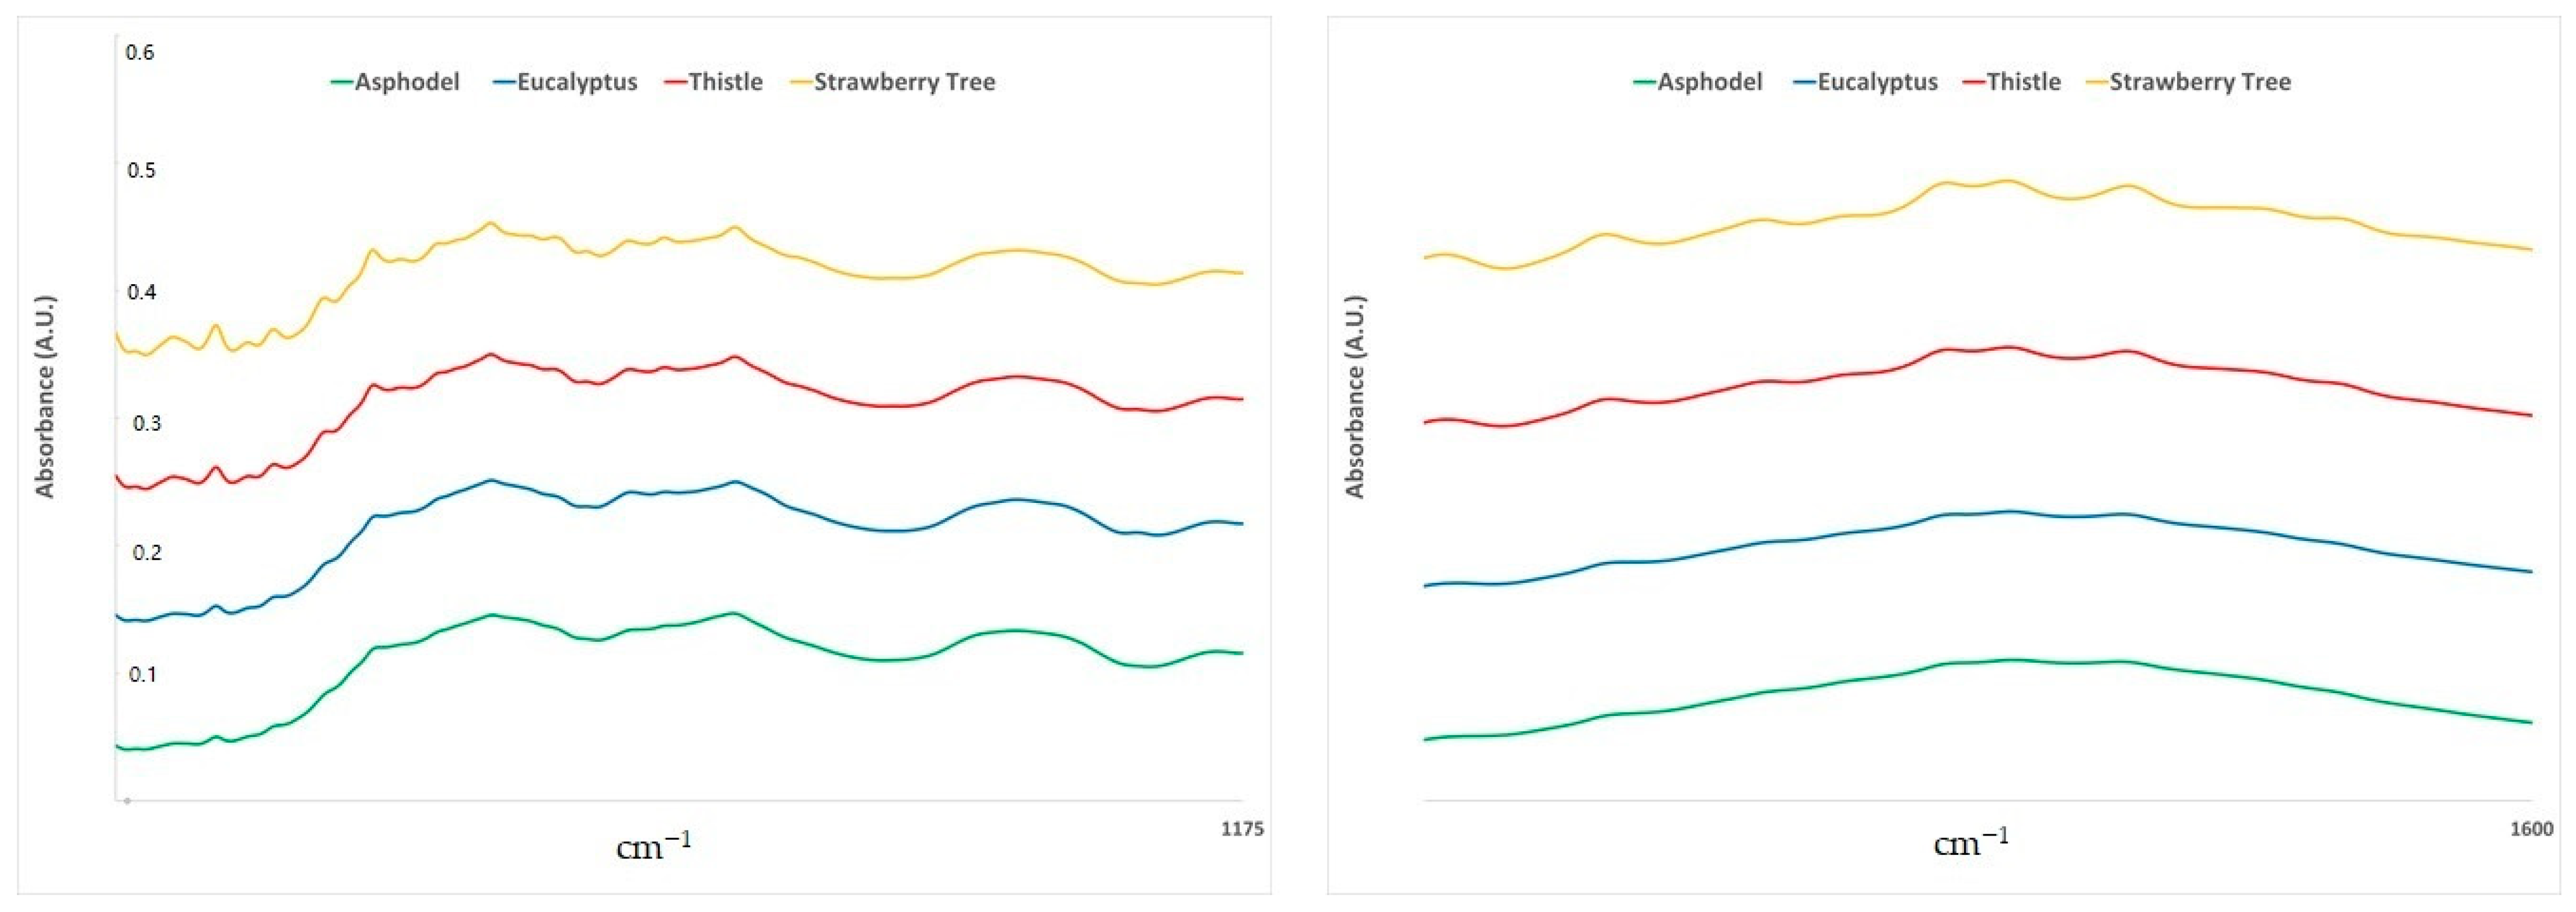
2.1. ATR-FTIR Spectra
2.2. Random Forest Classification
3. Discussion
4. Materials and Methods
4.1. Honey Samples
4.2. ATR-FTIR Spectroscopy
4.3. Random Forest
5. Conclusions
Author Contributions
Funding
Data Availability Statement
Acknowledgments
Conflicts of Interest
Sample Availability
References
- Afrin, S.; Haneefa, S.M.; Fernandez-Cabezudo, M.J.; Giampieri, F.; al-Ramadi, B.K.; Battino, M. Therapeutic and preventive properties of honey and its bioactive compounds in cancer: An evidence-based review. Nutr. Res. Rev. 2020, 33, 50–76. [Google Scholar] [CrossRef] [PubMed]
- García, N.L. The Current Situation on the International Honey Market. Bee World 2018, 95, 89–94. [Google Scholar] [CrossRef]
- Aries, E.; Burton, J.; Carrasco, L.; De Rudder, L.; Maquet, A. Scientific Support to the Implementation of a Coordinated Control Plan with a View to Establishing the Prevalence of Fraudulent Practices in the Marketing of Honey. Results of Honey Authenticity Testing by Liquid Chromatography-Isotope Ratio Mass Spectrometry; European Commission: Brussels, Belgium, 2016; Available online: https://ec.europa.eu/food/sites/food/files/safety/docs/oc_control-progs_honey_jrc-tech-report_2016.pdf (accessed on 27 December 2020).
- Anklam, E. A review of the analytical methods to determine the geographical and botanical origin of honey. Food Chem. 1998, 63, 549–562. [Google Scholar] [CrossRef]
- Machado, A.M.; Miguel, M.G.; Vilas-Boas, M.; Figueiredo, A.C. Honey Volatiles as a Fingerprint for Botanical Origin—A Review on their Occurrence on Monofloral Honeys. Molecules 2020, 25, 374. [Google Scholar] [CrossRef]
- Mădaş, M.N.; Mărghitaş, L.A.; Dezmirean, D.S.; Bobiş, O.; Abbas, O.; Danthine, S.; Francis, F.; Haubruge, E.; Nguyen, B.K. Labeling Regulations and Quality Control of Honey Origin: A Review. Food Rev. Int. 2020, 36, 215–240. [Google Scholar] [CrossRef]
- De Sousa, J.M.B.; de Souza, E.L.; Marques, G.; de Toledo Benassi, M.; Gullón, B.; Pintado, M.M.; Magnani, M. Sugar profile, physicochemical and sensory aspects of monofloral honeys produced by different stingless bee species in Brazilian semi-arid region. LWT Food Sci. Technol. 2016, 65, 645–651. [Google Scholar] [CrossRef]
- Nozal Nalda, M.J.; Bernal Yagüe, J.L.; Diego Calva, J.C.; Martín Gómez, M.T. Classifying honeys from the Soria Province of Spain via multivariate analysis. Anal. Bioanal. Chem. 2005, 382, 311–319. [Google Scholar] [CrossRef]
- Escuredo, O.; Dobre, I.; Fernández-González, M.; Seijo, M.C. Contribution of botanical origin and sugar composition of honeys on the crystallization phenomenon. Food Chem. 2014, 149, 84–90. [Google Scholar] [CrossRef]
- Tuberoso, C.I.G.; Bifulco, E.; Caboni, P.; Cottiglia, F.; Cabras, P.; Floris, I. Floral Markers of Strawberry Tree (Arbutus unedo L.) Honey. J. Agric. Food Chem. 2010, 58, 384–389. [Google Scholar] [CrossRef]
- Pascual-Maté, A.; Osés, S.M.; Fernández-Muiño, M.A.; Sancho, M.T. Analysis of Polyphenols in Honey: Extraction, Separation and Quantification Procedures. Sep. Purif. Rev. 2018, 47, 142–158. [Google Scholar] [CrossRef]
- Pohl, P. Determination of metal content in honey by atomic absorption and emission spectrometries. TrAC Trends Anal. Chem. 2009, 28, 117–128. [Google Scholar] [CrossRef]
- Alissandrakis, E.; Tarantilis, P.A.; Pappas, C.; Harizanis, P.C.; Polissiou, M. Ultrasound-assisted extraction gas chromatography–mass spectrometry analysis of volatile compounds in unifloral thyme honey from Greece. Eur. Food Res. Technol. 2009, 229, 365–373. [Google Scholar] [CrossRef]
- Aliferis, K.A.; Tarantilis, P.A.; Harizanis, P.C.; Alissandrakis, E. Botanical discrimination and classification of honey samples applying gas chromatography/mass spectrometry fingerprinting of headspace volatile compounds. Food Chem. 2010, 121, 856–862. [Google Scholar] [CrossRef]
- Radovic, B.S.; Careri, M.; Mangia, A.; Musci, M.; Gerboles, M.; Anklam, E. Contribution of dynamic headspace GC–MS analysis of aroma compounds to authenticity testing of honey. Food Chem. 2001, 72, 511–520. [Google Scholar] [CrossRef]
- Soria, A.C.; Martínez-Castro, I.; Sanz, J. Some aspects of dynamic headspace analysis of volatile components in honey. Food Res. Int. 2008, 41, 838–848. [Google Scholar] [CrossRef]
- Ampuero, S.; Bogdanov, S.; Bosset, J.-O. Classification of unifloral honeys with an MS-based electronic nose using different sampling modes: SHS, SPME and INDEX. Eur. Food Res. Technol. 2004, 218, 198–207. [Google Scholar] [CrossRef]
- Pierna, J.A.F.; Abbas, O.; Dardenne, P.; Baeten, V. Discrimination of Corsican honey by FT-Raman spectroscopy and chemometrics. Biotechnol. Agron. Soc. Environ. 2011, 10, 75–84. [Google Scholar]
- Grazia Mignani, A.; Ciaccheri, L.; Mencaglia, A.A.; Di Sanzo, R.; Carabetta, S.; Russo, M. Dispersive Raman Spectroscopy for the Nondestructive and Rapid Assessment of the Quality of Southern Italian Honey Types. J. Lightwave Technol. 2016, 34, 4479–4485. [Google Scholar] [CrossRef]
- Schievano, E.; Stocchero, M.; Morelato, E.; Facchin, C.; Mammi, S. An NMR-based metabolomic approach to identify the botanical origin of honey. Metabolomics 2012, 8, 679–690. [Google Scholar] [CrossRef]
- Ren, H.; Yue, J.; Wang, D.; Fan, J.; An, L. HPLC and 1H-NMR combined with chemometrics analysis for rapid discrimination of floral origin of honey. J. Food Meas. Charact. 2019, 13, 1195–1204. [Google Scholar] [CrossRef]
- Minaei, S.; Shafiee, S.; Polder, G.; Moghadam-Charkari, N.; van Ruth, S.; Barzegar, M.; Zahiri, J.; Alewijn, M.; Kuś, P.M. VIS/NIR imaging application for honey floral origin determination. Infrared Phys. Technol. 2017, 86, 218–225. [Google Scholar] [CrossRef]
- Dinca, O.-R.; Ionete, R.E.; Popescu, R.; Costinel, D.; Radu, G.-L. Geographical and Botanical Origin Discrimination of Romanian Honey Using Complex Stable Isotope Data and Chemometrics. Food Anal. Methods 2015, 8, 401–412. [Google Scholar] [CrossRef]
- Huang, F.; Song, H.; Guo, L.; Guang, P.; Yang, X.; Li, L.; Zhao, H.; Yang, M. Detection of adulteration in Chinese honey using NIR and ATR-FTIR spectral data fusion. Spectrochim. Acta Part A Mol. Biomol. Spectrosc. 2020, 235, 118297. [Google Scholar] [CrossRef] [PubMed]
- Rios-Corripio, M.A.; Rojas-López, M.; Delgado-Macuil, R. Analysis of adulteration in honey with standard sugar solutions and syrups using attenuated total reflectance-Fourier transform infrared spectroscopy and multivariate methods. CYTA J. Food 2012, 10, 119–122. [Google Scholar] [CrossRef]
- Riswahyuli, Y.; Rohman, A.; Setyabudi, F.M.C.S.; Raharjo, S. Indonesian wild honey authenticity analysis using attenuated total reflectance-fourier transform infrared (ATR-FTIR) spectroscopy combined with multivariate statistical techniques. Heliyon 2020, 6, e03662. [Google Scholar] [CrossRef] [PubMed]
- Sahlan, M.; Karwita, S.; Gozan, M.; Hermansyah, H.; Yohda, M.; Yoo, Y.J.; Pratami, D.K. Identification and classification of honey’s authenticity by attenuated total reflectance Fourier-transform infrared spectroscopy and chemometric method. Vet. World 2019, 12, 1304–1310. [Google Scholar] [CrossRef]
- Li, Q.; Zeng, J.; Lin, L.; Zhang, J.; Zhu, J.; Yao, L.; Wang, S.; Yao, Z.; Wu, Z. Low risk of category misdiagnosis of rice syrup adulteration in three botanical origin honey by ATR-FTIR and general model. Food Chem. 2020, 332, 127356. [Google Scholar] [CrossRef]
- Devi, A.; Jangir, J.; Anu-Appaiah, K.A. Chemical characterization complemented with chemometrics for the botanical origin identification of unifloral and multifloral honeys from India. Food Res. Int. 2018, 107, 216–226. [Google Scholar] [CrossRef]
- Gok, S.; Severcan, M.; Goormaghtigh, E.; Kandemir, I.; Severcan, F. Differentiation of Anatolian honey samples from different botanical origins by ATR-FTIR spectroscopy using multivariate analysis. Food Chem. 2015, 170, 234–240. [Google Scholar] [CrossRef]
- Kasprzyk, I.; Depciuch, J.; Grabek-Lejko, D.; Parlinska-Wojtan, M. FTIR-ATR spectroscopy of pollen and honey as a tool for unifloral honey authentication. The case study of rape honey. Food Control 2018, 84, 33–40. [Google Scholar] [CrossRef]
- Svečnjak, L.; Bubalo, D.; Boranović, G.; Novosel, H. Optimization of FTIR-ATR spectroscopy for botanical authentication of unifloral honey types and melissopalinological data prediction. Eur. Food Res. Technol. 2015, 240, 1101–1115. [Google Scholar] [CrossRef]
- Tuberoso, C.I.G.; Bifulco, E.; JerkoviĆ, I.; Caboni, P.; Cabras, P.; Floris, I. Methyl Syringate: A Chemical Marker of Asphodel (Asphodelus microcarpus Salzm. et Viv.) Monofloral Honey. J. Agric. Food Chem. 2009, 57, 3895–3900. [Google Scholar] [CrossRef] [PubMed]
- Afrin, S.; Forbes-Hernandez, T.; Gasparrini, M.; Bompadre, S.; Quiles, J.; Sanna, G.; Spano, N.; Giampieri, F.; Battino, M. Strawberry-Tree Honey Induces Growth Inhibition of Human Colon Cancer Cells and Increases ROS Generation: A Comparison with Manuka Honey. Int. J. Mol. Sci. 2017, 18, 613. [Google Scholar] [CrossRef] [PubMed]
- Tariba Lovaković, B.; Lazarus, M.; Brčić Karačonji, I.; Jurica, K.; Živković Semren, T.; Lušić, D.; Brajenović, N.; Pelaić, Z.; Pizent, A. Multi-elemental composition and antioxidant properties of strawberry tree (Arbutus unedo L.) honey from the coastal region of Croatia: Risk-benefit analysis. J. Trace Elem. Med. Biol. 2018, 45, 85–92. [Google Scholar] [CrossRef] [PubMed]
- Rosa, A.; Tuberoso, C.I.G.; Atzeri, A.; Melis, M.P.; Bifulco, E.; Dessì, M.A. Antioxidant profile of strawberry tree honey and its marker homogentisic acid in several models of oxidative stress. Food Chem. 2011, 129, 1045–1053. [Google Scholar] [CrossRef] [PubMed]
- Afrin, S.; Forbes-Hernández, T.Y.; Cianciosi, D.; Pistollato, F.; Zhang, J.; Pacetti, M.; Amici, A.; Reboredo-Rodríguez, P.; Simal-Gandara, J.; Bompadre, S.; et al. Strawberry tree honey as a new potential functional food. Part 2: Strawberry tree honey increases ROS generation by suppressing Nrf2-ARE and NF-кB signaling pathways and decreases metabolic phenotypes and metastatic activity in colon cancer cells. J. Funct. Foods 2019, 57, 477–487. [Google Scholar] [CrossRef]
- Cabras, P.; Angioni, A.; Tuberoso, C.; Floris, I.; Reniero, F.; Guillou, C.; Ghelli, S. Homogentisic Acid: A Phenolic Acid as a Marker of Strawberry-Tree (Arbutus unedo) Honey. J. Agric. Food Chem. 1999, 47, 4064–4067. [Google Scholar] [CrossRef]
- Scanu, R.; Spano, N.; Panzanelli, A.; Pilo, M.I.; Piu, P.C.; Sanna, G.; Tapparo, A. Direct chromatographic methods for the rapid determination of homogentisic acid in strawberry tree (Arbutus unedo L.) honey. J. Chromatogr. A 2005, 1090, 76–80. [Google Scholar] [CrossRef]
- Spano, N.; Casula, L.; Panzanelli, A.; Pilo, M.; Piu, P.; Scanu, R.; Tapparo, A.; Sanna, G. An RP-HPLC determination of 5-hydroxymethylfurfural in honeyThe case of strawberry tree honey. Talanta 2006, 68, 1390–1395. [Google Scholar] [CrossRef]
- Floris, I. Honeys of Sardinia (Italy). J. Apic. Res. 2007, 198–209. [Google Scholar] [CrossRef]
- Ciulu, M.; Serra, R.; Caredda, M.; Salis, S.; Floris, I.; Pilo, M.I.; Spano, N.; Panzanelli, A.; Sanna, G. Chemometric treatment of simple physical and chemical data for the discrimination of unifloral honeys. Talanta 2018, 190, 382–390. [Google Scholar] [CrossRef] [PubMed]
- Martos, I.; Ferreres, F.; Tomás-Barberán, F.A. Identification of Flavonoid Markers for the Botanical Origin of Eucalyptus Honey. J. Agric. Food Chem. 2000, 48, 1498–1502. [Google Scholar] [CrossRef] [PubMed]
- Tuberoso, C.I.G.; Bifulco, E.; Caboni, P.; Sarais, G.; Cottiglia, F.; Floris, I. Lumichrome and Phenyllactic Acid as Chemical Markers of Thistle (Galactites tomentosa Moench) Honey. J. Agric. Food Chem. 2011, 59, 364–369. [Google Scholar] [CrossRef] [PubMed]
- Maione, C.; Barbosa, F.; Barbosa, R.M. Predicting the botanical and geographical origin of honey with multivariate data analysis and machine learning techniques: A review. Comput. Electron. Agric. 2019, 157, 436–446. [Google Scholar] [CrossRef]
- Batista, B.L.; da Silva, L.R.S.; Rocha, B.A.; Rodrigues, J.L.; Berretta-Silva, A.A.; Bonates, T.O.; Gomes, V.S.D.; Barbosa, R.M.; Barbosa, F. Multi-element determination in Brazilian honey samples by inductively coupled plasma mass spectrometry and estimation of geographic origin with data mining techniques. Food Res. Int. 2012, 49, 209–215. [Google Scholar] [CrossRef]
- Breiman, L. Random Forests. Mach. Learn. 2001, 45, 5–32. [Google Scholar] [CrossRef]
- Martinez-Castillo, C.; Astray, G.; Mejuto, J.C.; Simal-Gandara, J. Random Forest, Artificial Neural Network, and Support Vector Machine Models for Honey Classification. eFood 2019, 1, 69. [Google Scholar] [CrossRef]
- Svečniak, L.; Biliškov, N.; Bubalo, D.; Barišic, D. Application of Infrared spectroscopy in Honey analysis. Agric. Conspec. Sci. 2011, 76, 191–195. [Google Scholar]
- Gallardo-Velázquez, T.; Osorio-Revilla, G.; Loa, M.Z.; Rivera-Espinoza, Y. Application of FTIR-HATR spectroscopy and multivariate analysis to the quantification of adulterants in Mexican honeys. Food Res. Int. 2009, 42, 313–318. [Google Scholar] [CrossRef]
- Movasaghi, Z.; Rehman, S.; ur Rehman, D.I. Fourier Transform Infrared (FTIR) Spectroscopy of Biological Tissues. Appl. Spectrosc. Rev. 2008, 43, 134–179. [Google Scholar] [CrossRef]
- Sivakesava, S.; Irudayaraj, J. Prediction of Inverted Cane Sugar Adulteration of Honey by Fourier Transform Infrared Spectroscopy. J. Food Sci. 2001, 66, 972–978. [Google Scholar] [CrossRef]
- Cai, S.; Singh, B.R. A Distinct Utility of the Amide III Infrared Band for Secondary Structure Estimation of Aqueous Protein Solutions Using Partial Least Squares Methods. Biochemistry 2004, 43, 2541–2549. [Google Scholar] [CrossRef] [PubMed]
- Philip, D. Honey mediated green synthesis of gold nanoparticles. Spectrochim. Acta Part A Mol. Biomol. Spectrosc. 2009, 73, 650–653. [Google Scholar] [CrossRef] [PubMed]
- Tewari, J.; Irudayaraj, J. Quantification of Saccharides in Multiple Floral Honeys Using Fourier Transform Infrared Microattenuated Total Reflectance Spectroscopy. J. Agric. Food Chem. 2004, 52, 3237–3243. [Google Scholar] [CrossRef]
- Tewari, J.C.; Irudayaraj, J.M.K. Floral Classification of Honey Using Mid-Infrared Spectroscopy and Surface Acoustic Wave Based z-Nose Sensor. J. Agric. Food Chem. 2005, 53, 6955–6966. [Google Scholar] [CrossRef]
- Subari, N.; Mohamad Saleh, J.; Md Shakaff, A.; Zakaria, A. A Hybrid Sensing Approach for Pure and Adulterated Honey Classification. Sensors 2012, 12, 14022–14040. [Google Scholar] [CrossRef]
- Mathlouthi, M.; Koenig, J.L. Vibrational Spectra of Carbohydrates. In Advances in Carbohydrate Chemistry and Biochemistry; Academic Press: London, UK, 1987; Volume 44, pp. 7–89. ISBN 978-0-12-007244-6. [Google Scholar]
- Kelly, J.F.D.; Downey, G.; Fouratier, V. Initial Study of Honey Adulteration by Sugar Solutions Using Midinfrared (MIR) Spectroscopy and Chemometrics. J. Agric. Food Chem. 2004, 52, 33–39. [Google Scholar] [CrossRef]
- Varma, S.; Simon, R. Bias in error estimation when using cross-validation for model selection. BMC Bioinform. 2006, 7, 91. [Google Scholar] [CrossRef]
- Stefas, D.; Gyftokostas, N.; Couris, S. Laser induced breakdown spectroscopy for elemental analysis and discrimination of honey samples. Spectrochim. Acta Part B At. Spectrosc. 2020, 172, 105969. [Google Scholar] [CrossRef]
- Tahir, H.E.; Xiaobo, Z.; Zhihua, L.; Jiyong, S.; Zhai, X.; Wang, S.; Mariod, A.A. Rapid prediction of phenolic compounds and antioxidant activity of Sudanese honey using Raman and Fourier transform infrared (FT-IR) spectroscopy. Food Chem. 2017, 226, 202–211. [Google Scholar] [CrossRef]
- Liaw, A.; Wiener, M. Classification and Regression by randomForest. R News 2002, 2, 18–22. [Google Scholar]


| Wavenumber Range (cm−1) | Frequency (%) |
|---|---|
| 3000–2800 | 1.2 |
| 1700–1600 | 10.7 |
| 1600–1540 | 1.1 |
| 1540–1175 | 87 |
| 1175–940 | 0 |
| 940–700 | 0 |
Publisher’s Note: MDPI stays neutral with regard to jurisdictional claims in published maps and institutional affiliations. |
© 2020 by the authors. Licensee MDPI, Basel, Switzerland. This article is an open access article distributed under the terms and conditions of the Creative Commons Attribution (CC BY) license (http://creativecommons.org/licenses/by/4.0/).
Share and Cite
Ciulu, M.; Oertel, E.; Serra, R.; Farre, R.; Spano, N.; Caredda, M.; Malfatti, L.; Sanna, G. Classification of Unifloral Honeys from SARDINIA (Italy) by ATR-FTIR Spectroscopy and Random Forest. Molecules 2021, 26, 88. https://doi.org/10.3390/molecules26010088
Ciulu M, Oertel E, Serra R, Farre R, Spano N, Caredda M, Malfatti L, Sanna G. Classification of Unifloral Honeys from SARDINIA (Italy) by ATR-FTIR Spectroscopy and Random Forest. Molecules. 2021; 26(1):88. https://doi.org/10.3390/molecules26010088
Chicago/Turabian StyleCiulu, Marco, Elisa Oertel, Rosanna Serra, Roberta Farre, Nadia Spano, Marco Caredda, Luca Malfatti, and Gavino Sanna. 2021. "Classification of Unifloral Honeys from SARDINIA (Italy) by ATR-FTIR Spectroscopy and Random Forest" Molecules 26, no. 1: 88. https://doi.org/10.3390/molecules26010088
APA StyleCiulu, M., Oertel, E., Serra, R., Farre, R., Spano, N., Caredda, M., Malfatti, L., & Sanna, G. (2021). Classification of Unifloral Honeys from SARDINIA (Italy) by ATR-FTIR Spectroscopy and Random Forest. Molecules, 26(1), 88. https://doi.org/10.3390/molecules26010088