1. Introduction
In view of the world’s population growing from 7.6 billion in 2017 to estimated 9.4–10.2 billion people by 2050, but also in consideration of rising living standards, correlating with increasing meat consumption, an increase of food requirements by 50% between 2012 and 2050 is to be expected [
1]. This increased demand cannot be satisfied by the utilization of new farmland alone, since most of it is not developed, too remote from potential markets, susceptible to pest infestation or new cultivated land would compete with the conservation of important ecosystems. Furthermore, potential arable land is limited to a small number of countries. Rather, increasing productivity and efficiency in agricultural production must contribute to meet the increased demand [
2], resulting in a greater need for nutrients, especially nitrogen fertilizers.
Nowadays, the nutrition of half the world’s population is ensured by the Haber-Bosch process, which enables the synthesis of ammonia (NH
3) for fertilizer production [
3]. However, the production of NH
3 requires a high amount of energy (10 kWh/kg NH
3) [
4]. Dawson and Hilton [
5] calculated that 1.1% of the world’s energy consumption can be attributed to the production of fertilizers; 90% of it due to the production of nitrogen fertilizers.
On the other hand, ammonium has severe negative environmental impacts. Because of its eutrophication potential, ammonium contributes to the growth of biomass in water bodies. Under alkaline conditions, which can occur during the day if intensive photosynthesis takes place, ammonium dissociates to ammonia, which has a toxic effect on aquatic fauna even in low concentrations.
In wastewater treatment rejected sludge water from the dewatering process of anaerobically treated sludge causes significant additional ammonium loads for the biological treatment step [
6], resulting in additional need for energy and space. Additionally, external carbon sources might be necessary for a stable nitrogen elimination process. Instead of elimination and high-energy expenditure, the ammonium should be recovered to partially substitute the increasing worldwide demand for NH
3.
Recovery methods such as air stripping, bioelectrochemical systems, membrane separation, and ion exchange have been thoroughly investigated. However, these methods require additional chemicals as well as energy, and ammonia losses due to volatilization can occur [
7].
The zeolite clinoptilolite (CLI) is known to be a very good ion exchanger, as it consists of a three-dimensional tetrahedral structure formed of AlO
4− and SiO4, connected by a shared oxygen atom. The micropores formed by this structure are fine enough to allow entry and exchange of cations and water molecules [
8]. This ability is based on the substitution of SiO
4 by AlO
4−, leading to a negative charge in the structure, which has to be compensated by exchangeable cations such as Na
+, K
+, Ca
2+, and Mg
2+ [
9]. In a previous study with Carpathian clinoptilolite powder (CCP 20), 21.0 meq/100 g Na
+, 49.3 meq/100 g K
+, 65.6 meq/100 g Ca
2+, and 3.3 meq/100 g Mg
2+ were exchanged with 136.9 meq/100 g NH
4+ [
10].
As soon as the exchange capability for ammonium is exhausted, CLI is proposed to be utilized as a slow-release fertilizer in agriculture [
11] or regenerated by the use of sodium chloride, sodium carbonate, sodium bicarbonate, or sodium hydroxide solutions [
12,
13,
14,
15].
In a study investigating the adsorption of ammonium from different highly concentrated wastewaters, it was shown that elimination from leachate of a sewage sludge landfill (
c0 = 11.12–115.16 mg/L NH
4-N) was 10–20% lower than from a matrix-free solution [
16]. It has been demonstrated, that ammonium from swine manure (
c0 = 0.43 M/L NH
4+ ≈ 6150 mg/L NH
4-N) can be removed by means of CLI, but the load is reduced from 10 mg/g (matrix-free ammonium solution) to 2 mg/g (manure) due to the cations contained [
17]. Furthermore, dilution of leachate from a municipal landfill (
c0 = 2292 mg/L NH
4-N) does not improve ammonium adsorption [
18]. In addition, organic compounds that are not removed by activated carbon interfere with the sorption of ammonium from leachate (
c0 = 820 mg/L NH
4+ = 637 mg/L NH
4-N) at CLI; the load increases when leachate is pretreated with activated carbon [
19]. The results of these studies show that the composition of the medium to which CLI is applied might be decisive for the adsorption effect. Since the adsorption of ammonium from sludge water, has not been sufficiently investigated, the adsorption process in this complex medium is not well understood and the technical implementation is uncertain.
The objective of this study was to develop a deeper understanding of the factors influencing the sorption of ammonium from sludge water on powdered natural clinoptilolite.
2. Materials and Methods
2.1. Zeolite Samples and Chemicals
Since preliminary studied Slovakian CLI CCP 20 (CCP = Carpathian clinoptilolite powder) showed favorable sorption properties [
10], it was employed for this study. It was obtained from the supplier Labradorit GmbH (Berlin, Germany), in a ground and sieved form (particle size smaller than 20 µm). The CLI was dried at 378 K for 24 h before use. No other pretreatment was conducted. The CCP 20 mainly consisted of Si (35.5% (
wt/
wt)), Al (5.4%), K (2.0%), Ca (1.6%), Fe (1.0%), Na (0.4%), Mg (0.3%), Ti (0.1%), Ba (0.08%), and Pb (0.001%), whereas Cr, Ni, As, Rb, Cd, Cs, Ba, Hg, and Tl were below the limit of detection.
NH4Cl (p.a.), NaOH (p.a.) and HCl (32%, p.a.) were obtained from VWR International (Radnor, PA, USA).
2.2. Sludge Water and Matrix-Free Solution
Sludge water from two different WWTPs with high concentrations of ammonium nitrogen (see
Table 1) were investigated. The sludge water originated from the dewatering process of anaerobically stabilized sludge by means of a chamber filter press. During normal operation, this sludge water is recycled to the main treatment process.
SW1 originated from a WWTP treating mainly municipal wastewater using the activated sludge process with upstream denitrification. Iron chloride sulphate is employed for phosphate precipitation. Primary sludge from mechanical treatment, secondary sludge from the biological stage and precipitated sludge from phosphorus elimination are admixed and anaerobically digested. Before dewatering, the digested sludge is pre-thickened and subsequently dewatered by means of a chamber filter press. For the investigations, the sludge water was taken from the outlet of the chamber filter press.
SW2 originated from a WWTP with a high industrial wastewater share. The wastewater is treated by trickling filters and a downstream denitrification. A mixture of aluminum and iron salts is employed as precipitant for phosphate elimination. Sludge from primary and secondary treatment as well as from phosphate elimination are pre-thickened and subsequently anaerobically digested. Afterwards, the digested sludge is dewatered with a chamber filter press, the outlet of which was sampled to gain SW2 for the investigations. Of SW2, several samples were examined, which were taken at different times.
Matrix-free ammonium chloride solution (c0 = 1000 mg/L NH4-N) was prepared by dissolving NH4Cl in distilled water.
Table 1 summarizes the physical properties and constituents of the examined sludge waters.
Both sludge waters showed only minor differences in composition except of COD (chemical oxygen demand) and PO4-P. The COD concentration in SW1 was about twice as high as in SW2, but the dissolved COD concentration (filtered by 0.45 µm nylon membrane) was similar. Presumably, the retention of COD-causing particles in the sludge dewatering of SW1 was less efficient than in SW2. In addition, the concentration of PO4-P in SW1 was considerably higher (factor 10).
In
Table 2 the elementary composition of the examined sludge waters is listed.
The investigated sludge waters contained very low concentrations of heavy metals. They differed in their concentration of potassium and calcium, whereas the sodium and magnesium concentrations were almost identical.
Cations competing with ammonium ions for sorption sites such as K+ and Na+ were present in lower concentrations (K+: SW1: 234 mg/L = 6.0 mmol/L; SW2: 87.5–91.0 mg/L = 2.2–2.3 mmol/L; Na+: SW1: 126 mg/L = 5.5 mmol/L; SW2: 129–132 mg/L = 5.6–5.7 mmol/L) as ammonium (SW1: 967 mg/L NH4-N = 69 mmol/L; SW2: 718–913 mg/L NH4-N = 51.3–65.2 mmol/L). Accordingly, ammonium was present in multiple excess (SW1: [NH4+]/[K+] ≈ 12; [NH4+]/[Na+] ≈ 13; SW2: [NH4+]/[K+] ≈ 24–30; [NH4+]/[Na+] ≈ 10–12).
The ion ratios of ammonium to potassium and sodium were more favorable (high ammonium surplus) than in leachate from a sewage sludge landfill ([NH
4+]/[Na
+] ≈ 2.7; [NH
4+]/[K
+] ≈ 14.6 [
16]) and leachate ([NH
4+]/[K
+] ≈ 2.2; [NH
4+]/[Na
+] ≈ 0.9 [
19]), whereas a larger ammonium surplus was set in synthetic wastewater ([NH
4+]/[K
+] ≈ 17.3; [NH
4+]/[Na
+] ≈ 6.9 [
20]).
2.3. Experimental Design
2.3.1. Isoelectric State of CLI and pH-Dependent Adsorption
Both sludge waters were adjusted to pH values ranging from 2 to 12 by HCl or NaOH prior to the experiment. A fixed specific sorbent mass at a ratio of 0.1 g CLI per mg NH4-N was employed. Sorbent (20 g) and solution (200 mL) were stirred for 20 h on a magnetic stirrer (400 rpm) at room temperature (295 K) in closed bottles, subsequently membrane-filtered (0.45 µm pore size), and then the pH value as well as the ammonium concentration were determined. The initial pH values of the solutions were compared with those of the filtrates. The isoelectric state is the point at which both pH values are identical.
Sodium ions, which are added to the sample by NaOH to adjust the pH, compete with ammonium for the sorption sites in the CLI. In order to show the influence of the sodium ions without additionally changing the pH value, equimolar NaCl was added. All experiments were conducted as triplicates. The titration curves of NH
4Cl solution, SW1 and SW2 are also depicted in
Appendix A.
2.3.2. Isothermal Adsorption
Since sludge water originates from the digestion tower, operated moistly at mesophilic conditions, the influence of temperature on CLI loading was investigated. For this purpose, temperatures of 307 K (34 °C, mesophilic conditions in the digestion tower, considering small heat losses), 295 K (22 °C, room temperature) and 283 K (10 °C) were tested.
Since the ammonium concentration in the sludge water could not be changed, the amount of sorbent mass
m (g) was varied instead. Thus, different quantities ranging from 2 g to 48 g sorbent were mixed with 200 mL sludge water
Vp (mL) and stirred at a constant temperature (283 K, 295 K, and 307 K) on a magnetic stirrer at 400 rpm. After 20 h, the residual ammonium concentration
ceq (mg/L) as well as the pH in the filtrate were determined. Since the pH barely varied between the different dosages and a competing adsorption by Na
+ or H
3O
+ cations as well as a dilution due to the pH adjustment was to be avoided, a pH correction was not conducted. One experimental approach without sorbent for each examined pH was used to determine unwanted ammonium elimination, e.g., by stripping or adsorption onto parts of the glass apparatus. All experiments were conducted as triplicates. The ammonium concentration in the filtrate of that approach is expressed as
cB (mg/L). The loading
qeq (mg/g) of the sorbent mass was determined by Equation (1).
2.3.3. Adsorption Kinetics
The influence of temperature (283 K–307 K; constant specific sorbent ratio of 0.1 g
CLI/mg
NH4-N; non pre-loaded CLI), the influence of the specific sorbent ratio (0.05–0.2 g CLI per mg NH
4-N; constant temperature 295 K; non pre-loaded CLI), as well as the influence of pre-load (0–11.4 mg
NH4-N/g
CLI; constant sorbent ratio 0.1 g
CLI/mg
NH4-N; constant temperature 307 K) were investigated in kinetic experiments. Furthermore, a matrix-free ammonium chloride solution (
c0 = 1000 mg/L NH
4-N) was examined as well. The sorption properties of CCP 20, including isoelectric state, pH-dependent elimination, isothermal adsorption, and thermodynamic properties were already investigated with similar matrix-free solution by Wasielewski et al. [
10].
CCP 20 was mixed with the sample (1.5 L) on a magnetic stirrer. All experiments were conducted as triplicates. At periodic intervals, an aliquot (10 mL) was taken and immediately membrane-filtered (nylon membrane, 0.45 µm pore size) to prevent further contact between sorbent (CLI) and sample (NH
4Cl solution or sludge water). Subsequently, the ammonium concentration was measured in the filtrate and the time-dependent loading of the sorbent
q(
t) (mg/g) was calculated. Since it is known from published studies that the adsorption kinetics strongly depend on the stirring speed [
21,
22,
23], a high rotation frequency of 800 rpm was chosen to determine the maximum possible adsorption kinetic values. Due to sampling during the test, the total volume was continuously reduced. However, it can be assumed that during the sampling no change in the ratio of the sorbent mass to the volume of the solution occurred due to the homogeneously mixed conditions.
2.4. Adsorption Models
2.4.1. Freundlich Model
The nonideal, reversible adsorption of a heterogenous surface is described by the empirical Freundlich model [
24]. It is not possible to calculate a complete loading, as the sorbent sites can be occupied in several layers. The loading of the sorbent
qeq,F (mg/g) can be calculated by exponentiation of the corresponding equilibrium concentration
ceq (mg/L) with the factor
1/n (–), as described by Equation (2).
Calculation methods for determining the constants
KF and
1/n with the help of nonlinear regression or linearization are given, e.g., by Ho et al. [
25]. In this study, the linearization was done by plotting log
qeq versus log
ceq. The gradient of the graph corresponds to
n, while the tenth power of the intercept represents
KF.
2.4.2. Langmuir Model
A monomolecular layer of adsorbate on the available sorption sites is assumed according to the adsorption model of Langmuir [
26]. Thus, the properties of the sorbent sites are identical and equivalent, so that a determination of the maximum adsorption capacity is possible. The loading of sorbent is calculated according to Equation (3), where
KL (L/mg) is the Langmuir constant and
qmax (mg/g) the maximum capacity.
The constants can either be deduced from linear or nonlinear regression based on measurement results. By plotting
ceq/qeq vs.
ceq,
1/qeq vs.
1/ceq,
qeq vs.
qeq/ceq, or
qeq/ceq vs.
qeq, a linear relationship for Equation (3) can be deduced [
27].
Table 3 lists the four possible linear forms for determining Langmuir constants. In this study, only the type of isotherm with the highest coefficient of determination
r² is listed. The coefficient of determination
r² of the nonlinear form of the Langmuir isotherm and the experimentally determined loads
qeq and the arithmetical average loads
were calculated according to Equation (4).
2.4.3. Temkin Model
The isothermal loading of sorbents according to Temkin ([
29] in [
30]) is extended by the temperature parameter. Accordingly, the adsorption enthalpy is linearly proportional to the loading on the sorbent [
31]. The form of the isotherm used in this work is taken from Ho et al. [
25] (Equation (5)), where
R is the universal gas constant (8.314459 J/(mol K)),
T the temperature (K),
bT (1/mol), and
AT (L/mg) the Temkin isothermal constants.
The linearized form of the Temkin isotherm is shown in Equation (6).
In a plot of ln ceq vs. qeq, the term RT/bT is represented by the slope, whereas the intersection with the ordinate represents the term RT ln(AT)/bT. Subsequently, bT and AT can be deduced.
2.4.4. Thermodynamic Calculations
Energy adsorption or release, i.e., temperature increase or decrease, can be observed during the adsorption process. The standard free energy
∆G0 (kJ/mol) can be calculated according to the following Equation (7)
where
Kd is the thermodynamic equilibrium constant, here the Freundlich constant (L/g). According to Milonjic [
32], it should be noted that
Kd must be dimensionless. Therefore, the use of the temperature-dependent equilibrium constant
KF must be corrected by a factor of 1000 g/L (density of water) into its dimensionless form. The relationship of the other thermodynamic parameters such as change in enthalpy
∆H0 (kJ/mol) and change in standard entropy
∆S0 (J/(mol K)) can be derived by means of the Gibbs–Helmholtz Equation (8).
From the plot of the logarithmic equilibrium constant Kd against the reciprocal value of the temperature 1/T (Van’t–Hoff diagram), a linear correlation can be derived. Here, the gradient corresponds to the quotient of the negative change in the free standard enthalpy ∆H0 and the universal gas constant R. Furthermore, the quotient of the change of the free molar standard entropy ∆S0 and the universal gas constant can be derived from the axis section.
Endothermic adsorption is described by a positive value of ∆H0, meaning energy is absorbed by the adsorption process. A negative value indicates exothermic adsorption, meaning energy is being released. A spontaneous (exergonic) adsorption is expressed by negative ∆G0, while negative ∆S0 indicates a random adsorption behavior.
2.5. Kinetic Models
2.5.1. Intraparticle Diffusion
A mathematical description of the diffusion process is provided by the intraparticle diffusion model (ID). It presumes a correlation between the loading rate
kID (mg/(min
0.5 g)) and the square root of the contact time
t (min) ([
33] in [
34]). However, McKay et al. [
35] extended this model by the constant
C (mg/g), which is proportional to the thickness of the boundary layer as well as the initial adsorption by it. The time-dependent loading of the sorbent
q(
t)
ID (mg/g) can be calculated by Equation (9).
To determine the loading rate kID, q(t) versus t0.5 is plotted. The slope of the resulting graph corresponds to kID while the intersection with the ordinate corresponds to C. Sole intraparticle diffusion occurs when the graph intersects the origin (C = 0). If a multistage diffusion process is present, two or more partial lines passing into each other can be approximated to the existing empirical measuring points of q(t).
2.5.2. Pseudo-Second-Order
The time-dependent loading of the sorbent can be described by the pseudo-second-order (PSO) model according to Ho and McKay [
36]. However, it is not possible to deduce the prevailing adsorption kinetic processes when using this model. It offers a macroscopic view of the adsorption process, based on the assumption that the adsorption rate is dependent on the loading of the ion exchange material at a certain point in time and its equilibrium state. The differential form of the PSO, i.e., as the differential of the load
q(
t) (mg/g) at any time
t, is given in Equation (10)
where
k2 is the pseudo-second-order rate (mg/(g min)) and
qe (mg/g) the load at equilibrium. From the integration of Equation (10) with the boundary conditions
q(
t) = 0 at
t = 0 and
q(
t) =
q(
t) at
t =
t, four different linear forms of the PSO model can be obtained (
Table 4).
In this study, only the type with the highest coefficient of determination r2 (Equation (4)) is listed. All calculations in this study were conducted using Microsoft Excel 2019.
2.6. Analytical Methods
Ammonium was measured according to German standard DIN 38406-5 [
38]. At a pH of about 12.6, ammonium cations and ammonia contained in the sample react with hypochlorite ions and salicylate ions in the presence of sodium pentacyanonitrosylferrate (2-)(nitroprusside sodium) as a catalyst to form a blue dye. The required hypochlorite ions are formed in the alkaline medium by hydrolysis of the dichloroisocyanuric acid ions. The spectral absorbance of the blue dye at 655 nm wavelength is linearly proportional to the ammonium concentration.
For determination of pH, probes (SenTix 950 + Multi 3430, WTW, Weilheim, Germany) were used.
F
-, Cl
-, NO
2-N, NO
3-N, Br
-, SO
42-, and PO
4-P were analyzed according to ISO 10304-1 [
39] using the Dionec ICS-110 ion chromatograph (Thermo Fischer Scientific, Waltham, MA USA). Before the determination, the sample was filtered through a C18 cartridge (Strata C18-E (55 µm, 70 Å), Phenomenex, Torrance, USA) and diluted if necessary.
To determine the elementary composition of the sludge waters, 44 mL of sample were admixed with 2 mL HCl (32%), 3 mL HNO3 (65%), 1 mL H2O2 (30%) and digested by a microwave (Start, MLS GmbH, Leutkirch, Germany) with a selected program run of 10 min at 443 K and a subsequent cooling phase of 20 min.
To determine the chemical elements of the zeolite, 0.3 to 0.5 g of the CLI were weighed and mixed with 6 mL HNO3 (65%), 4 mL HF (48%), and 2 mL HCl (32%). The mixture was digested by microwave with a selected program run of 10 min at 383 K, then 5 min at 413 K, and finally 9 min at 463 K. Together with the cooling phase, the digestion lasted 64 min.
Heavy metals were analyzed by inductively coupled plasma mass spectrometry (Nexion 2000, Perkin Elmer, Waltham, MA, USA).
3. Results and Discussion
3.1. Isoelectric State of CLI and pH-Dependent Adsorption
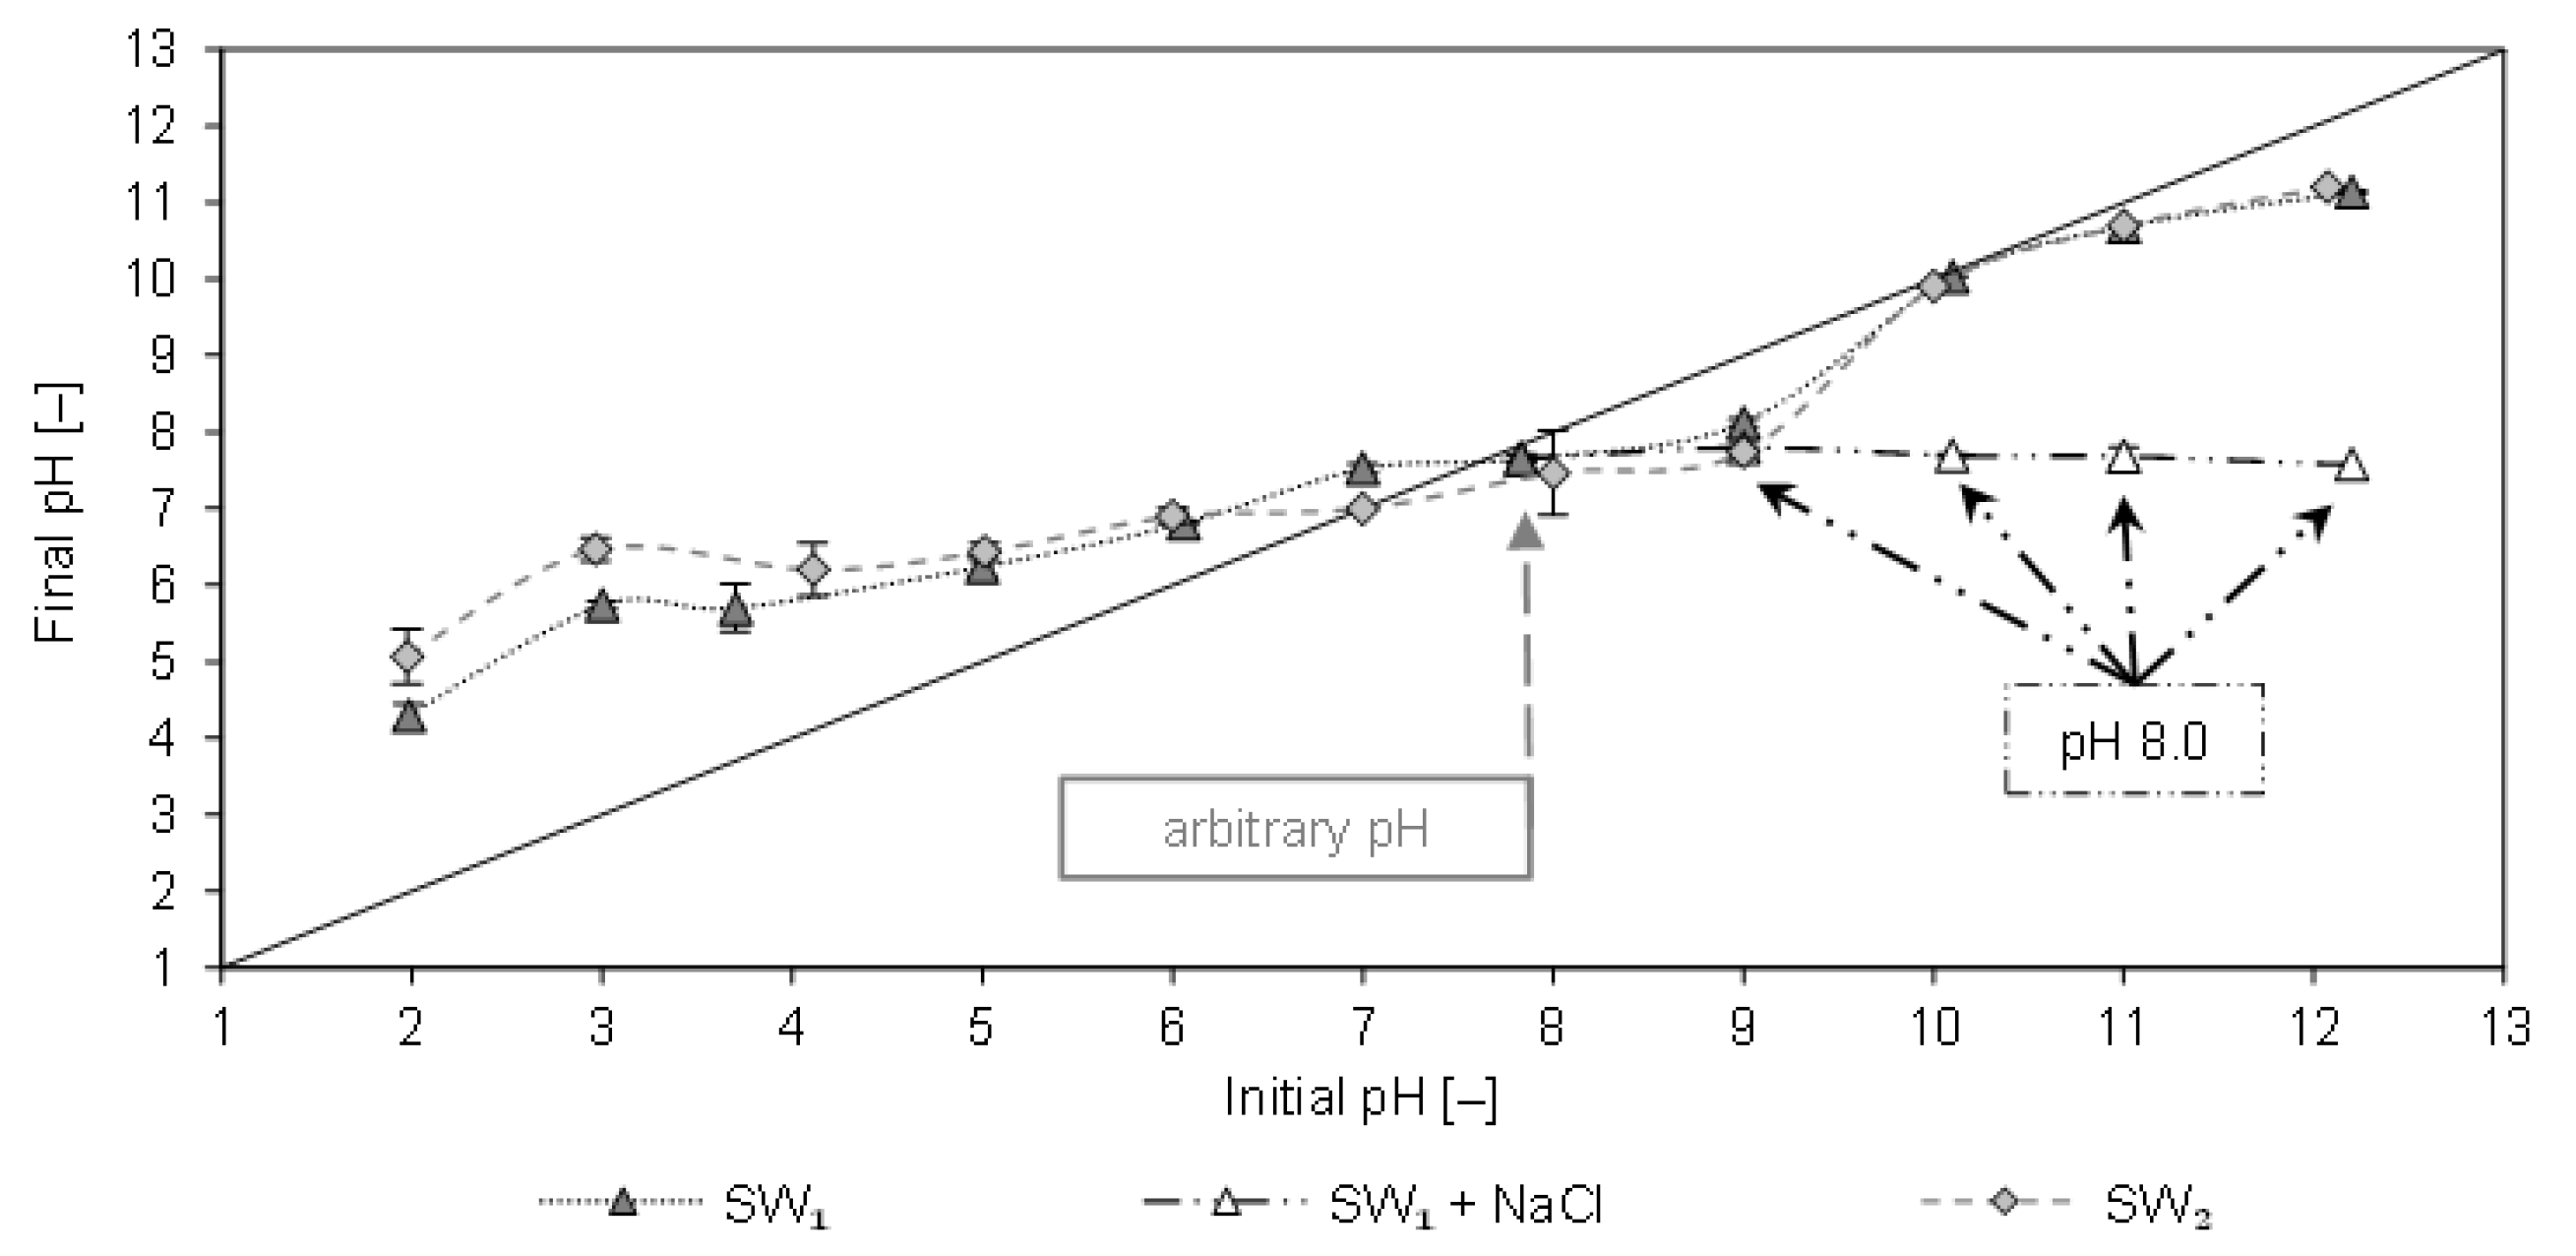
In
Figure 1 the final pH of SW1 and SW2 filtrates are plotted as a function of the initial pH after contact with CCP 20. The arbitrary pH value of SW1 was 7.9 and that of SW2 was 8.0. In the alkaline range, no considerable change in the pH was observed. This can be attributed to the decrease in ammonium uptake, as uncharged NH
3 is formed at pH >8, which is not adsorbed by the CCP 20. As a result, no cations are eluted that could lead to a change in the pH.
The pH increased in the acidic range (2–6), which can be attributed to the removal of NH
4+ and the elution of cations (e.g., Na
+, K
+, Ca
2+, and Mg
2+). The isoelectric state (pH
ISO) of CCP 20 with both sludge waters occurred at pH values of 8 and 10. The same values of pH
ISO were also determined after contact of CCP 20 with matrix-free NH
4Cl solution [
10]. Hence, an influence of the sludge water matrix on the pH
ISO is not detectable. Furthermore,
Figure 1 shows the pH after spiking SW1 with equimolar NaCl instead of NaOH; the latter was added to the sample to adjust the pH. When spiked with NaCl (23–168 mmol/L), the pH remained at approx. 8.
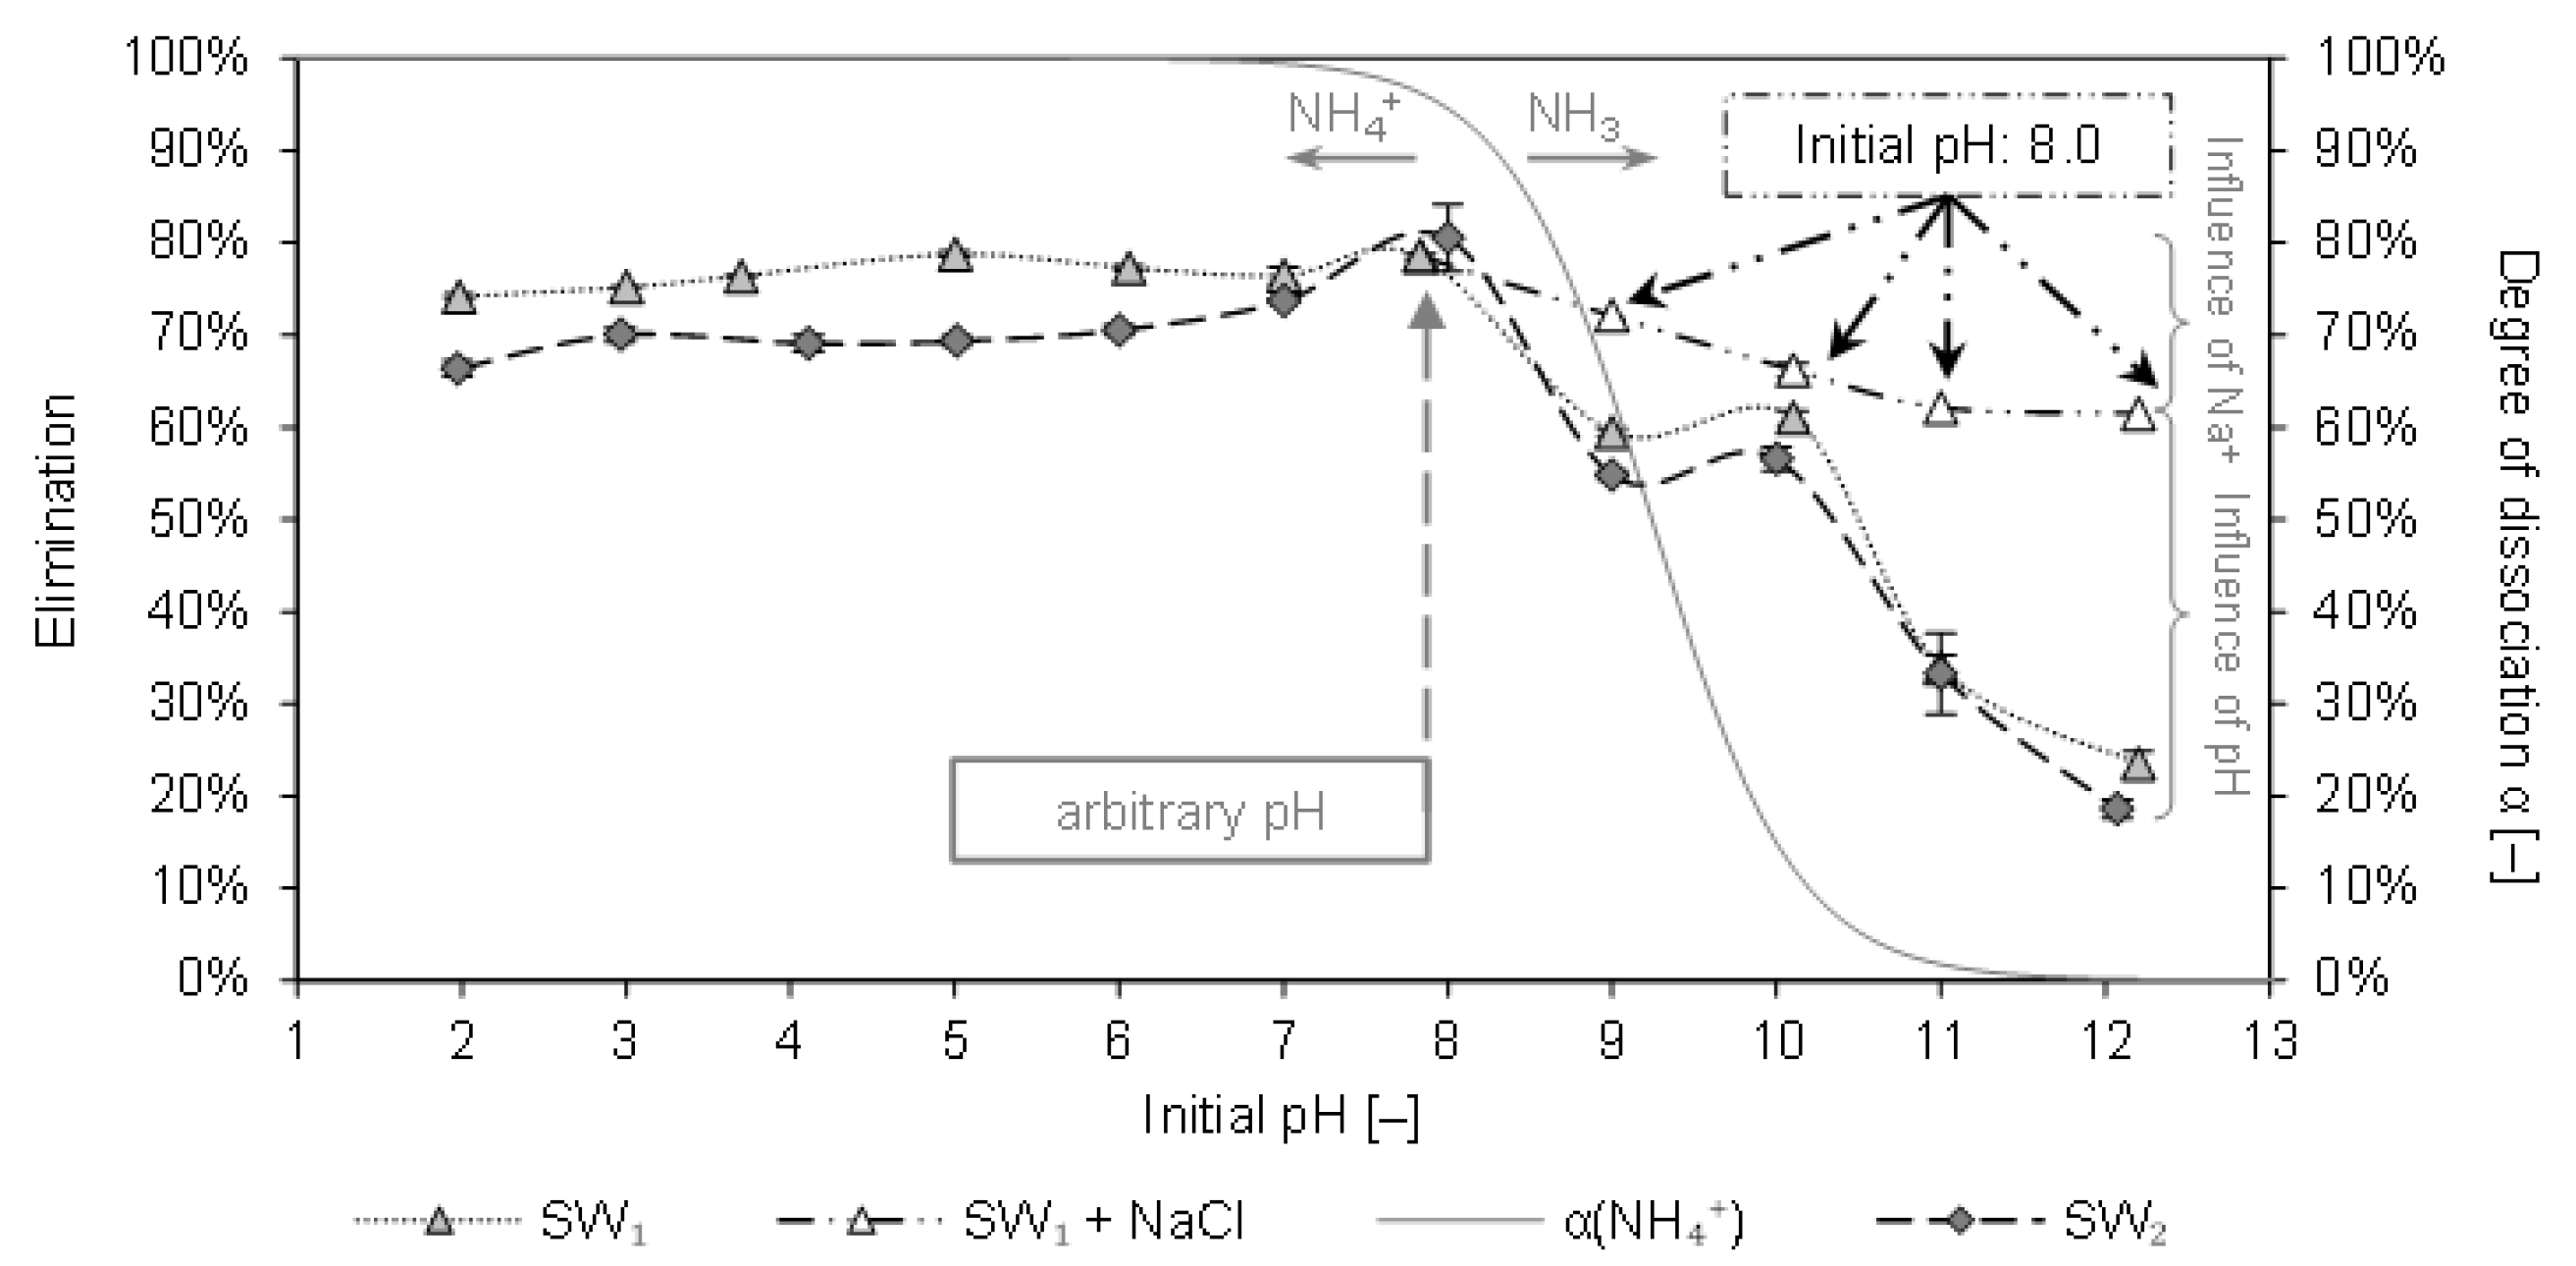
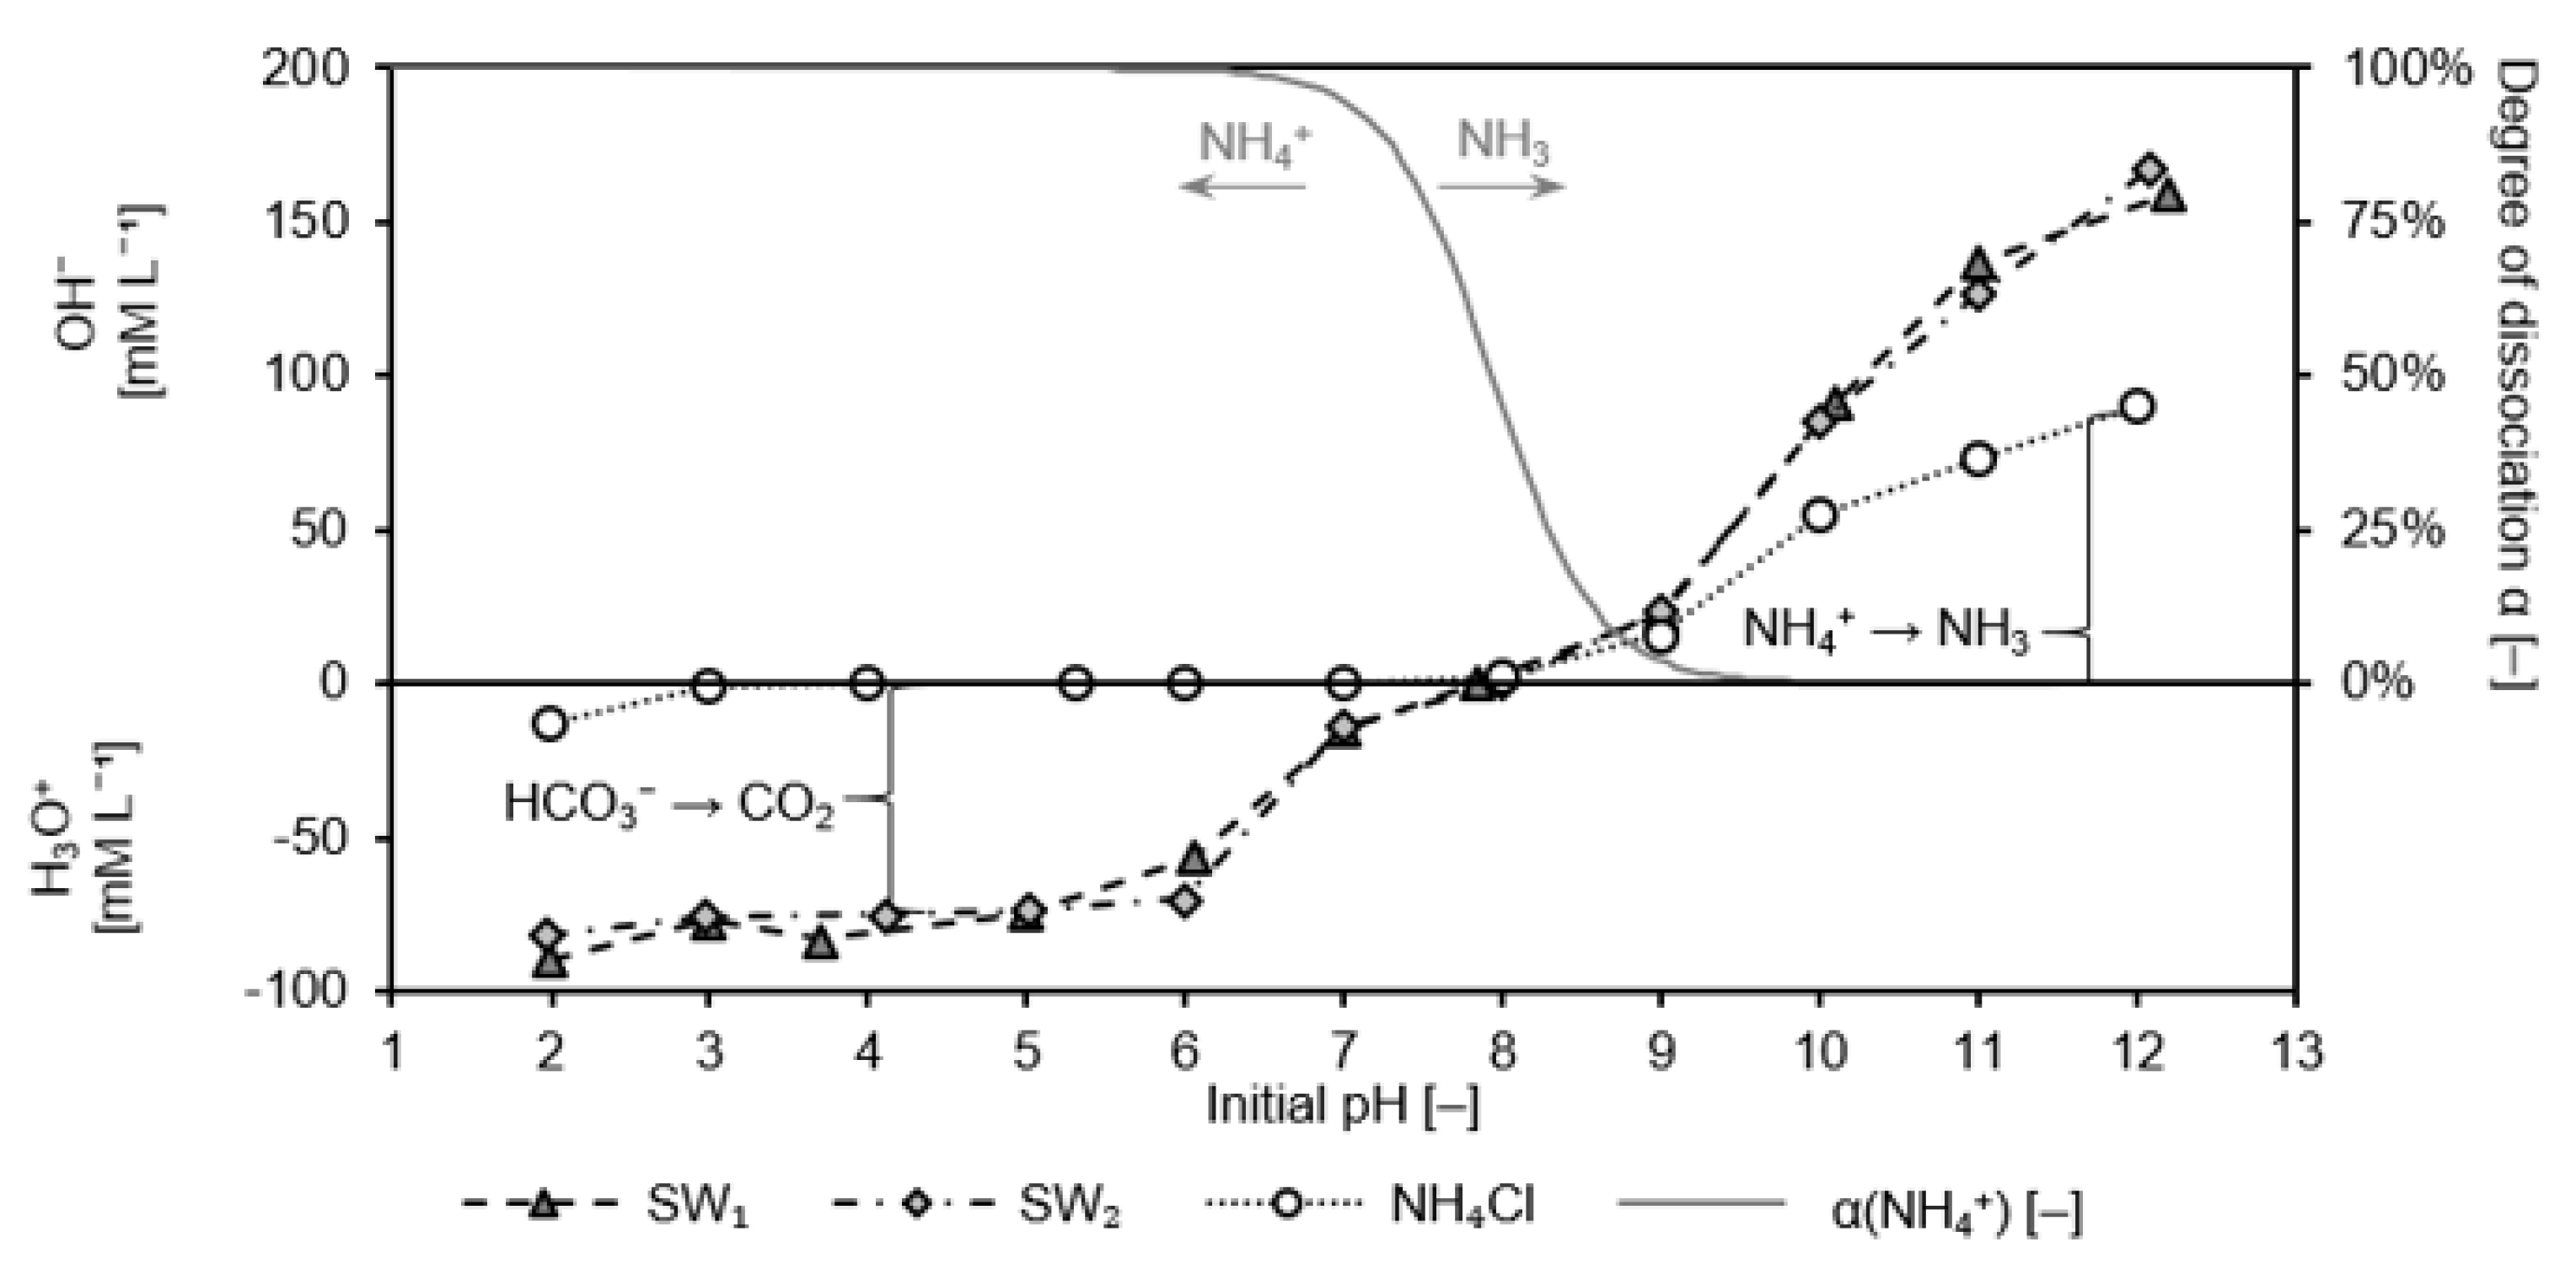
Figure 2 depicts the elimination of ammonium from SW1 and SW2 by CCP 20 as a function of the initial pH. Furthermore, the degree of dissociation α of the NH
4+/NH
3 system is plotted over the initial pH.
In the pH-range from 2 to 8 a consistent elimination between 66% and 81% was determined. A decrease in the elimination could be observed with pH values above 8. For SW1, the elimination decreased from 79% at pH 8 to 58% at pH 9 (59% at pH 10) and dropped to 24% at pH 12.2. At the same pH, the elimination from SW2 decreased from 81% to 55% (57% at pH 10) and finally to 19% (at pH 12). The batches with NaCl instead of NaOH indicate that the influence of sodium ions competing for sorption sites on the elimination is inferior to the influence of the pH. Although the elimination already declined from 79% to 62% due to the addition of Na+ (from NaCl), the equimolar amount of NaOH, which increased the pH to 12.2, led to an even lower elimination of only 24%.
When comparing these results with results from similar experiments with matrix-free solution (pH 9: 73% elimination; pH 12.2: 20% elimination [
10]), only a slightly negative influence of the SW matrix becomes apparent.
Table 2 shows that both SW1 and SW2 had constituents (e. g., K
+, Na
+) that compete with ammonium for adsorption sites
Comparable studies with leachate have reported an elimination of 68% at pH 7 [
22]. At pH 7 a higher loading (
q = 17.7 mg/g) was achieved from swine liquid manure as compared to the arbitrary pH 8.2 (
q = 12.5 mg/g) [
17]. Furthermore, investigations with artificial swine wastewater stated that most ammonium was removed at pH 7, also showing a strong decrease in sorption with increasing pH [
39]. On the contrary, the sorption of ammonium from drinking water was not affected by pH in the range of 5–9 [
40].
The results here reveal that at a pH of 7, ammonium is eliminated to a high degree. In contrast to the literature results, a high degree of elimination could be realized with CCP 20 at arbitrary pH (7.9 or 8.0). A higher pH, however, should be avoided.
3.2. Isothermal Adsorption
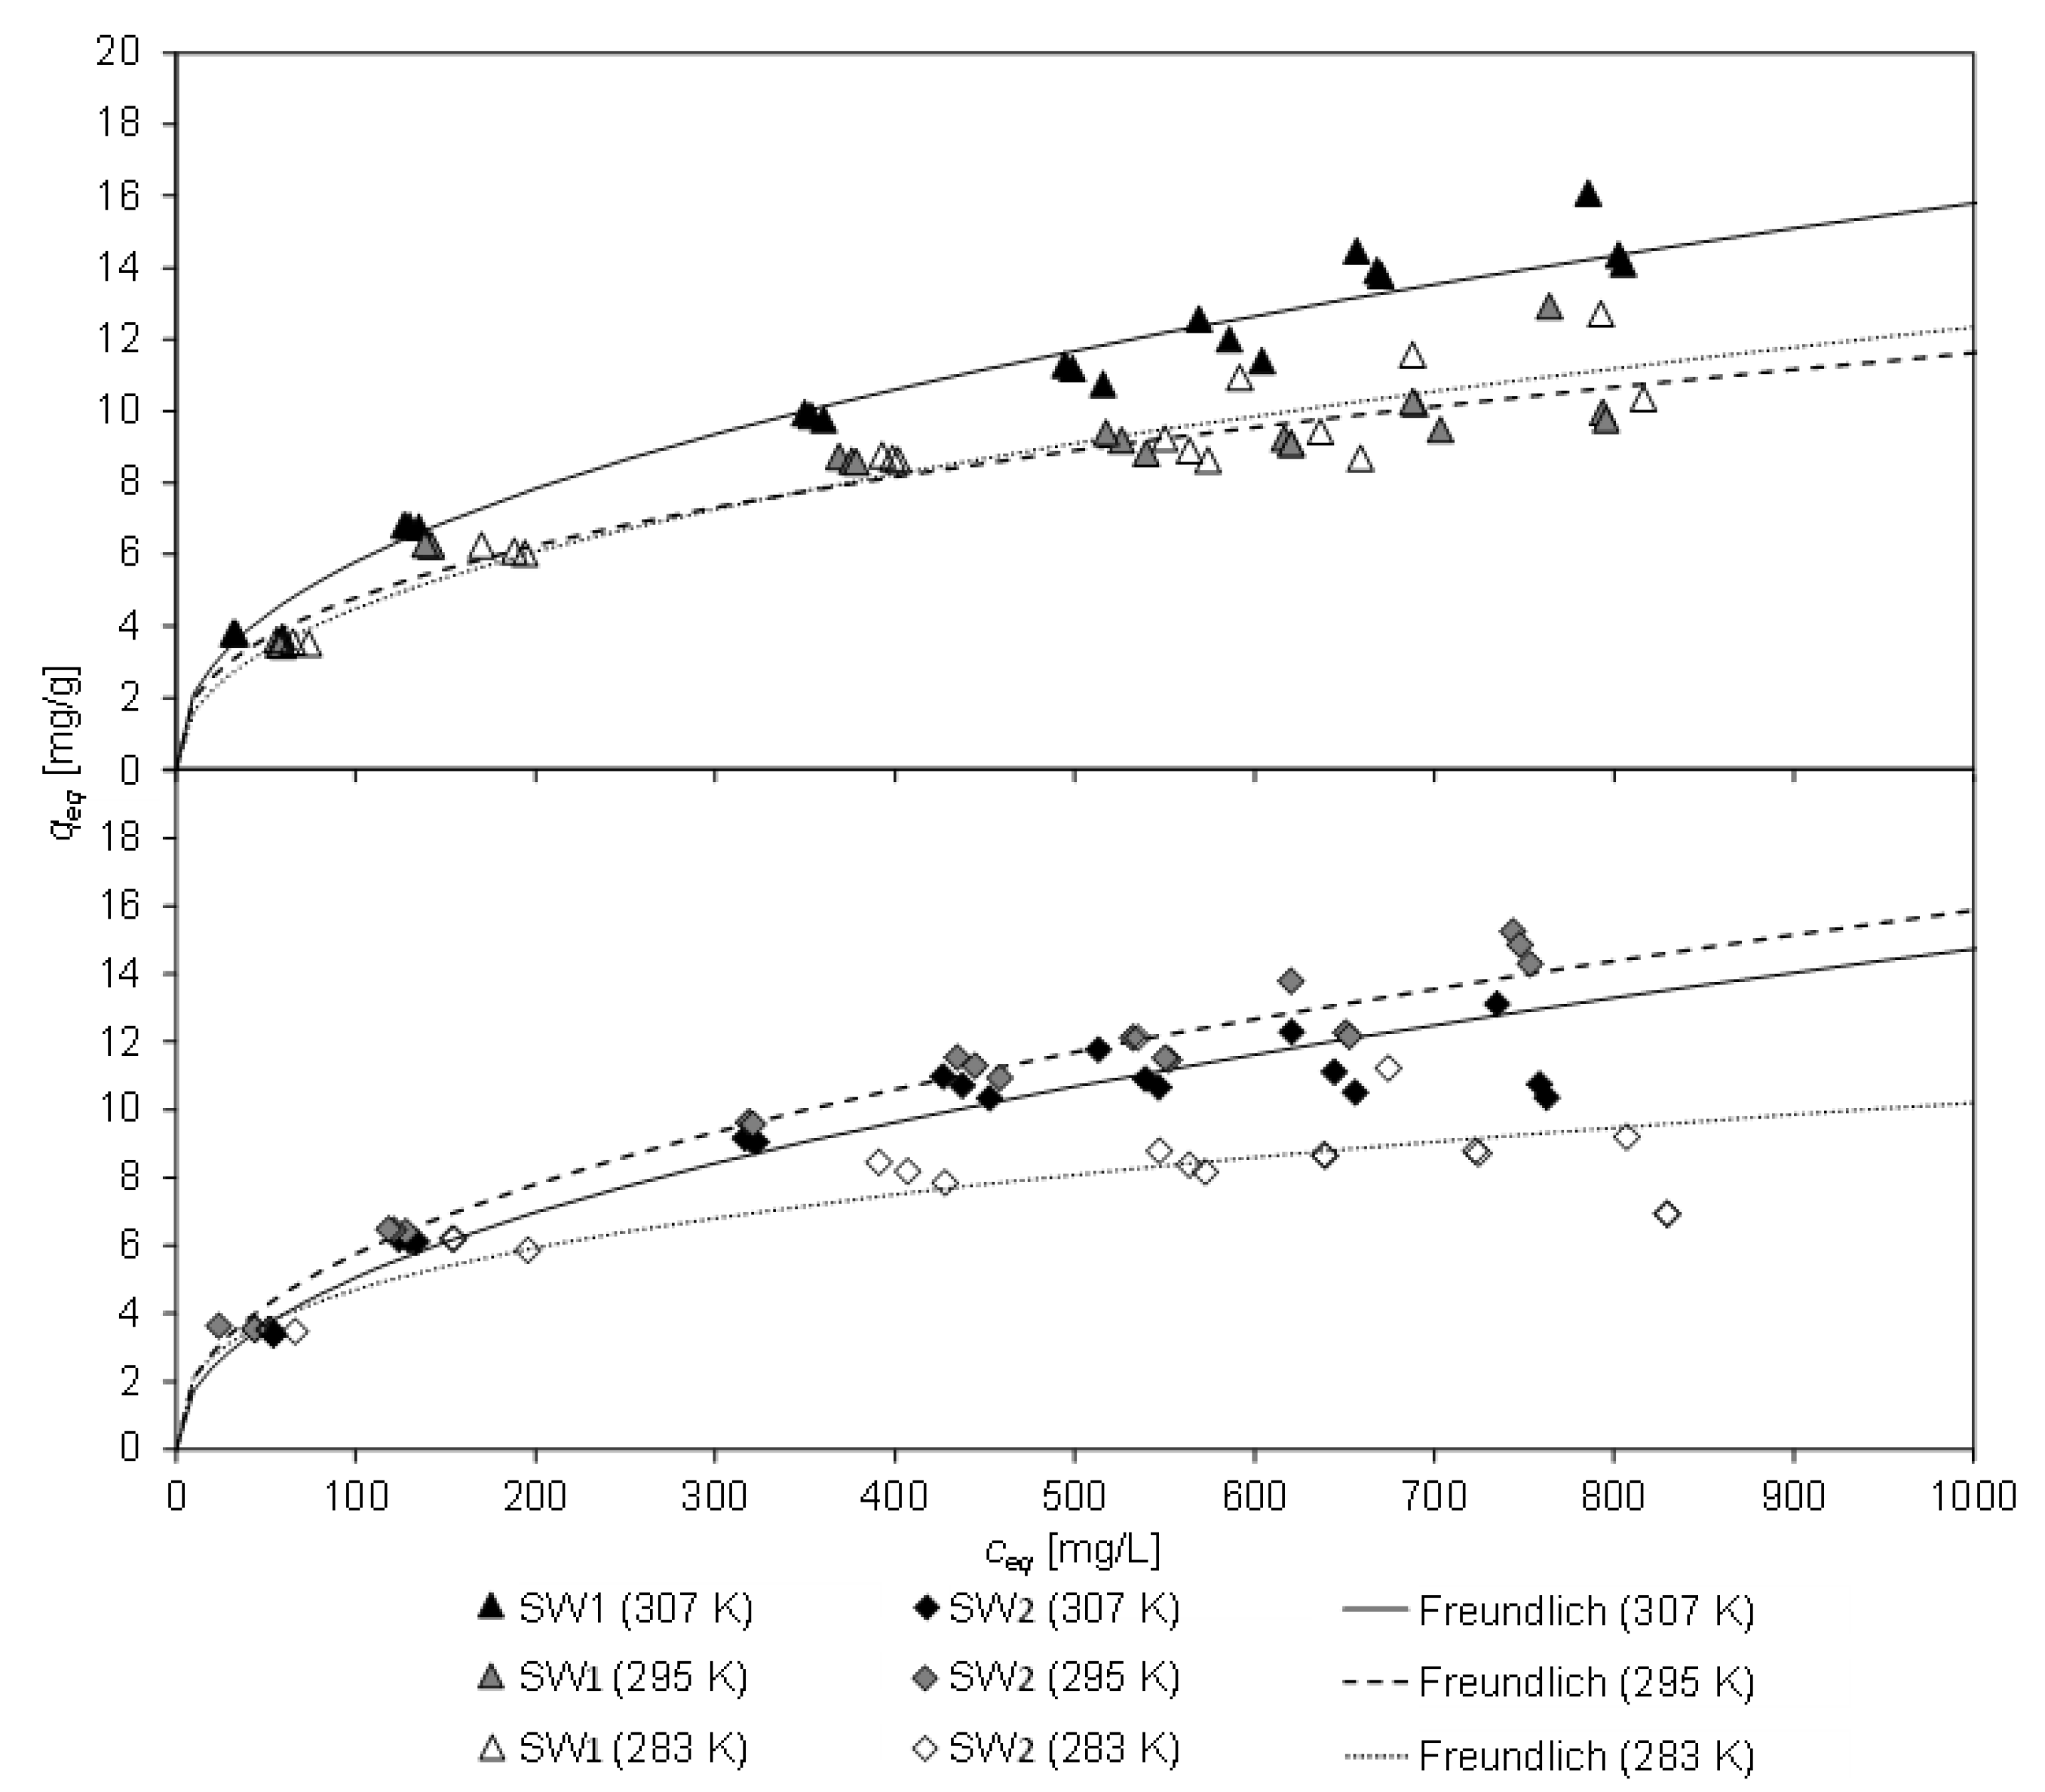
Figure 3 displays the equilibrium loading
qeq of CCP 20 and the corresponding equilibrium concentration
ceq after 20 h contact time with SW1 and SW2 at different temperatures (283 K, 295 K, and 307 K). The lines represent the Freundlich equation, which gained the highest degree of determination of all tested isothermal equations (Freundlich, Langmuir, Temkin). The coefficients of the isothermal equations and their coefficient of determination are listed in
Table 5. From the high concordance with the Freundlich isotherm, it can be deduced, that CLI has a heterogeneous surface, resulting in non-ideal sorption. Furthermore, the sorption process from sludge water is non-ideal, e.g., possible multiple occupancy of a sorption site as well as not all sorption sites are occupied.
The pH of the filtrate of SW1 (initial pH 8.1) changed independently to values between 7.6 and 8.6 during contact, and to 7.2 to 8.0 for SW2 (initial pH 7.9), whereby the former occurred with low sorbent masses and the latter was determined in a blind test without sorbent. As a result, the pH value dropped slightly due to the sorption process.
The highest equilibrium load of CCP 20 with ammonium from SW1 was 16.1 mg/g at 307 K. However, this was considerably lower by 13% than observed for matrix-free solution (NH
4Cl) with a similar concentration of 1000 mg/L NH
4-N (
qeq = 18.8 mg/g [
10]). For SW2, the highest equilibrium load was 15.3 mg/g at 295 K (18% lower than for matrix-free solution). The load was lower at 307 K, but this was probably due to an alteration in the ammonium concentration in SW2 between the tests.
The minor loading of CCP 20 compared to matrix-free solution could be ascribed to the constituents in the sludge water, which interfere with the sorption process and thus lead to a reduction of the adsorption capacity. In particular, the deeper sorption sites in the framework of the CLI are probably more difficult to access. Access pores may be blocked or sorption sites may be occupied by other constituents in the sludge water. Furthermore, blocking of zeolite pores could be caused e.g., by solids. In addition, the viscosity of the sludge water changes depending on the temperature, which could also influence the loading of the CLI.
A decrease in the adsorption capacity of zeolite due to the wastewater matrix has been reported in several publications [
16,
17]. By using swine manure (
c0 = 7700 mg/L NH
4+) instead of NH
4Cl solution (
c0 = 7700 mg/L NH
4+), the uptake capacity of the tested CLI decreased from 10 mg/g to 2 mg/g [
17]. To a similar extent as was found in this paper, a decrease of 10–20% of the adsorption capacity when using leachate from a sewage sludge landfill (
c0 = 115.16 mg/L NH
4-N) instead of NH
4Cl solution (
c0 = 119.48 mg/L NH
4-N) was reported [
16]. The authors attributed this to ions such as Na
+, K
+, Mg
2+, and Ca
2+ with ion ratios of ammonium to potassium of [NH
4+]/[K
+] ≈ 14.6 and sodium of [NH
4+]/[Na
+] ≈ 2.7 in the leachate. However, in both sludge waters investigated ammonium was present in multiple excess (SW1: [NH
4+]/[K
+] ≈ 12; [NH
4+]/[Na
+] ≈ 13; SW2: [NH
4+]/[K
+] ≈ 24–30; [NH
4+]/[Na
+] ≈ 10–12) and thus ammonium dominated the sorption process.
The determined ion ratio of ammonium to potassium and sodium in SW1 and SW2 was higher than reported by Wang et al. [
16], but the difference in load between sludge water and matrix-free solution [
10] was within the same magnitude. Obviously, the capacity of CCP 20 is influenced by both, the cations contained in the sludge water and by the matrix of the sludge water.
3.3. Thermodynamic Properties
Table 6 lists the determined thermodynamic state variables free reactivity enthalpy
ΔG0, free standard enthalpy
ΔH0, and molar standard entropy
ΔS0 after 20 h contact time of CCP 20 with SW1 and SW2.
In the examined temperature range (283–307 K), an exergonic, i.e., voluntary sorption process of ammonium to CLI, can be deduced from to the negative free reaction enthalpy ΔG0. The free standard enthalpy ΔH0 was positive for SW1, i.e., an endothermic reaction was present. In contrast to this, an exothermic reaction was observed for SW2. The positive molar standard entropy ΔS0 indicates a directed process. Independent of the matrix, the reaction of ammonium with CLI is voluntary and directed.
From experiments with CLI and matrix-free solution, an exergonic reaction was also reported with
ΔG0 ranging from −2.8662 to 0.22 kJ/mol [
41], −0.79 to 1.63 kJ/mol [
42], and −0.22 to 1.60 kJ/mol [
43]. In this study, the values of
ΔG0 ranged from −15 to −17 kJ/mol. The much lower values regarding
ΔG0 of this study can be attributed to the smaller particle size and therefore short diffusion pathways of cations into the CLI. For their experiments, Alshameri et al. [
41], Gunay [
42], and Karadag et al. [
43] used zeolites with larger particle sizes such as 0.063–0.074 mm, 0.3–0.6 mm, and 1.0–1.4 mm.
On the contrary to the results published by other researchers (
ΔH0: −49.384, −22.34, −5.43, −15.38 kJ/mol [
41,
42,
43,
44]), which indicate that adsorption of ammonium is exothermic, a slightly endothermic adsorption from SW1 (
ΔH0: 8.5 kJ/mol (SW1)) was found. However, adsorption from SW2 was exothermic (
ΔH0: −15.5 kJ/mol).
Furthermore, results reported with negative values of
ΔS0 (−0.1561, −43.03, −49.34, −74.42 kJ/(mol K) [
41,
42,
43,
44]) indicate decreasing ammonium uptake due to increasing randomness. In contrast to this, a strongly directed adsorption process, as indicated by positive
ΔS0 values ranging between 2.6 J/(K mol)
−1 (SW2) and 84.3 J/(K mol)
−1 (SW1), was achieved.
3.4. Kinetic Studies
3.4.1. Influence of Temperature on Kinetics
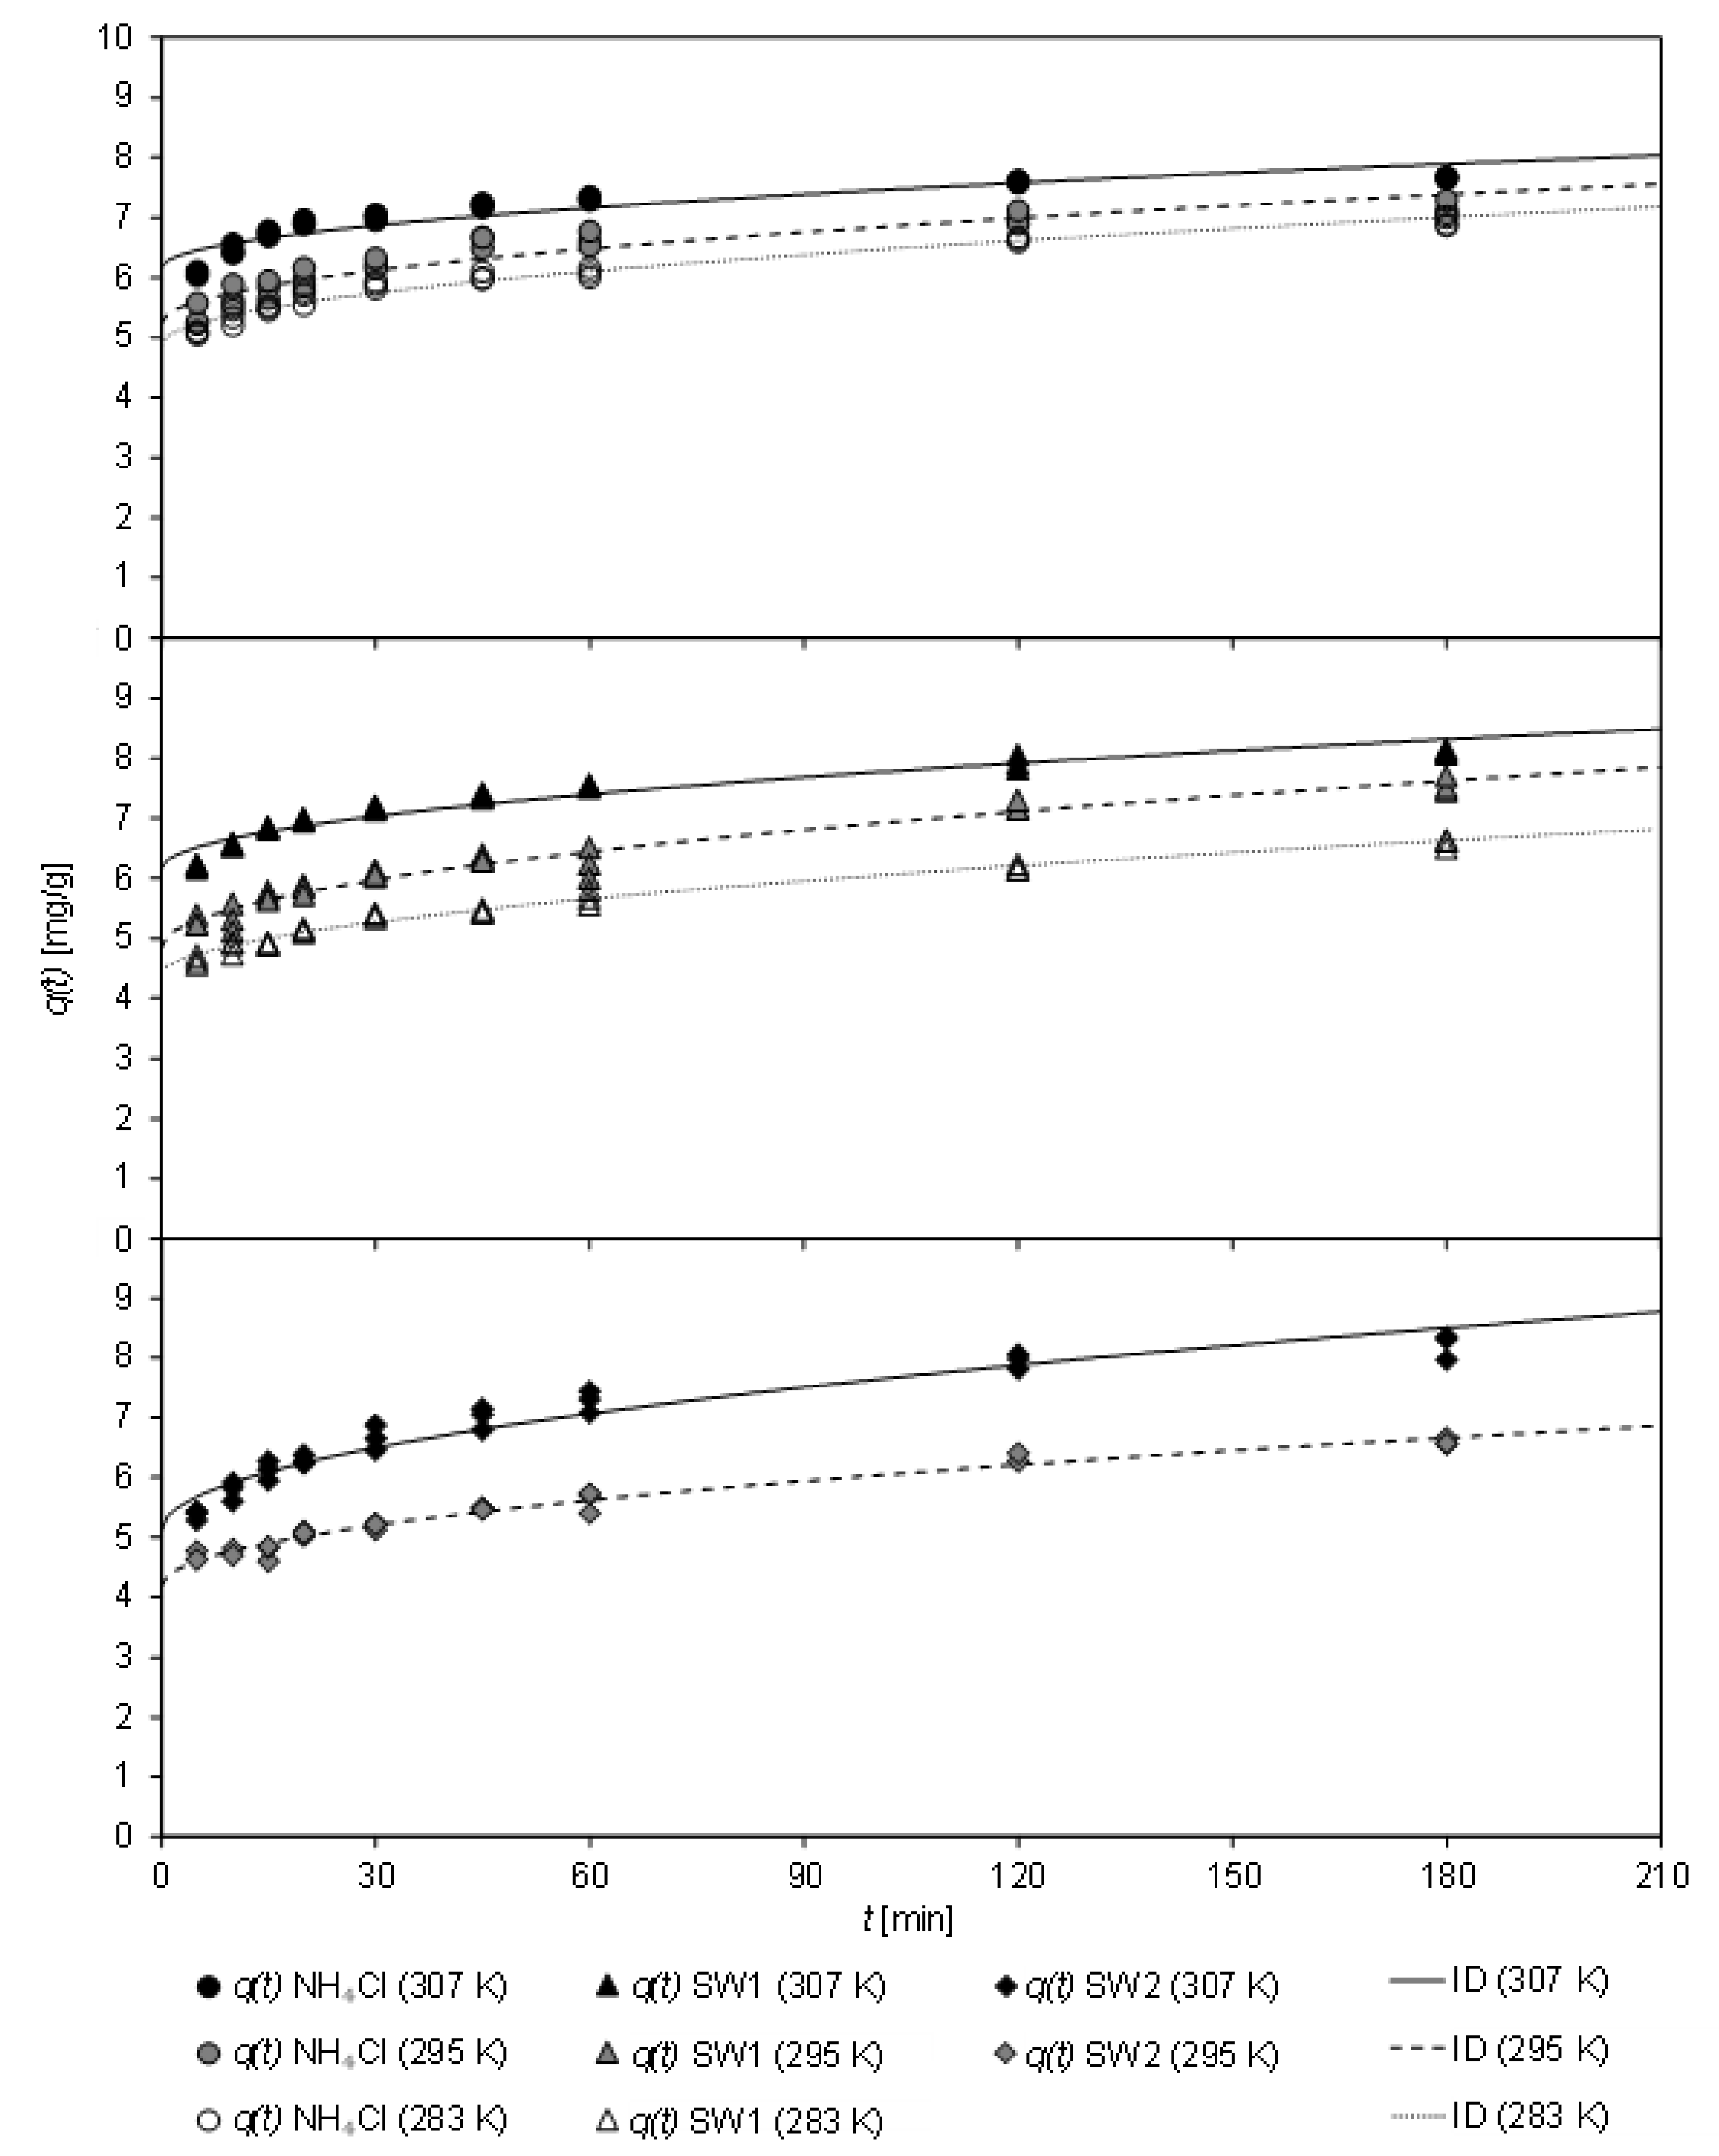
In
Figure 4, the loading of CCP 20 with ammonium from sludge water at various temperatures (283 K to 307 K) after different contact times (up to 180 min) is depicted. The sorption kinetics at the investigated temperatures are fit to the ID model.
Over the entire temperature range, a rapid adsorption of ammonium by CCP 20 was observed. Within the first five minutes, a high loading occurred, independently of the sludge water matrix.
Table 7 shows the coefficients of the kinetic fit according to both, PSO and ID model, the latter of which achieved a higher coefficient of determination.
From the PSO model, an increase of k2 from 0.065 g/(mg min) to 0.090 g/(mg min) could be derived with increasing temperature of the matrix-free NH4Cl solution. For SW1, k2 first decreased with increasing temperature from 0.056 g/(mg min) (at 283 K) to 0.043 g/(mg min) (295 K), but then increased to 0.070 g/(mg min) (307 K). With SW2, k2 remained almost unchanged with 0.041 g/(mg min) (at 295 K) and 0.037 g/(mg min) (at 307 K). Thus, the sludge-water matrix caused a reduction of the sorption rate k2. Temperature only had a minor effect on the sorption rate in the range of 283–295 K. The equilibrium load qe was similar for all samples, with a higher value for qe being obtained with increasing temperature.
For all three matrices, an increase in the initial sorption C was observed with increasing temperature, whereas the sorption rate kID was only slightly affected. In the case of the matrix-free solution, kID decreased from 0.159 mg/(min0.5 g) at 283 K to 0.129 mg/(min0.5 g) at 307 K. In contrast, kID increased slightly with SW1 between 283 K and 295 K. This low coefficient of determination of the sorption kinetics at 283 K indicates that no ID was present at low temperatures. Nevertheless, it was also shown that the kinetics at 295 K slowed down. Here, kID decreased from 0.208 mg/(min0.5 g) to 0.161 mg/(min0.5 g).
Regardless of the sorption kinetics, it should be recognized that ammonium uptake was mainly affected by initial sorption, which in turn was greater at higher temperatures. After the CCP 20 was in contact with the matrix-free solution or sludge waters for 30 min at 307 K, a load between 6.88 mg/g (SW2) and 7.15 mg/g (SW1) was determined.
Similar conclusions regarding a decrease of the sorption rate as a result of an increase in temperature were described according to the PSO model (NH
4Cl solution) [
43]. Furthermore, it was concluded that this was an exothermic process, which was slower due to increased temperatures. On the other hand, it was found that
k2 was reduced and
kID increased due to increased temperature [
23]. Consequently, the equilibrium was reached later. However, the values reported by Erdoğan and Ülkü [
23] for
kID with 4.8 10
−3 mg/(min
0.5 g) at 298 K and 5.4 10
−3 mg/(min
0.5 g) at 313 K were about a factor of 30 lower than the values obtained with CCP 20. This is probably ascribed to the larger particle sizes of the CLI (0.85–2.00 mm [
23]) investigated.
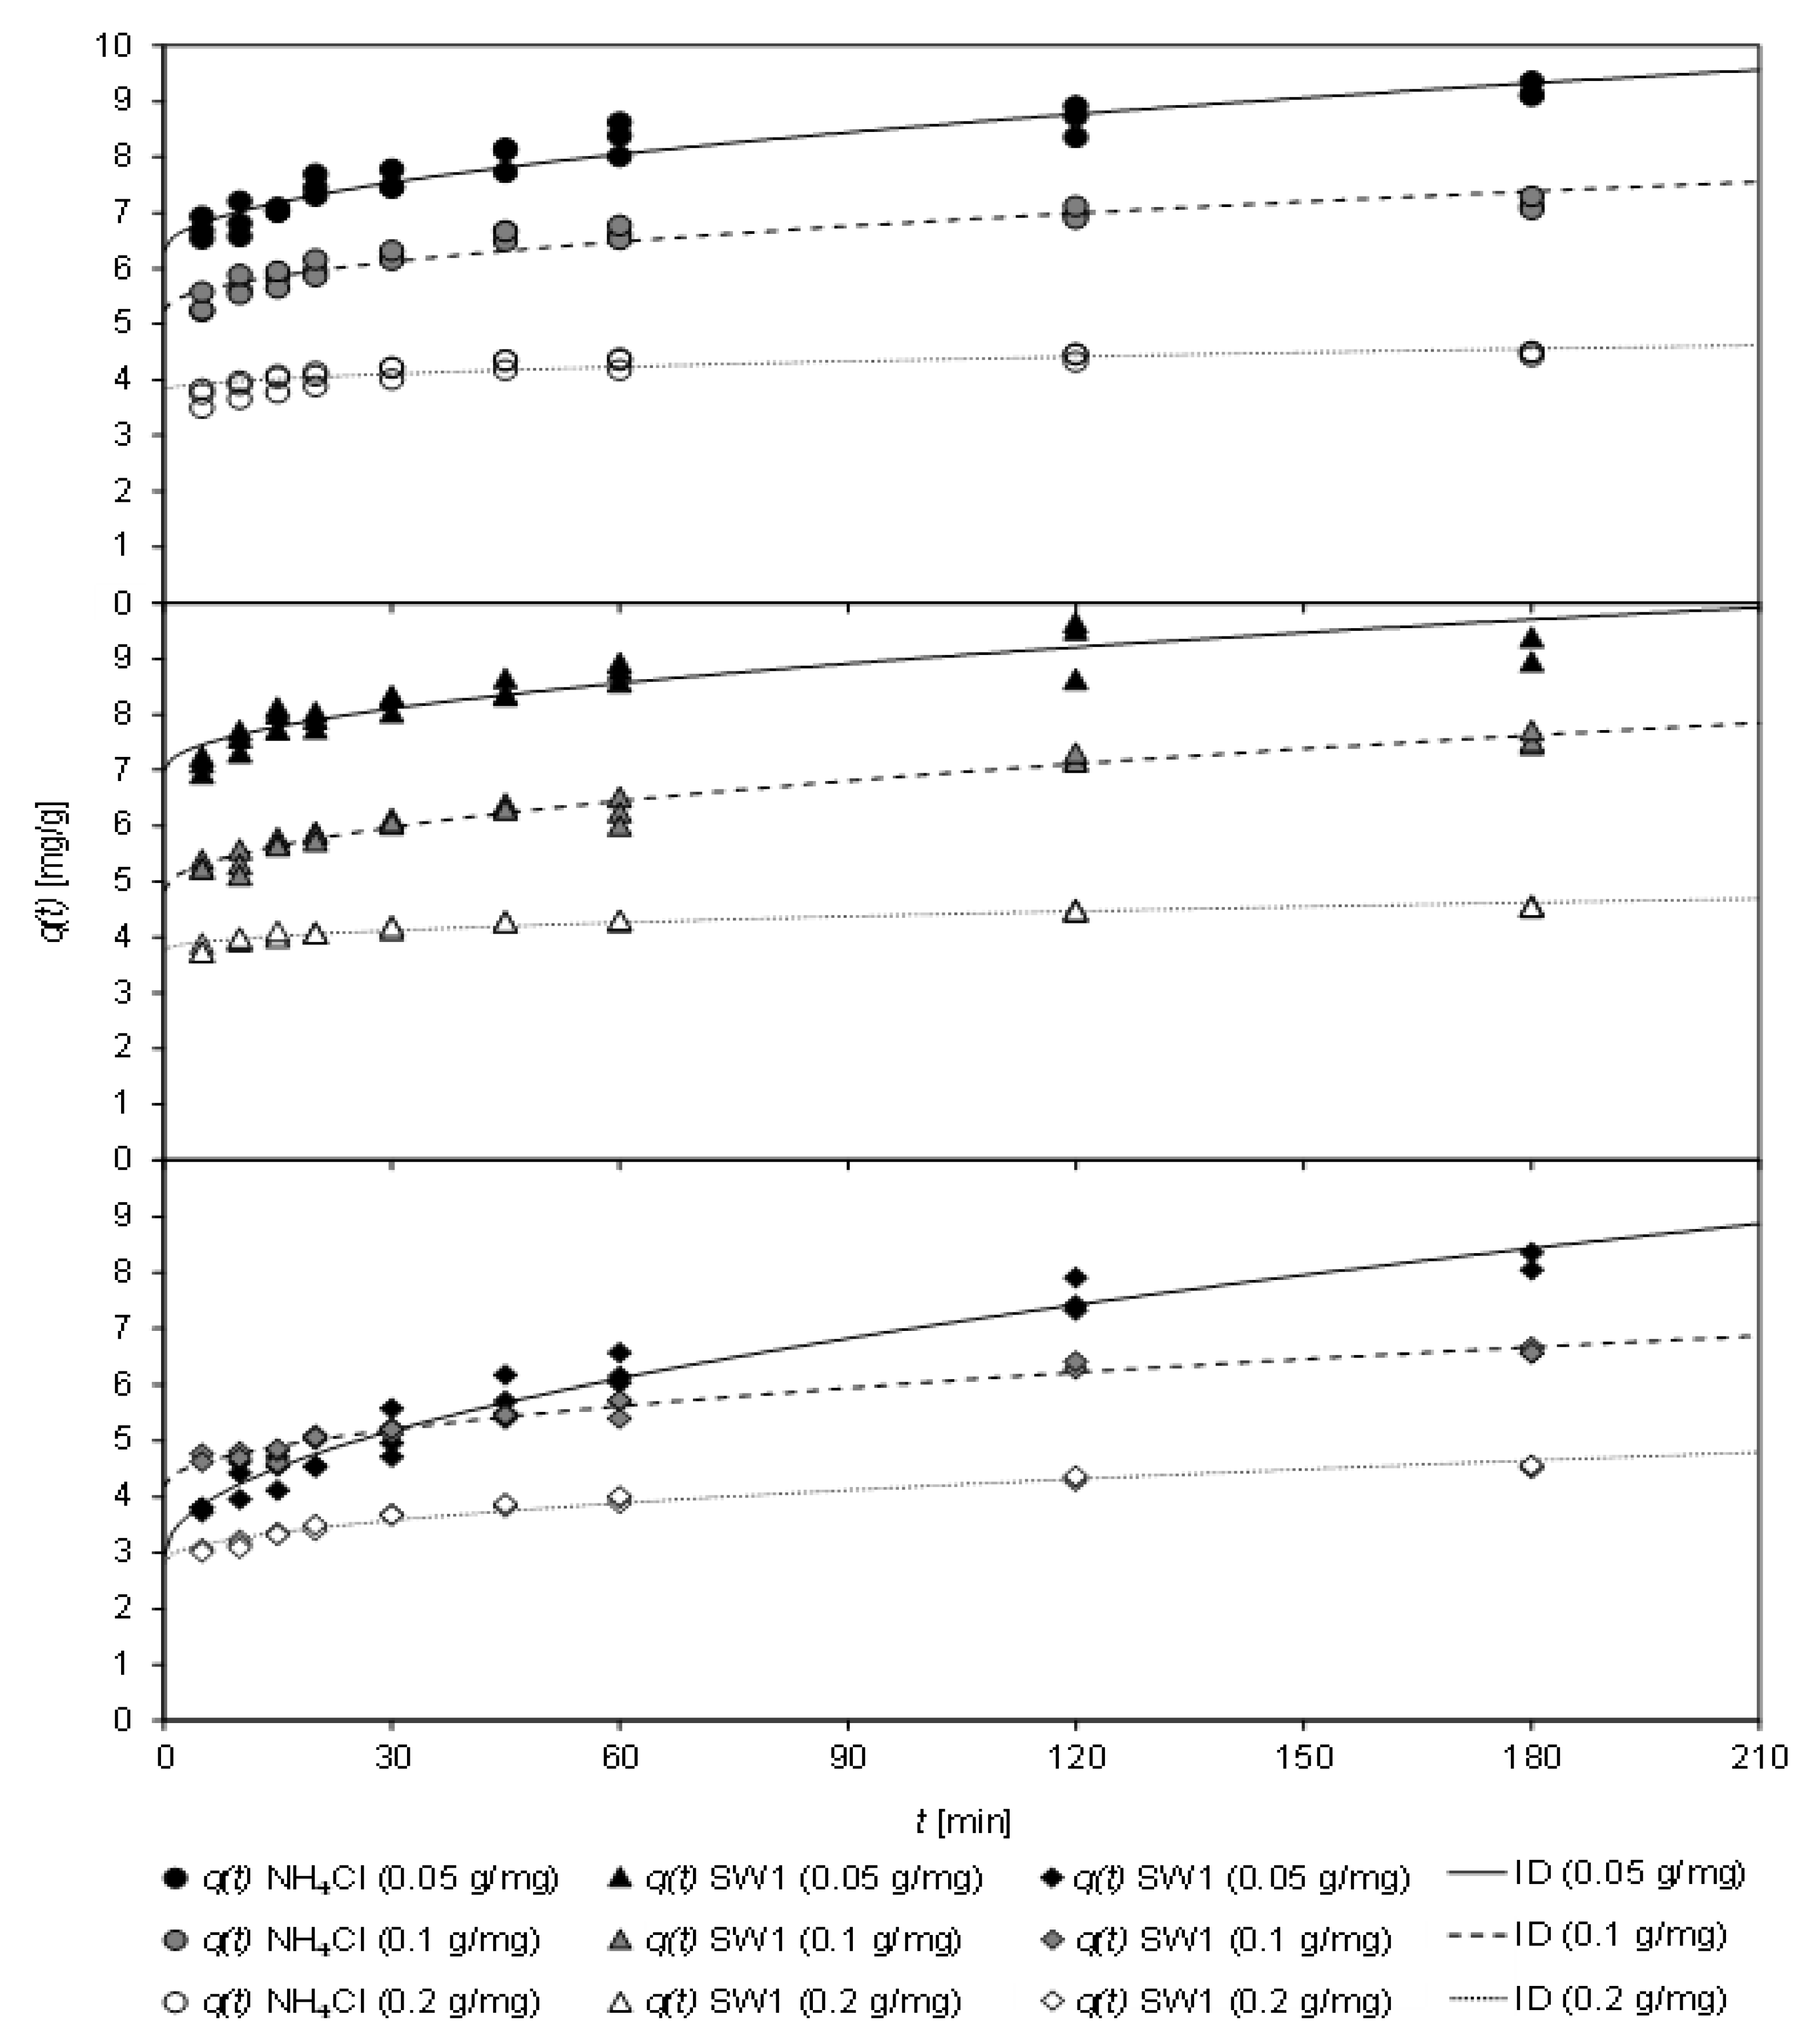
3.4.2. Influence of the Specific Dosage on Kinetics
Figure 5 displays the loading
q(
t) as a function of the contact time
t of CCP 20 at different specific sorbent dosages (0.05–0.2 g
CLI/mg
NH4N) after contact with NH
4Cl solution as well as SW1 and SW2. In addition, the fit of the ID model, which had gained the highest coefficient of determination, is shown. A load between 3.07 mg/g and 7.25 mg/g was realized after only 5 min, regardless of the matrix. After 30 min contact time, depending on the specific sorbent addition (0.05–0.2 g
CLI/mg
NH4N), a loading of between 4.15 mg/g and 7.56 mg/g was obtained with the NH
4Cl solution. However, after 60 min, the load increased to values between 4.30 mg/g and 8.34 mg/g and after 120 min to between 4.41 mg/g and 8.66 mg/g.
Table 8 displays the coefficients of the sorption kinetics according to the PSO model and the ID model. The high coefficients of determination of the ID model indicate the limitation of the sorption rate by intraparticle diffusion.
The coefficients of the PSO model and the ID model indicate that the sorbent dosage has a decisive influence on the rate of ammonium uptake. In the investigated samples, k2 increased with increasing sorbent dosage, i.e., the sorption equilibrium was achieved earlier. With the lowest specific sorbent dosage of 0.05 gCLI/mgNH4-N, k2 was between 0.008 g/(mg min) (SW2) and 0.048 g/(mg min) (SW1) and rose disproportionately with a specific dosage of 0.2 gCLI/mgNH4-N to 0.062 g/(mg min) (SW2), 0.154 g/(mg min) (NH4Cl) or even up to 0.188 g/(mg min) (SW1). In contrast, the load qe decreased from 9.26 mg/g (SW2) to 4.35 mg/g (SW1) with increasing sorbent dosage. The values for kID became smaller with increasing sorbent loading, i.e., the sorption equilibrium was achieved earlier. Thus, kID values of 0.410 mg/(min0.5 g) (SW2), 0.202 mg/(min0.5 g) (SW1), and 0.225 mg/(min0.5 g) (NH4Cl) where reached at a dosage of 0.05 gCLI/mgNH4-N, which then decreased to 0.135 mg/(min0.5 g) (SW2) and 0.063 mg/(min0.5 g) (SW1) and 0.058 mg/(min0.5 g) (NH4Cl), respectively, at a dosage of 0.2 gCLI/mgNH4-N. The constant C, which is proportional to the thickness of the boundary layer and represents the initial sorption, was also reduced from 6.31 mg/g to 3.78 mg/g (NH4Cl), from 7.00 mg/g to 3.77 mg/g (SW1), and from 4.19 mg/g to 2.84 mg/g (SW2) when a larger sorbent dosage (0.05–0.2 gCLI/mgNH4-N) was applied. This can be ascribed to the fact that with higher specific dosage, more sorption sites are provided, resulting in a rapid sorbent equilibrium but lower load.
During the contact time investigated, only a slight influence of the sample matrix on the load has been observed. Neither was the uptake rate
k2 or
kID influenced (except for SW2 at a specific dosage of 0.05 g
CLI/mg
NH4-N). However, regardless of the matrix, CCP 20 was in equilibrium after 120 min. In contrast, it was reported that for ammonium from matrix-free sorption solution one hour of contact time, but for that from the leachate 2.5 h were needed to achieve equilibrium [
16]. The authors ascribed this to interfering cations such as Na
+, K
+, Mg
2+, and Ca
2+ ([NH
4+]/[Na
+] ≈ 2.7; [NH
4+]/[K
+] ≈ 14.6) in the leachate investigated. However, the high stoichiometric excess of ammonium in the sludge waters investigated in this work was larger (SW1: [NH
4+]/[K
+] ≈ 12; [NH
4+]/[Na
+] ≈ 13; SW2: [NH
4+]/[K
+] ≈ 24–30; [NH
4+]/[Na
+] ≈ 10–12). Hence, the interfering of competing cations can be assumed as low. Therefore, no significant difference between matrix-free solution and sludge water could be determined in this experiment.
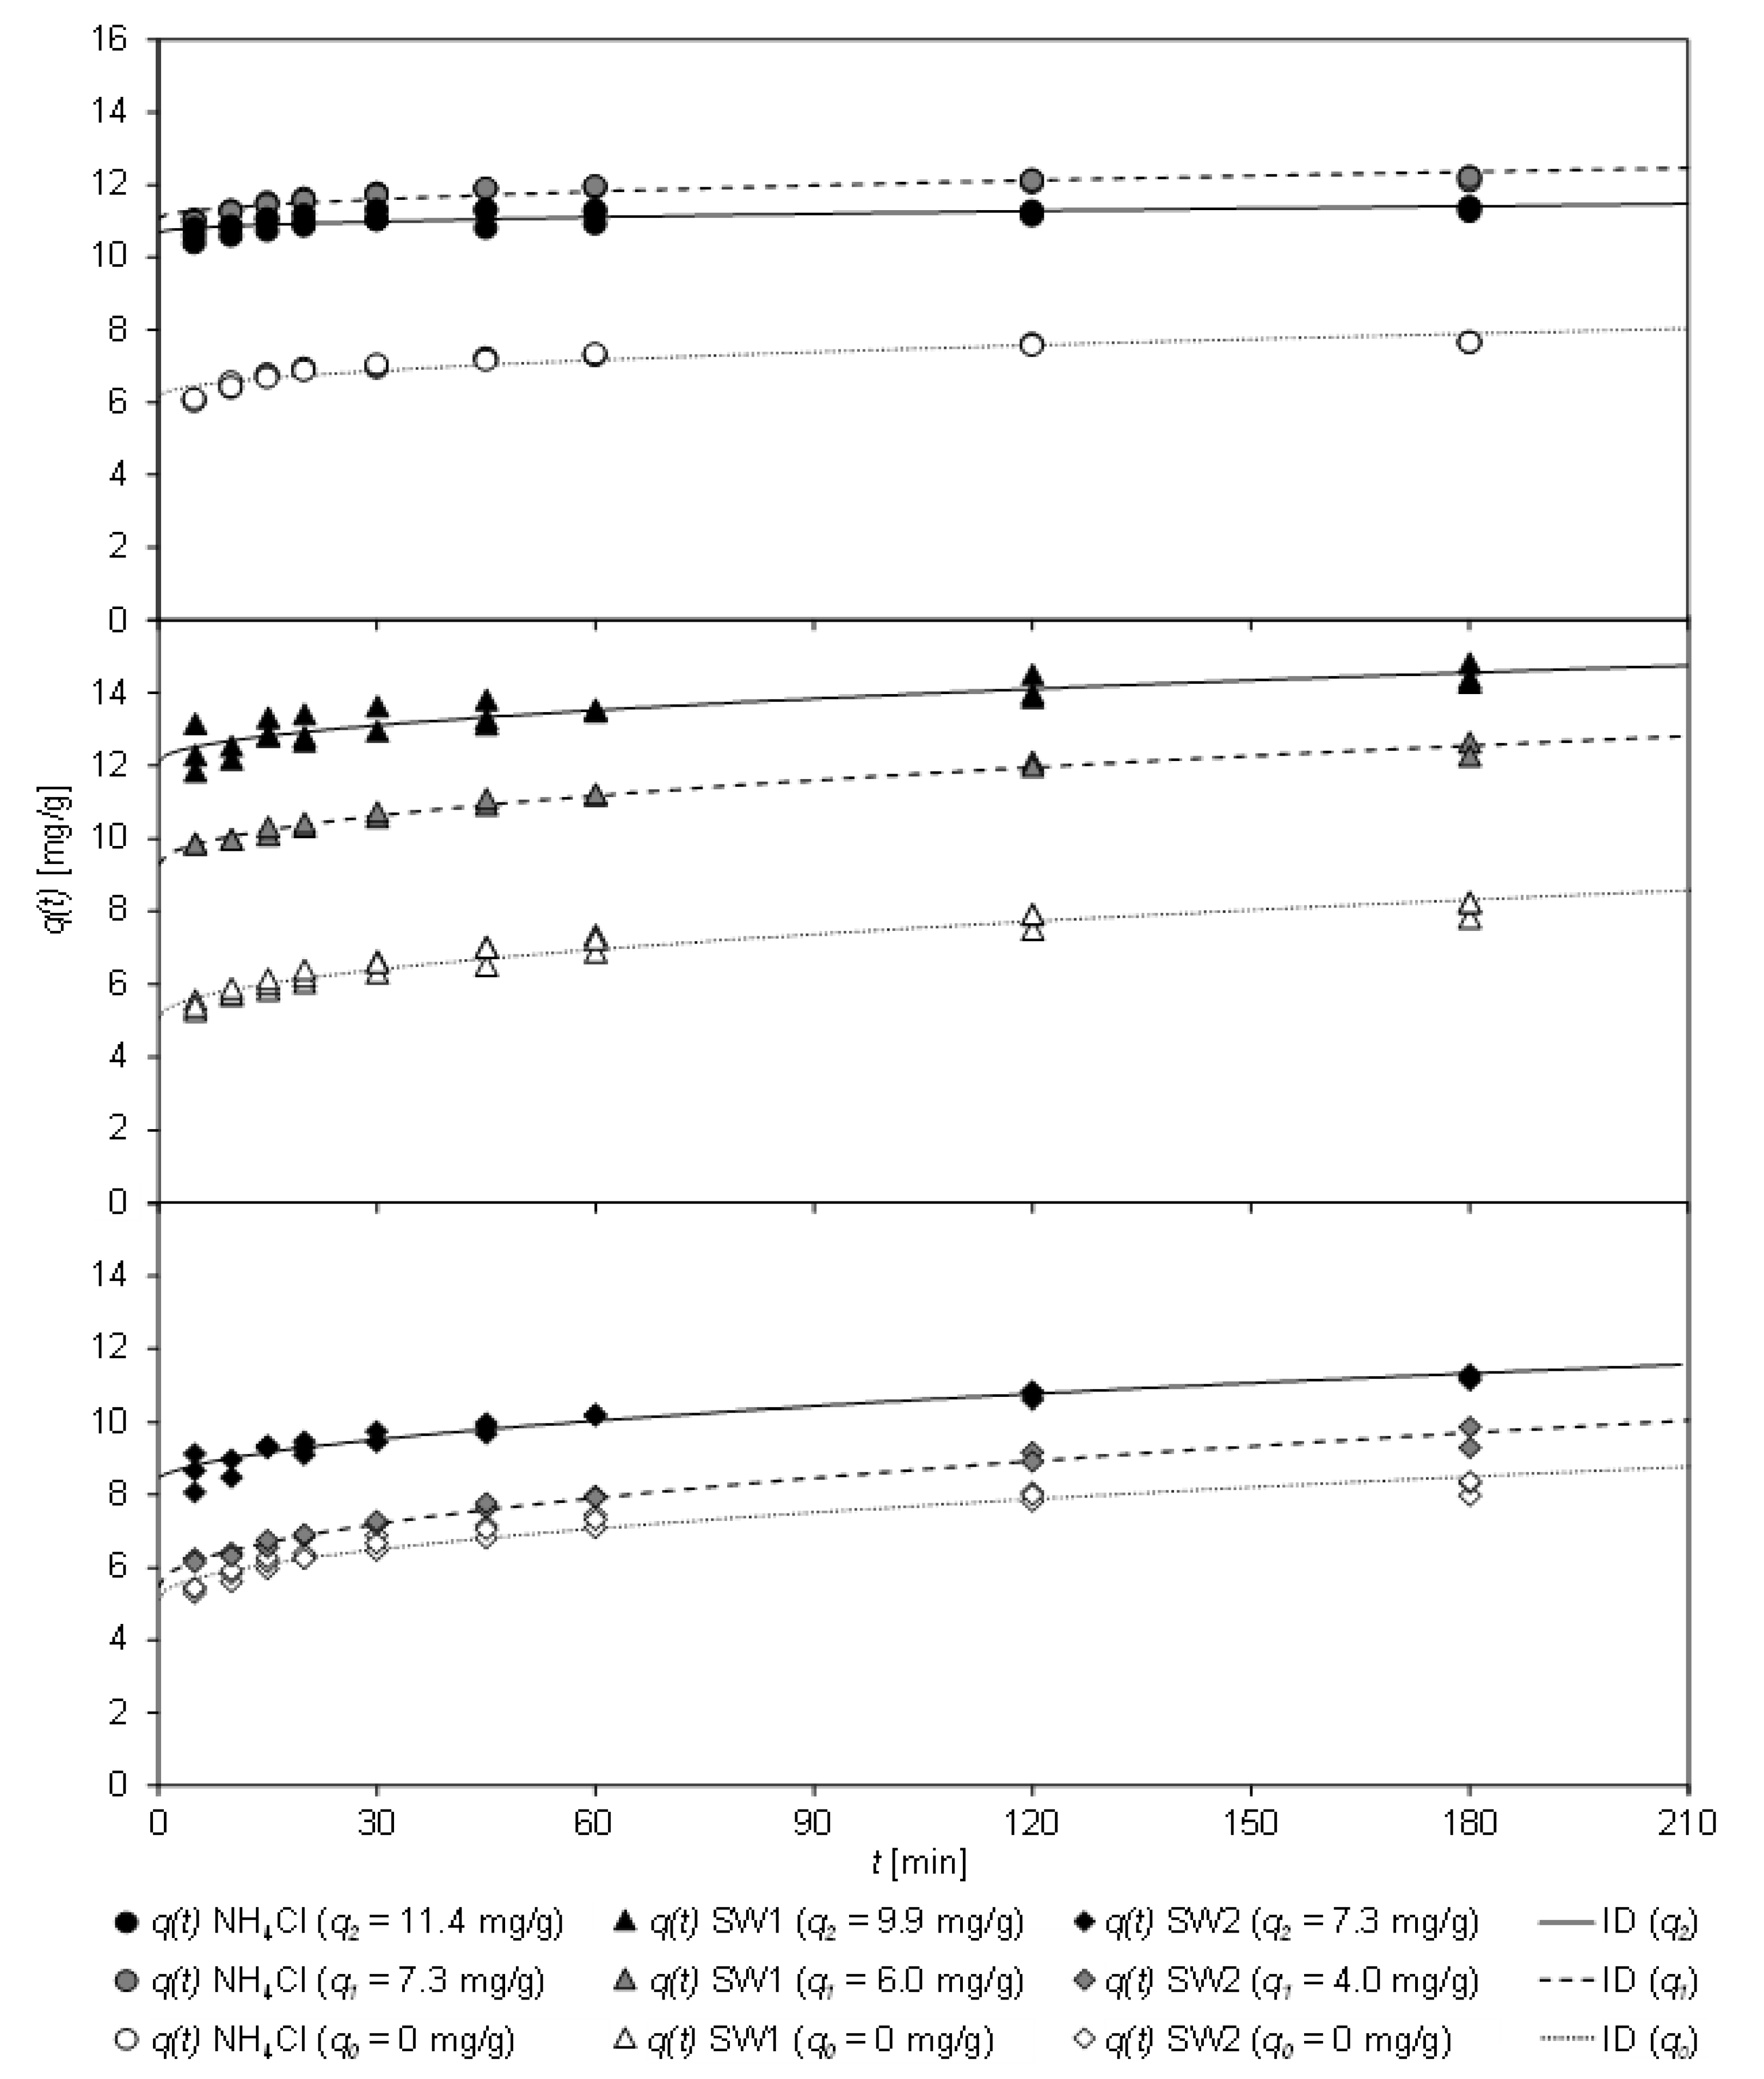
3.4.3. Influence of the Pre-load on Sorption Kinetics
During one sorption process, the CCP 20 may not be completely loaded, e.g., if the lowest possible residual concentration is to be achieved by a higher dosage of sorbent. In a process cascade, this partially pre-loaded sorbent could be returned and recontacted with sludge water. Similarly, a partial regeneration of the sorbent can result in partially loaded sorbent.
Figure 6 shows the loading
q(
t) of partially loaded CCP 20 after contact with NH
4Cl solution, SW1, and SW2 as a function of the contact time
t. For pre-loading, the sorbent was brought into contact with the sample for 30 min (
q1) or 60 min (
q2) at 307 K (based on the results from
Section 3.4.1). In addition, the fit of the ID model is shown, which achieved the highest coefficient of determination (
Table 9).
As
Figure 6 shows, the loading of CCP 20 increased with increasing contact time. Unloaded sorbent is marked as
q0, pre-loaded sorbent as
q1 and
q2, respectively. Pre-loaded CCP 20 (
q1 and
q2) adsorbed additional ammonium on contact with the sample. A considerable change in the load
q(
t) occurred for the matrix-free NH
4Cl solution. However, CCP 20 pre-loaded with 11.4 mg/g was already close to the sorption equilibrium, so that no significant increase in loading could be determined.
In contrast, with both wastewater matrices of the sludge waters SW1 and SW2 even at the highest pre-load (q2(SW1) = 9.9 mg/g and q2(SW2) = 7.3 mg/g), an increase of loading was achieved.
Table 9 shows the coefficients of the kinetic fit according to the PSO and ID models, the latter achieving higher coefficients of determination.
Within 5 min contact time, a high initial loading (C = 5.12–6.16 mg/g) of the unloaded sorbent (q0) was achieved, independent of the sample matrix. When partially pre-loaded (q1), the loading of the sorbent was considerably increased in all tests; depending on the pre-loading (approx. 80% for NH4Cl, almost 100% for SW1 and approx. 60% for SW2). In the first pre-loading step (q1), the initial loading C of NH4Cl increased significantly from 6.16 mg/g (q0) by about 80% to 11.07 mg/g (q1). For SW1, it also increased considerably from 6.16 mg/g (q0) to 9.30 mg/g (q1), but for SW2 only slightly from 5.12 mg/g (q0) to 5.46 mg/g (q1). In case of the highest preload (q2), the initial load C of matrix-free NH4Cl was lower (10.69 mg/g), but in case of sludge water it increased (SW1: 12.11 mg/g; SW2: 8.25 mg/g). The decreasing values for kID of SW1 (q1–q2: 0.243–0.182 mg/(min0.5 g)) and SW2 (q1–q2: 0.316–0.229 mg/(min0.5 g)) indicate that the sorbent reached equilibrium faster due to the partial pre-loading. After 30 min, preloaded (q2) CCP 20 was loaded to an extend between 9.45 mg/g (SW2) and 13.63 mg/g (SW1).
The fit of the sorption kinetics from matrix-free NH4Cl solution by means of the PSO model reveals that k2 increased with increasing pre-load of the sorbent, i.e., the sorbent achieved equilibrium faster. However, k2 of unloaded CCP 20 (q0) attained 0.090 g/(mg min), which increased to 0.135 g/(mg min) when partially loaded (q1) and finally to 0.161 g/(mg min) with the highest pre-load (q2), which was almost in equilibrium. On the contrary, the k2 values for SW1 (q0–q2: 0.042–0.070 g/(mg min)) and SW2 (q0–q2: 0.027–0.043 g/(mg min)) do not allow clear conclusions due to their wide variation.
Nevertheless, it has been ascertained that the sorption equilibrium is achieved faster from matrix-free NH4Cl solution than from sludge water. This can be ascribed to cations competing for sorption sites, but also to organic matter or particles contained in the sludge water and the slower diffusion of ammonium to deeper sorption sites. In a process cascade, in which a high CLI dosage has to achieve the lowest possible residual concentration, the partially loaded CLI could be brought into contact with sludge water again in order to use its capacity to the full extent. In order to achieve the highest possible loading of the sorbent, up to three sorption phases should be carried out, each lasting a maximum of 30 min.
4. Conclusions
From experiments with high strength sludge waters with ammonium concentrations from 718 mg/L NH4-N to 967 mg/L NH4-N by means of Carpathian clinoptilolite, the following boundary conditions can be derived with which the highest possible loading of the sorbent CCP 20 can be achieved:
the pH value should be in a range of 2 to 8 (or the arbitrary pH if below 8),
the temperature of 307 K should be preferred over lower temperatures (e.g., 283 K or 295 K),
the choice of a low specific sorbent dose (e.g., <0.1 gCLI/mgNH4-N) is advantageous,
pre-loaded sorbent should be recontacted with the sludge water several times (up to three times)
the contact time of (pre-loaded) sorbent should be at least 30 min.
However, other boundary conditions may be relevant, depending on the objectives of the treatment, e.g., high loading of the sorbent, shortest possible contact time, low effluent concentrations. For the design as well as the implementation of the process, the required contact time is of major importance. In the experiments it could be shown that a high loading of the clinoptilolite can be achieved already after 30 min. Therefore, it can be deduced that the necessary equipment for the treatment of the relatively small partial flow of the sludge water compared to the main wastewater flow would only require minor construction and plant engineering upgrades.
Based on the found conditions, it is of interest for future investigations under which parameters the clinoptilolite can be regenerated and possibly reused. Furthermore, it should not be omitted that the liquid resulting from the regeneration is still usable or the recovered ammonium is available in a usable form.


