Article

Phenolic Profile of Croton urucurana Baill. Leaves, Stems and Bark: Pairwise Influence of Drying Temperature and Extraction Solvent

by
Jáliston Júlio Lopes Alves
1,2,
Maria Inês Dias
1,
João C. M. Barreira
1,*,
Lillian Barros
1,*,
Osvaldo Resende
2,
Ana Carolina Ribeiro Aguiar
2 and
Isabel C. F. R. Ferreira
1
1
Centro de Investigação de Montanha (CIMO), Instituto Politécnico de Bragança, Campus de Santa Apolónia, 5300–253 Bragança, Portugal
2
Laboratório de Pós-colheita de Produtos Vegetais, Instituto Federal Goiano—Campus Rio Verde, 75.901–970 Rio Verde, Goiás, Brazil
*
Authors to whom correspondence should be addressed.
Molecules 2020, 25(9), 2032; https://doi.org/10.3390/molecules25092032
Submission received: 9 April 2020 / Revised: 22 April 2020 / Accepted: 25 April 2020 / Published: 27 April 2020

Abstract

:
Cerrado biome represents an area with great biodiversity. Some of its plants have significant ethnopharmacological uses, with specific purposes. Croton urucurana Baill., for instance, was previously acknowledged for its anti-hemorrhagic, anti-inflammatory, antiseptic, healing, and potentially antifungal and entomopathogenic actions. Nevertheless, the compounds supporting these empirical applications are still unknown. Accordingly, this work was designed to achieve a complete characterization of the phenolic profile of different botanical tissues obtained from C. urucurana, and also to verify how different operational conditions (different drying temperatures and extraction conditions) affect that profile. All samples were further characterized by HPLC–DAD–ESI/MSn, and results were compared by advanced chemometric tools. In general, the drying temperatures that maximize the extraction yield of specific individual phenolic compounds were established. Likewise, it was possible to verify that samples extracted with the hydroethanolic solution allowed higher phenolic yields, either in individual compounds (except (epi)catechin-di-O-gallate) or total phenolics. The identification of the best operational conditions and phenolic profiles associated with each C. urucurana botanical part contributes to enabling their use in food or pharmaceutical-related applications.

1. Introduction

Man has been using plant species for a variety of purposes (mainly related to food and medicinal applications) since ancient times [1,2,3]. The ethnopharmacological use of plants is essentially based on their effectiveness in alleviating different symptoms or their potential capacity to treat or prevent specific diseases [3,4]. These applications are especially noticeable in areas with high biodiversity, as in the case of Cerrado region. In fact, the Cerrado biome has one of the largest numbers of flora in the world, estimated at approximately seven thousand species, which is highly reflected in the cultural framework of the regional populations [2]. Despite this advantageous biodiversity, the exploitation of medicinal plants can be seriously limited by ineffective extractions, by the lack of thorough information about the bioactive compounds present in plants, or simply due to unsuitable drying and storage methods [1].
Accordingly, a great deal of effort has been dedicated by the scientific community to identify the compounds providing the physiologic effects pursued in ethnopharmacological uses, improve their extraction conditions and purity degrees, and ultimately to contribute to the preservation of important natural resources [3,4].
One of the tree species with wider ethnopharmacological uses among Cerrado species is represented by C. urucurana Baill, which is popularly known as “sangra d′água”. C. urucurana has been used for its anti-hemorrhagic, anti-inflammatory, antiseptic, healing, and potentially antifungal and entomopathogenic properties [5,6]; it is characterized as being a tall tree (10–12 m), with dark red sap, found in regions of tropical climate, such as Paraguay, Uruguay, Argentina, and Brazil. It is exclusively (or predominantly) found among riparian vegetation (interface between land and a river or a stream) [7]. As commonly verified among plant species used for phytotherapeutic purposes, the botanical tissues with highest potential are the leaves, branches, and bark, owing to their larger amounts of bioactive compounds [8]. The red-toned sap of C. urucurana, for instance, exhibits a wide variety of metabolites produced in the chiquimic acid and acetate pathways, such those as exemplified by different diterpenoids. In fact, the Croton genus is one of the richest sources of clerodane (especially in the bark) and clerodane diterpenes (e.g., methyl-3-oxo-12-epibarbascoate, sonderianin, and 15,16-epoxyclerodan-3,13(16),14(15)-trien-2-one). Other important compounds include acetylaleuritolic acid, stigmasterol, campesterol, β-sitosterol, β-sitosterol-3-O-glucoside, catechin, and gallocatechin [6,9].
In any case, the quality of these compounds is highly influenced by the employment of effective processing conditions (immediately after harvest) with the capacity to preserve those bioactive compounds and increase their possible use in phytotherapeutic products [10]. Actually, optimizing drying and storage processes, aiming at excellent post-harvest quality, is essential to maintain all the chemical properties found in fresh plants. In addition, and considering a practical point of view, industrial facilities are not structurally prepared to use fresh plants at large scale [11,12].
However, according to our knowledge, there is still no study on the influence of drying temperature on the phenolic composition of C. urucurana. Bearing this in mind, the individual phenolic profiles of C. urucurana samples (leaves, branches, and barks) dried at different temperatures (40, 50, 60, and 70 °C) and further extracted using different solvents (water and water:ethanol 80:20 v/v) were thoroughly compared to define the most suitable processing conditions (highest yield of phenolic compounds).

2. Results and Discussion

2.1. Phenolic Profiles of Leaves, Stems, and Bark of C. urucurana

The phenolic compounds characterization was performed on the hydroethanolic extracts and infusions preparations of leaves, bark, and stems of C. urucurana Baill. The choice of the extraction solvents/preparations was based on the traditional use of this plant, in the case of decoction extract, and in the fact that different percentages of polar and nonpolar solvents can maximize the extraction of phenolic compounds [13]. In order to keep a reasonable complexity of variables, only one water:ethanol solvent concentration was studied. The chromatographic characteristics of the individual compounds are summarized in Table 1. Overall, twenty-six compounds were identified, with a marked presence of sixteen flavonols (quercetin, myricetin, kaempferol, isorhamnetin, and syringetin) glycosyl derivatives, followed by six flavan-3-ols ((epi)catechin derivatives), three C-linked flavone glycosyl derivatives (apigenin), and one phenolic acid (gallic acid). The presence of C- linked flavonoid derivatives as the main compounds found in the Croton species is in accordance with [14]. However, as far as the authors know this is first report describing the individual phenolic profile of C. urucurana Baill. Peaks 1, 6, 11, 15, 18, 19, 20, 21, and 23 were identified as gallic acid, catechin, myricetin-3-O-rutinoside, apigenin-8-C-glucoside, quercetin-3-O-rutinosde, apigenin-6-C-glucoside, quercetin-3-O-glucoside, kaempferol-3-O-rutinoside, and isorhamnetin-3-O-rutinoside, respectively, by comparison of their chromatographic characteristics with available standard compounds. Catechin has been previously identified in the ethanolic extracts of C. urucurana bark [15].
As mentioned above, flavonoids were the main compounds identified, especially quercetin glycosyl derivatives, thus peaks 9 ([M − H] at m/z 625), 12 ([M − H] at m/z 741), 13, 14, and 16 ([M − H] at m/z 771), and 17 ([M − H] at m/z 609), were tentatively identified as derivatives of this flavonol, revealing a λmax around 350 nm and releasing a MS2 (second stage of mass spectrometry)fragment at m/z 301, respectively corresponding to the losses of two hexosyl moieties [M − H − 162 − 162], a deoxyhexosyl and hexosyl moiety [M − H − 146 − 162], a hexosyl and rutinosyl moiety [M − H − 162 − 308], and a pentosyl and rutinosyl moiety [M − H − 132 − 308], being tentatively assigned as quercetin-O-dihexoside (peak 9), quercetin-O-pentosyl-rutinoside (peak 12), quercetin-O-hexosyl-rutinoside I/II/III (peaks 13, 14, and 16), and quercetin-O-deoxyhexosyl-hexoside (peak 17). Peak 10 presented the same pseudomolecular ion [M − H] at m/z 625 as peak 11 (myricetin-3-O-rutinoside), releasing a unique MS2 fragment at m/z 317 (myricetin aglycone) indicating the simultaneous loss of a deoxyhexosyl and a hexosyl groups [M − H − 146 − 162], tentatively identified as myricetin-O-deoxyhexosyl-hexoside. The same occurred with peak 21 that presented a λmax at 348, a pseudomolecular ion [M − H] at m/z 593, and a unique MS2 fragment at m/z 285 (kaempferol aglycone), tentatively identified as kaempferol-O-deoxyhexoxyl-hexoside. Similarly, peak 24 ([M − H] at m/z 623) was tentatively identified as isorhamnetin-O-deoxyhexoside-hexoside. The last O-glycosylated flavonoid was tentatively identified as syringetin-O-rutinoside ([M − H] at m/z 653), releasing a MS2 fragment at m/z 345 (syringetin aglycone), which corresponded to the loss of a rutinosyl moiety [M − H − 308].
Peak 8 ([M − H] at m/z 593) released MS2 fragments that corresponded to the loss of 120 and 90 u characteristic of C-hexosyl flavones [16], thus being tentatively identified as apigenin-6,8-C-dihexoside.
Peaks 4, 5, and 7 were identified as proanthocyanidins (PAC) based on their pseudomolecular analysis and MS2 fragmentation patterns. Hereupon, peaks 4 and 5 were identified as (epi)catechin dimers isomer I and II, respectively, and peak 7 as (epi)catechin tetramer, presenting a pseudomolecular ion [M − H] at m/z 577 and 1153, respectively and MS2 fragmentation patterns coherent with B-type (epi)catechin dimers and tetramers, as previously described by Dias et al. [17]. Peaks 2 ([M − H] at m/z 305) and 3 ([M − H] at m/z 593) were also assigned as flavan-3-ol, particularly as (epi)gallocatechin and (epi)gallocatechin–(epi)catechin, respectively, based on its absorption, mass spectra, and bibliographic reference [18].

2.2. Effect of Drying Temperature and Extraction Solvent Over Phenolic Profiles

Values presented in Table 2, Table 3 and Table 4 are divided according to the sources of variability (factors): drying temperature (DT) and extraction solvent (ES). Results for each factor level (different temperatures or different extraction solvents) were obtained as the mean of all levels of the second factor, which explains the high magnitude of the standard deviation. When studying two factors simultaneously, the significant interaction among each other is frequently observed. Therefore, the interaction (DT × ES) among the two factors studied herein was evaluated to verify if the differences in phenolic compound concentrations achieved with different solvents depended on the temperature to which the plant tissues were exposed throughout the drying process. As it might be concluded from Table 2, the interaction was always significant (p < 0.001), not allowing presentation of the statistical classification resulting from the effect of each individual factor. Nevertheless, some overall conclusions could be achieved after the analysis of the estimated marginal mean (EMM) plots obtained for each phenolic compound.
In the case of C. urucurana leaves (Table 2), which presented quercetin-3-O-rutinoside, apigenin-6-C-glucoside, and (epi)catechin dimer II as the major compounds, the effect of DT was less pronounced than that corresponding to ES. This conclusion is based not only in the fact that compounds 9, 12, 15, 20, and 21, did not present significant differences pertaining DT, but also because most conclusions obtained from the EMM plots are linked to the effect of ES.
In fact, it could be inferred that compounds 9, 12, 15, 17, 1922 and total phenolics were obtained in higher concentrations (independently of DT) when the extraction was done with the hydroethanolic extracts. This tendency was also observed among compounds 5 and 7 (except at 60 °C). Despite the lack of similar results in the effects of DT, it is possible to indicate 50 °C as the most adequate temperature, considering the higher concentration in total phenolics obtained in this case.
The major phenolics in the barks of C. urucurana (Table 3), independent of DT or ES, were the (epichatechin) dimers (compounds 4 and 5) and catechin (compound 6). As observed in the experiments conducted on the leaves, the hydroethanolic mixture proved to be a better extracting solvent than water alone, as validated by the higher concentrations of compounds 46, 9, 17, 18, 20, and 25 (and also the higher concentrations of total phenolics) obtained with the hydroalcoholic solvent. Once again, the effect of DT was less obvious, as no other unequivocal differences except the higher concentrations of compounds 2, 5, and 6 in bark dried at 40 °C could be observed in the EMM plots.
The stems of C. urucurana (Table 4) showed lower overall quantities of phenolic compounds, despite the significantly high levels of (epi)catechin dimer I, the main phenolic compound by far. The factors under study (DT and ES) were shown once again to exert their effect in a cooperative manner (significant interaction in all cases, except quercetin-O-hexosyl-rutinoside III). Nonetheless, it became evident that hydroalcoholic extracts (independent of DT) allowed higher yields of all identified phenolic compounds (except gallic acid), which was in agreement with the results obtained with the leaves and bark. In DT, the effects were not equally obvious, except for the general tendency for lower extraction yields in the case of samples dried at 70 °C and higher yields among those dried at 103 °C.

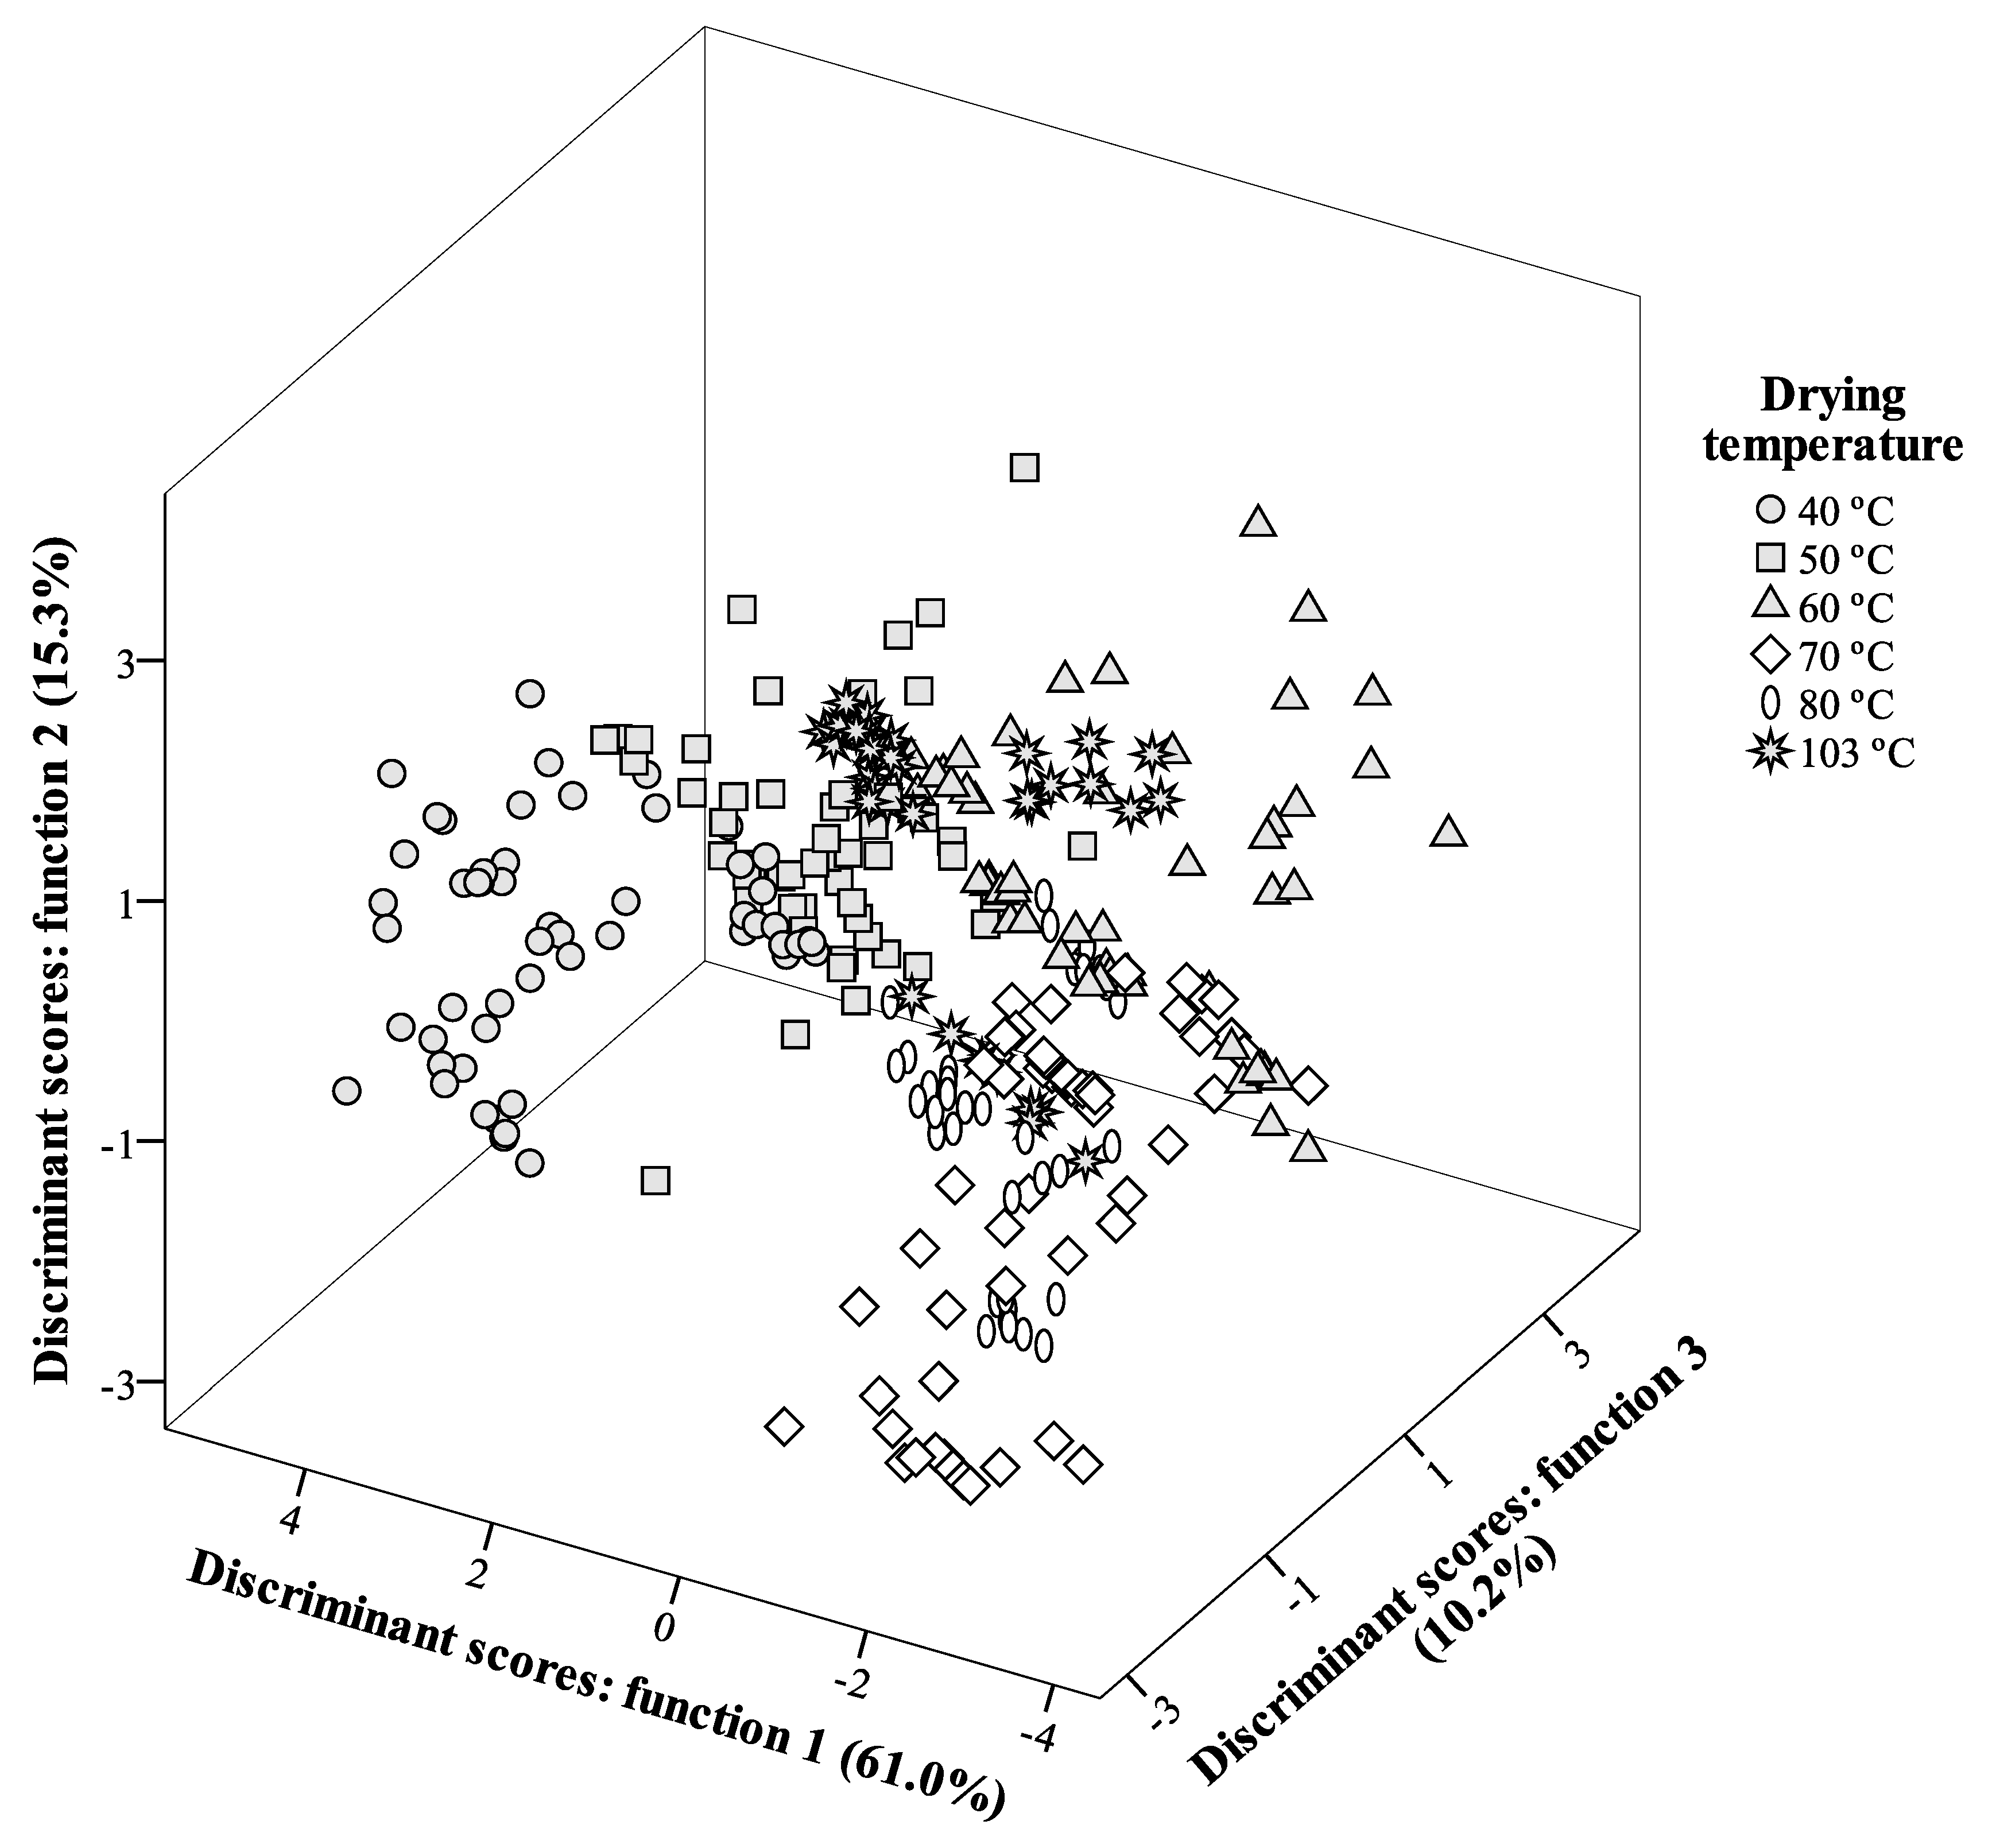
2.3. Linear Discriminant Analysis

All previous conclusions were obtained considering the individual effects of the studied factors over each individual botanical part. To complement the study, it was also interesting to evaluate the effects of both factors over phenolic profiles independently of being extracted from leaves, bark, or leaves. To achieve this purpose, the linear discriminant analysis (LDA) was employed. From a mathematical point of view, LDA evaluated the correlations among the studied factors (DT and ES), which represent the categorical dependent variables, and the concentrations of all quantified phenolic compounds, herein considered as the quantitative independent variables. One of the contributions of LDA is selecting which of these independent variables showed the most significant changes, a process that might be achieved through Wilks’ λ test. The classification performance of each variable was considered significant for p-values below 0.050.
In the case of DT effects, the number of defined discriminant functions was five, owing to the fact that there were six levels for this factor (40 °C, 50 °C, 60 °C, 70 °C, 80 °C, 103 °C). The first three functions were plotted in Figure 1, and included 86.5% (first function: 61.0%; second function: 15.3%; third function: 10.2%) of the observed variance of data.
Among the 25 analyzed variables, the discriminant model excluded only quercetin-O-pentosyl-rutinoside (compound 12), quercetin-O-hexosyl-rutinoside I (compound 13), quercetin-O-hexosyl-rutinoside III (compound 16), quercetin-O-deoxy-hexosyl-hexoside (compound 17), quercetin-3-O-glucoside (compound 20), and isorhamnetin-O-deoxy-hexosyl-hexoside (compound 24) as having no discriminant effects.
Considering the 19 variables selected as contributors to discriminate different drying temperatures, (epi)gallocatechin showed the highest correlation with function 1 (positive side of function 1 axis in Figure 1), justifying the separation of markers corresponding to 40 °C, the temperature that allowed the highest contents (60 mg/100 g dw) of that phenolic compound.
Function 2, in turn, was mostly correlated with (epi)catechin dimer I, particularly noticeable in C. urucurana stems, in which this compound was obtained in much higher concentrations in samples dried at 103 °C (183 mg/100 g dw), especially when compared to the results obtained with samples dried at 70 °C (13 mg/100 g dw), and both myricetin derivatives (higher in samples dried at 103 °C and lower in those dried at 70 °C). Together, these differences were important to place markers corresponding to 103 °C in the positive side of the function 2 axis, while those belonging to 70 °C were located in the negative side (indicating the lower concentrations of the phenolic compounds were more correlated with this function).
In addition, function 3 was more strongly correlated to apigenin-6,8-C-di-hexoside, which was detected in higher concentrations in samples dried at 60 °C (positive end of function 3 axis in Figure 1).
A second LDA was performed, using ES as the statistical factor. Owing to the fact that this factor comprised only 2 levels, it was not possible to obtain any kind of plot, since at least two discriminant functions would be necessary, and the number of functions is equal to the number of levels minus 1. Nevertheless, it was possible to verify which variables exhibited discriminant abilities; those variables ordered according to their correlation (highest to lowest) with the single defined function were: (epi)catechin dimer II, isorhametin-3-O-rutinoside, catechin, quercetin-O-hexosyl-rutinoside I, isorhamnetin-O-deoxy-hexosyl-hexoside, quercetin-O-di-hexoside, (epi)gallocatechin–(epi)catechin, apigenin-6,8-C-di-hexoside, (epi)catechin tetramer, quercetin-O-deoxy-hexosyl-hexoside, apigenin-8-C-glucoside, myricetin-3-O-rutinoside, gallic acid, and quercetin-3-O-rutinoside. All the previous phenolic compounds (except (epi)gallocatechin–(epi)catechin) were obtained in higher concentrations when the C. urucurana samples were extracted with the hydroalcoholic mixture.
In this second LDA, the classification performance was 100% accurate, either for original grouped cases, as well as for the cross-validated grouped ones, which represent a strong indicator of the significant differences resulting from using different extraction solvents.

3. Materials and Methods

3.1. Standards and Reagents

HPLC grade acetonitrile (99.9%) was purchased from Fisher Scientific (Lisbon, Portugal). Formic acid was obtained from Sigma–Aldrich (St. Louis, MO, USA). Phenolic standards were acquired from Extrasynthèse (Genay, France). All other general laboratory reagents were purchased from Panreac Química S.L.U. (Barcelona, Spain). Water was treated in a Milli-Q water purification system (TGI Pure Water Systems, Sunnyvale, TX, USA).

3.2. Plant Material and Kinetic Temperature

The leaves, branches and bark of C. urucurana, collected from 7:30 a.m. to 8 a.m. in January 2017 from the rural area of Santo Antônio da Barra, Goiás, Brazil, were used as raw material. The samples were registered in the Herbarium of the Goiano Federal Institute–Rio Verde Campus, under number 602.
The drying process was carried out at the Post-Harvest Laboratory of Vegetable Products of the Goiano Federal Institute of Education, Science and Technology–Rio Verde Campus, Goiás, Brazil, with defoliation and selection operations. The drying was conducted in a forced air circulation oven (Marconi MA35, Marconi Equipment for Laboratory Ltd., Algodoal, Piracicaba - SP, Brazil), at different drying air temperatures: 40, 50, 60, 70, 80, and 130 °C (the last two temperatures, 80 and 130 °C, were only used for the branches and bark samples). All samples were comminuted in multiprocessor, reduced to a fine dry powder, and mixed to obtain homogenized samples.

3.3. Hydroethanolic Extract and Decoction Preparation

To prepare the hydroethanolic extracts, 1 g of each sample was submitted to extraction with an ethanol/water mixture (80:20, v/v; 30 mL) at 25 °C and 150 rpm during 1 h, followed by filtration through Whatman filter paper No. 4. Afterwards, the residue was extracted with one additional portion of the hydroethanolic mixture and the combined extracts were evaporated under reduced pressure (rotary evaporator Büchi R-210, Flawil, Switzerland).
For decoction preparation, the lyophilized plant material (500 mg) was added to 100 mL of distilled water, heated, and boiled for 5 min. The mixture was left to stand for 5 min and then filtered under reduced pressure.
The obtained hydroethanolic extracts and decoctions were lyophilized for further analysis of phenolic compounds.

3.4. Phenolic Composition of the Hydroethanolic Extracts and Decoctions

The phenolic profile was determined by HPLC–DAD–ESI/MSn (High-performance liquid chromatography coupled to electrospray ionization mass spectrometric detection in negative ion mode) (Dionex Ultimate 3000 UPLC, Thermo Scientific, San Jose, CA, USA). The phenolic compounds were separated and identified as previously described by Bessada et al. [19]. The obtained extracts were re-dissolved at a concentration of 5 mg/mL with an ethanol/water (80:20, v/v) mixture. A double online detection was performed using diode array detector (DAD) by selecting 280, 330, and 370 nm as the preferred wavelengths, and a mass spectrometer (MS) connected to the HPLC system via the DAD cell outlet. The MS detection was performed in negative mode, using a Linear Ion Trap LTQ XL mass spectrometer (ThermoFinnigan, San Jose, CA, USA) equipped with an ESI source.
The identification of phenolic compounds was performed based on their chromatographic behavior and UV-vis and mass spectra by comparison with standard compounds (when available) and data reported in the literature. Data acquisition was carried out with the Xcalibur® data system (ThermoFinnigan, San Jose, CA, USA). For quantitative analysis, a calibration curve for each available phenolic standard was constructed based on the UV signal. The phenolic compounds for which a commercial standard was not available were quantified using calibration curves of the most similar standard compound: apigenin-6-C-glucoside (y = 107,025x + 61,531, R2 = 0.998); catechin (y = 84,950x − 23,200, R2 = 0.999); protocatechuic acid (y = 214,168x + 27,102, R2 = 0.999); quercetin-3-O-glucoside (y = 34843x − 160,173, R2 = 0.999); quercetin-3-O-rutinoside (y = 13343x + 76,751, R2 = 0.999). The results were expressed as mg/100 g of plant tissue dry weight (dw).

3.5. Statistical Analysis

Three samples were used for each group and all the assays were carried out in triplicate. The results were expressed as mean values ± standard deviation (SD).
Data were expressed as mean ± standard deviation, maintaining the significant numbers allowed by the magnitude of the corresponding standard deviation. An analysis of variance (ANOVA) with type III sums of squares, using the general linear model (GLM) procedure to compare differences in the concentrations of phenolic compounds, was employed. The 2-way ANOVA factors were “extraction solvent” (ES) and “drying temperature” (DT). When a statistically significant interaction among the two factors was verified, their effect was evaluated by from the estimated marginal means plots (considering all levels of each factor). Cases with no significant interaction were compared using Tukey’s multiple comparison test, after verifying the homogeneity of variances through Levene’s test. Differences among results obtained with each ES were compared through Student’s t-test, since less than three levels of this factor were available.
These analyses were carried out using IBM SPSS Statistics for Windows, Version 23.0. (IBM Corp., Armonk, New York, USA).
Complementarily, a linear discriminant analysis (LDA) was applied to evaluate the overall effects of ES and DT, independent of the C. urucurana tissue (leaf, bark, or stem) under study. The stepwise technique, considering Wilks’ λ test with the usual probabilities of F (3.84 to enter and 2.71 to be removed) for variable selection, was employed. With this procedure it was aimed to estimate the association between the single categorical dependent variables (ES or DT) and the quantitative independent variables (phenolic compound concentrations). Finding the independent variables with highest contribution to discriminate the average score profiles of different ES or DT allowed selection of the specific conditions that were expected to maximize the concentration of targeted phenolic compounds. In both cases, a leaving-one-out cross validation procedure was carried out to assess the model performance.

4. Conclusions

Besides the conclusions highlighting the higher efficiency of the hydroethanolic mixture instead of water alone, it was also possible to verify that the drying temperature allowed maximization of the yield in specific phenolic compounds. Specifically: (epi)gallocatechin was obtained in samples dried at 40 °C (the temperature that also allowed higher yields in total phenolic compounds in C. urucurana barks); (epi)catechin dimer I and myricetin derivatives were maximized in samples dried at 103 °C (which was also the temperature allowing higher yield in total phenolic compounds in C. urucurana stems); apigenin-6,8-C-di-hexoside, in turn, was obtained in higher concentrations in samples dried at 60 °C. In general, the effect of ES was more significant than that observed assaying different DTs. However, in addition to the identification of the best extraction solvent, it was also possible to detect the drying temperature that was expected to maximize the extraction yield of specific individual phenolic compounds. The maximization of the recovery of high-added value compounds from plant bio-residues (leaves, branches, and barks of C. urucurana) fulfils the necessary requirements for the development of a sustainable and profitable methodology for obtaining those same compounds, which can be further applied in various products and in different industrial segments, such as in the food, pharmaceutical, textile, and the agricultural industry, among others.

Author Contributions

Conceptualization, O.R., A.C.R.A., and I.C.F.R.F.; Formal analysis, J.J.L.A., M.I.D., J.C.M.B., and L.B.; Investigation, J.J.L.A., M.I.D., J.C.M.B., and L.B.; Methodology, J.J.L.A., M.I.D., J.C.M.B., and L.B.; Supervision, O.R., A.C.R.A., and I.C.F.R.F.; Writing—original draft, M.I.D., J.C.M.B., and L.B.; Writing—review and editing, O.R., A.C.R.A., and I.C.F.R.F. All authors have read and agreed to the published version of the manuscript.

Funding

The authors are grateful to the Foundation for Science and Technology (FCT, Portugal) for financial support through national funds FCT/MCTES to CIMO (UIDB/00690/2020); national funding by FCT, P.I., through the institutional scientific employment program-contract for the contracts of M.I. Dias and L. Barros, and to the individual scientific employment program-contract for J.C.M. Barreira; to the FEDER–Interreg España–Portugal program for financial support through the project 0377_Iberphenol_6_E. The authors are also grateful to the Instituto Federal de Educação, Ciência e Tecnologia Goiano.

Conflicts of Interest

The authors declare no conflict of interest.

References

  1. Franco, E.A.P.; Barros, R.F.M. Uso e diversidade de plantas medicinais no Quilombo Olho D’agua dos Pires, Esperantina, Piauí. Rev. Bras. Plantas Med. 2006, 8, 78–88. [Google Scholar]
  2. Vila Verde, G.M.; Paula, J.R.; Caneiro, D.M. Levantamento etnobotânico das plantas medicinais do cerrado utilizadas pela população de Mossâmedes (GO). Rev. Bras. Farmacogn. 2003, 13, 64–66. [Google Scholar] [CrossRef]
  3. Maciel, M.A.M.; Pinto, A.C.; Veiga, V.F.; Grynberg, N.F.; Echevarria, A. Plantas medicinais: A necessidade de estudos multidisciplinares. Quim. Nova 2002, 25, 429–438. [Google Scholar] [CrossRef] [Green Version]
  4. Souza, C.D. De; Felfili, J.M. Uso de plantas medicinais na região de Alto Paraíso de Goiás, GO, Brasil. Acta Botânica Bras. 2006, 20, 135–142. [Google Scholar] [CrossRef]
  5. Soldera, C.C.; Zanella, G.N.; Frasson, A.P.Z. Avaliação da atividade antibacteriana de Croton urucurana. Rev. Context. Saúde 2013, 10, 25–31. [Google Scholar] [CrossRef]
  6. Dos Santos Carvalho, G.; Da Silva, L.S.; Silva, L.B.; Dos Santos Almeida, M.L.; Pavam, B.E.; Peres, M.T.L.P. Mortalidade e comprometimento do desenvolvimento de Zabrotes subfasciatus Boh. (Coleoptera: Chrysomelidae), induzido pelo extrato de sangra d’água Croton urucurana Baill (Euphorbiaceae). Comun. Sci. 2014, 5, 331–338. [Google Scholar]
  7. Rao, V.S.; Gurgel, L.A.; Lima-Júnior, R.C.P.; Martins, D.T.O.; Cechinel-Filho, V.; Santos, F.A. Dragon’s blood from Croton urucurana (Baill.) attenuates visceral nociception in mice. J. Ethnopharmacol. 2007, 113, 357–360. [Google Scholar] [CrossRef] [PubMed]
  8. Koche, D.; Shirsat, R.; Imran, S.; Bhadange, D.G. Phytochemical screening of eight traditionally used ethnomedicinal plants from Akola district (MS) India. Int. J. Pharma Bio Sci. 2010, 1, B-253–B-256. [Google Scholar]
  9. Pizzolatti, M.G.; Bortoluzzi, A.J.; Brighente, I.M.C.; Zuchinalli, A.; Carvalho, F.K.; Candido, A.C.S.; Peres, M.T.L.P. Clerodane diterpenes from bark of Croton urucurana baillon. J. Braz. Chem. Soc. 2013, 24, 609–614. [Google Scholar] [CrossRef]
  10. Goneli, A.L.D.; Pire, O.V.; Vilhasanti, H.D.C.B.; Gonçalves, A.A. Modelagem matemática e difusividade efetiva de folhas de aroeira durante a secagem. Pesqui. Agropecu. Trop. 2014, 44, 56–64. [Google Scholar] [CrossRef]
  11. Tabaldi, L.A.; Vieira, M.D.C.; Zárate, N.A.H.; Silva, L.R.D.; Gonçalves, W.L.F.; Pilecco, M.; Formagio, A.S.N.; Gassi, R.P.; Padovan, M.P. Cover crops and their effects on the biomass yield of Serjania marginata plants. Ciência Rural 2012, 42, 614–620. [Google Scholar] [CrossRef] [Green Version]
  12. Sousa, F.C.; Martins, J.J.A.; Rocha, A.P.T.; Gomes, J.P.; Pessoa, T.; Martins, J.N. Predição de modelos sobre a cinética de secagem de folhas de Ziziphus joazeiro Mart. Rev. Bras. Plantas Med. 2015, 17, 195–200. [Google Scholar] [CrossRef]
  13. Santos-Buelga, C.; Gonzalez-Manzano, S.; Dueñas, M.; Gonzalez-Paramas, A.M. Extraction and isolation of phenolic compounds. In Natural Products Isolation. Methods in Molecular Biology (Methods and Protocols)—Chapter 17; Sarker, S., Nahar, L., Eds.; Humana Press: Totowa, NJ, USA, 2012; Volume 864, pp. 427–464. [Google Scholar]
  14. Furlan, C.M.; Santos, K.P.; Sedano-Partida, M.D.; Motta, L.B. da; Santos, D.Y.A.C.; Salatino, M.L.F.; Negri, G.; Berry, P.E.; van Ee, B.W.; Salatino, A. Flavonoids and antioxidant potential of nine Argentinian species of Croton (Euphorbiaceae). Rev. Bras. Bot. 2015, 38, 693–702. [Google Scholar] [CrossRef]
  15. Cordeiro, K.W.; Felipe, J.L.; Malange, K.F.; Do Prado, P.R.; De Oliveira Figueiredo, P.; Garcez, F.R.; De Cássia Freitas, K.; Garcez, W.S.; Toffoli-Kadri, M.C. Anti-inflammatory and antinociceptive activities of Croton urucurana Baillon bark. J. Ethnopharmacol. 2016, 183, 128–135. [Google Scholar] [CrossRef] [PubMed]
  16. Ferreres, F.; Silva, B.M.; Andrade, P.B.; Seabra, R.M.; Ferreira, M.A. Approach to the study of C-glycosyl flavones by ion trap HPLC-PAD-ESI/MS/MS: Application to seeds of quince (Cydonia oblonga). Phytochem. Anal. 2003, 14, 352–359. [Google Scholar] [CrossRef] [PubMed]
  17. Dias, M.I.; Barros, L.; Fernandes, I.P.; Ruphuy, G.; Oliveira, M.B.P.; Santos-Buelga, C.; Barreiro, M.F.; Ferreira, I.C.F.R. A bioactive formulation based on Fragaria vesca L. vegetative parts: Chemical characterisation and application in κ-carrageenan gelatin. J. Funct. Foods 2015, 16, 243–255. [Google Scholar] [CrossRef] [Green Version]
  18. Escobar-Avello, D.; Lozano-Castellón, J.; Mardones, C.; Pérez, A.J.; Saéz, V.; Riquelme, S.; Von Baer, D.; Vallverdú-Queralt, A. Phenolic profile of grape canes: Novel compounds identified by LC-ESI-LTQ-orbitrap-MS. Molecules 2019, 24, 3763. [Google Scholar] [CrossRef] [Green Version]
  19. Bessada, S.M.F.; Barreira, J.C.M.; Barros, L.; Ferreira, I.C.F.R.; Oliveira, M.B.P.P. Phenolic profile and antioxidant activity of Coleostephus myconis (L.) Rchb.f.: An underexploited and highly disseminated species. Ind. Crops Prod. 2016, 89, 45–51. [Google Scholar] [CrossRef] [Green Version]
Sample Availability: All samples are available in the dry form.
Figure 1. Spatial distribution of DT (drying temperature) and ES (extraction solvent) markers following the distribution set by the discriminant functions coefficients. Function 1 accounted for 61.0% of the variation, function 2 accounted for 15.3%, while function 3 accounted for 10.2%.
Molecules 25 02032 g001
Table 1. Retention time (Rt), wavelengths of maximum absorption in the visible region (λmax), mass spectral data, and tentative identification of the phenolic compounds present in C. urucurana Baill. leaves (L), branches (B), and bark (S).
PeakRt (min)λmax (nm)Molecular Ion [M − H] (m/z)MS2 (m/z)Tentative IdentificationSample
14.40270169125 (100)Gallic acidS
24.60276611305 (100), 287 (11), 261 (41), 247 (14), 221 (87), 179 (50)(Epi)gallocatechin AB
34.85276593575 (5), 467 (12), 441 (8), 425 (100), 305 (2), 287 (8)(Epi)gallocatechin–(epi)catechin AB
45.22278577559 (10), 451 (23), 425 (100), 407 (22), 289 (11)(Epi)catechin dimer I AB + L + S
55.99279577559 (6), 451 (19), 425 (2), 407 (19), 289 (8)(Epi)catechin dimer II AB + L + S
66.77280289245 (100), 231 (9), 205 (36), 179 (13)Catechin AB + L + S
77.122791153577 (55), 559 (15), 451 (5), 425 (5), 407 (4), 289 (6)(Epi)catechin tetramer AL
813.05331593473 (100), 431 (31), 353 (29), 341 (4), 311 (2)Apigenin-6,8-C-di-hexoside BL
913.59347625301 (100)Quercetin-O-di-hexoside CB + L + S
1014.18352625317 (100)Myricetin-O-deoxyhexosyl-hexoside DB + S
1114.41350625317 (100)Myricetin-3-O-rutinoside DS
1215.1354741609 (13), 301 (100)Quercetin-O-pentosyl-rutinoside CL
1315.23341771609 (27), 301 (100)Quercetin-O-hexosyl-rutinoside I CS
1415.61342771609 (22), 301 (100)Quercetin-O-hexosyl-rutinoside II CS
1515.86336431413 (2), 341 (5), 311 (100), 283 (3)Apigenin-8-C-glucoside BL
1615.89329771301 (100)Quercetin-O-hexosyl-rutinoside III CS
1716.94350609301 (100)Quercetin-O-deoxyhexosyl-hexoside CB + L + S
1817.17356609301 (100)Quercetin-3-O-rutinoside CB + L + S
1917.54337431413 (6), 341 (27), 311 (100), 283 (3)Apigenin-6-C-glucoside BL
2018.3354463301 (100)Quercetin-3-O-glucoside CB + L
2118.98348593285 (100)Kaempferol-O-deoxyhexosyl-hexoside CL
2220.29346593285 (100)Kaempferol-3-O-rutinoside CL + S
2320.79334623315 (100)Isorhametin-3-O-rutinoside CS
2421.3329623315 (100)Isorhamnetin-O-deoxyhexosyl-hexoside CS
2521.86339653345 (100)Syringetin-O-rutinoside CB
Standard calibration curves: A: catechin (y = 84,950x − 23,200, R2 = 0.9999); B: apigenin-6-glucoside (y = 107,025x + 61531, R2 = 0.9989); C: quercetin-3-O-glucoside (y = 34843x − 160,173, R2 = 0.9998); D: quercetin-3-O-rutinoside (y = 13343x + 76,751, R2 = 0.9998).
Table 2. Phenolic compound quantification (mg/g extract) in C. urucurana Baill. leaves submitted to different drying and extraction conditions.
CompoundTentative Identification (Standard Used for Quantification)Quantification (mg/100 g dw − Dry Weight)
Drying Temperature (DT)p-Value (n = 18)Extraction Solvent (ES)p-Value (n = 36)DT × ES
40 °C50 °C60 °C70 °CWaterHydroalcoholicp-Value (n = 72)
4(Epi)catechin dimer I43 ± 551 ± 835 ± 1341 ± 2<0.00142 ± 443 ± 130.879<0.001
5(Epi)catechin dimer II79 ± 18163 ± 10190 ± 7172 ± 68<0.00182 ± 20170 ± 81<0.001<0.001
6Catechin36 ± 1461 ± 3440 ± 375 ± 25<0.00148 ± 3158 ± 220.109<0.001
7(Epi)catechin tetramer13 ± 328 ± 313 ± 621 ± 12<0.00114 ± 1023 ± 6<0.001<0.001
8Apigenin-6,8-C-dihexoside1 ± 10.7 ± 0.24 ± 11.0 ± 0.1<0.0012 ± 21 ± 10.001<0.001
9Quercetin-O-dihexoside25 ± 224 ± 424 ± 523 ± 40.65721 ± 227 ± 1<0.001<0.001
12Quercetin-O-pentosyl-rutinoside26 ± 125 ± 325 ± 325 ± 30.27423 ± 227 ± 1<0.001<0.001
15Apigenin-8-C-glucoside69 ± 1067 ± 1669 ± 568 ± 60.95060 ± 577 ± 5<0.001<0.001
17Quercetin-O-deoxyhexosyl-hexoside55 ± 660 ± 649 ± 762 ± 4<0.00151 ± 762 ± 5<0.001<0.001
18Quercetin-3-O-rutinoside292 ± 33364 ± 41354 ± 20331 ± 21<0.001333 ± 24338 ± 520.596<0.001
19Apigenin-6-C-glucoside142 ± 36104 ± 17112 ± 12102 ± 11<0.00198 ± 9132 ± 27<0.001<0.001
20Quercetin-3-O-glucoside33 ± 233 ± 532 ± 232 ± 30.87730 ± 235 ± 2<0.001<0.001
21Kaempferol-O-deoxyhexosyl-hexoside30 ± 228 ± 328 ± 428 ± 40.41026 ± 231 ± 1<0.0010.001
22Kaempferol-3-O-rutinoside53 ± 449 ± 548 ± 248 ± 50.00147 ± 353 ± 3<0.001<0.001
Total phenols897 ± 711059 ± 235922 ± 181029 ± 1100.001877 ± 501077 ± 148<0.001<0.001
Table 3. Phenolic compound quantification in C. urucurana Baill. bark submitted to different drying and extraction conditions.
CompoundTentative Identification (Standard Used for Quantification)Quantification (mg/100 g dw)
Drying Temperature (DT)p-Value (n = 18)Extraction Solvent (ES)p-Value (n = 54)DT × ES
40 °C50 °C60 °C70 °C80 °C103 °CWaterHydroalcoholicp-Value (n = 108)
2(Epi)gallocatechin60 ± 1330 ± 911 ± 718 ± 318 ± 25 ± 5 *<0.00121 ± 1427 ± 240.105<0.001
3(Epi)gallocatechin–(epi)catechin36 ± 812 ± 114 ± 420 ± 1220 ± 1911 ± 11 *<0.00125 ± 912 ± 15<0.001<0.001
4(Epi)catechin dimer I56 ± 1734 ± 1446 ± 855 ± 635 ± 1330 ± 24<0.00148 ± 3158 ± 22<0.001<0.001
5(Epi)catechin dimer II75 ± 2824 ± 1517 ± 923 ± 718 ± 119 ± 4<0.00116 ± 1540 ± 29<0.001<0.001
6Catechin81 ± 4636 ± 2533 ± 942 ± 1225 ± 1012 ± 6<0.00121 ± 1156 ± 34<0.001<0.001
9Quercetin-O-dihexoside18 ± 217 ± 219 ± 217 ± 316 ± 315 ± 60.00614 ± 220 ± 1<0.001<0.001
10Myricetin-O-deoxyhexosyl-hexoside19 ± 217 ± 218 ± 217 ± 315 ± 29 ± 1*<0.00114 ± 316 ± 70.048<0.001
17Quercetin-O-deoxyhexosyl-hexoside18 ± 217 ± 218 ± 217 ± 315 ± 214 ± 5<0.00114 ± 319 ± 1<0.001<0.001
18Quercetin-3-O-rutinoside19 ± 216 ± 219 ± 217 ± 315 ± 215 ± 5<0.00114 ± 319 ± 2<0.001<0.001
20Quercetin-3-O-glucoside18 ± 217 ± 218 ± 217 ± 315 ± 214 ± 5<0.00114 ± 219 ± 1<0.001<0.001
25Syringetin-O-rutinoside19 ± 216 ± 218 ± 217 ± 315 ± 214 ± 5<0.00114 ± 319 ± 1<0.001<0.001
Total phenolics420 ± 125235 ± 77231 ± 39260 ± 27207 ± 30144 ± 40<0.001195 ± 61304 ± 115<0.001<0.001
* This compound was not detected in ethanolic extracts at this temperature.
Table 4. Phenolic compound quantification in C. urucurana Baill. stems submitted to different drying and extraction conditions.
CompoundTentative Identification (Standard Used for Quantification)Quantification (mg/100 g dw)
Drying Temperature (DT)p-Value (n = 18)Extraction Solvent (ES)p-Value (n = 54)DT × ES
40 °C50 °C60 °C70 °C80 °C103 °CWaterHydroalcoholicp-Value (n = 108)
1Gallic acid2 ± 12 ± 11 ± 1nd4 ± 1 *0.5 ± 0.1<0.0011 ± 11 ± 10.184<0.001
4(Epi)catechin dimer I107 ± 71137 ± 34125 ± 6313 ± 1 *50 ± 39183 ± 62<0.00159 ± 43143 ± 80<0.001<0.001
5(Epi)catechin dimer II22 ± 133 ± 12.2 ± 0.121 ± 118 ± 118 ± 10.003nd19 ± 9--
6Catechin6 ± 56 ± 53 ± 21 ± 10.7 ± 0.25 ± 2<0.0011 ± 16 ± 4<0.001<0.001
9Quercetin-O-dihexoside1.0 ± 0.30.9 ± 0.20.7 ± 0.30.6 ± 0.30.6 ± 0.31.0 ± 0.2<0.0010.5 ± 0.21.1 ± 0.2<0.001<0.001
10Myricetin-O-deoxyhexosyl-hexoside1.1 ± 0.41.1 ± 0.30.8 ± 0.30.5 ± 0.30.6 ± 0.21.1 ± 0.2<0.0010.6 ± 0.21.1 ± 0.3<0.001<0.001
11Myricetin-3-O-rutinoside1.1 ± 0.41.0 ± 0.30.7 ± 0.30.5 ± 0.30.6 ± 0.31.0 ± 0.1<0.0010.5 ± 0.21.1 ± 0.2<0.001<0.001
13Quercetin-O-hexosyl-rutinoside I1.0 ± 0.31.0 ± 0.20.7 ± 0.30.5 ± 0.30.6 ± 0.21.0 ± 0.2<0.0010.5 ± 0.21.0 ± 0.2<0.001<0.001
14Quercetin-O-hexosyl-rutinoside II1.0 ± 0.30.9 ± 0.20.7 ± 0.30.5 ± 0.30.6 ± 0.31.0 ± 0.2<0.0010.6 ± 0.21.1 ± 0.2<0.001<0.001
16Quercetin-O-hexosyl-rutinoside III1.0 ± 0.3c1.2 ± 0.3b0.8 ± 0.3d0.6 ± 0.3e0.6 ± 0.3e1.3 ± 0.3a<0.0010.6 ± 0.31.2 ± 0.3<0.0010.870
17Quercetin-O-deoxyhexosyl-hexoside2 ± 13 ± 12 ± 10.7 ± 0.40.8 ± 0.42.6 ± 0.5<0.0011 ± 13 ± 1<0.001<0.001
18Quercetin-3-O-rutinoside4 ± 26 ± 34 ± 21 ± 11 ± 16 ± 2<0.0012 ± 15 ± 2<0.001<0.001
22Kaempferol-3-O-rutinoside0.9 ± 0.30.9 ± 0.30.7 ± 0.31.2 ± 0.51.1 ± 0.51.6 ± 0.5<0.0010.6 ± 0.21.6 ± 0.4<0.001<0.001
23Isorhamnetin-3-O-rutinoside1.1 ± 0.51.2 ± 0.31.3 ± 0.54 ± 33 ± 23 ± 2<0.0011.0 ± 0.44 ± 2<0.001<0.001
24Isorhamnetin-O-deoxyhexosyl-hexoside0.9 ± 0.31.0 ± 0.30.8 ± 0.30.5 ± 0.20.6 ± 0.21.1 ± 0.2<0.0010.5 ± 0.21.1 ± 0.2<0.001<0.001
Total phenolics142 ± 95179 ± 62144 ± 7429 ± 1272 ± 51218 ± 79<0.00170 ± 47191 ± 86<0.001<0.001
* This compound was not detected in ethanolic extracts at this temperature.

