
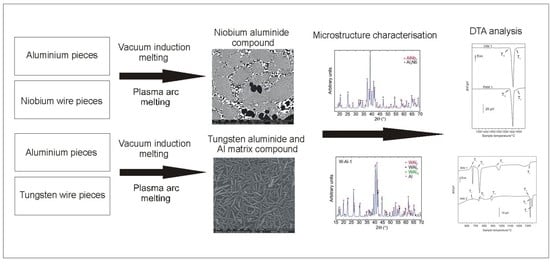
Metallurgical Preparation of Nb–Al and W–Al Intermetallic Compounds and Characterization of Their Microstructure and Phase Transformations by DTA Technique


Abstract
:
1. Introduction
2. Results and Discussion
2.1. Chemical Composition and Homogeneity
2.1.1. Nb–Al Alloys
2.1.2. W–Al Alloys
2.2. Microstructure
2.2.1. Nb–Al Alloys
2.2.2. W–Al Alloys
2.3. Melting Temperatures and Phase Transformations
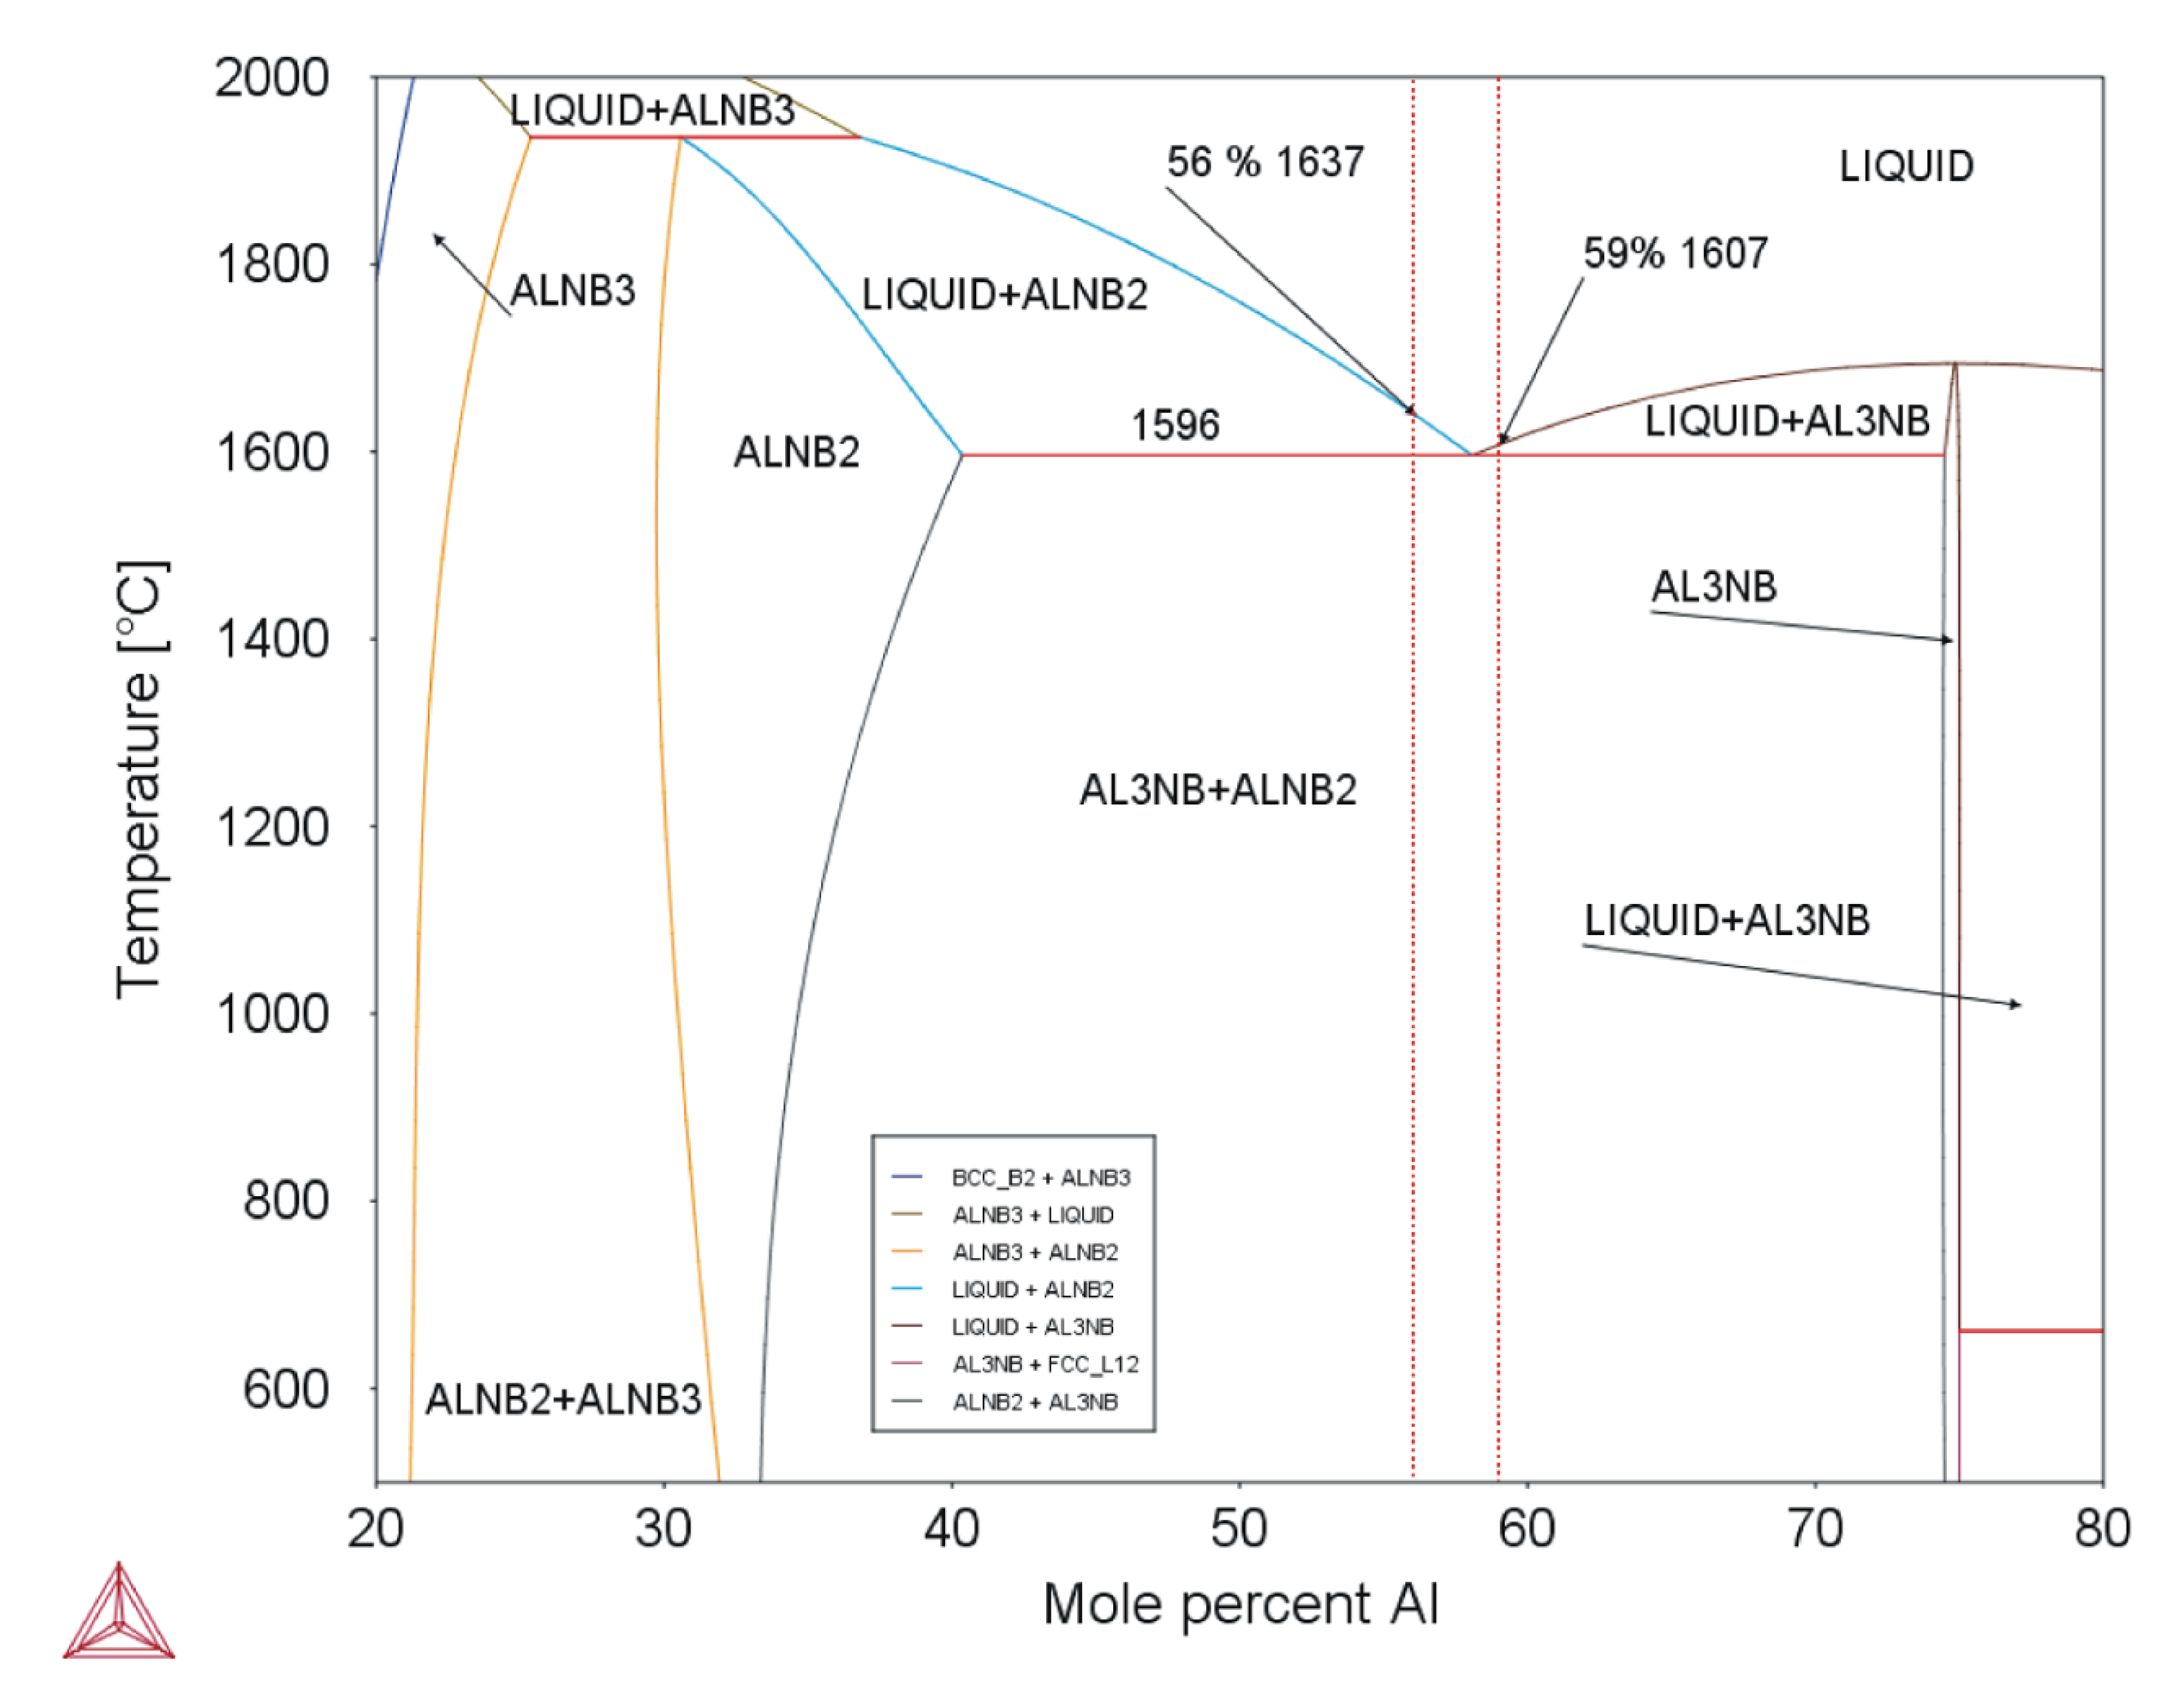
2.3.1. Nb–Al Alloys
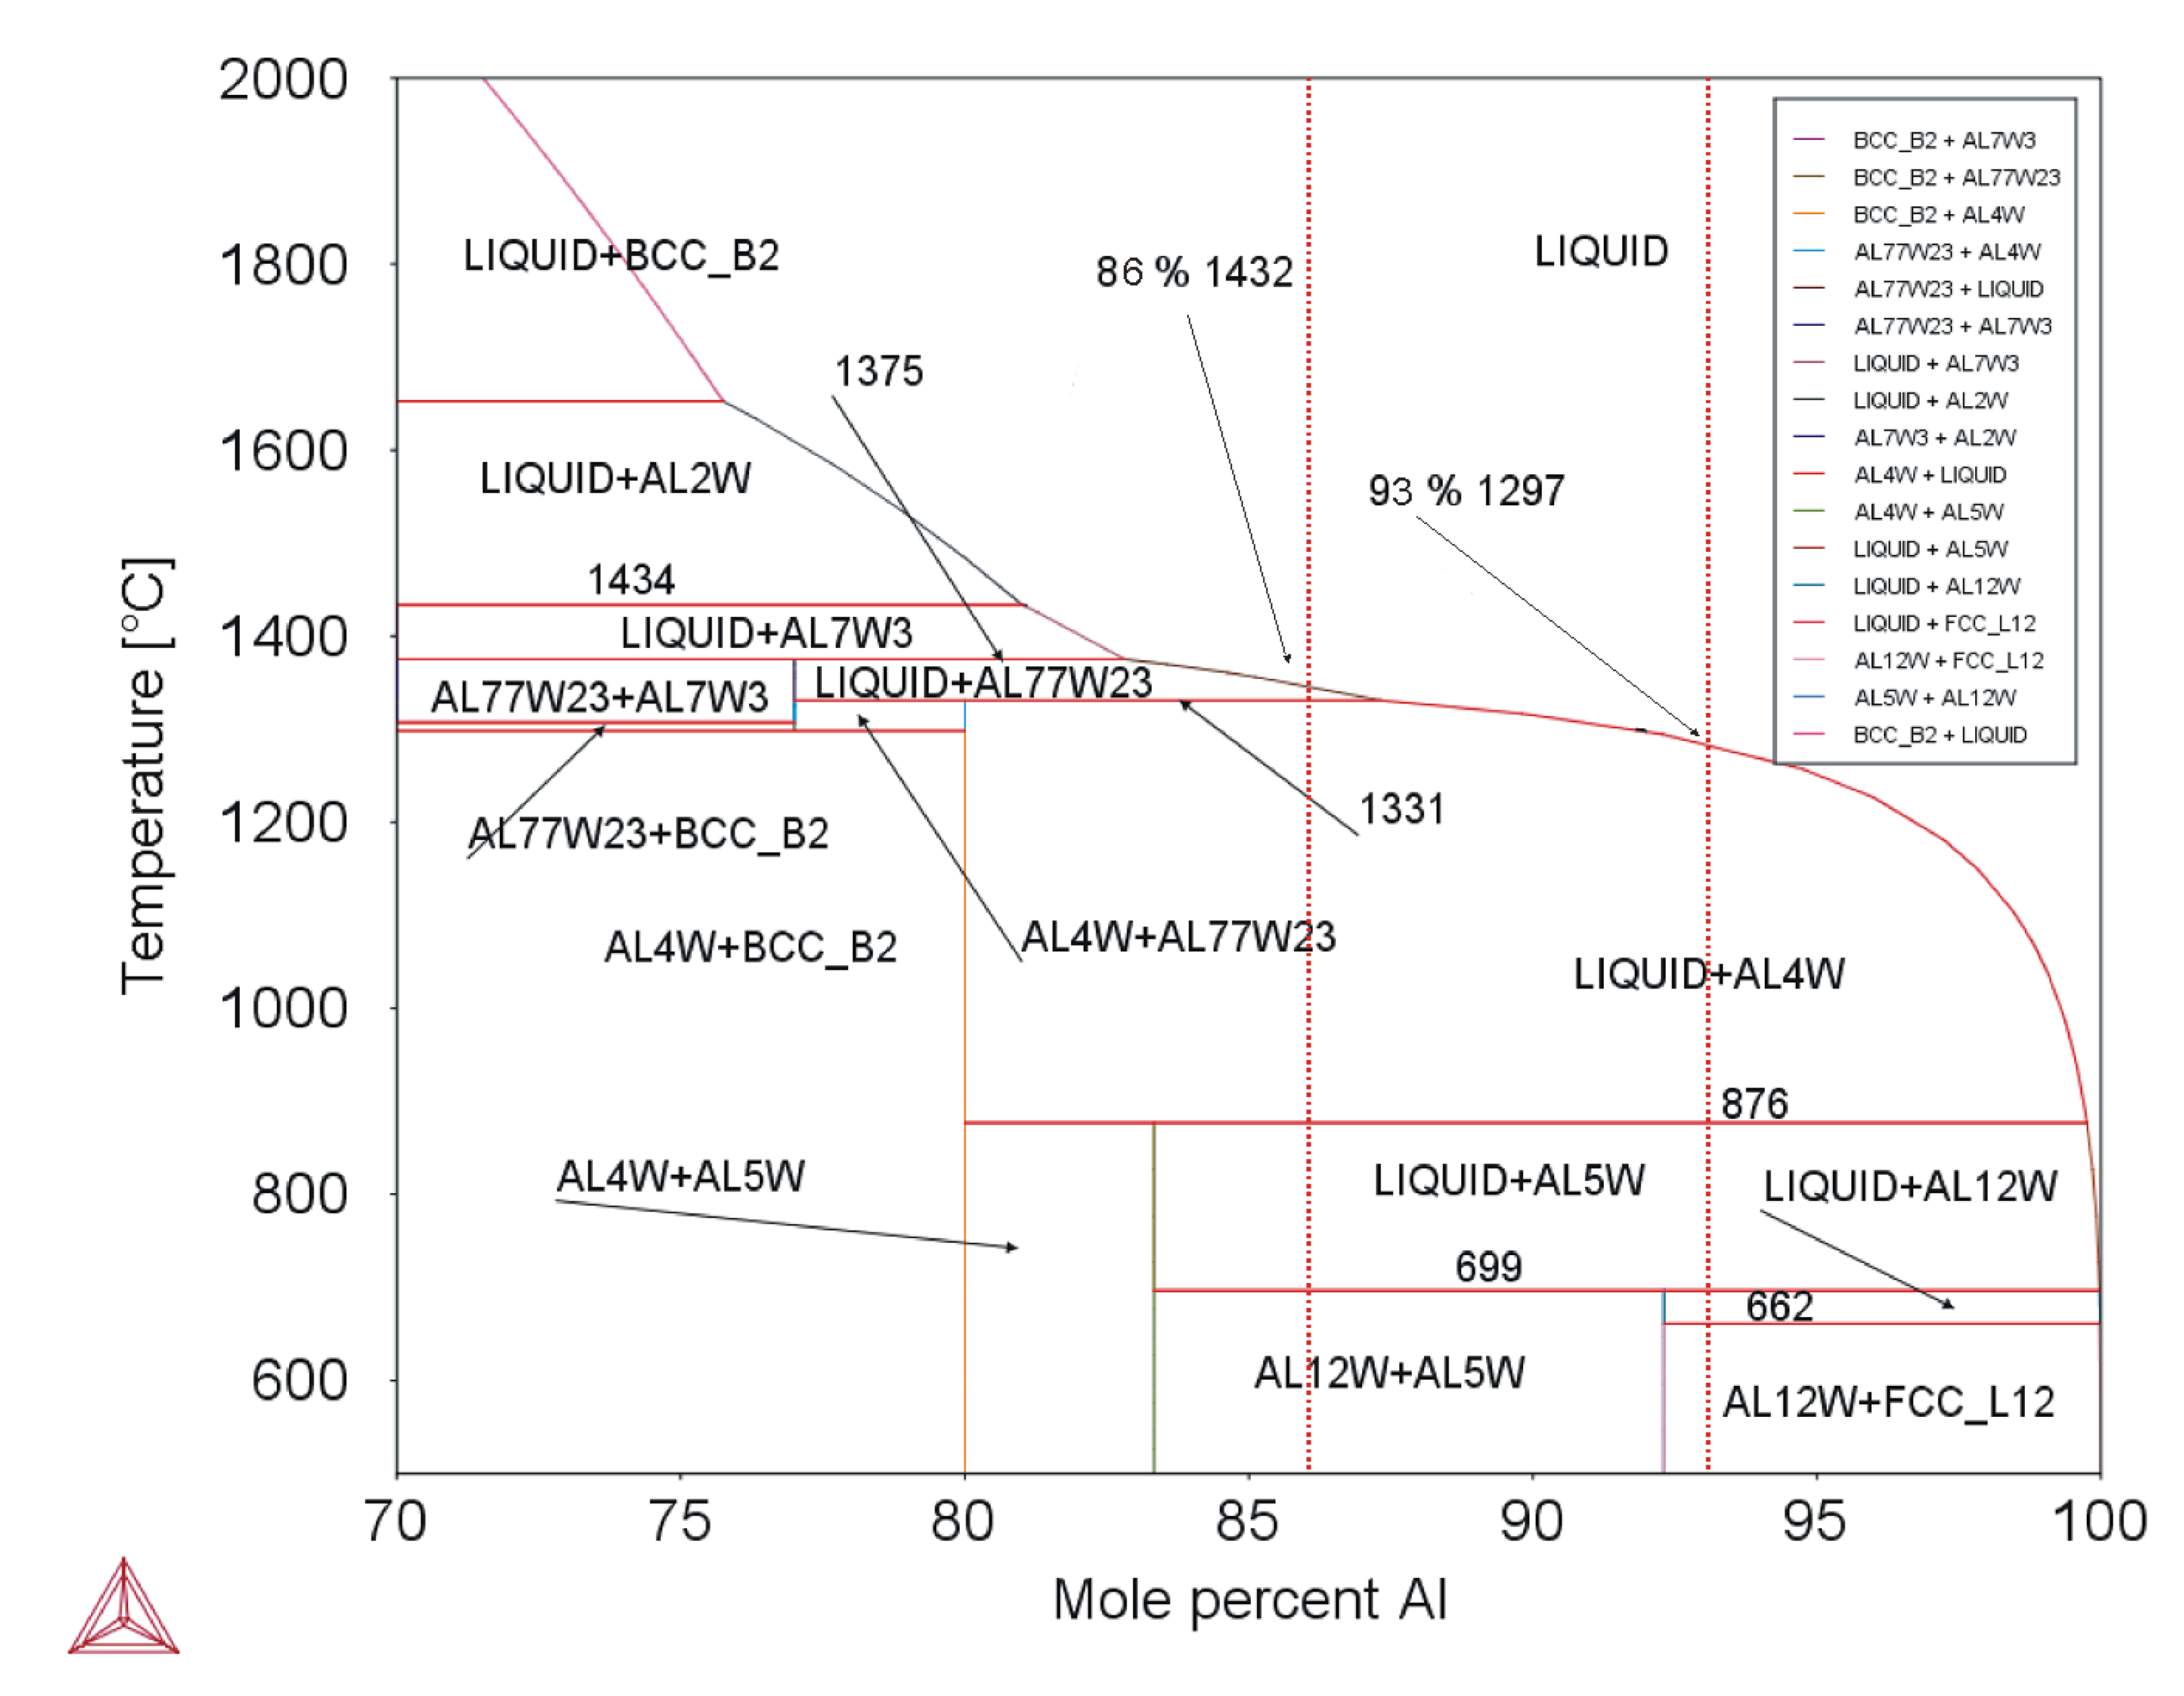
2.3.2. W–Al Alloys
3. Materials and Methods
4. Conclusions
- (1)
- Significant evaporation of Al was observed during all melting processes, which affected the resulting chemical composition.
- (2)
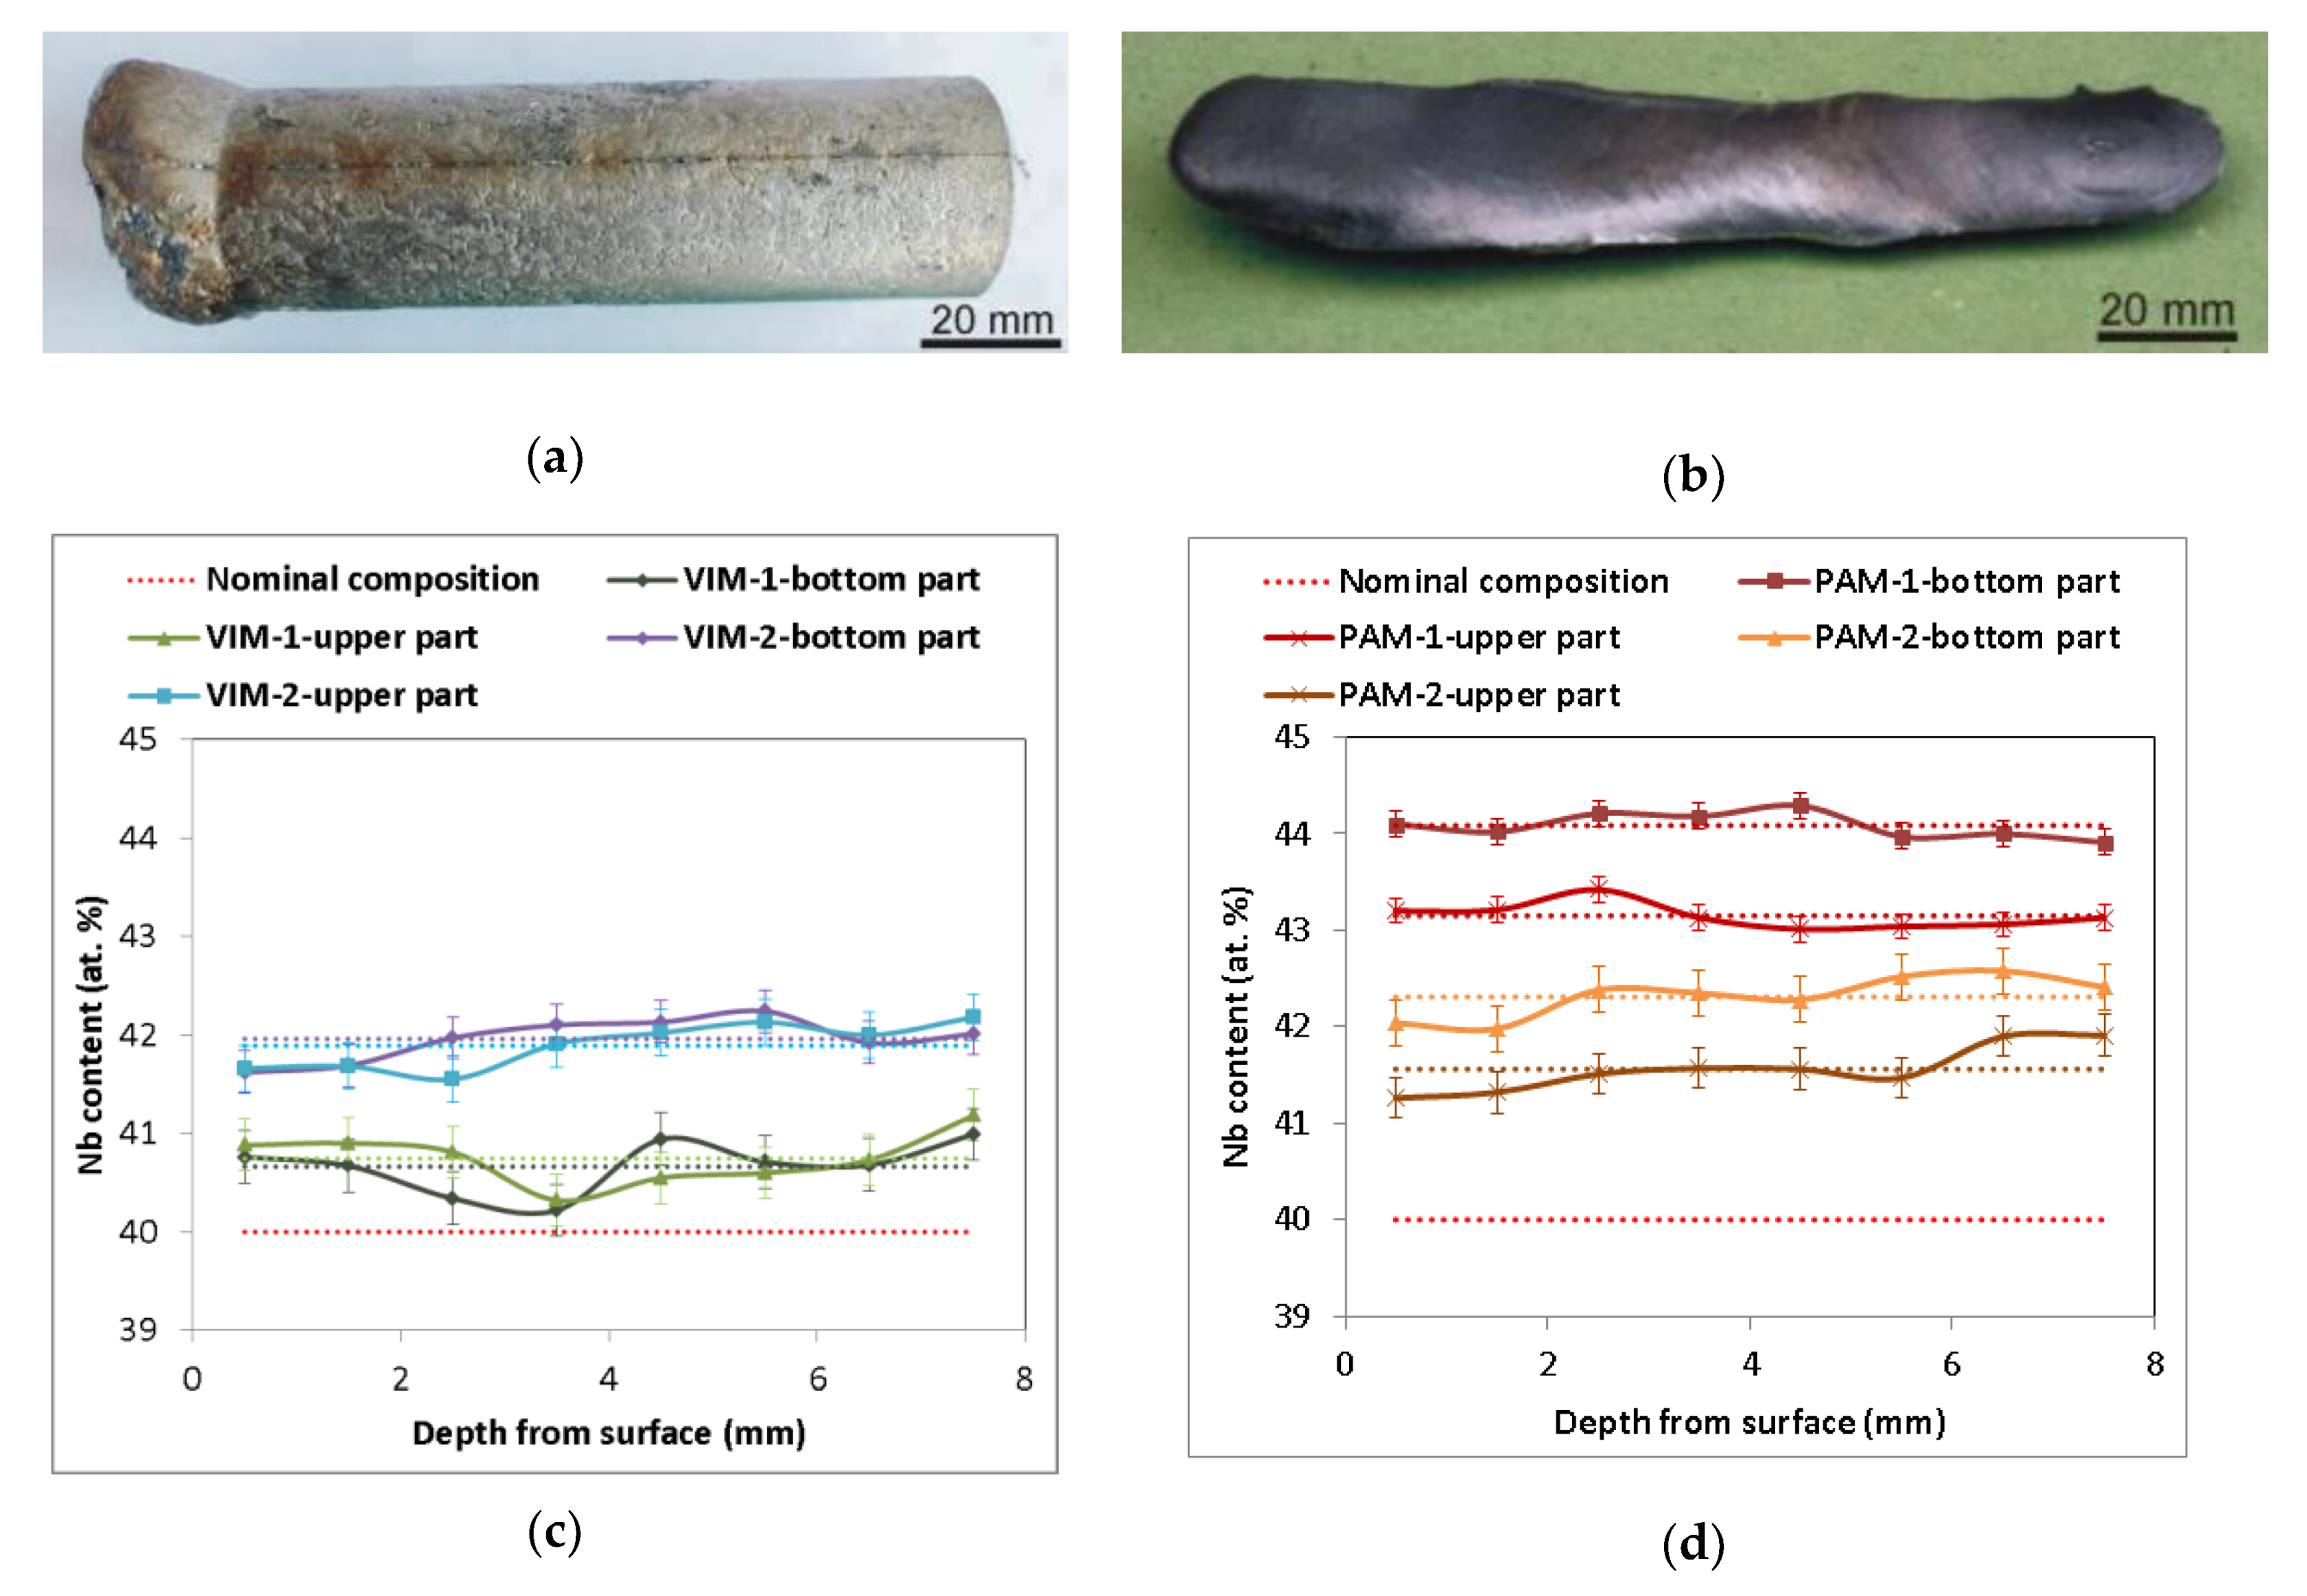
- Alloys of 40Nb–60Al (at.%) with a weight of 420 g were prepared by VIM at a temperature of 1600 °C with a stabilization time of 60 and 120 s. The alloys exhibited homogeneous composition and low levels of O and N.
- (3)
- Alloys of 40Nb–60Al with a weight of 160 g were prepared by PAM. The prepared alloys exhibited inhomogeneous composition (difference of about 1% between the bottom and top of the ingot), which was not removed by further re-melts.
- (4)
- PAM did not allow preparation of intermetallic compounds based on W–Al because the microstructure showed residues of non-molten W parts in the castings.
- (5)
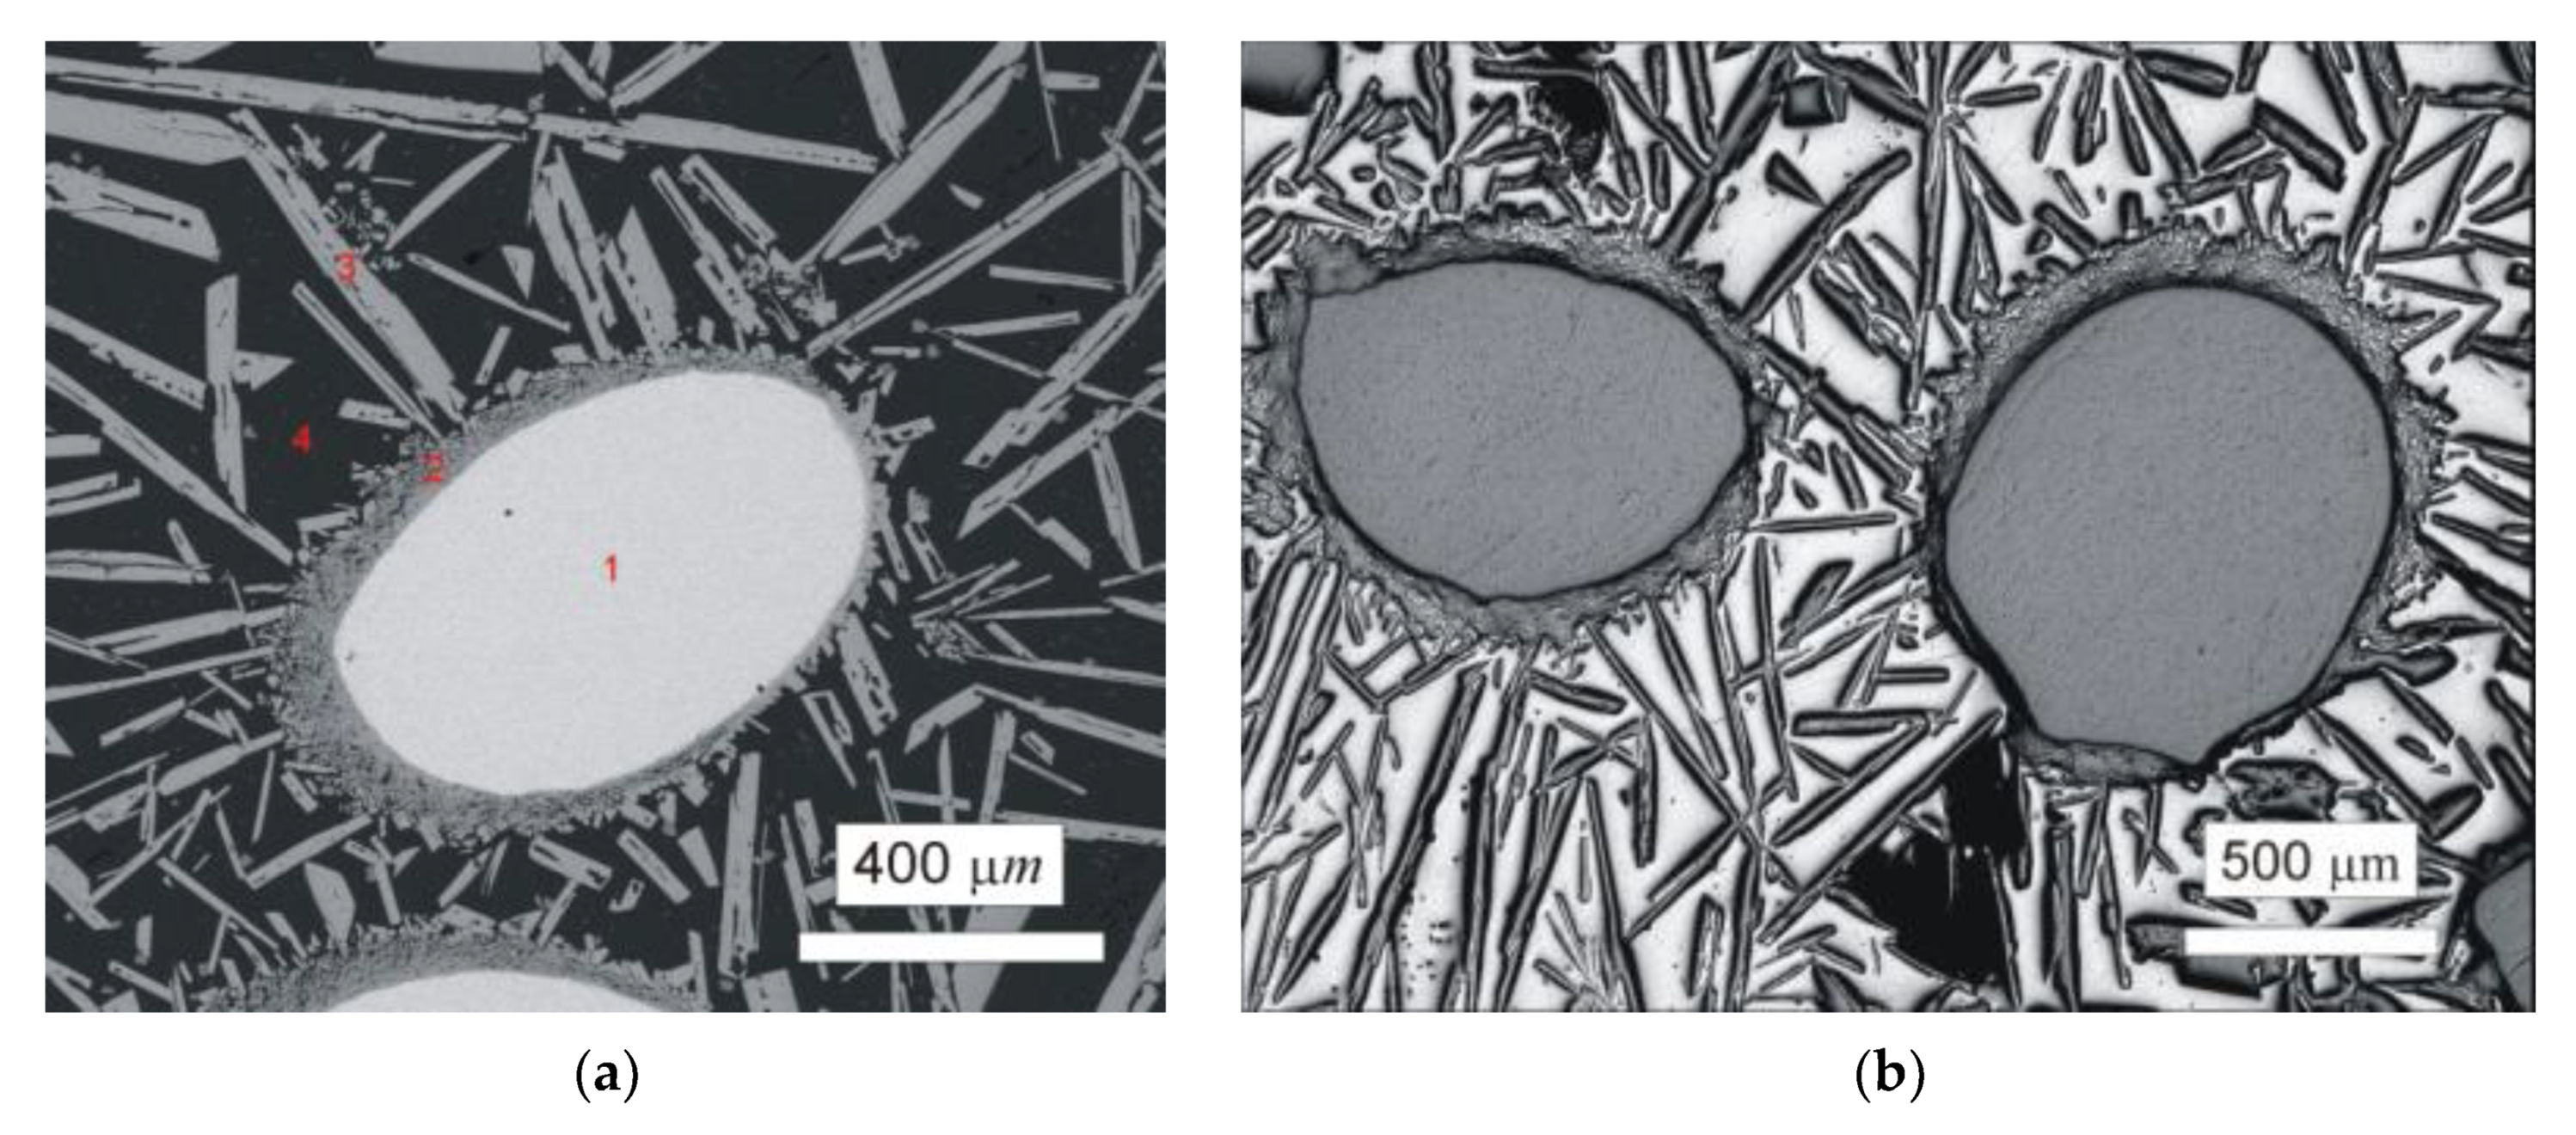
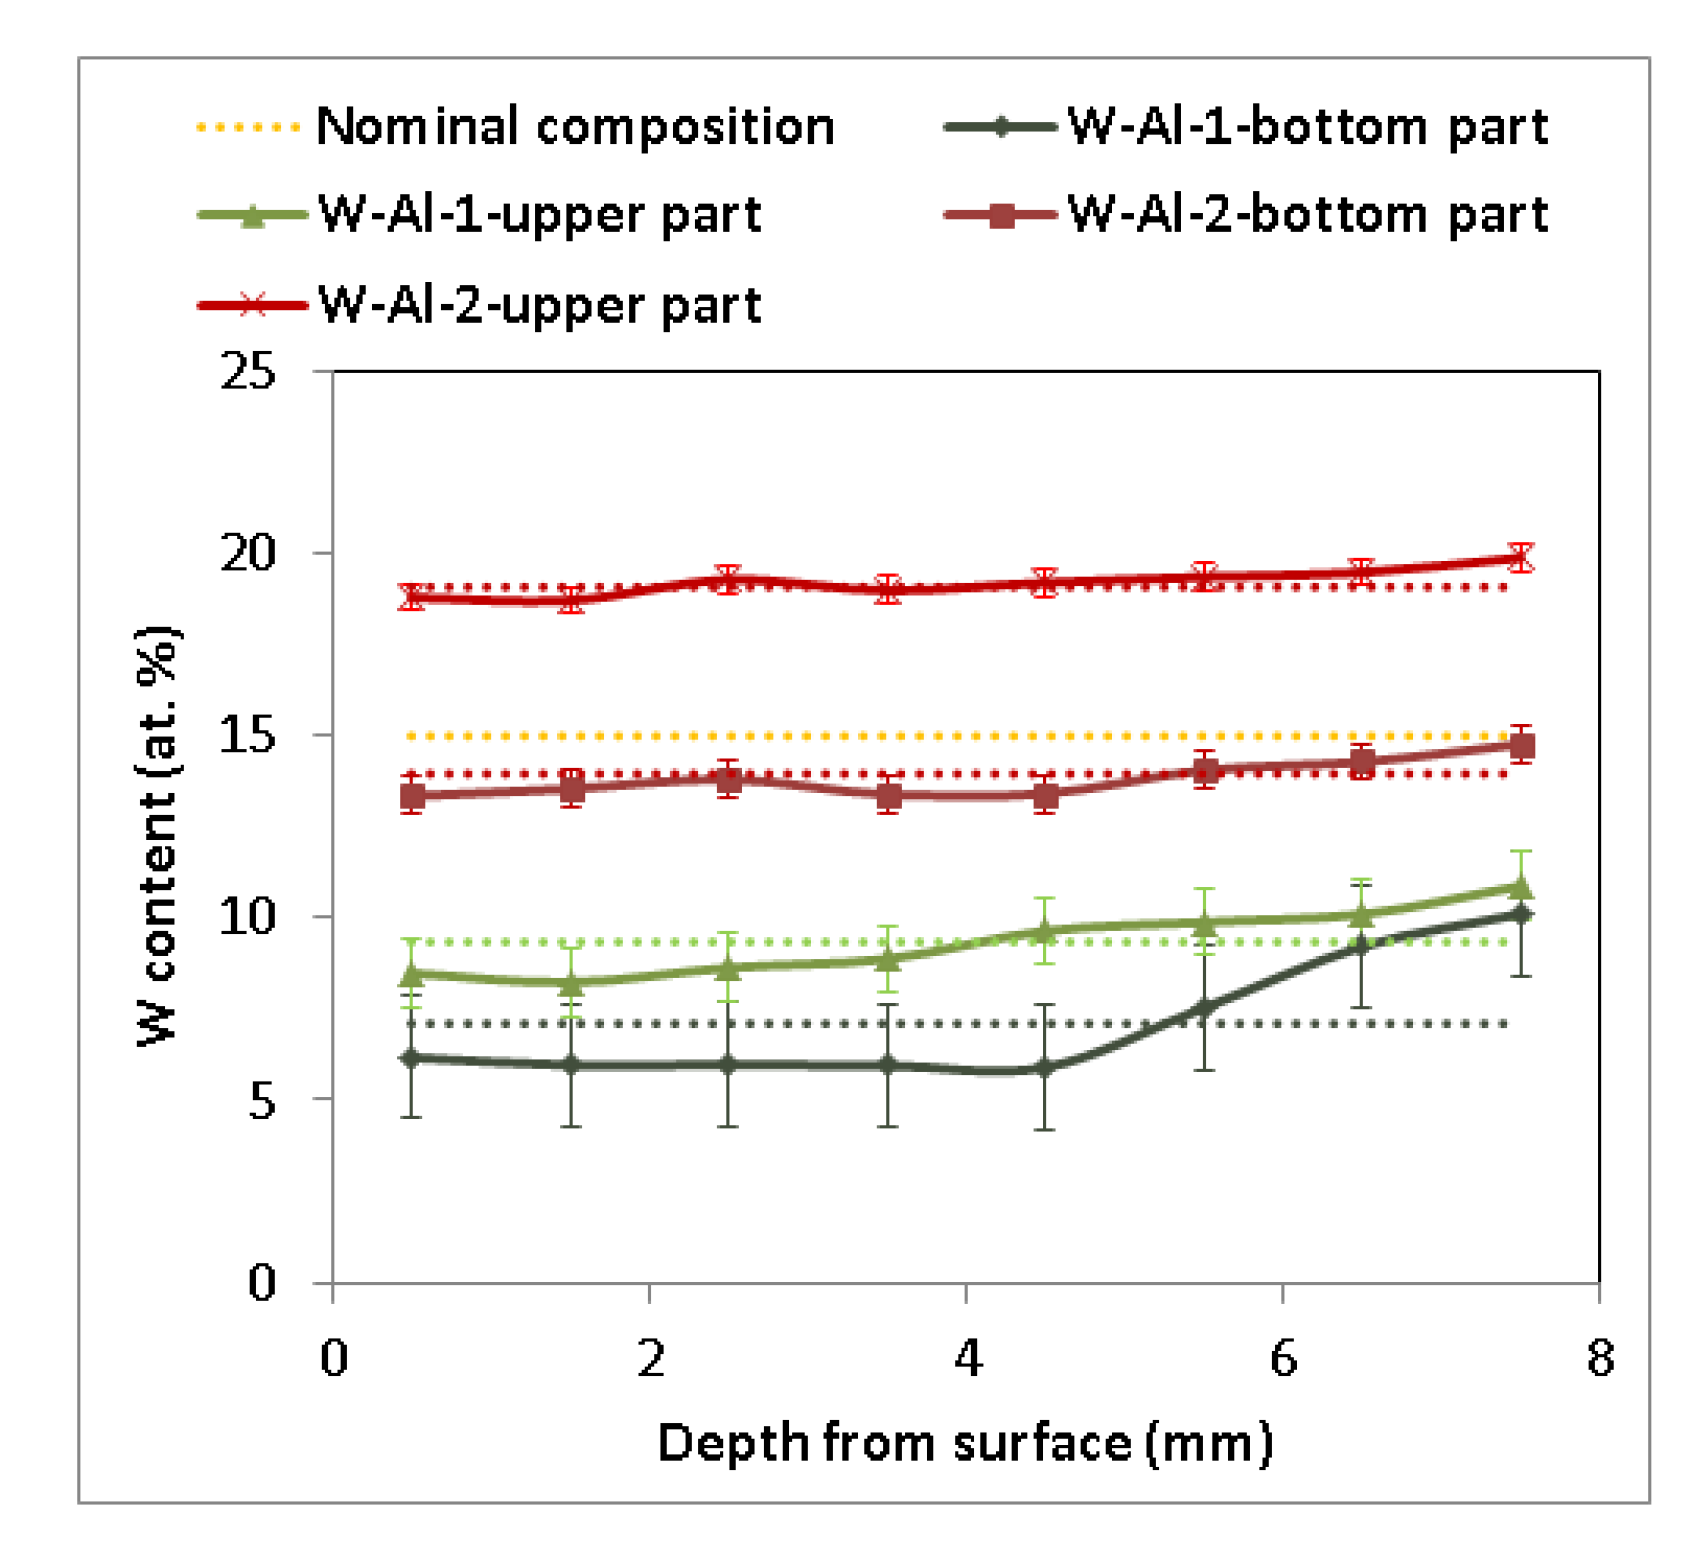
- VIM allowed the preparation of a W–Al intermetallic compounds with a weight of 420 g, a W content up to 10 at.% and without non-melted W parts. However, the chemical composition at the bottom and top of the ingot showed a significant difference up to 2 at.%.
- (6)
- The combination of PAM and VIM allowed the preparation of W–Al intermetallic compounds with a weight of 420 g, containing W up to 19 at.%. However, the chemical composition at the bottom and top of the ingot showed a significant difference of up to 5 at.%.
- (7)
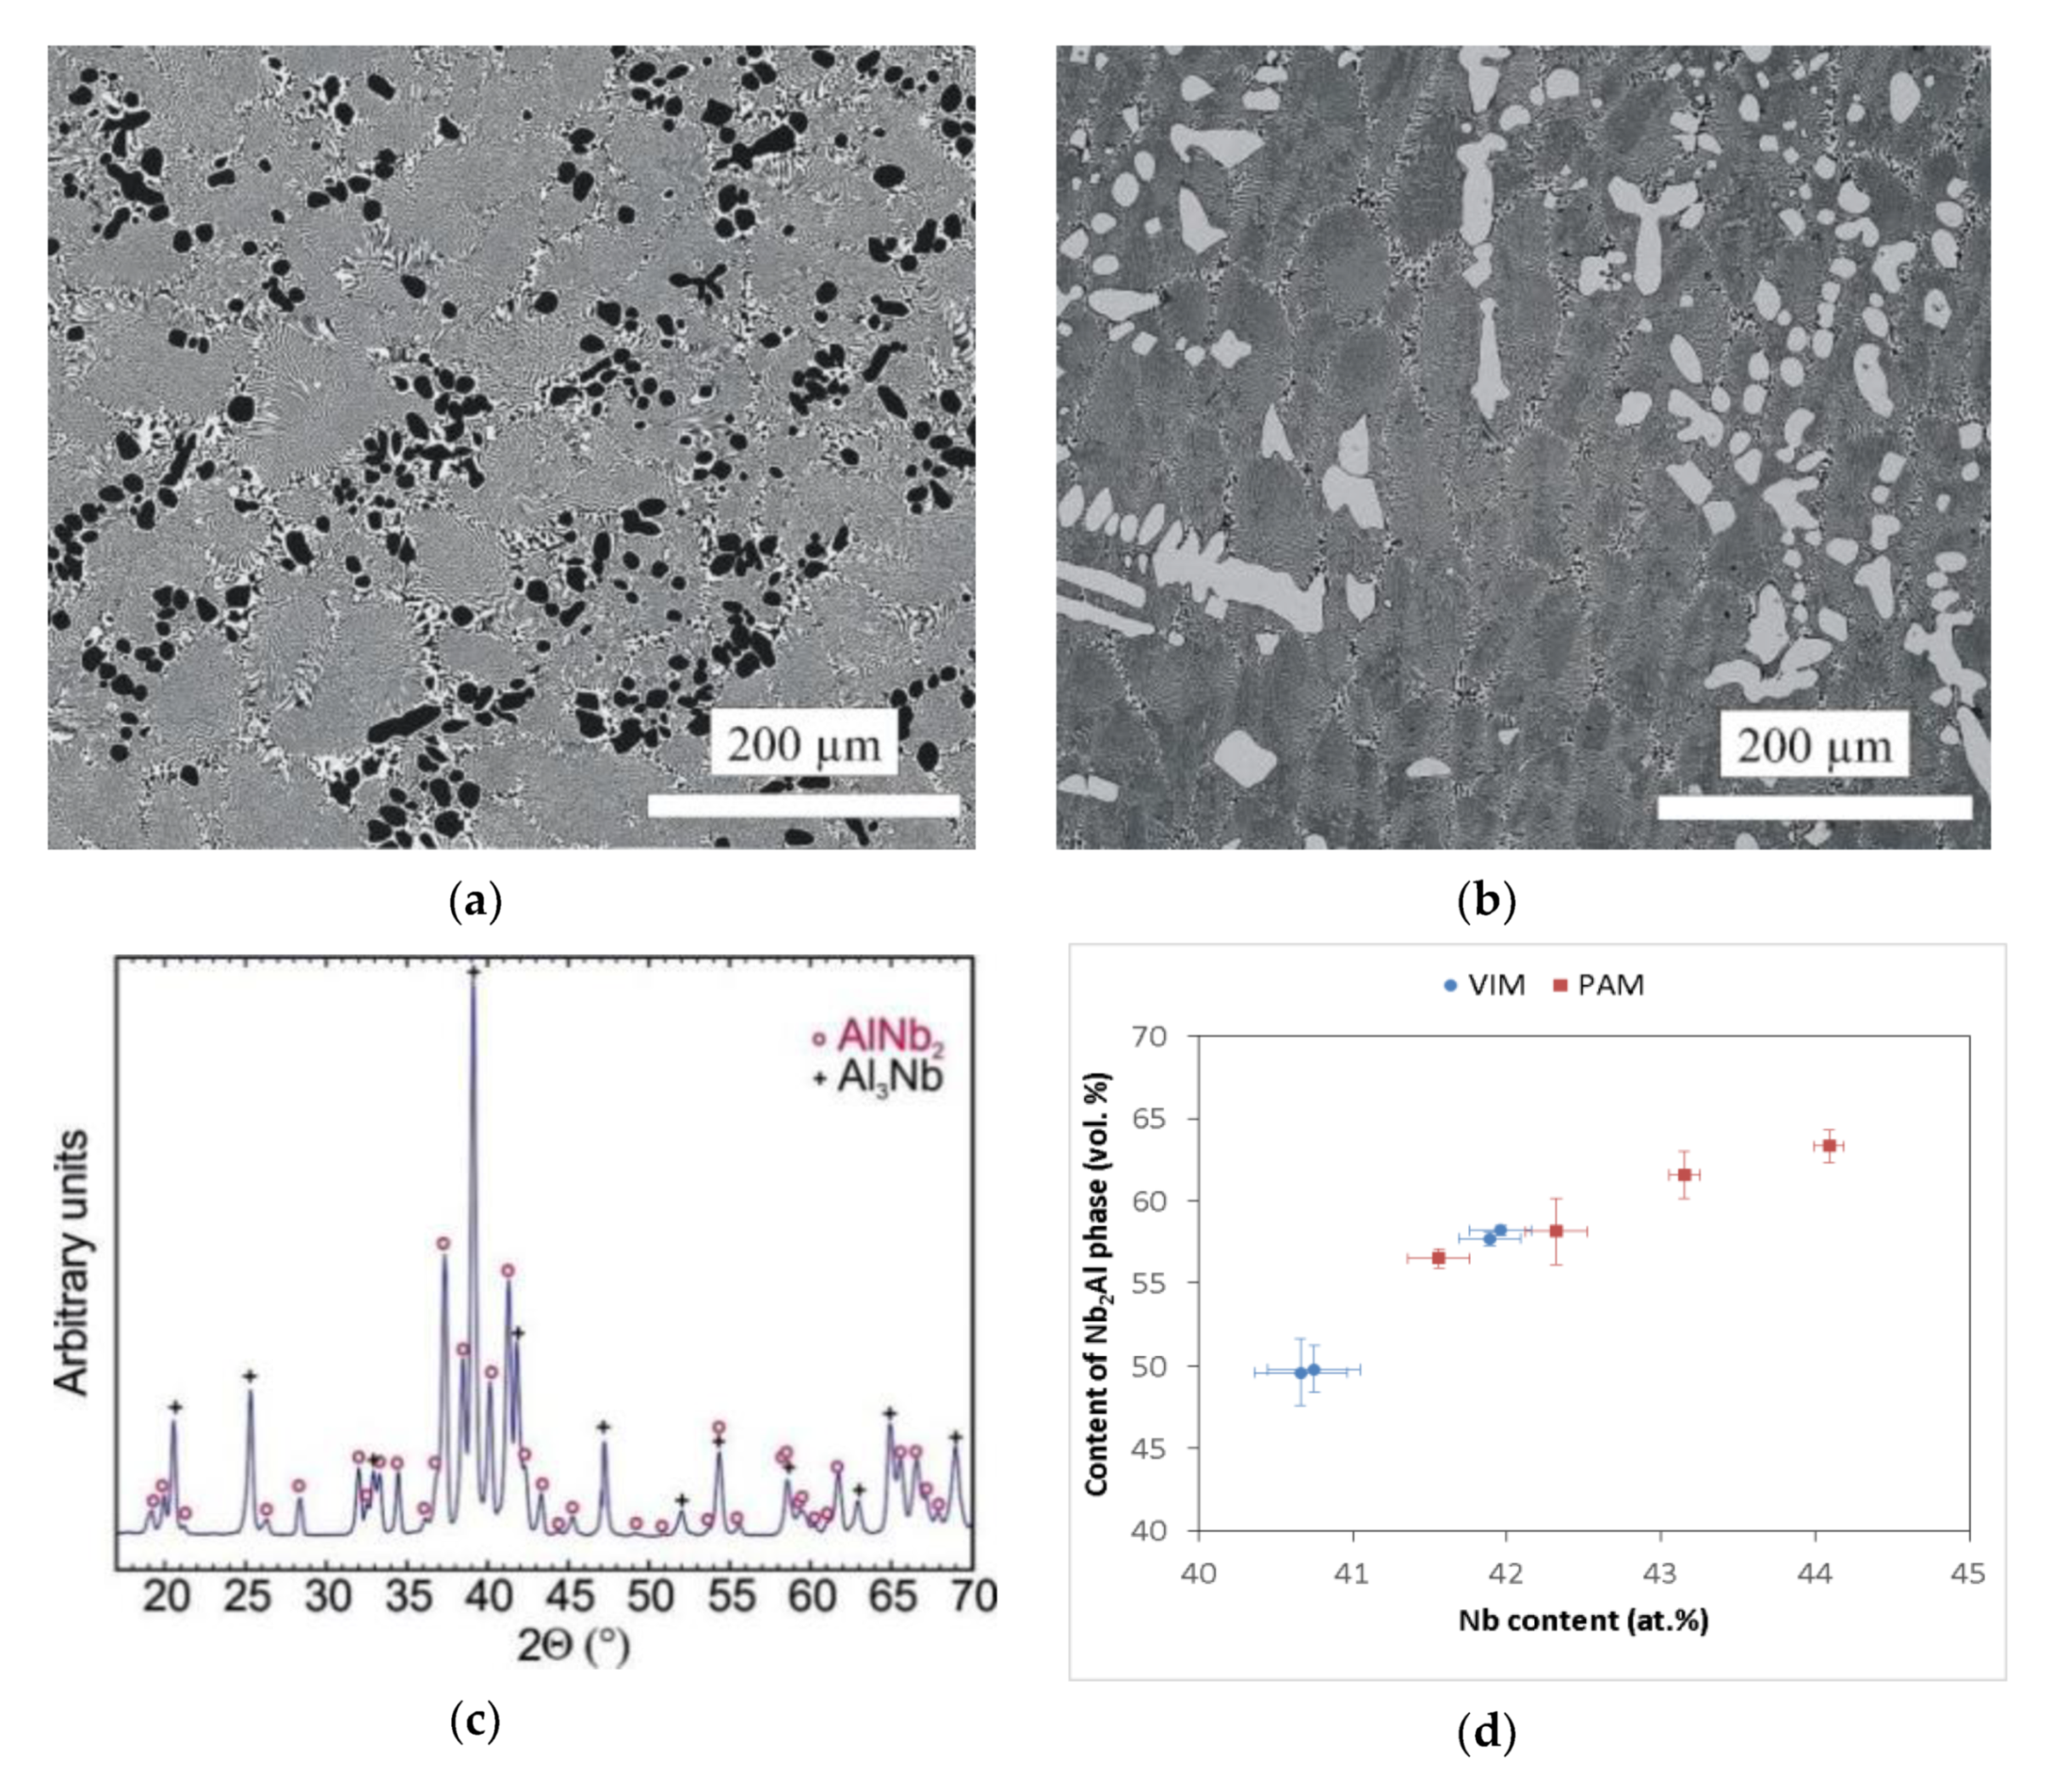
- The microstructure of Nb–Al alloys consisted of Nb2Al and Nb2Al, NbAl3 eutectic for compounds with Nb content up to 41 at.%. The compound with a lower content of Nb consisted of NbAl3 phase and Nb2Al, NbAl3 eutectic.
- (8)
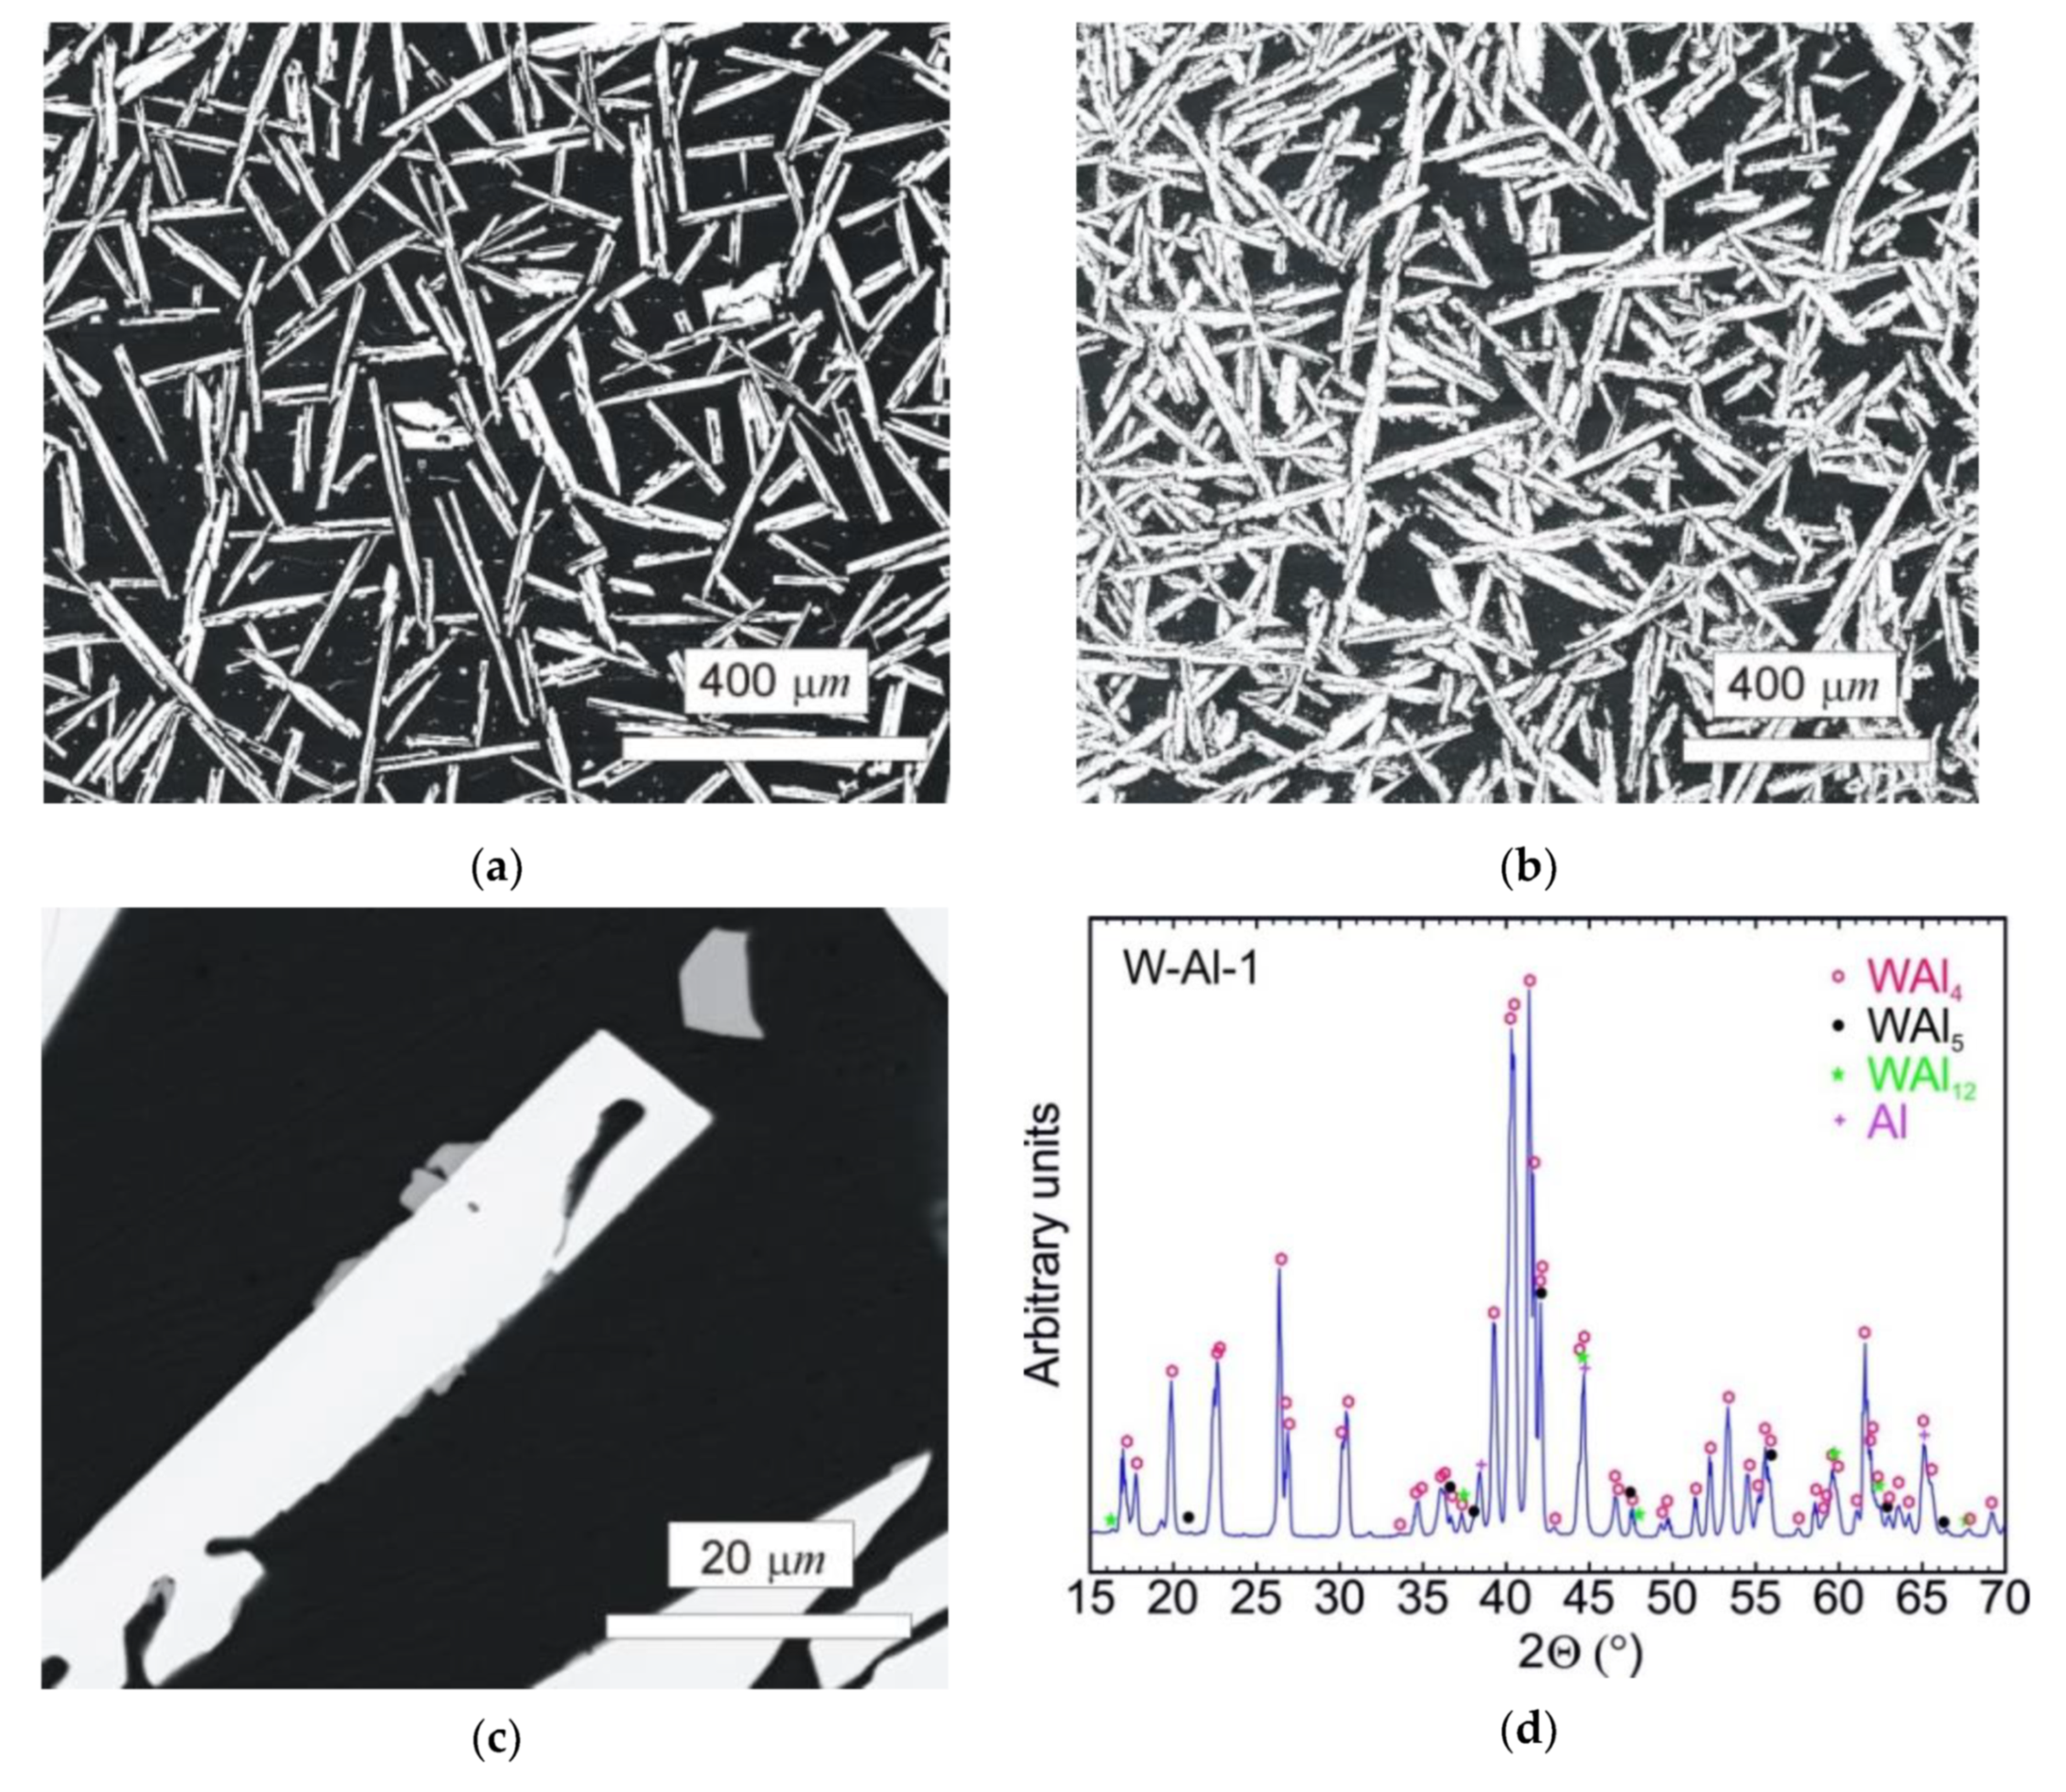
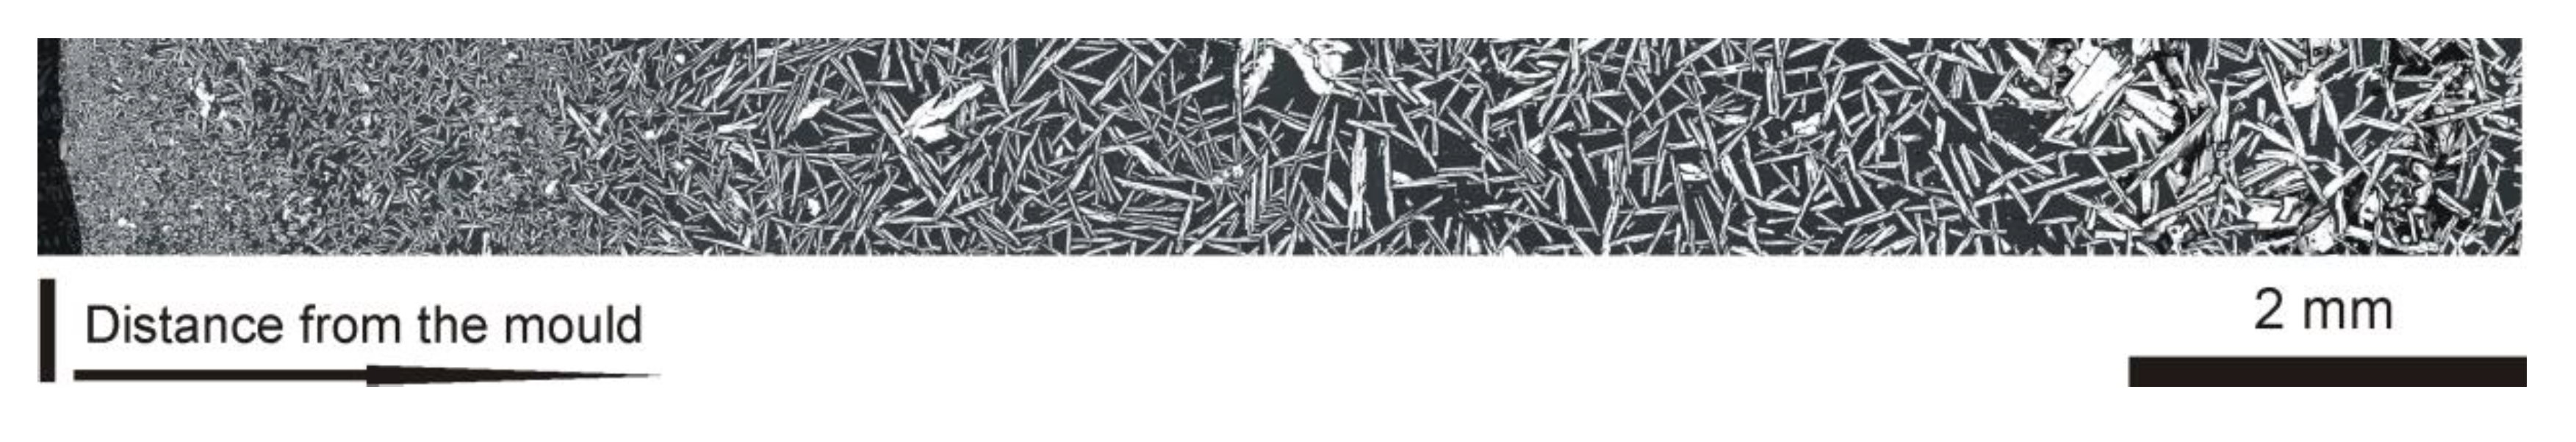
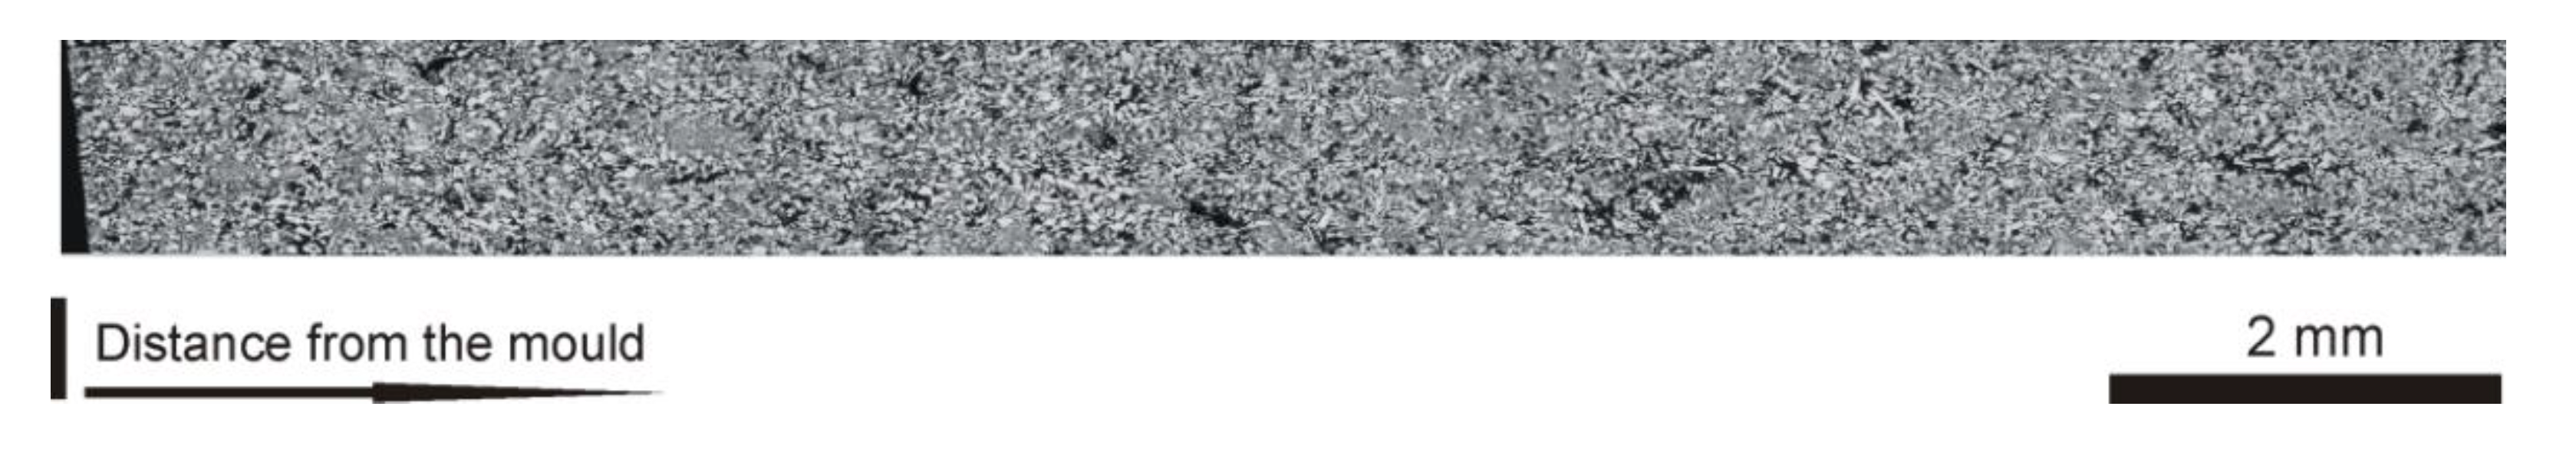
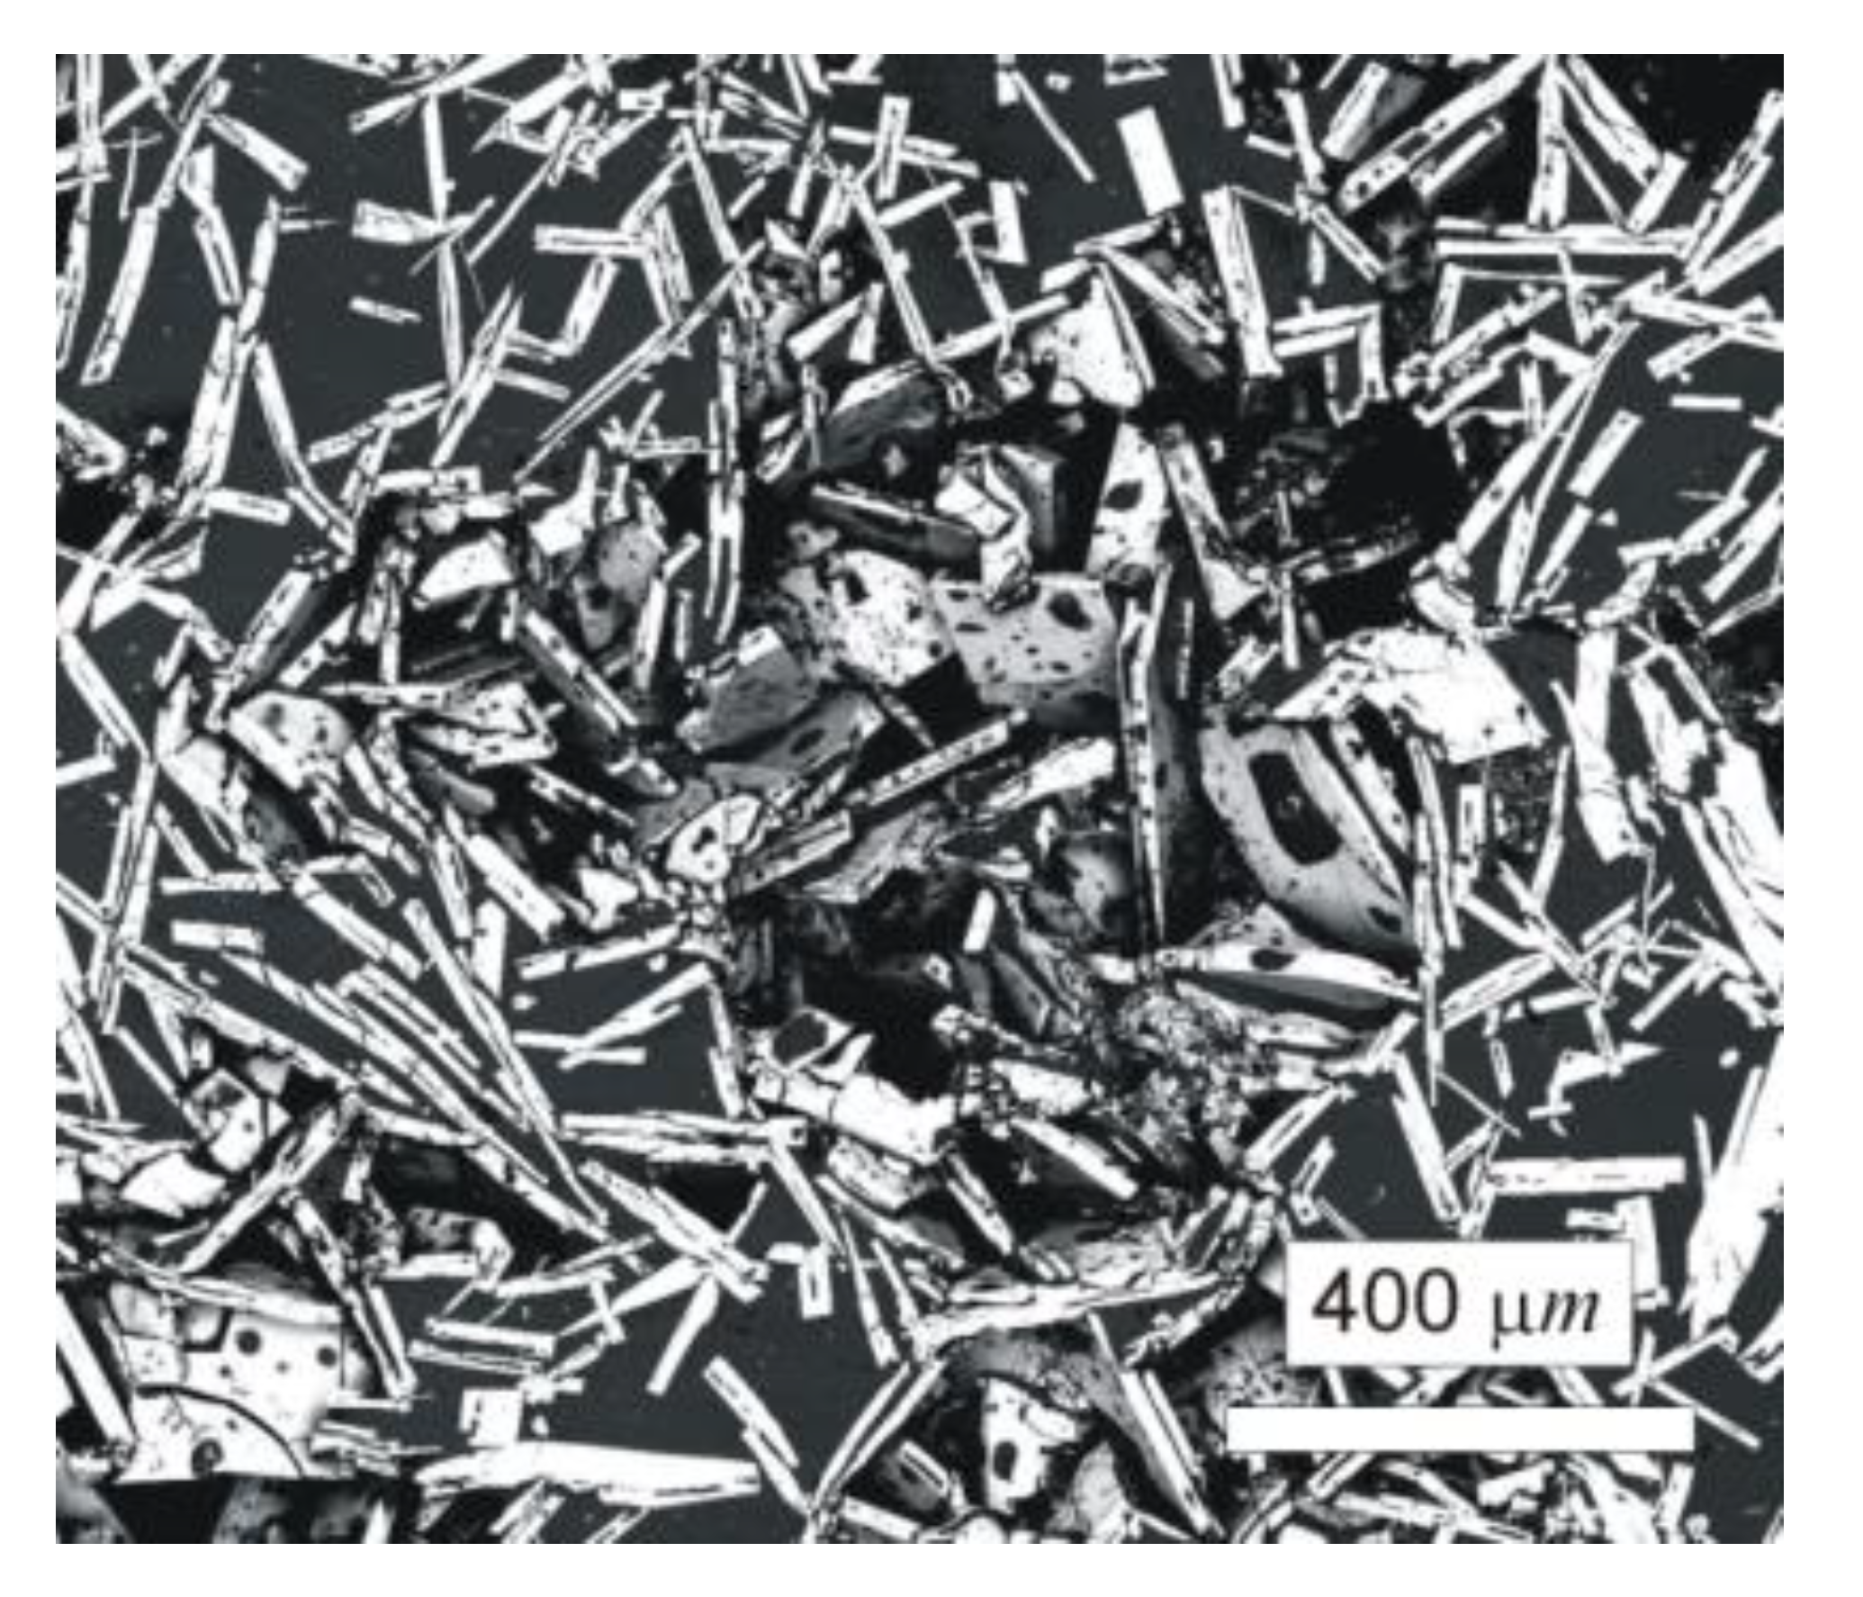
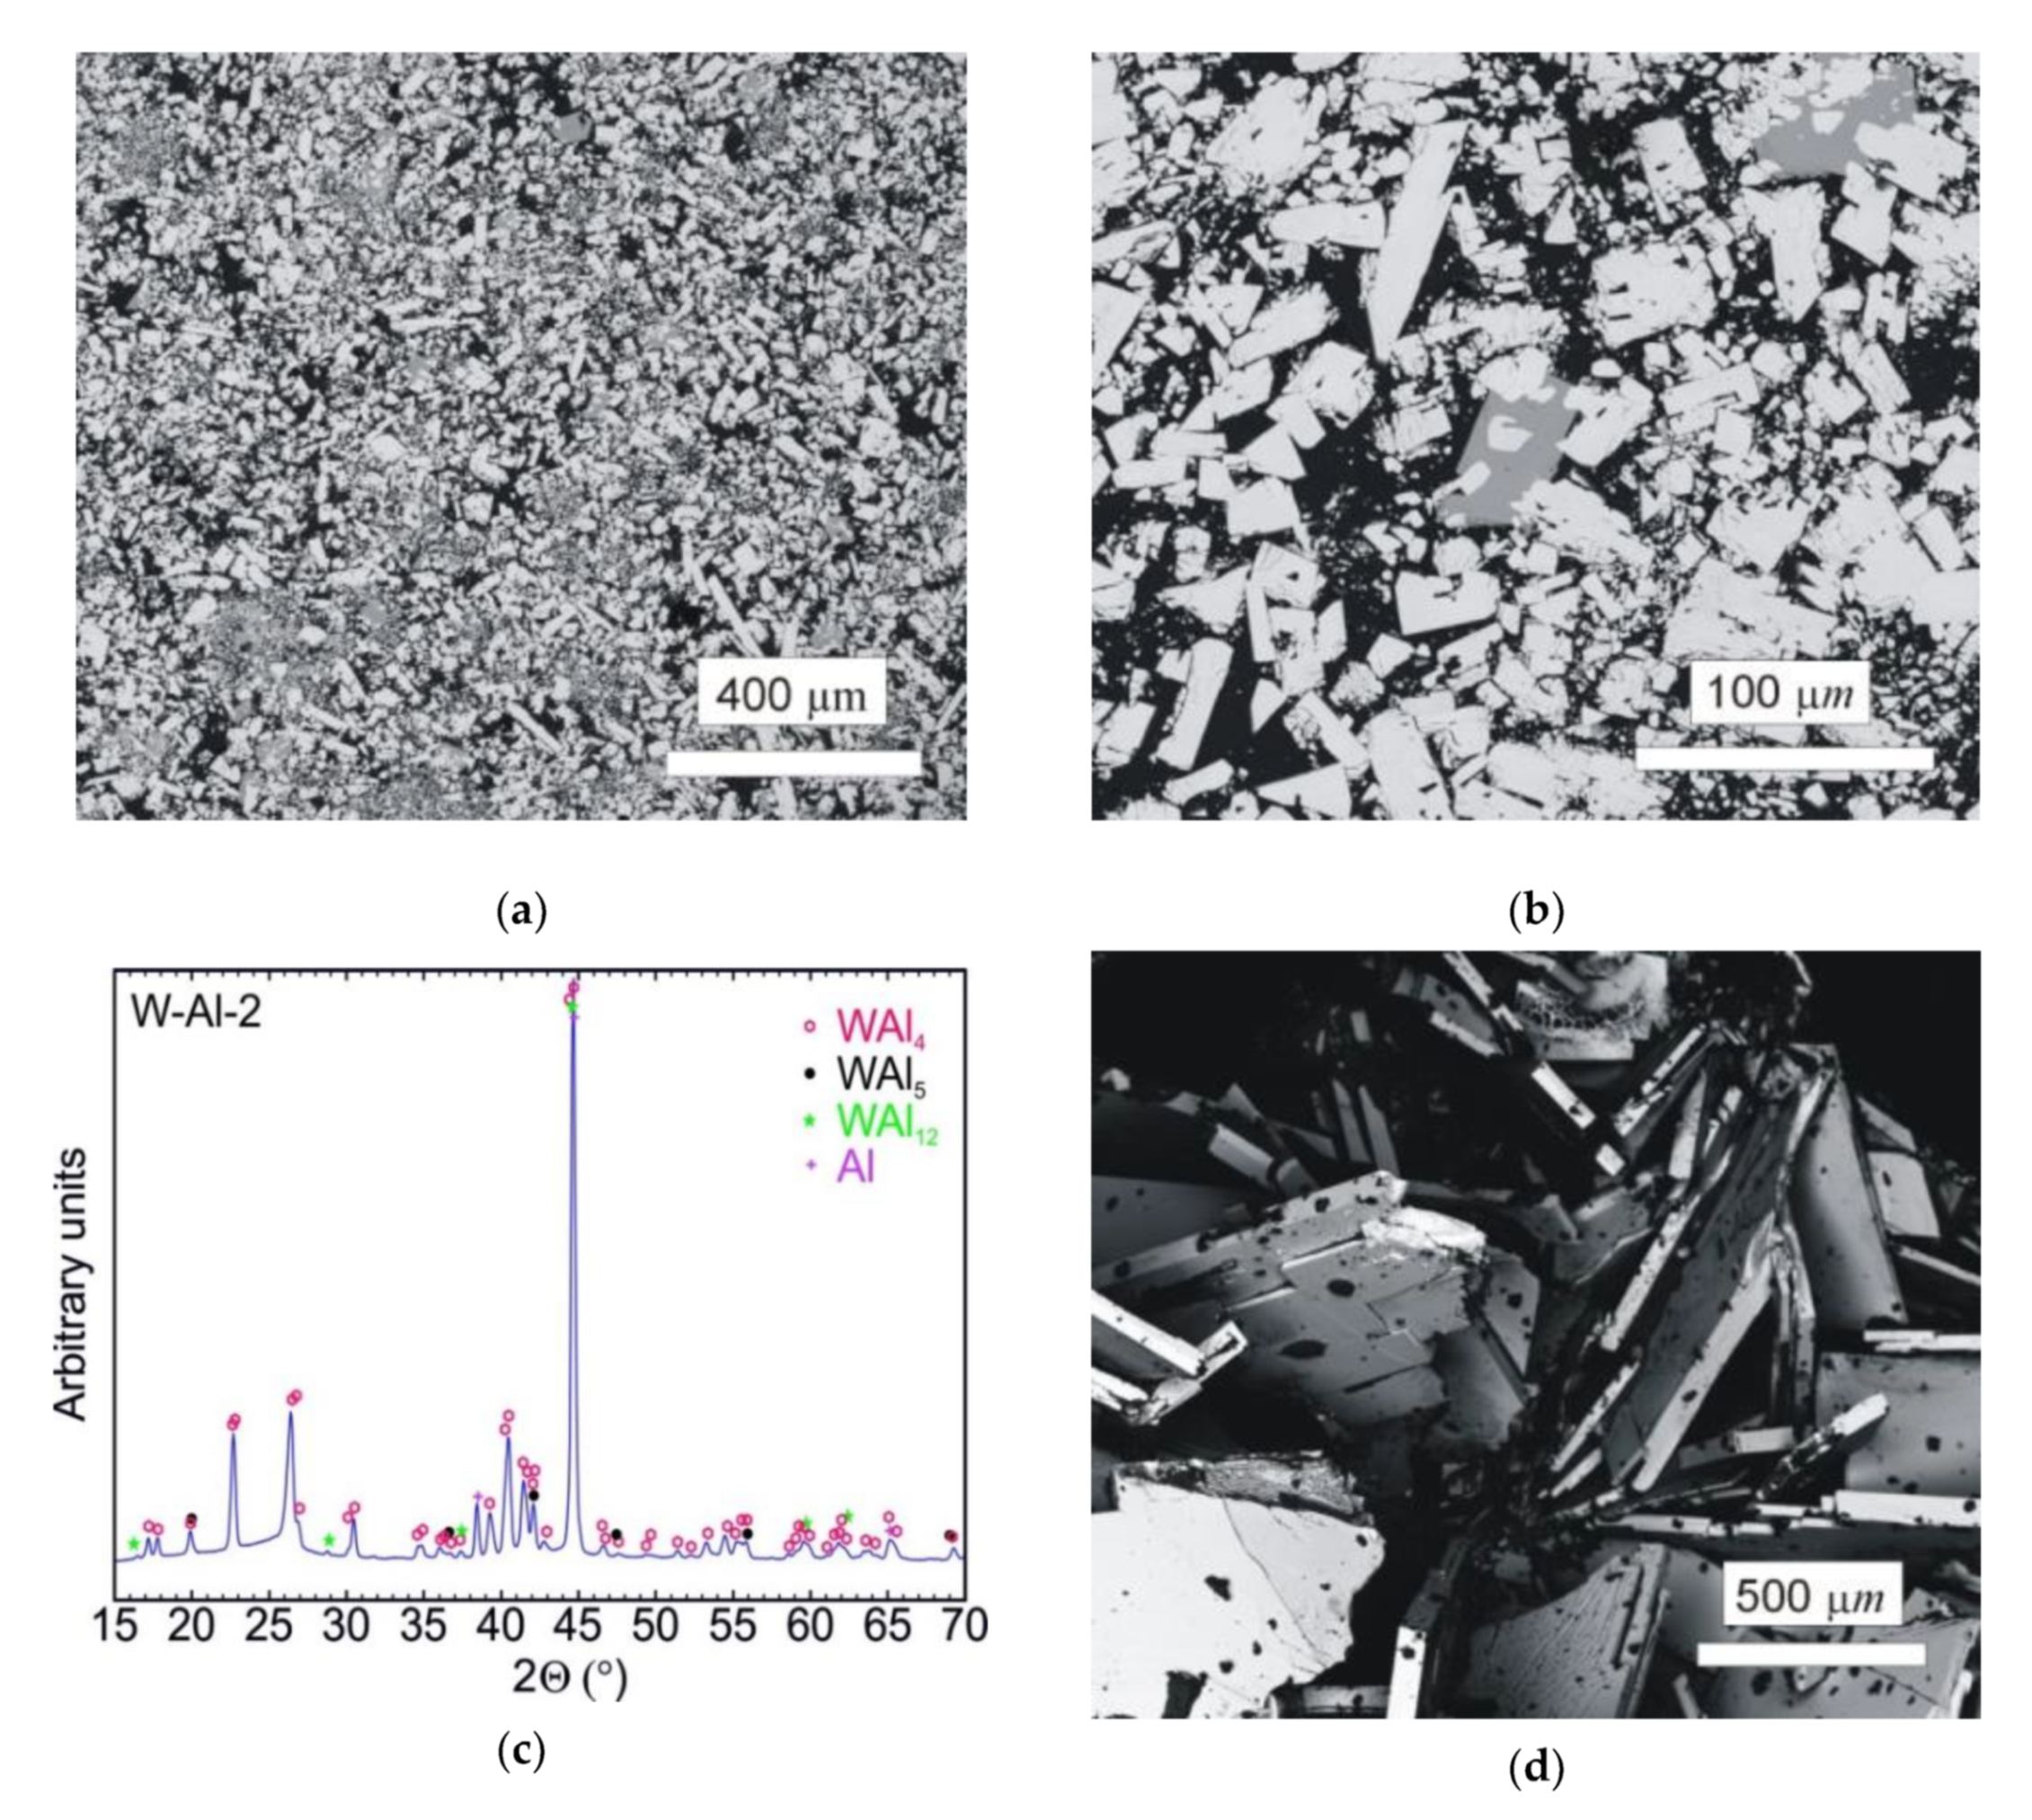
- The microstructure of W–Al alloys consisted of WAl4 and WAl12 phases in Al matrix.
- (9)
- The size, shape, and content of the WA14 phases in the structure exhibited significant differences depending on the cooling rate after casting.
Author Contributions
Funding
Conflicts of Interest
References
- Hanada, S. Intermetallics: Niobium aluminides. In Encyclopedia of Materials: Science and Technology, 2nd ed.; Elsevier: Amsterdam, The Netherlands, 2001; pp. 4232–4236. [Google Scholar]
- Hanada, S. Niobium aluminides. Curr. Opin. Solid State Mater. Sci. 1997, 2, 279–283. [Google Scholar] [CrossRef]
- Yan, X.; Fray, D.J. Synthesis of niobium aluminides by electro-deoxidation of oxides. J. Alloy. Compd. 2009, 486, 154–161. [Google Scholar] [CrossRef]
- Glowacki, B. Niobium aluminide as a source of high-current superconductors. Intermet. 1999, 7, 117–140. [Google Scholar] [CrossRef]
- Peng, L. Synthesis and mechanical properties of niobium aluminide-based composites. Mater. Sci. Eng. A 2008, 480, 232–236. [Google Scholar] [CrossRef]
- Sina, H.; Iyengar, S. Studies on the formation of aluminides in heated Nb–Al powder mixtures. J. Alloy. Compd. 2015, 628, 9–19. [Google Scholar] [CrossRef]
- Gauthier, V.; Josse, C.; Bernard, F.; Gaffet, E.; Larpin, J. Synthesis of niobium aluminides using mechanically activated self-propagating high-temperature synthesis and mechanically activated annealing process. Mater. Sci. Eng. A 1999, 265, 117–128. [Google Scholar] [CrossRef]
- Loser, W.; Hermann, R.; Leonhardt, M.; Stephan, D.; Bormann, R. Metastable phase transformation in undercooled near-eutectic Nb-Al alloys. Mater. Sci. Eng. A 1997, 224, 53–60. [Google Scholar] [CrossRef]
- Zhang, H.; Feng, P.; Akhtar, F. Aluminium matrix tungsten aluminide and tungsten reinforced composites by solid-state diffusion mechanism. Sci. Rep. 2017, 7, 12391. [Google Scholar] [CrossRef] [PubMed]
- Chen, D.; Chen, Z.; Cai, J.; Chen, Z. Preparation of W–Al intermetallic compound powders by a mechanochemical approach. J. Alloy. Compd. 2008, 461, L23–L25. [Google Scholar] [CrossRef]
- Unuvar, C.; Fredrick, D.; Anselmi-Tamburini, U.; Shaw, B.; Manerbino, A.; Guigné, J.; Munir, Z. Dissolution and precipitation under gravitational conditions in the W–Al system. Intermetallics 2007, 15, 363–370. [Google Scholar] [CrossRef]
- Unuvar, C.; Fredrick, D.; Anselmi-Tamburini, U.; Shaw, B.; Manerbino, A.; Guigné, J.; Munir, Z. Gravity effects on reactive settling in the Al–W system in SHS. Intermetallics 2007, 15, 294–304. [Google Scholar] [CrossRef]
- Dembovsky, V. Plasma Metallurgy: The Principles, SNTL, Praha; Elsevier: Amsterdam, The Netherlands, 1985; ISBN 978-0444996039. [Google Scholar]
- Frkanova, K.; Lapin, J. Relationship between microstructure and cooling rate in air-hardenable TiAl-based alloy. In Proceedings of the METAL 2012: International Conference on Metallurgy and Materials, Brno, Czech Republic, 23–25 May 2012; pp. 1227–1233, ISBN 978-80-87294-29-1. [Google Scholar]
- Gomes, F.; Barbosa, J.; Ribeiro, C.A.S. Aluminium Evaporation during Ceramic Crucible Induction Melting of Titanium Aluminides. Mater. Sci. Forum 2012, 730, 697–702. [Google Scholar] [CrossRef]
- Yanqing, S.; Jingjie, G.; Jun, J.; Guizhong, L.; Yuan, L. Composition control of a TiAl melt during the induction skull melting (ISM) proces. J. Alloys Compd. 2002, 334, 261–266. [Google Scholar] [CrossRef]
- Blacha, L.; Siwiec, G.; Oleksiak, B. Loss of aluminium during the process of Ti-Al-V alloys melting in a vacuum induction melting (VIM) furnace. Metalurgija 2013, 52, 301–304. [Google Scholar]
- Kuchar, L.; Drapala, J. Metallurgy of Pure Metals; Cambridge International Science Publishing: Cambridge, UK, 2007; 190p, ISBN 9781904602033. [Google Scholar]
- Okamoto, H.; Massalski, T.B. Binary alloy phase diagrams requiring further studies. J. Phase Equilibria Diffus. 1994, 15, 500–521. [Google Scholar] [CrossRef]
- Kursa, M. TiAl Intermetallic Compounds and Alloys on Their Basis, 1st ed.; VSB—Technical University of Ostrava: Ostrava, Czech Republic, 2005; ISBN 80-248-0893-5. [Google Scholar]
- Andersson, J.-O.; Helander, T.; Höglund, L.; Shi, P.; Sundman, B. Thermo-Calc & DICTRA, computational tools for materials science. Calphad 2002, 26, 273–312. [Google Scholar] [CrossRef]
Sample Availability: Samples of the compounds Nb-Al and W-Al.are available from the authors. |


| Alloy | Nominal Composition (at.%) | Method Used | Number of Passes | Melting Temperature (°C)/Stabilization Time (s) | Weight of Charge (g) |
|---|---|---|---|---|---|
| Nb–Al-VIM-1 | 40Nb-60Al | Vacuum induction melting | – | 1600/60 | 420 |
| Nb–Al-VIM-2 | 40Nb-60Al | Vacuum induction melting | – | 1600/120 | 420 |
| Nb–Al-PAM-1 | 40Nb-60Al | Plasma arc melting | 4 | – | 160 |
| Nb–Al-PAM-2 | 40Nb-60Al | Plasma arc melting | 2 | – | 160 |
| W–Al-VIM-1 | 15W-85Al | Vacuum induction melting | – | 1600/240 | 420 |
| W–Al-PAM-1 | 15W-85Al | Plasma arc melting | 4 | – | 150 |
| W–Al-PAM-2 | 15W-85Al | Plasma arc melting | 6 | – | 150 |
| W–Al-PAM-3 | 15W-85Al | Plasma arc melting | 8 | – | 150 |
| W–Al-VIM-2 | 15W-85Al | Plasma arc melting + vacuum induction melting | 6 | 1500/30 | 420 |
| Area | Content of W (at.%) |
|---|---|
| 1 | 99.4 ± 0.5 |
| 2 | 9.7 ± 0.4 |
| 3 | 19.9 ± 0.5 |
| 4 | 0.15 ± 0.06 |
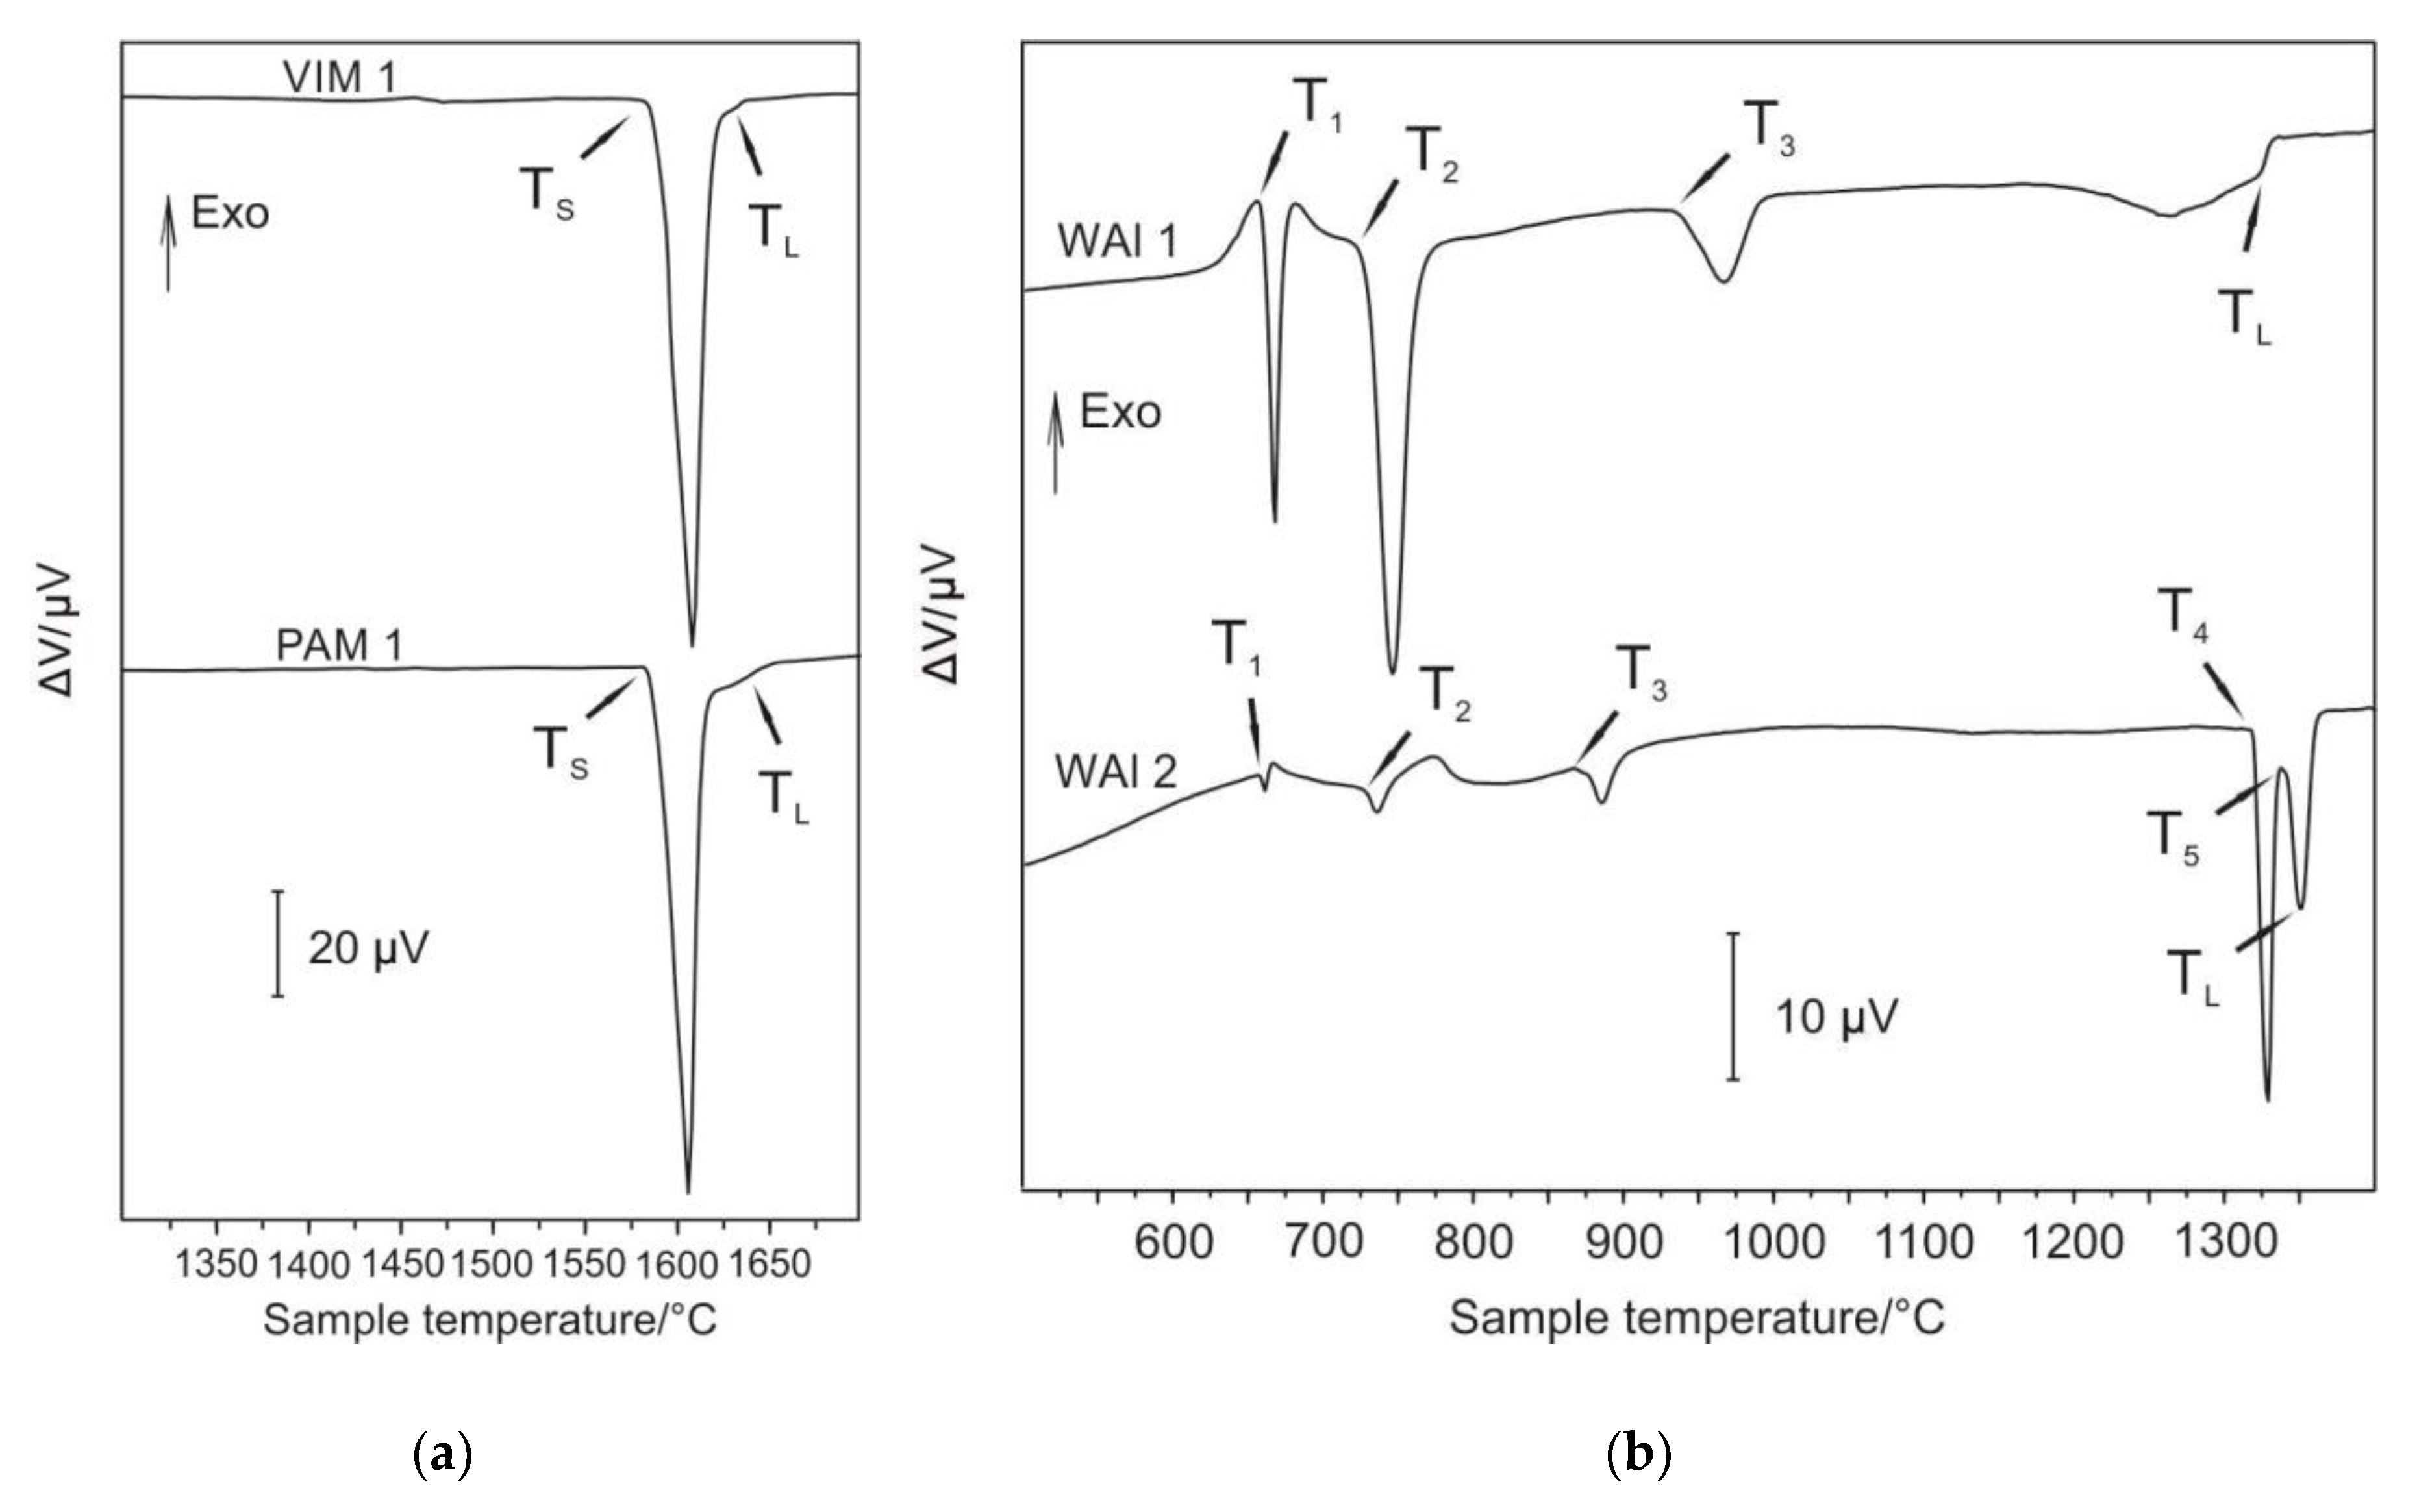
| TS | TL | |||
|---|---|---|---|---|
| Sample | DTA | Thermo-Calc | DTA | Thermo-Calc |
| Nb–Al-VIM-1 | 1583 | 1596 | 1622 | 1607 |
| Nb–Al-PAM-1 | 1583 | 1596 | 1626 | 1637 |
| Sample | Al12W + Al = L + Al12W | L + Al12W = L + Al5W | L + Al5W = L + Al4W | L + Al4W = L + Al77W23 | TL | |||||
|---|---|---|---|---|---|---|---|---|---|---|
| DTA | Thermo -Calc | DTA | Thermo -Calc | DTA | Thermo -Calc | DTA | Thermo -Calc | DTA | Thermo -Calc | |
| WAl-1 | 656 | 662 | 715 | 699 | 931 | 876 | – | 1331 | 1324 | 1305 |
| WAl-2 | 656 | 721 | 868 | 1319 | 1350 | 1418 | ||||
© 2020 by the authors. Licensee MDPI, Basel, Switzerland. This article is an open access article distributed under the terms and conditions of the Creative Commons Attribution (CC BY) license (http://creativecommons.org/licenses/by/4.0/).
Share and Cite
Cegan, T.; Petlak, D.; Skotnicova, K.; Jurica, J.; Smetana, B.; Zla, S. Metallurgical Preparation of Nb–Al and W–Al Intermetallic Compounds and Characterization of Their Microstructure and Phase Transformations by DTA Technique. Molecules 2020, 25, 2001. https://doi.org/10.3390/molecules25082001
Cegan T, Petlak D, Skotnicova K, Jurica J, Smetana B, Zla S. Metallurgical Preparation of Nb–Al and W–Al Intermetallic Compounds and Characterization of Their Microstructure and Phase Transformations by DTA Technique. Molecules. 2020; 25(8):2001. https://doi.org/10.3390/molecules25082001
Chicago/Turabian StyleCegan, Tomas, Daniel Petlak, Katerina Skotnicova, Jan Jurica, Bedrich Smetana, and Simona Zla. 2020. "Metallurgical Preparation of Nb–Al and W–Al Intermetallic Compounds and Characterization of Their Microstructure and Phase Transformations by DTA Technique" Molecules 25, no. 8: 2001. https://doi.org/10.3390/molecules25082001
APA StyleCegan, T., Petlak, D., Skotnicova, K., Jurica, J., Smetana, B., & Zla, S. (2020). Metallurgical Preparation of Nb–Al and W–Al Intermetallic Compounds and Characterization of Their Microstructure and Phase Transformations by DTA Technique. Molecules, 25(8), 2001. https://doi.org/10.3390/molecules25082001