Understanding the Hsp90 N-Terminal Dynamics: Structural and Molecular Insights into the Therapeutic Activities of Anticancer Inhibitors Radicicol (RD) and Radicicol Derivative (NVP-YUA922)

 , , ,
, , ,
Abstract
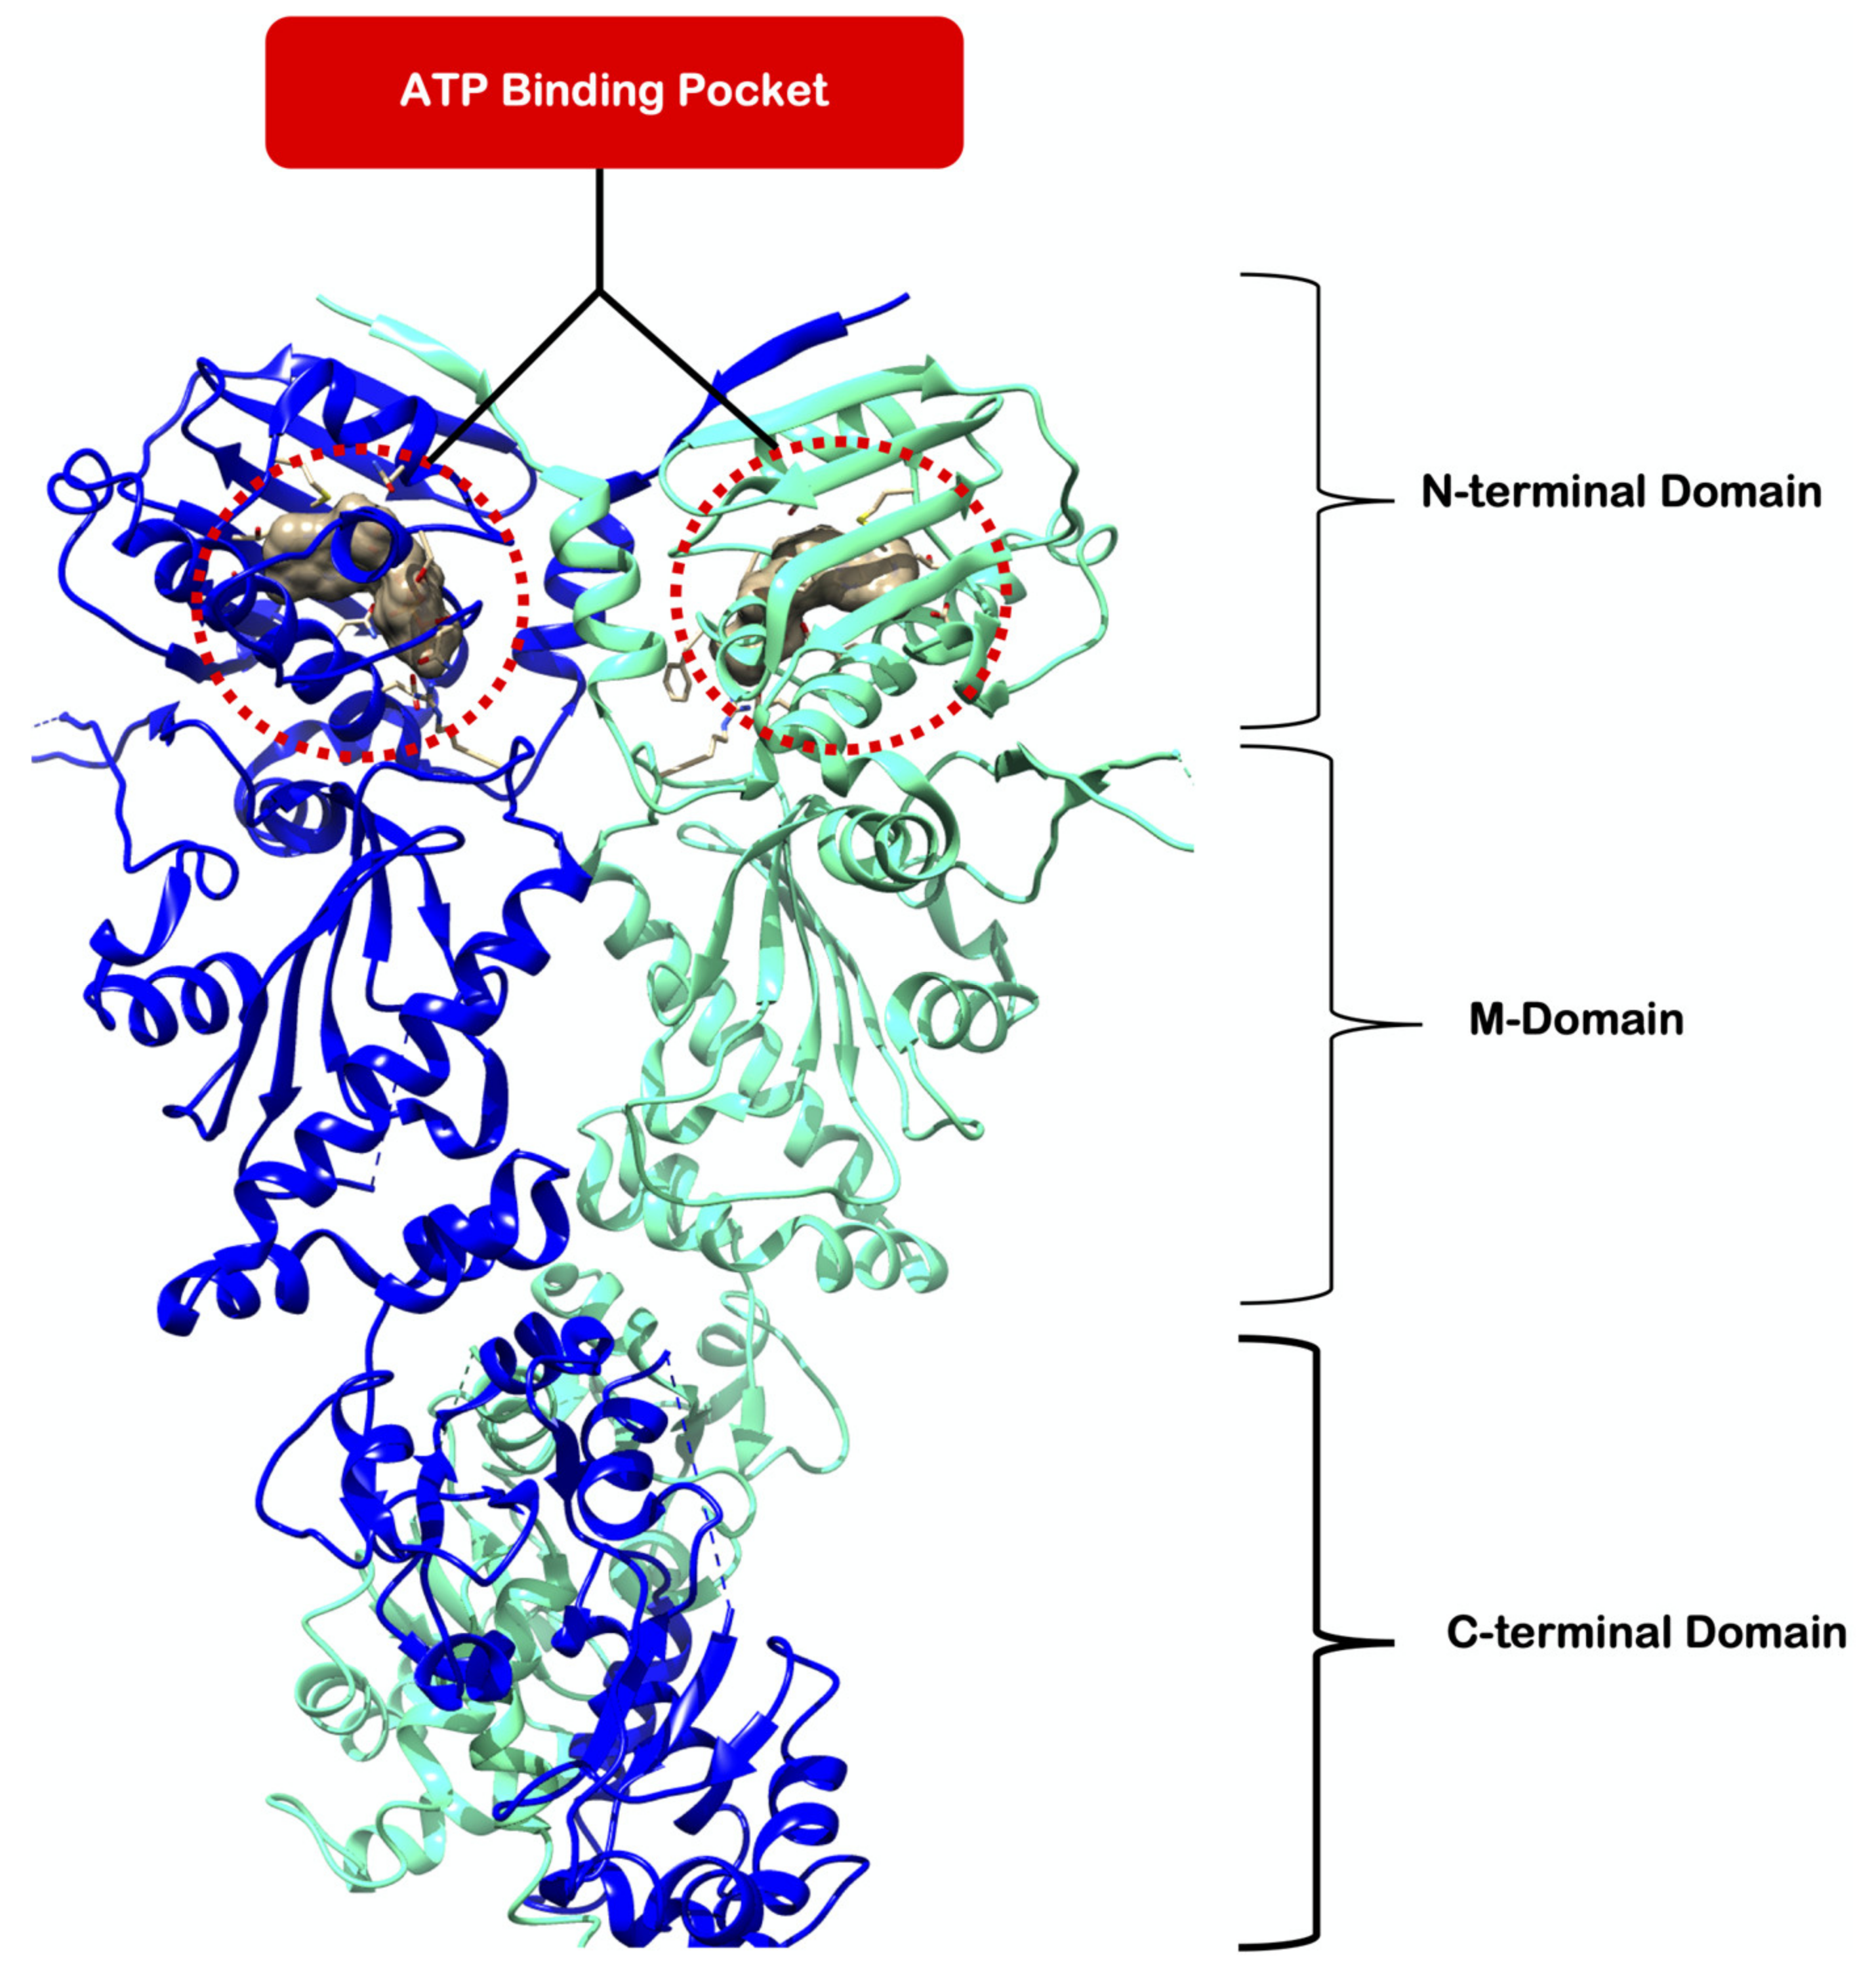
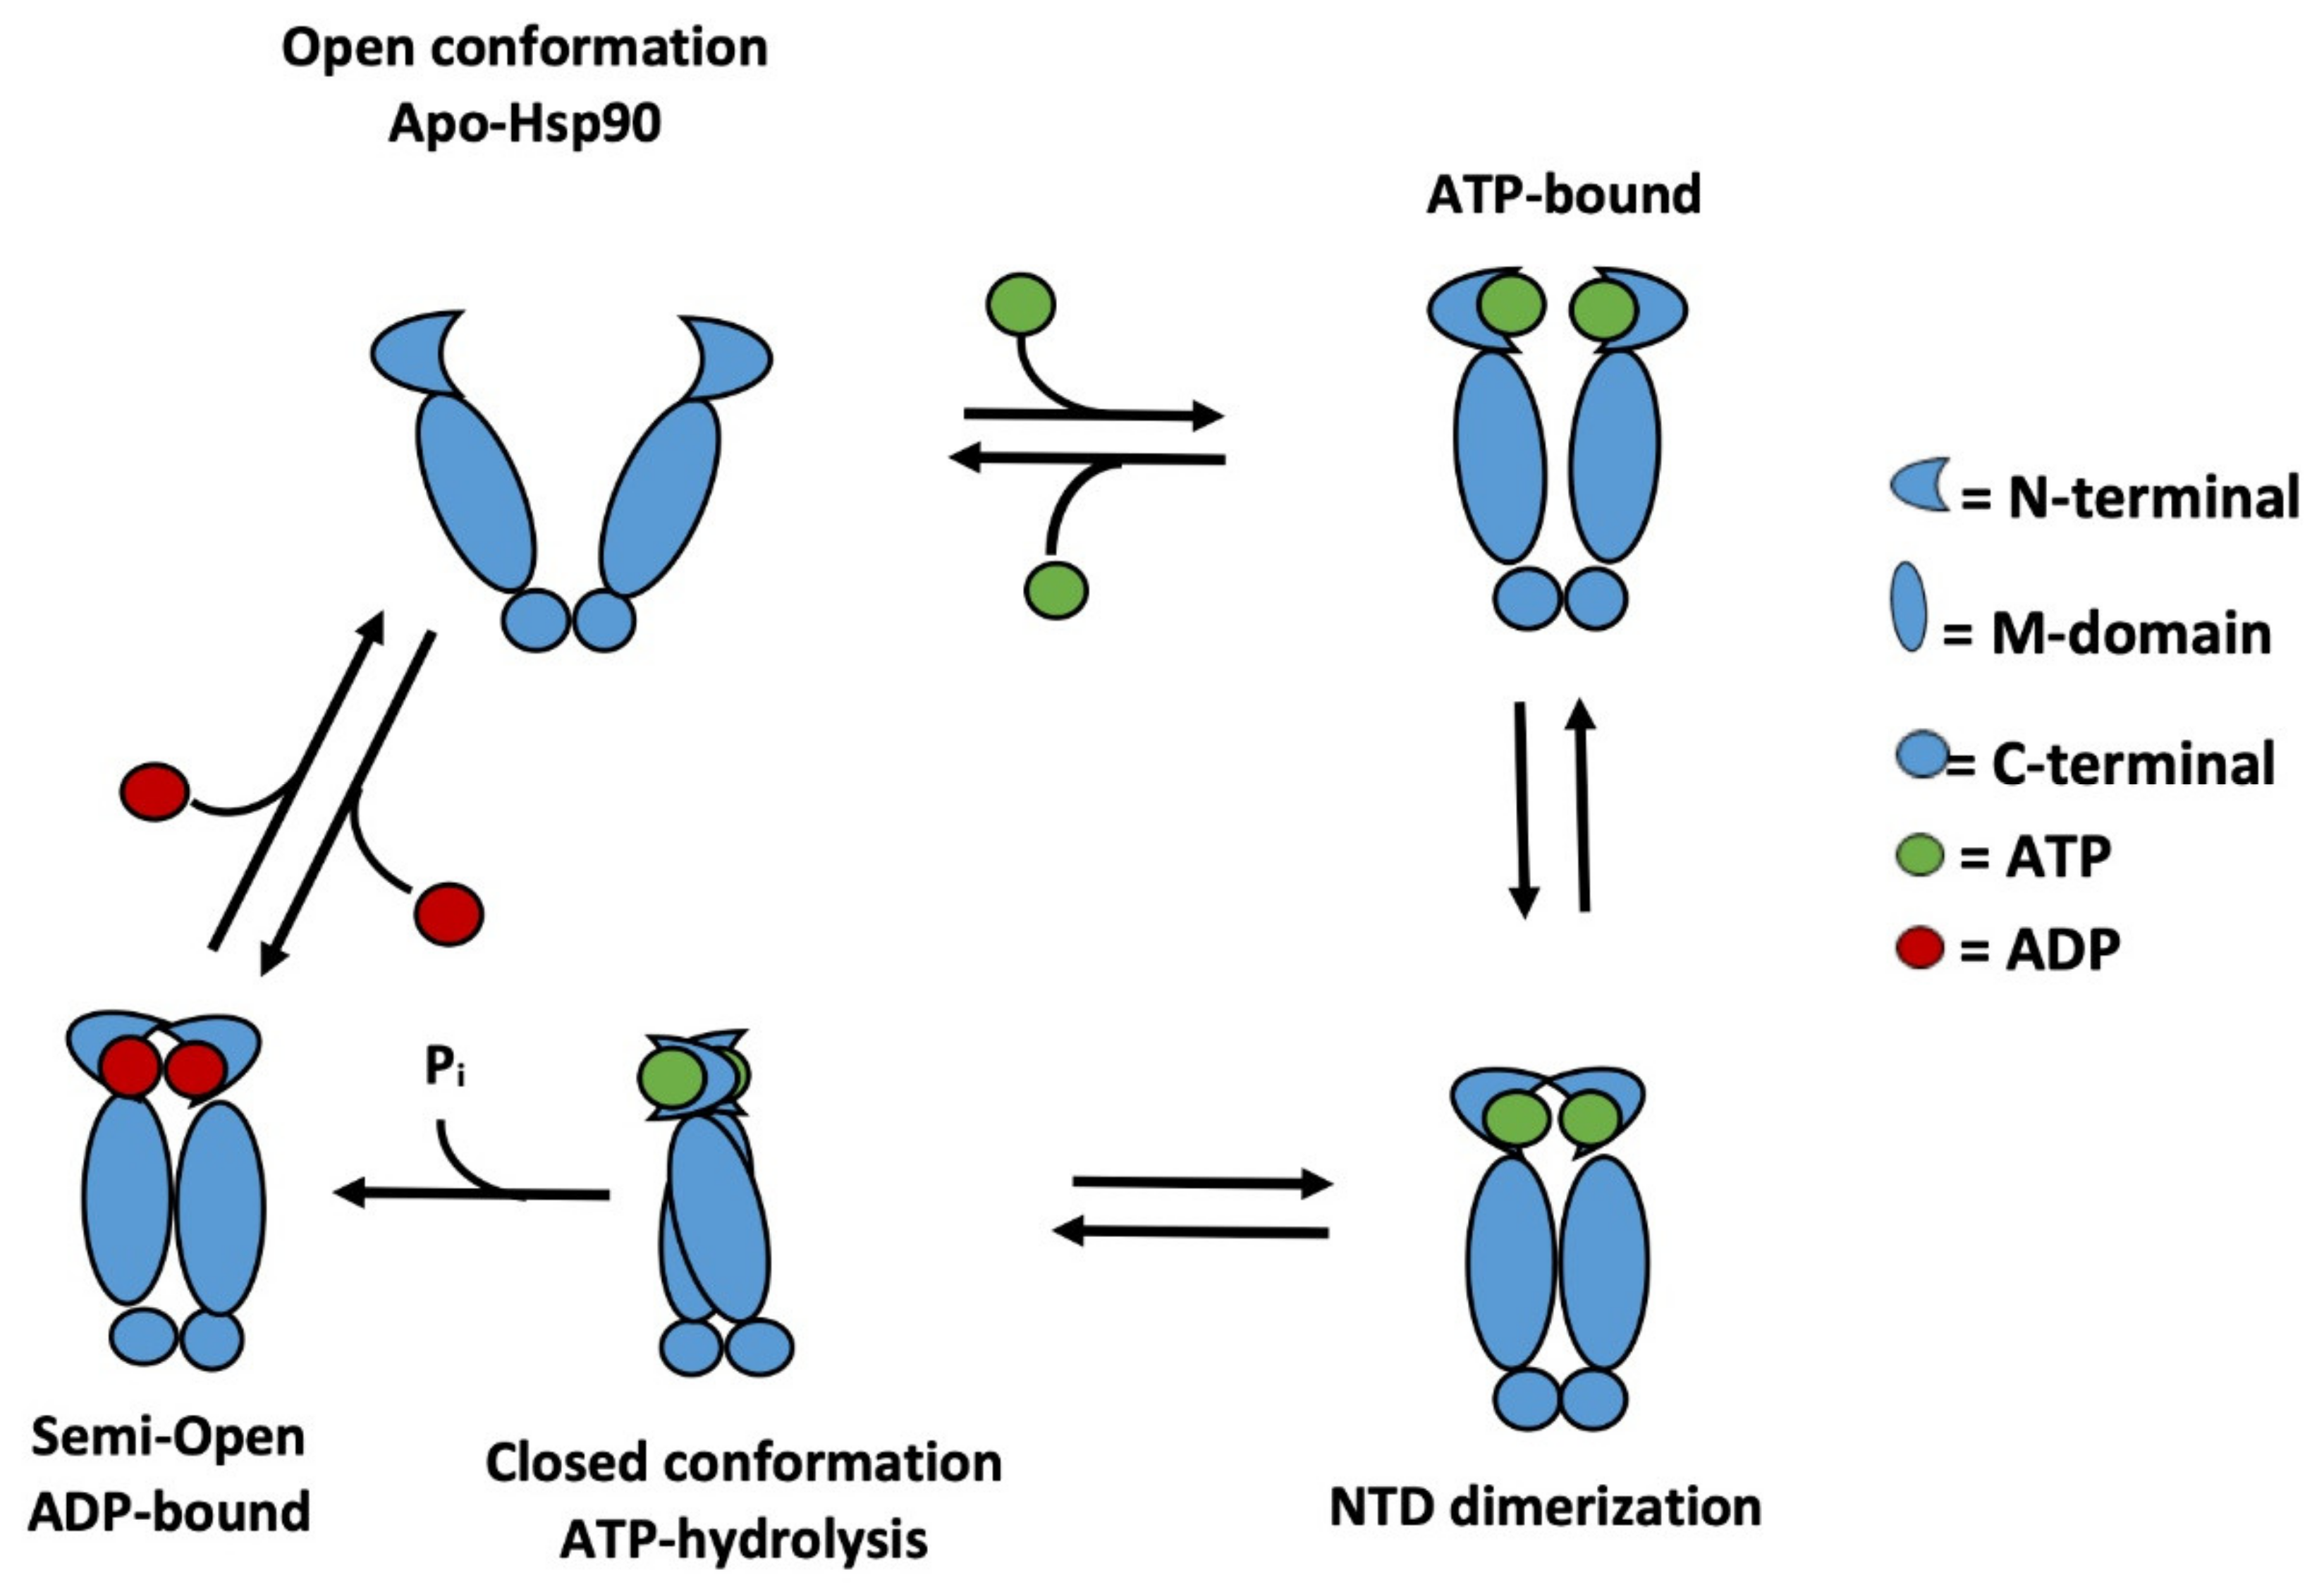
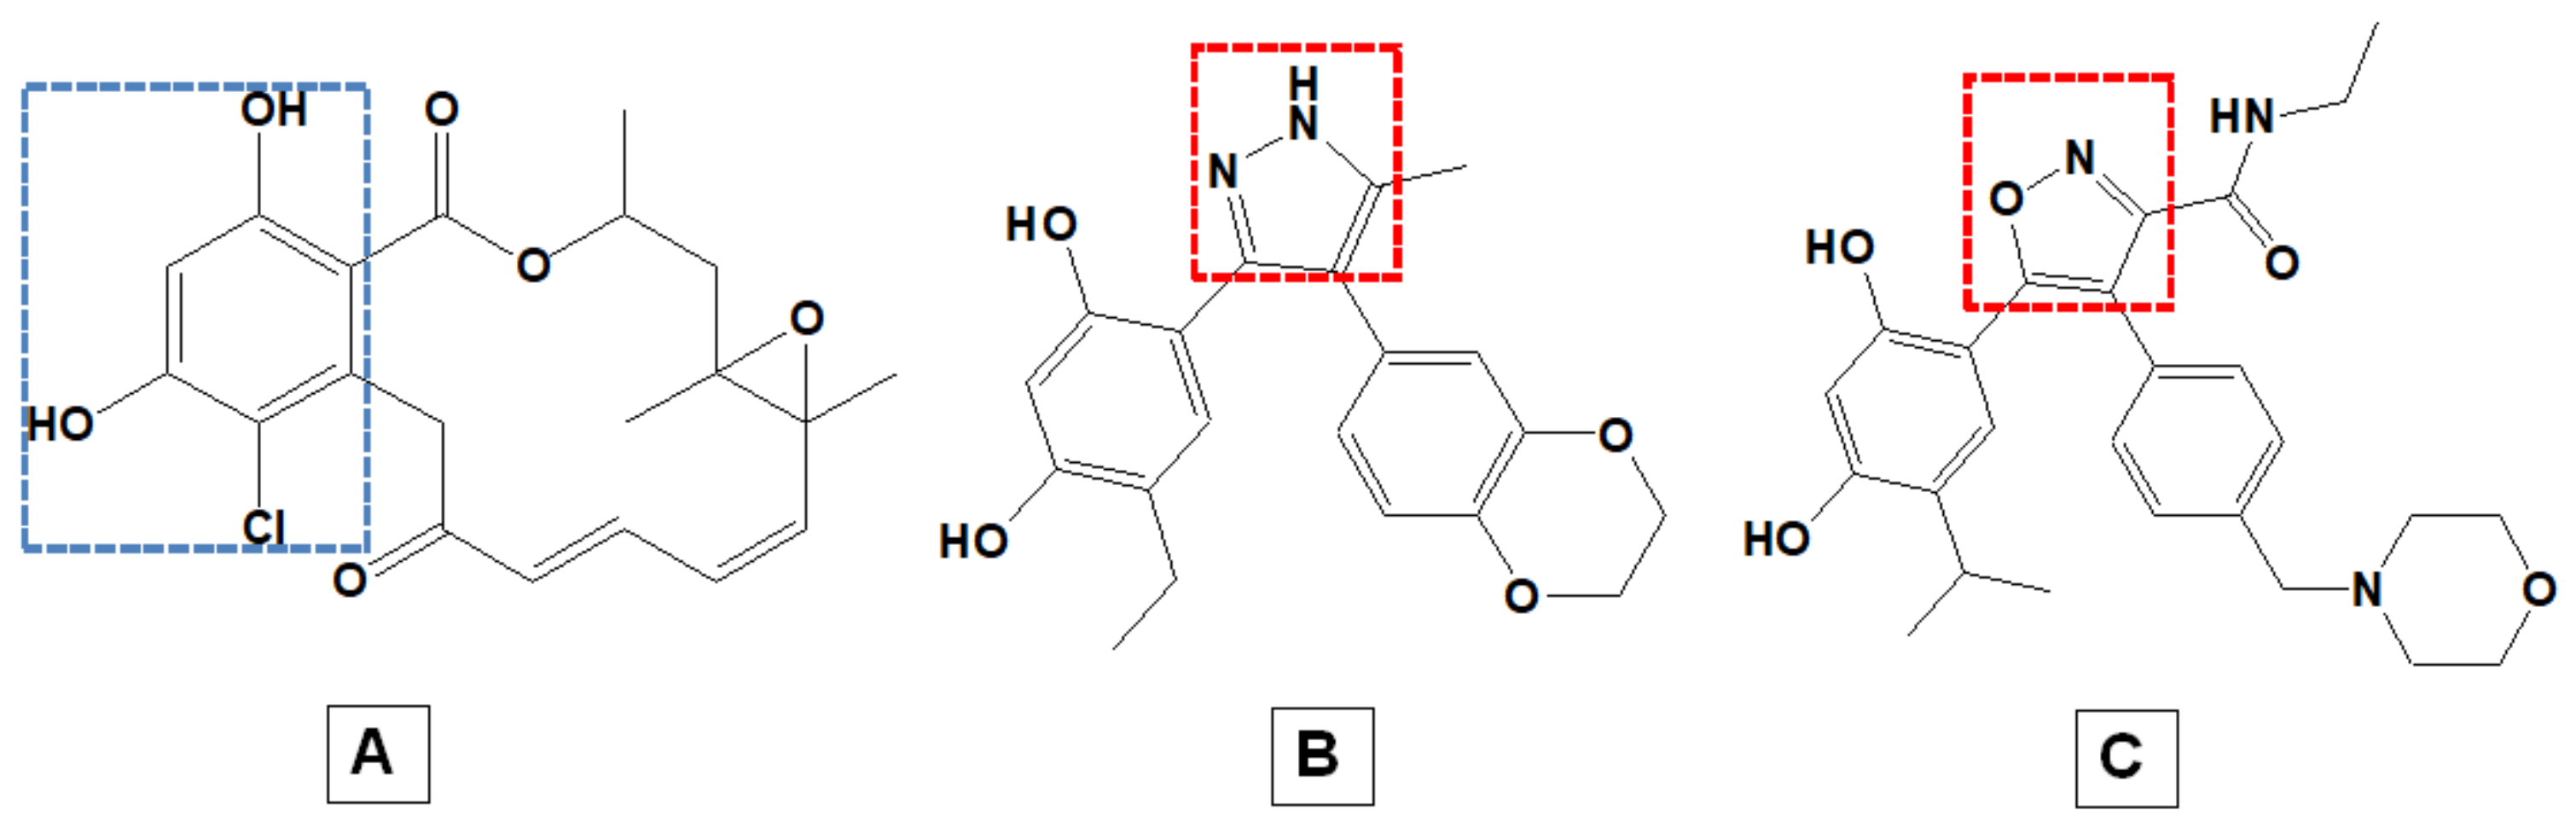
1. Introduction
2. Results and Discussion
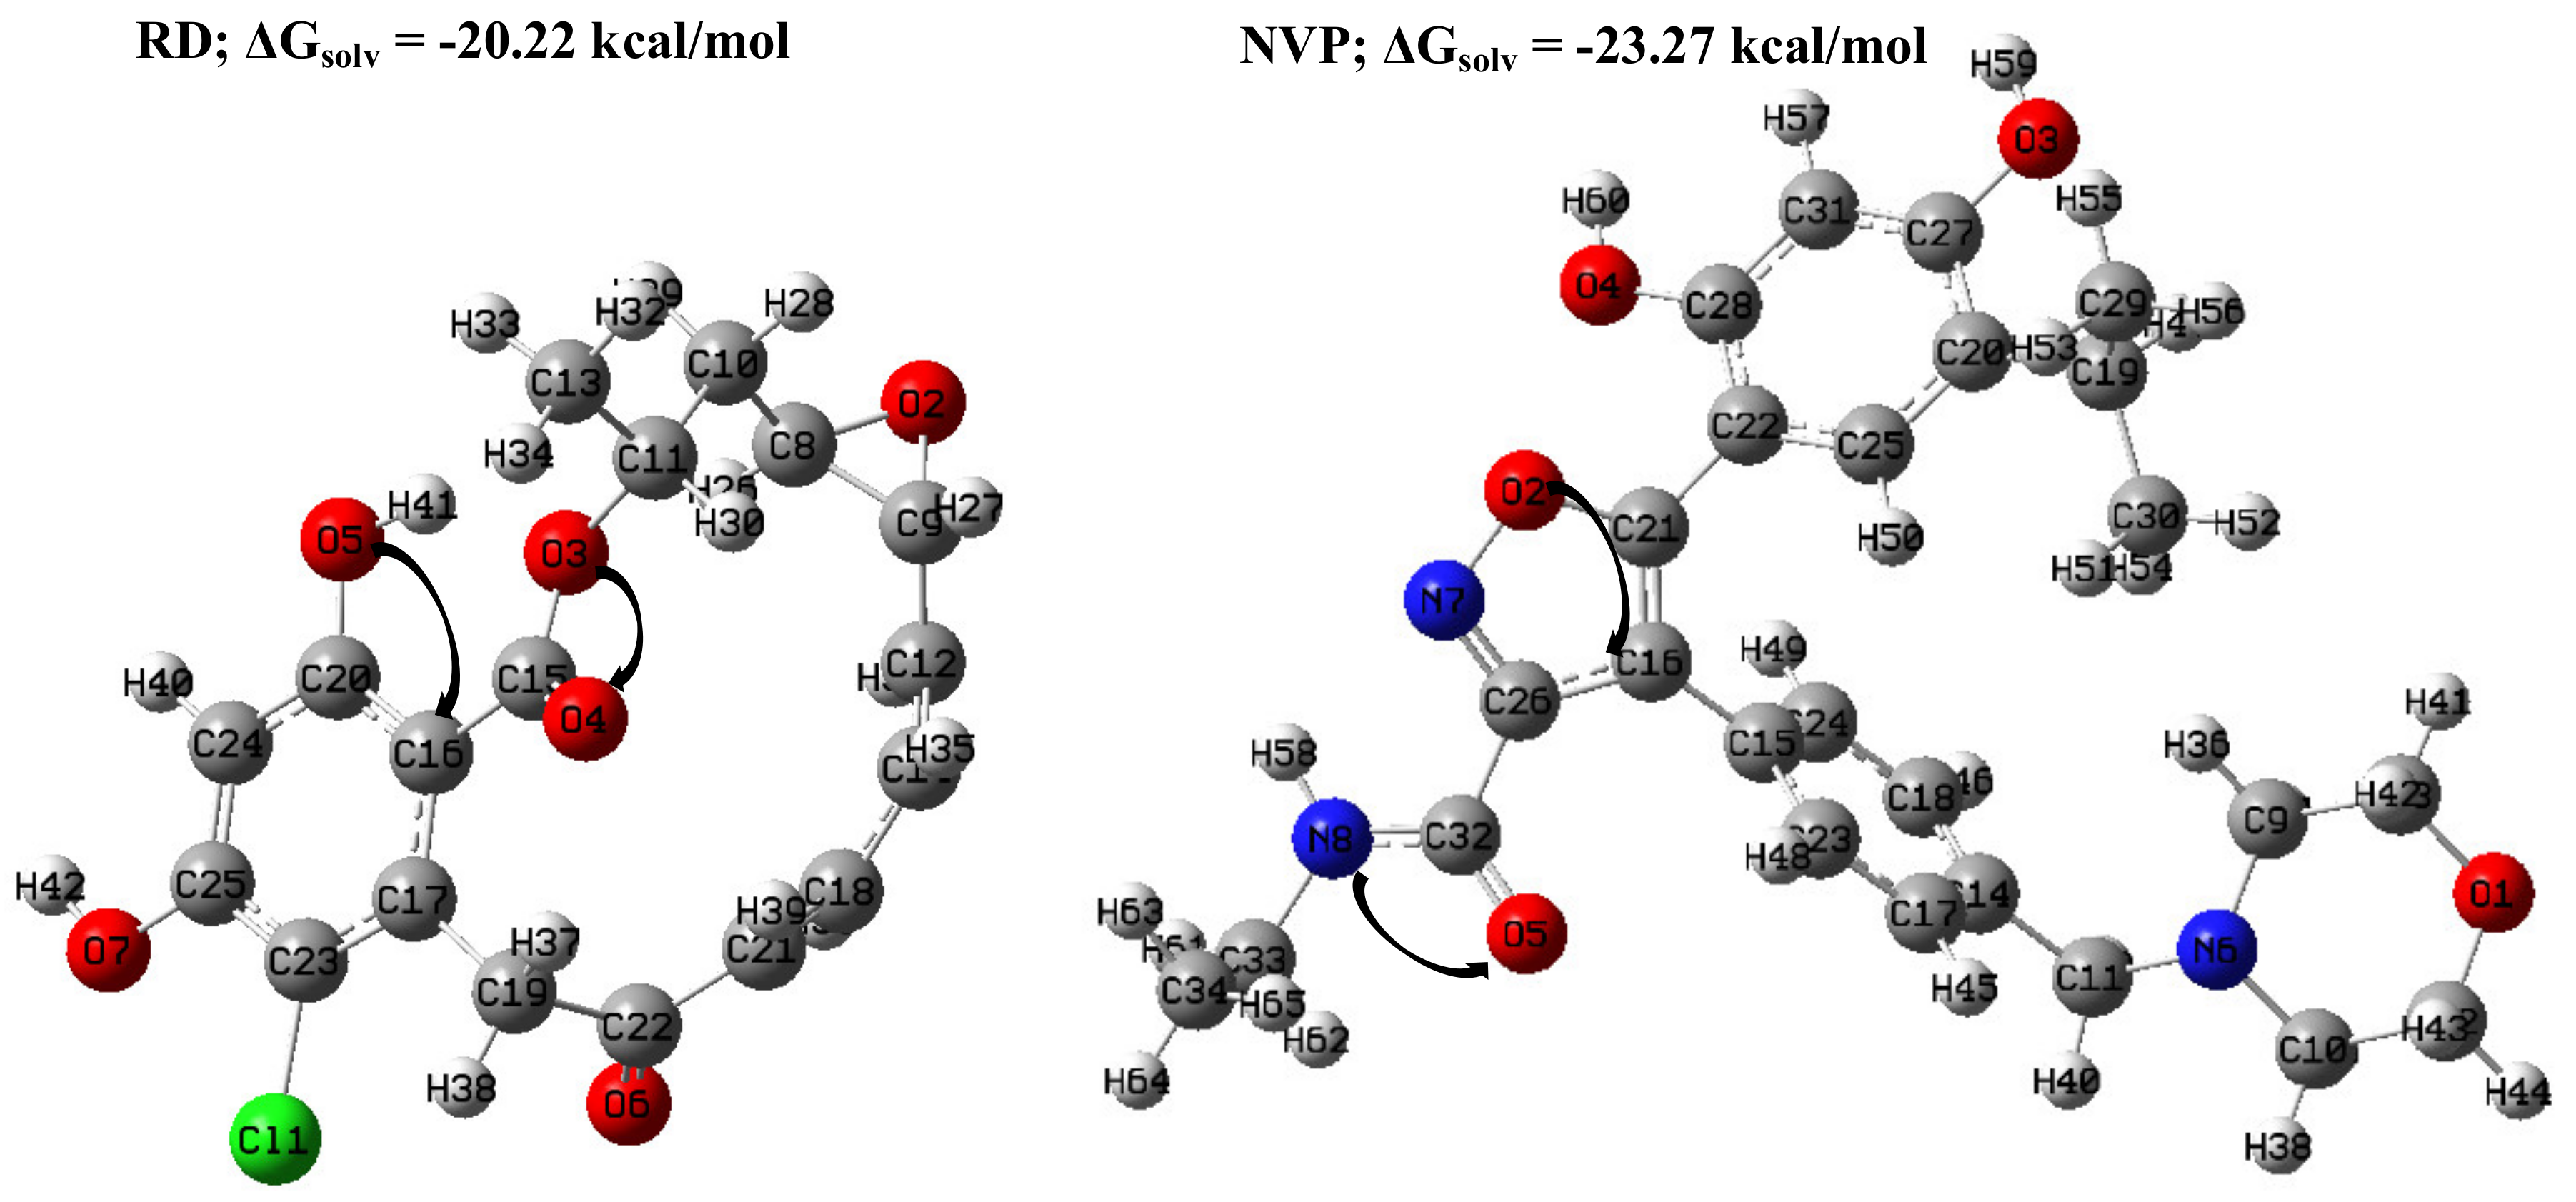
2.1. DFT-Based Properties of RD and NVP
2.1.1. Geometric Analyses of the Compounds
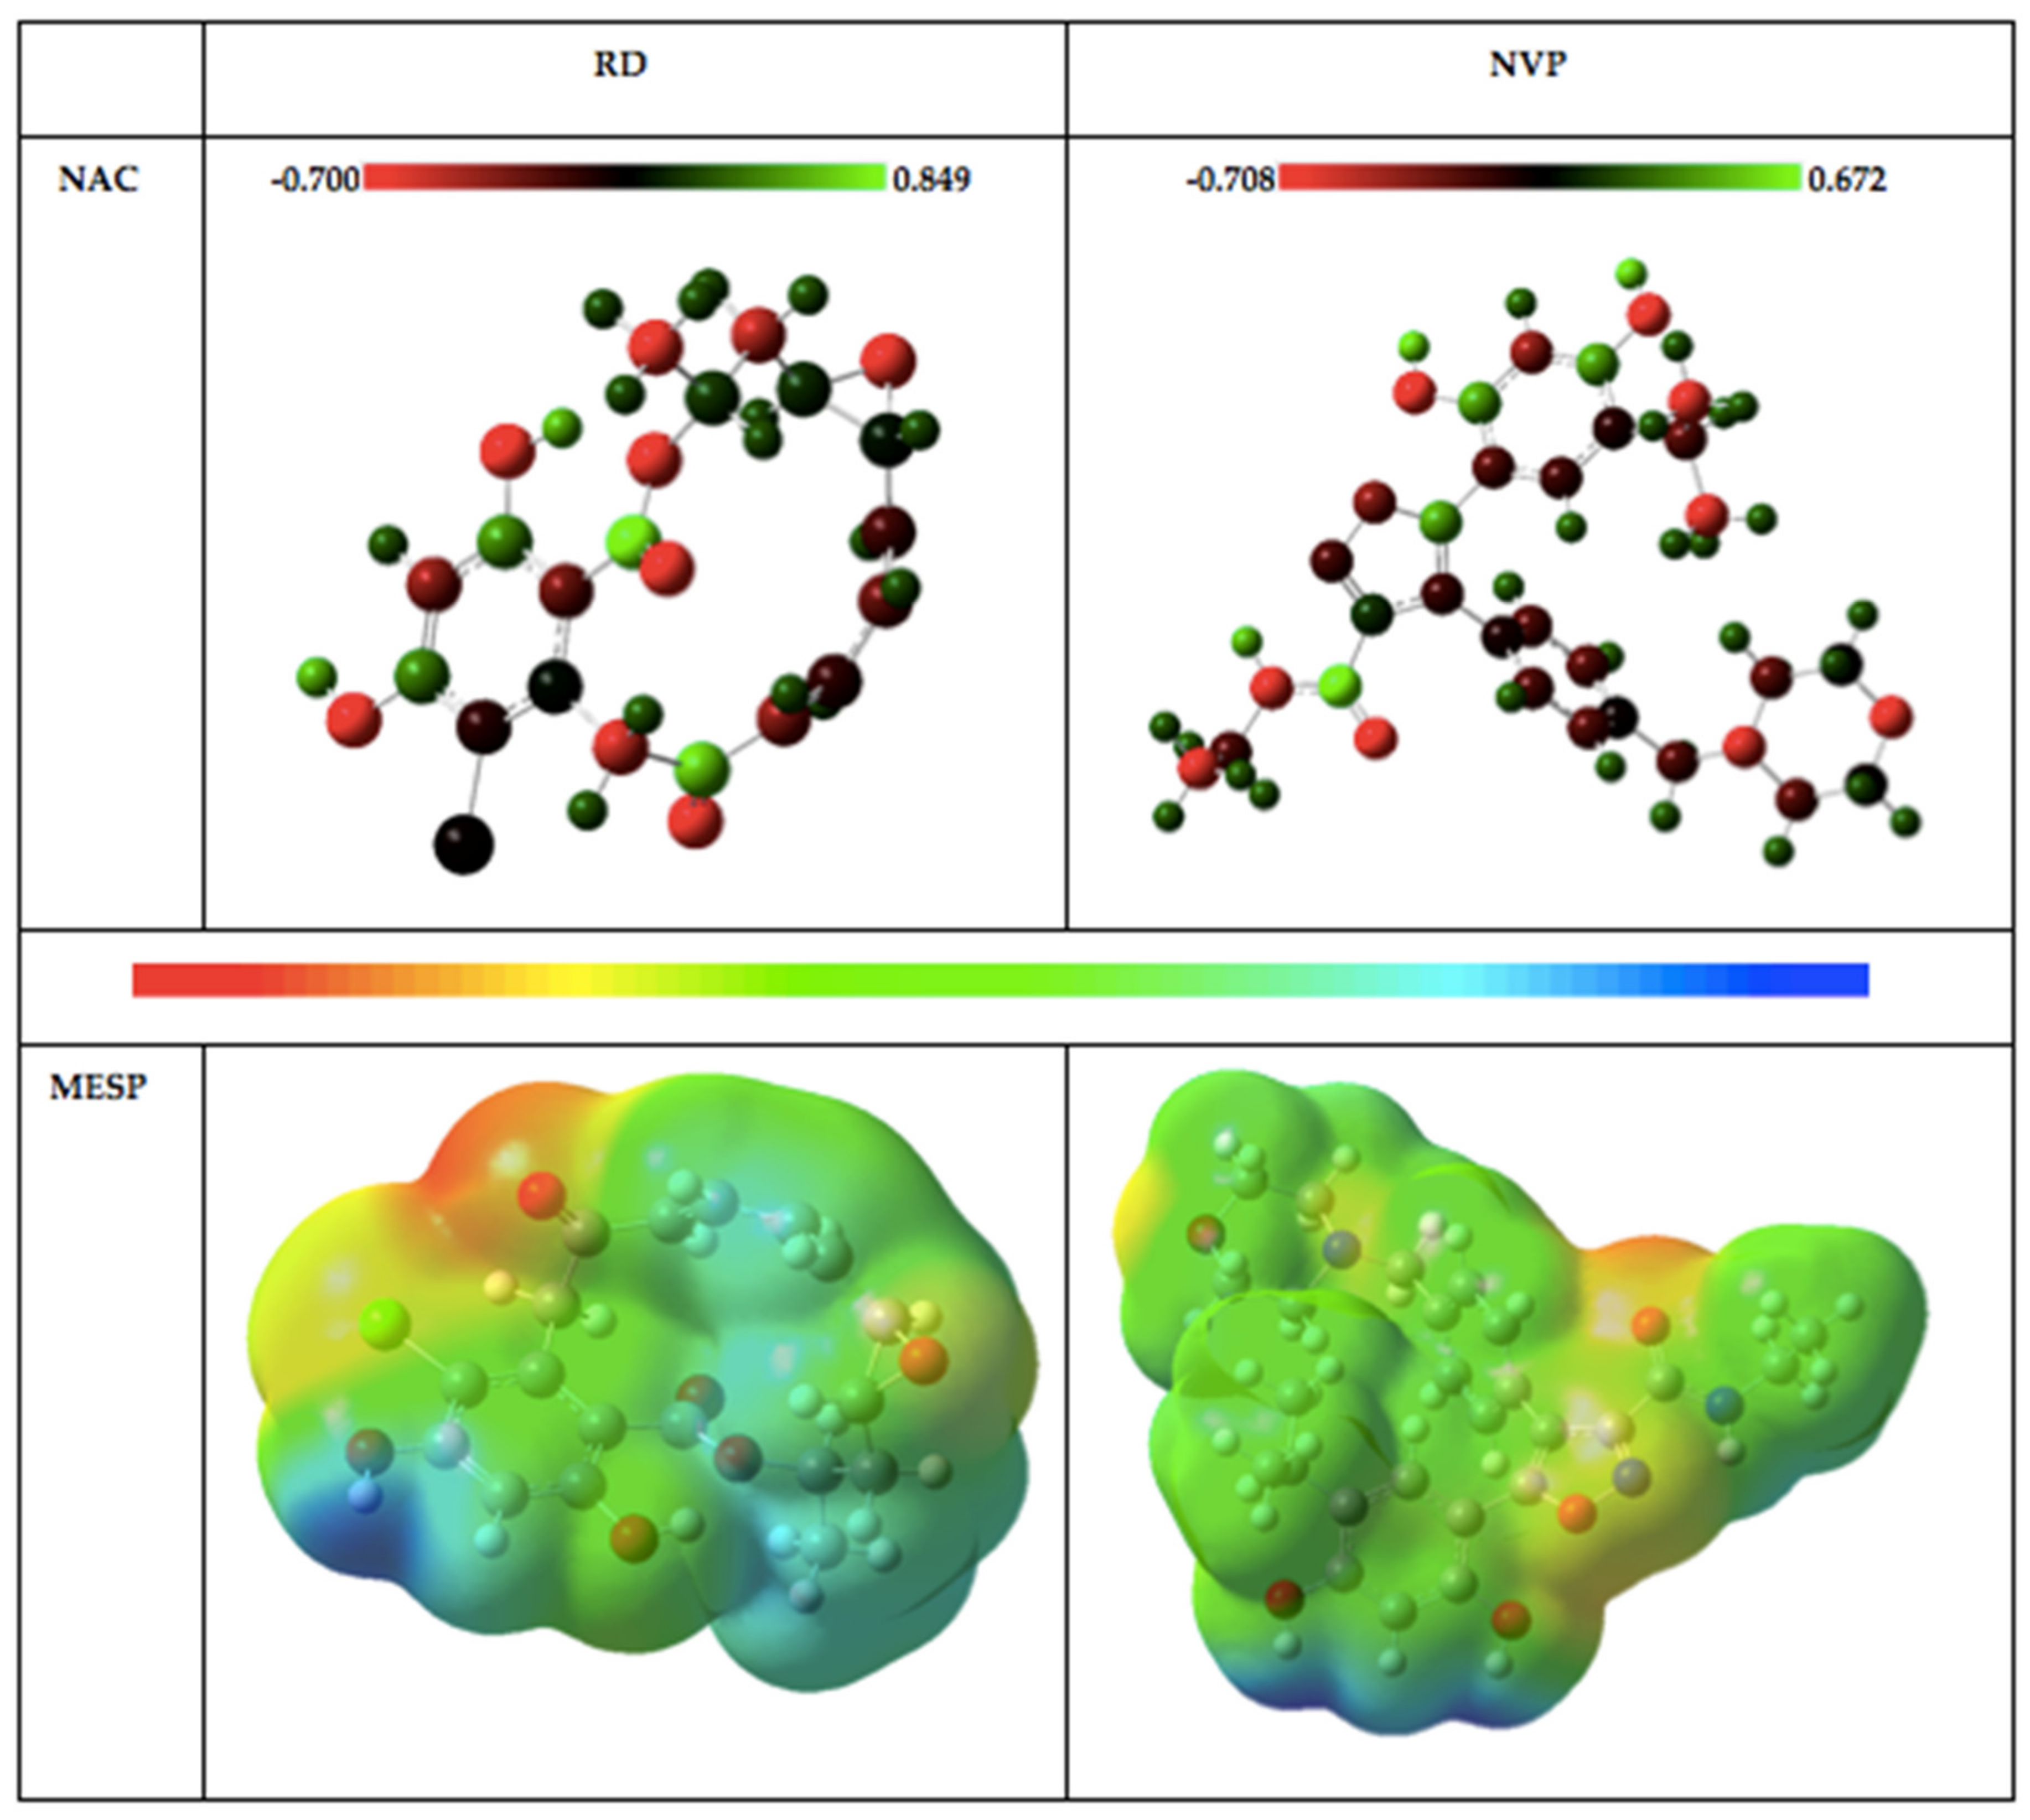
2.1.2. Natural Bond Orbitals (NBOs) Analysis
2.1.3. Molecular Electrostatic Potential (MESP) Plots
2.1.4. Analyses of the Non-Linear Optical Properties
2.2. Molecular Dynamics Simulations of Hsp90 with RD and NVP
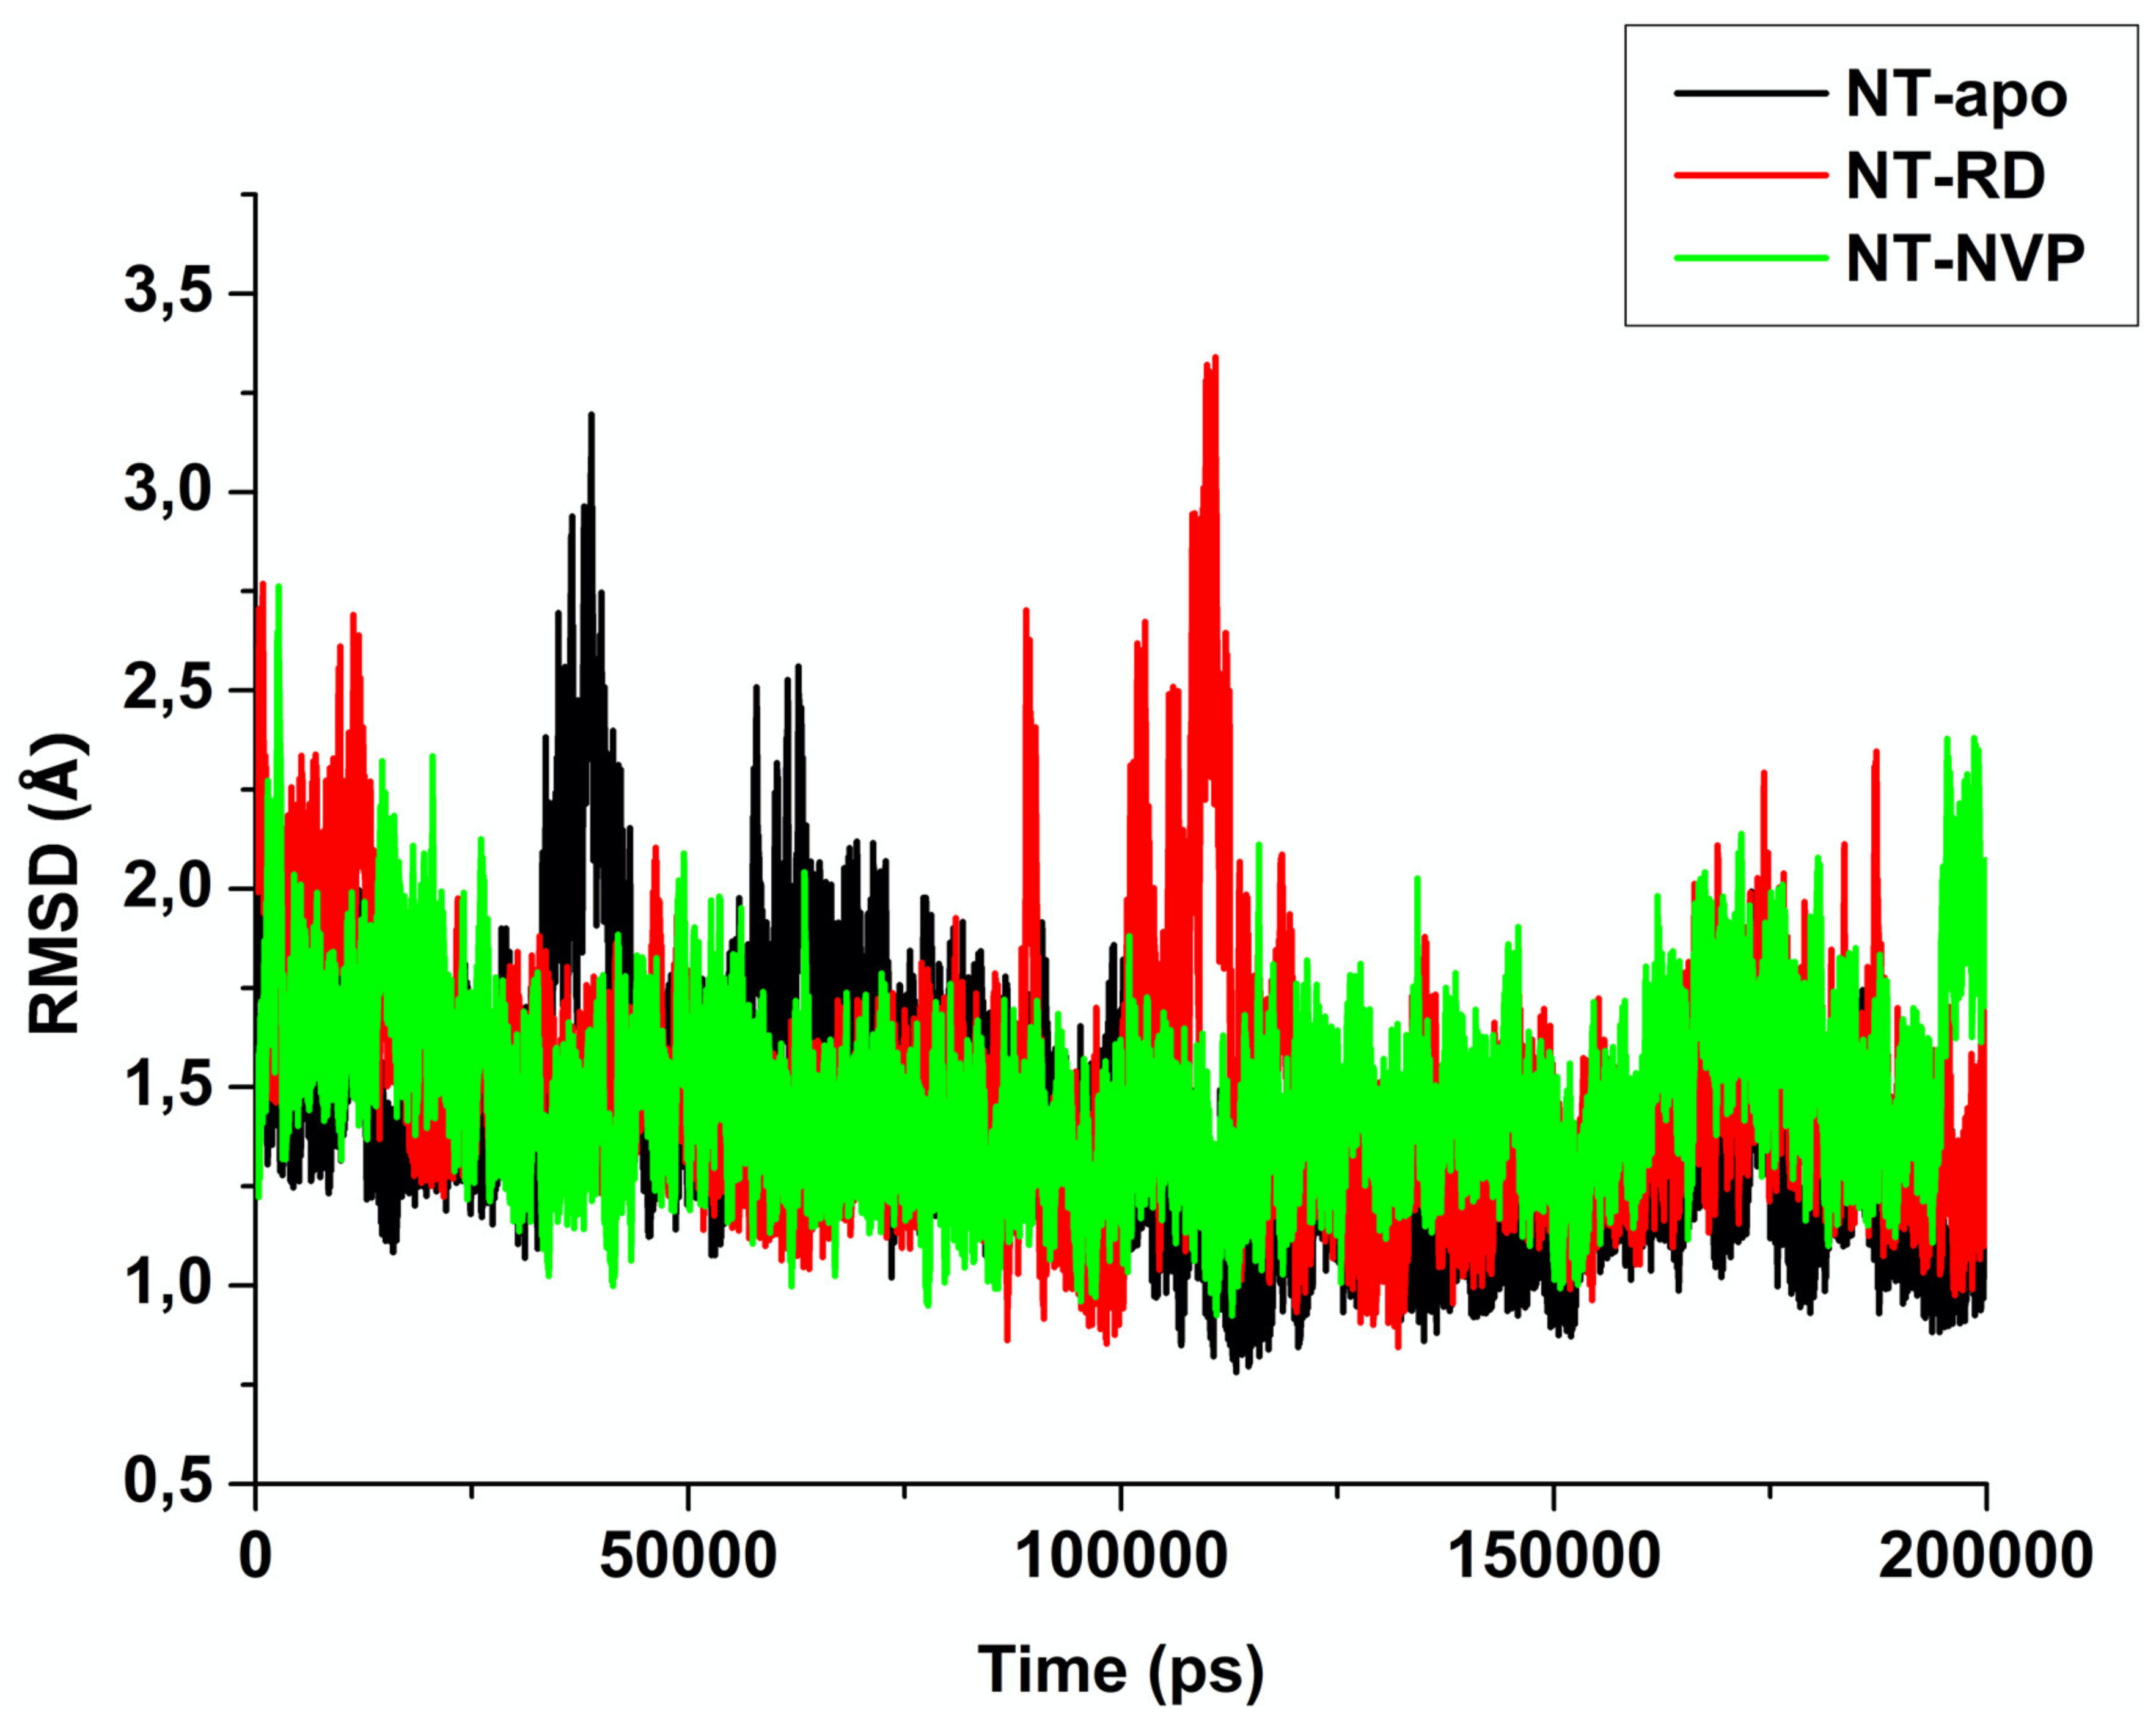
2.2.1. Root of Mean Square Deviation (RMSD)
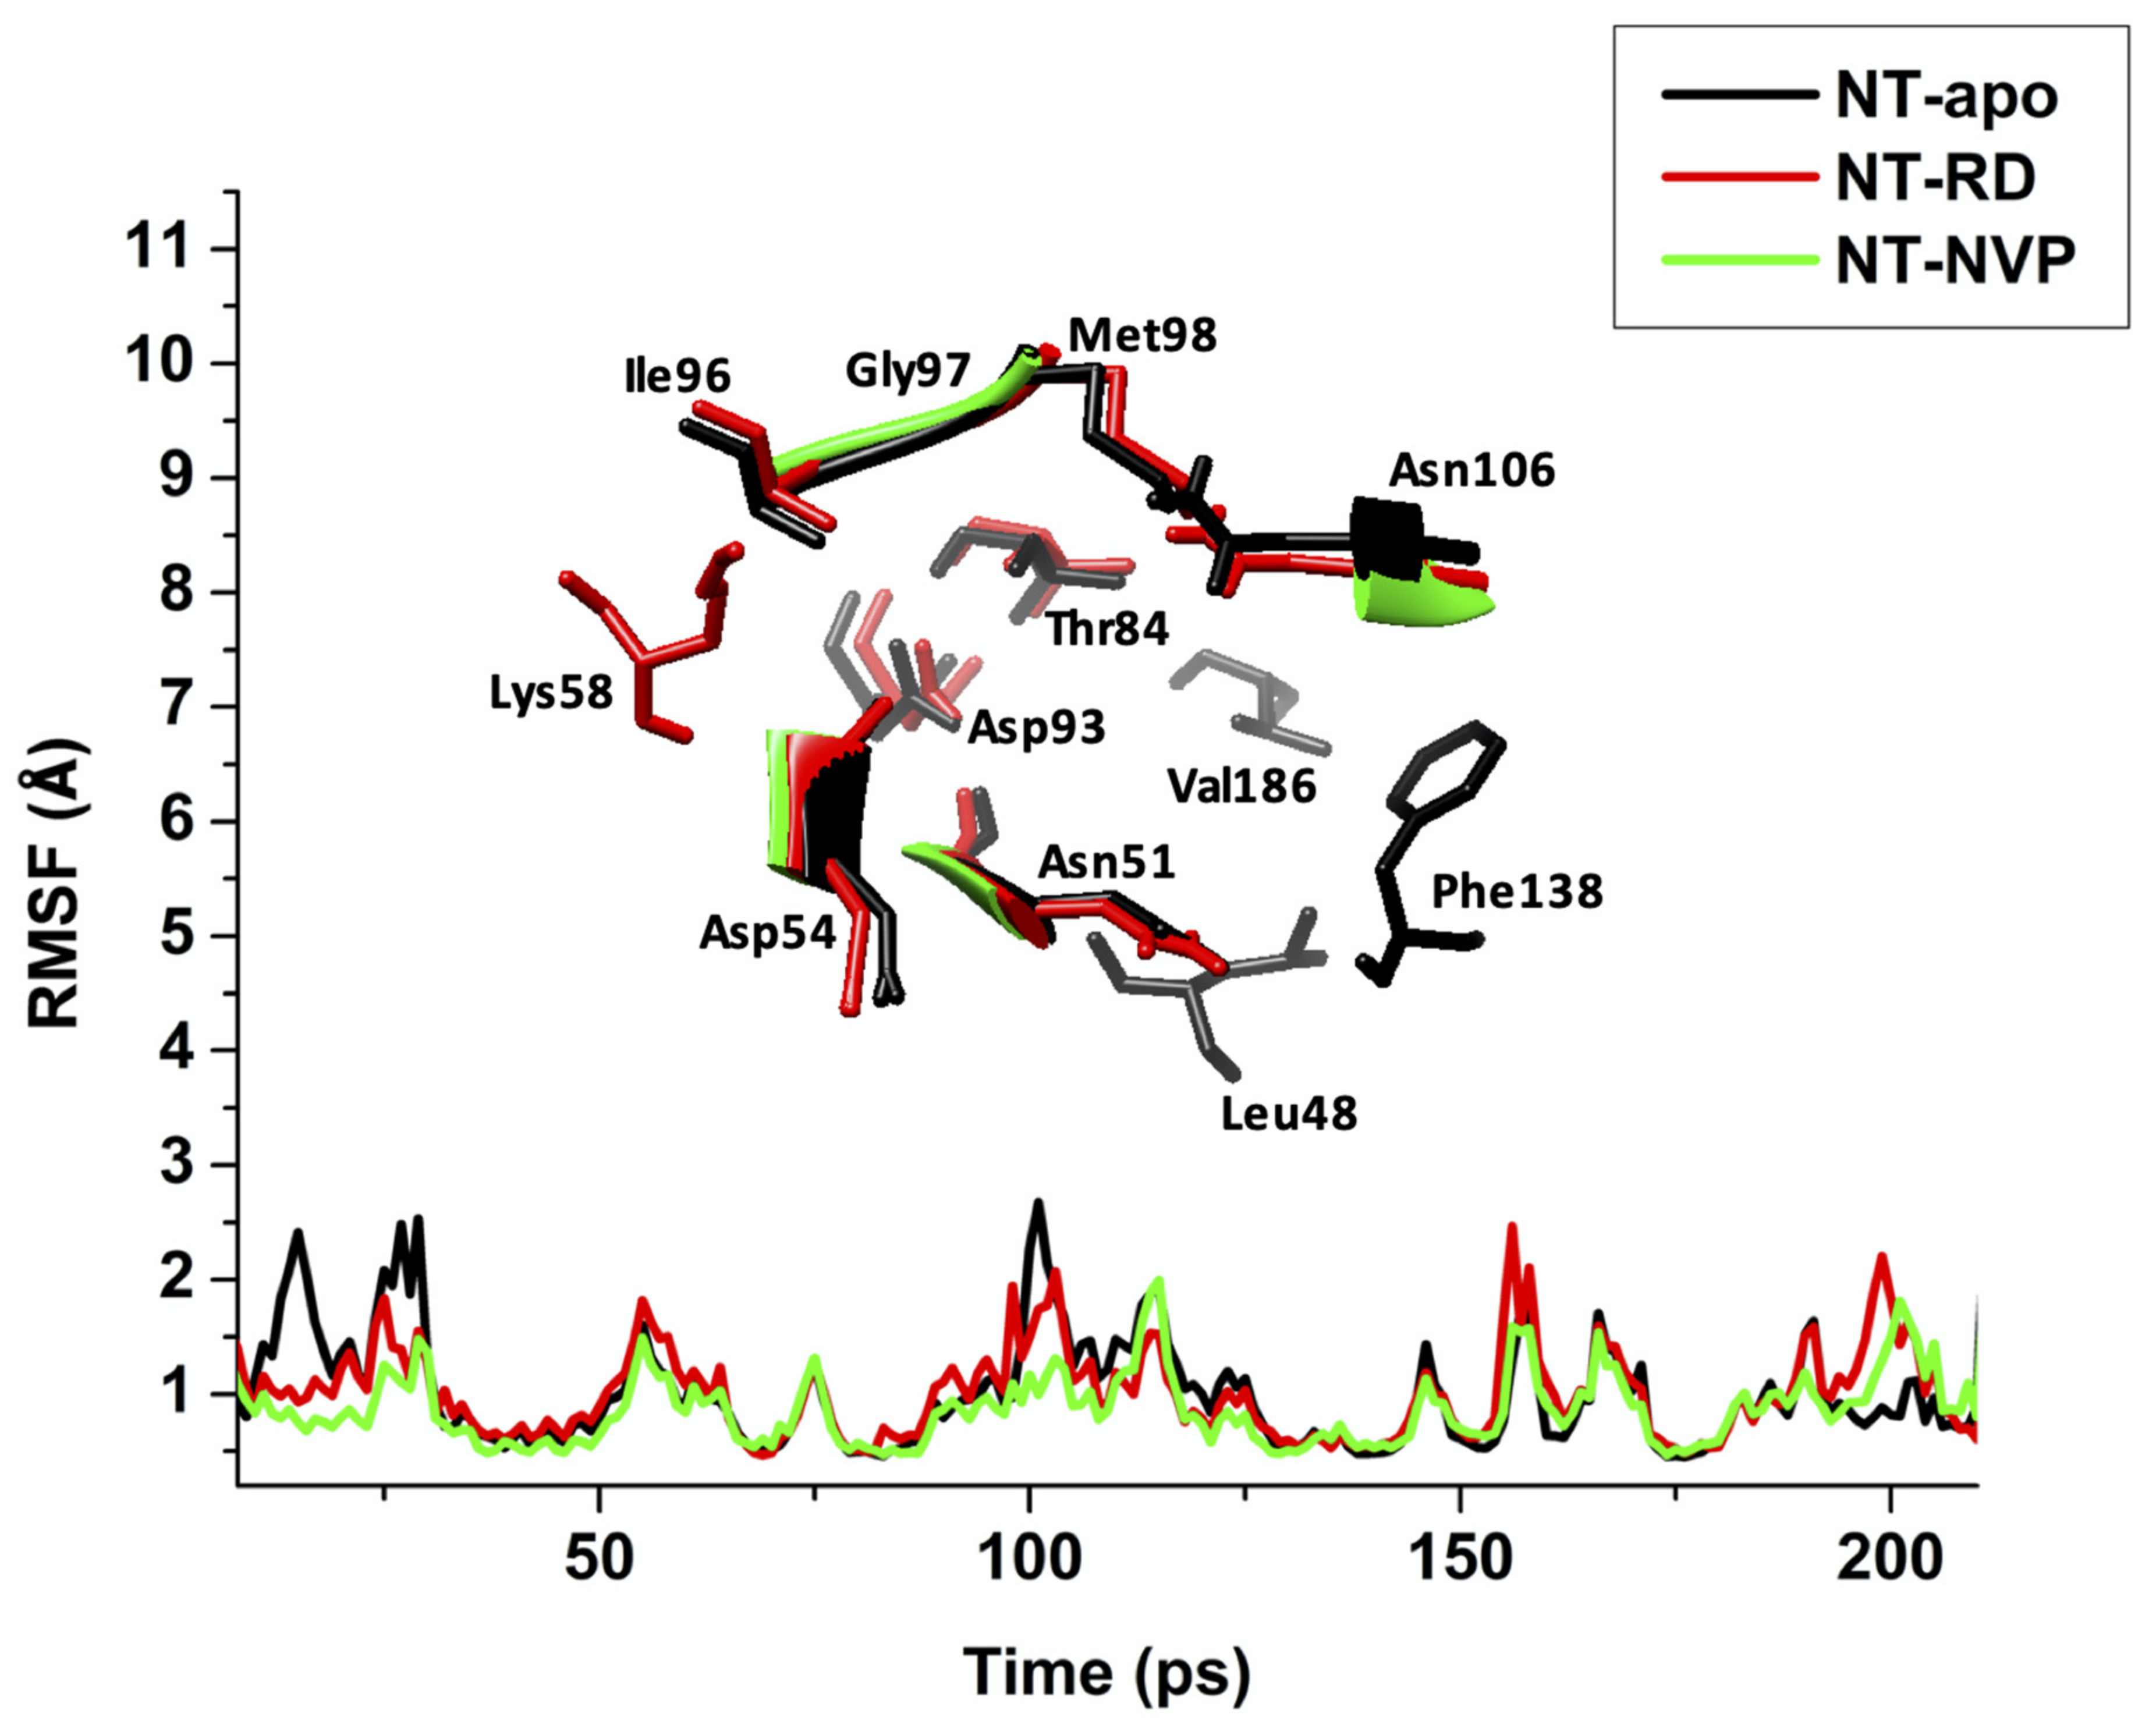
2.2.2. Root of Mean Square Fluctuation (RMSF)
2.2.3. Radius of Gyration (RoG)
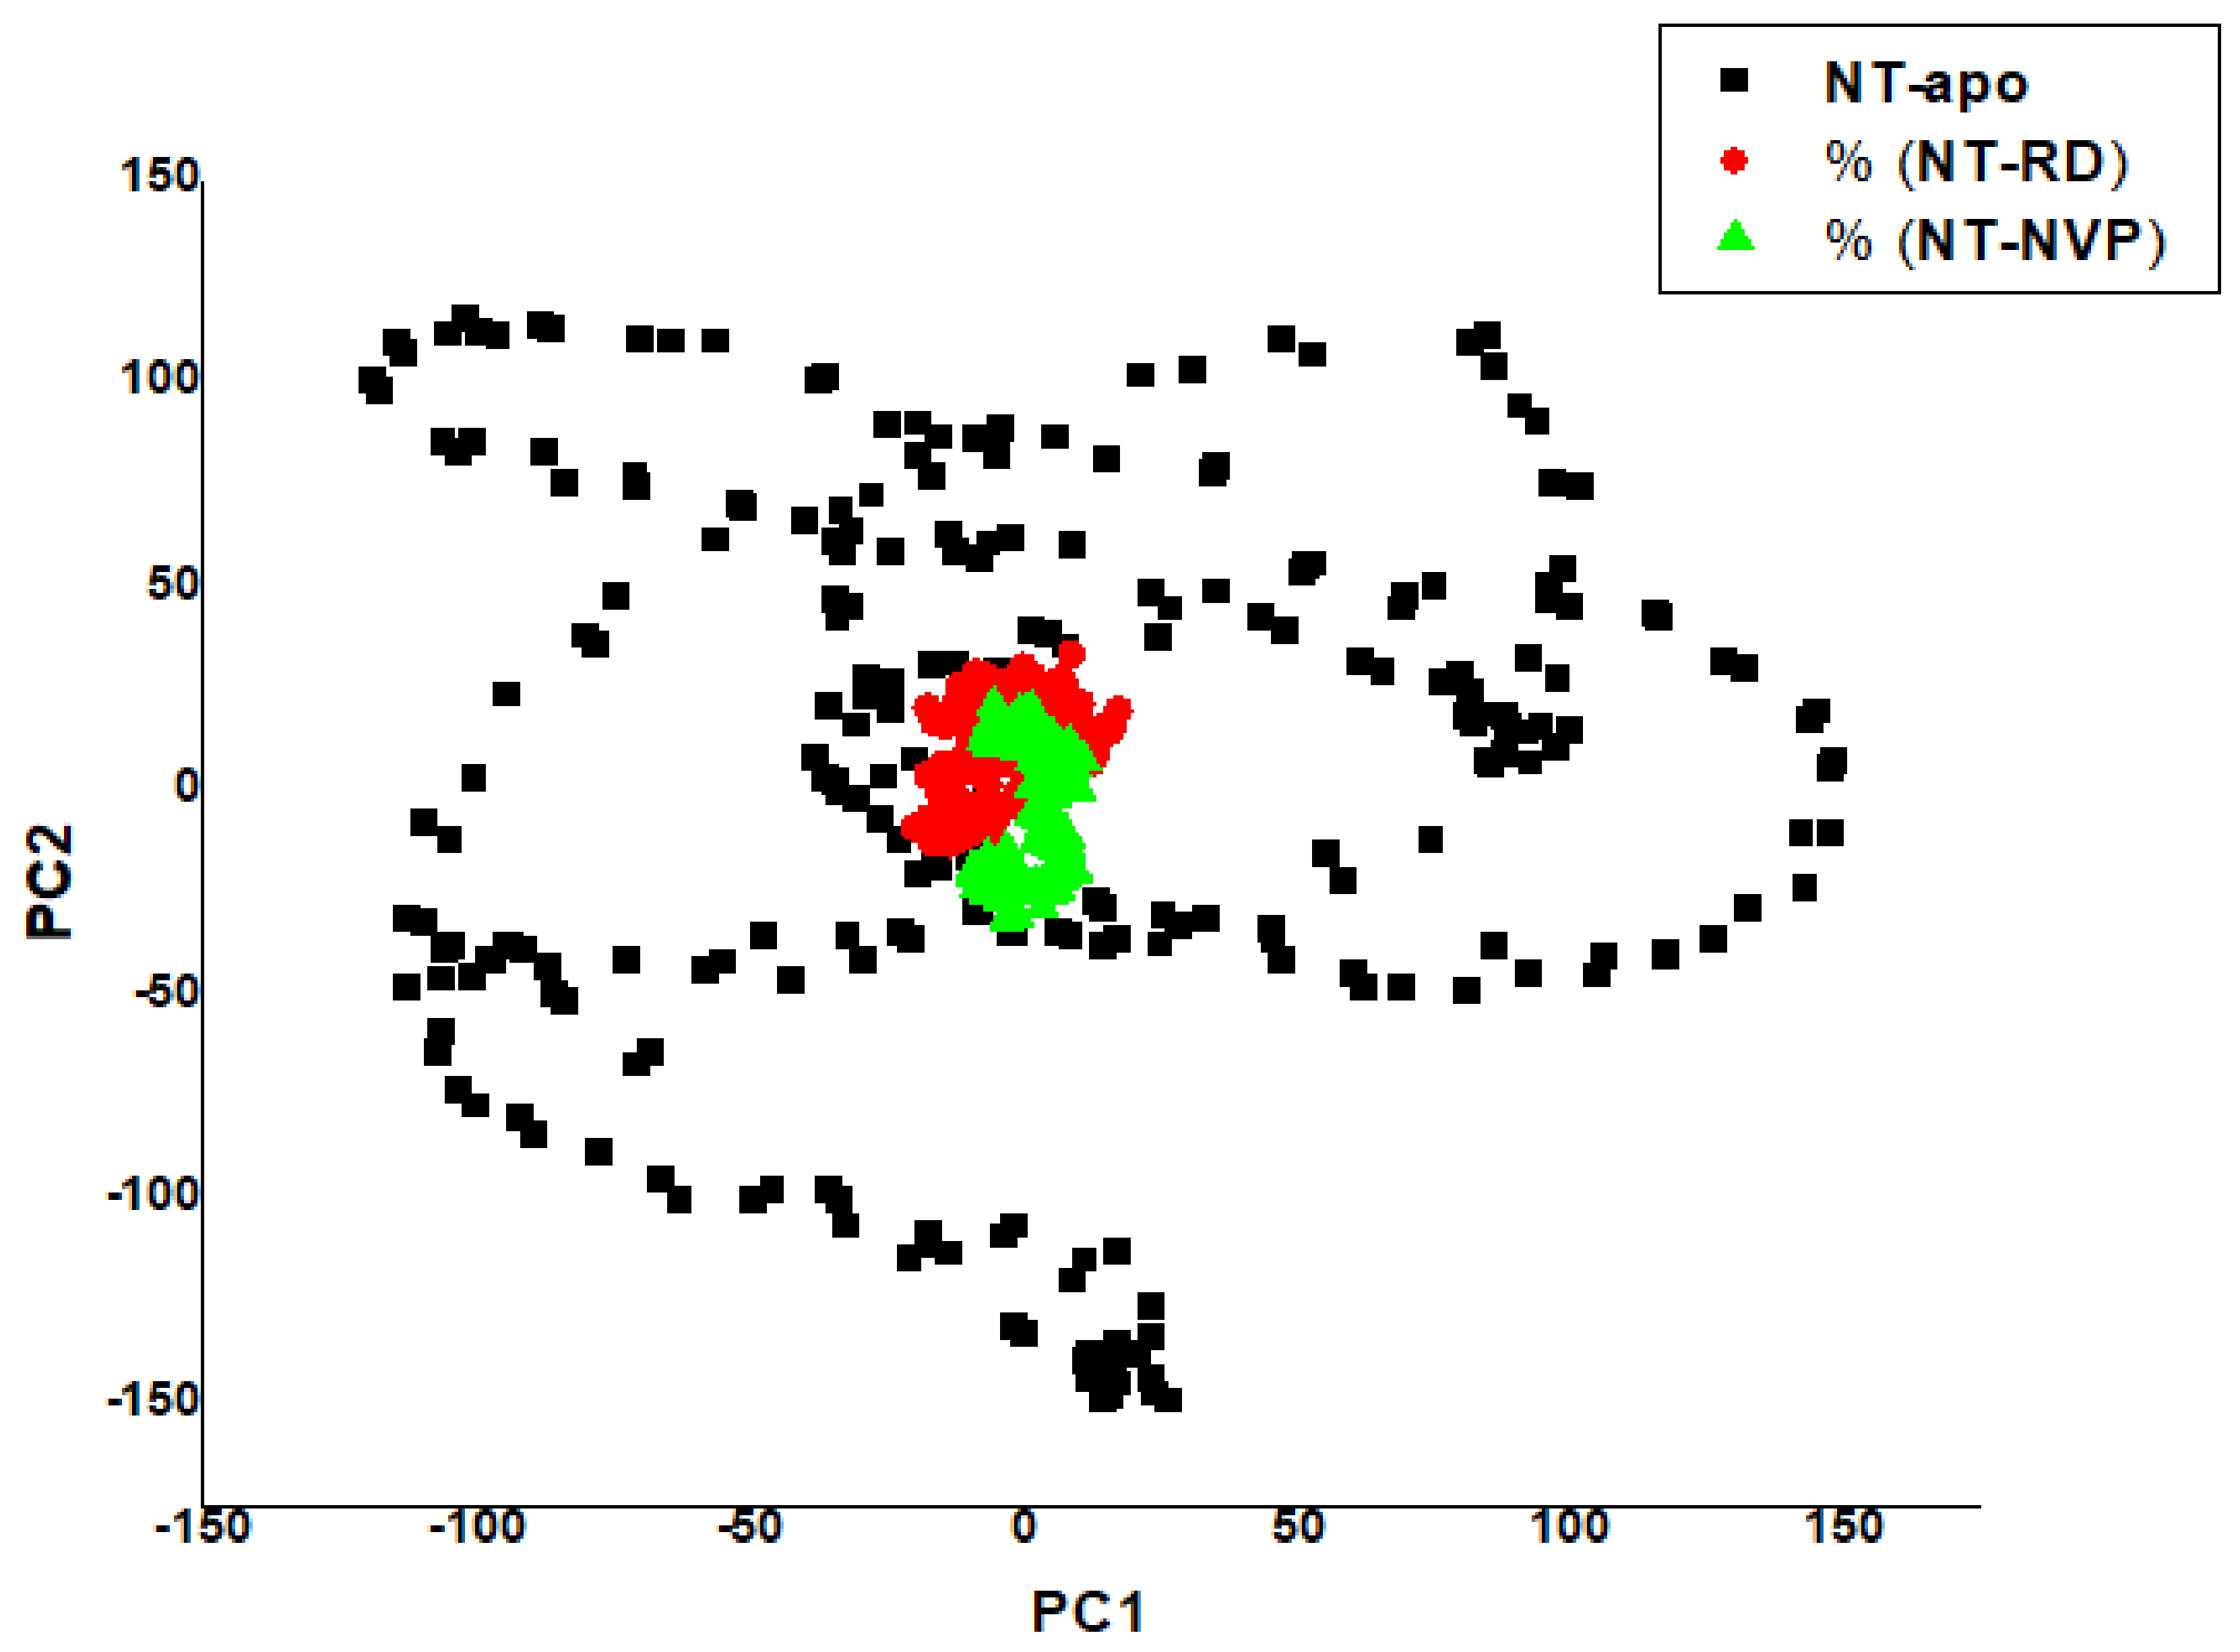
2.2.4. Principal Component Analysis (PCA)
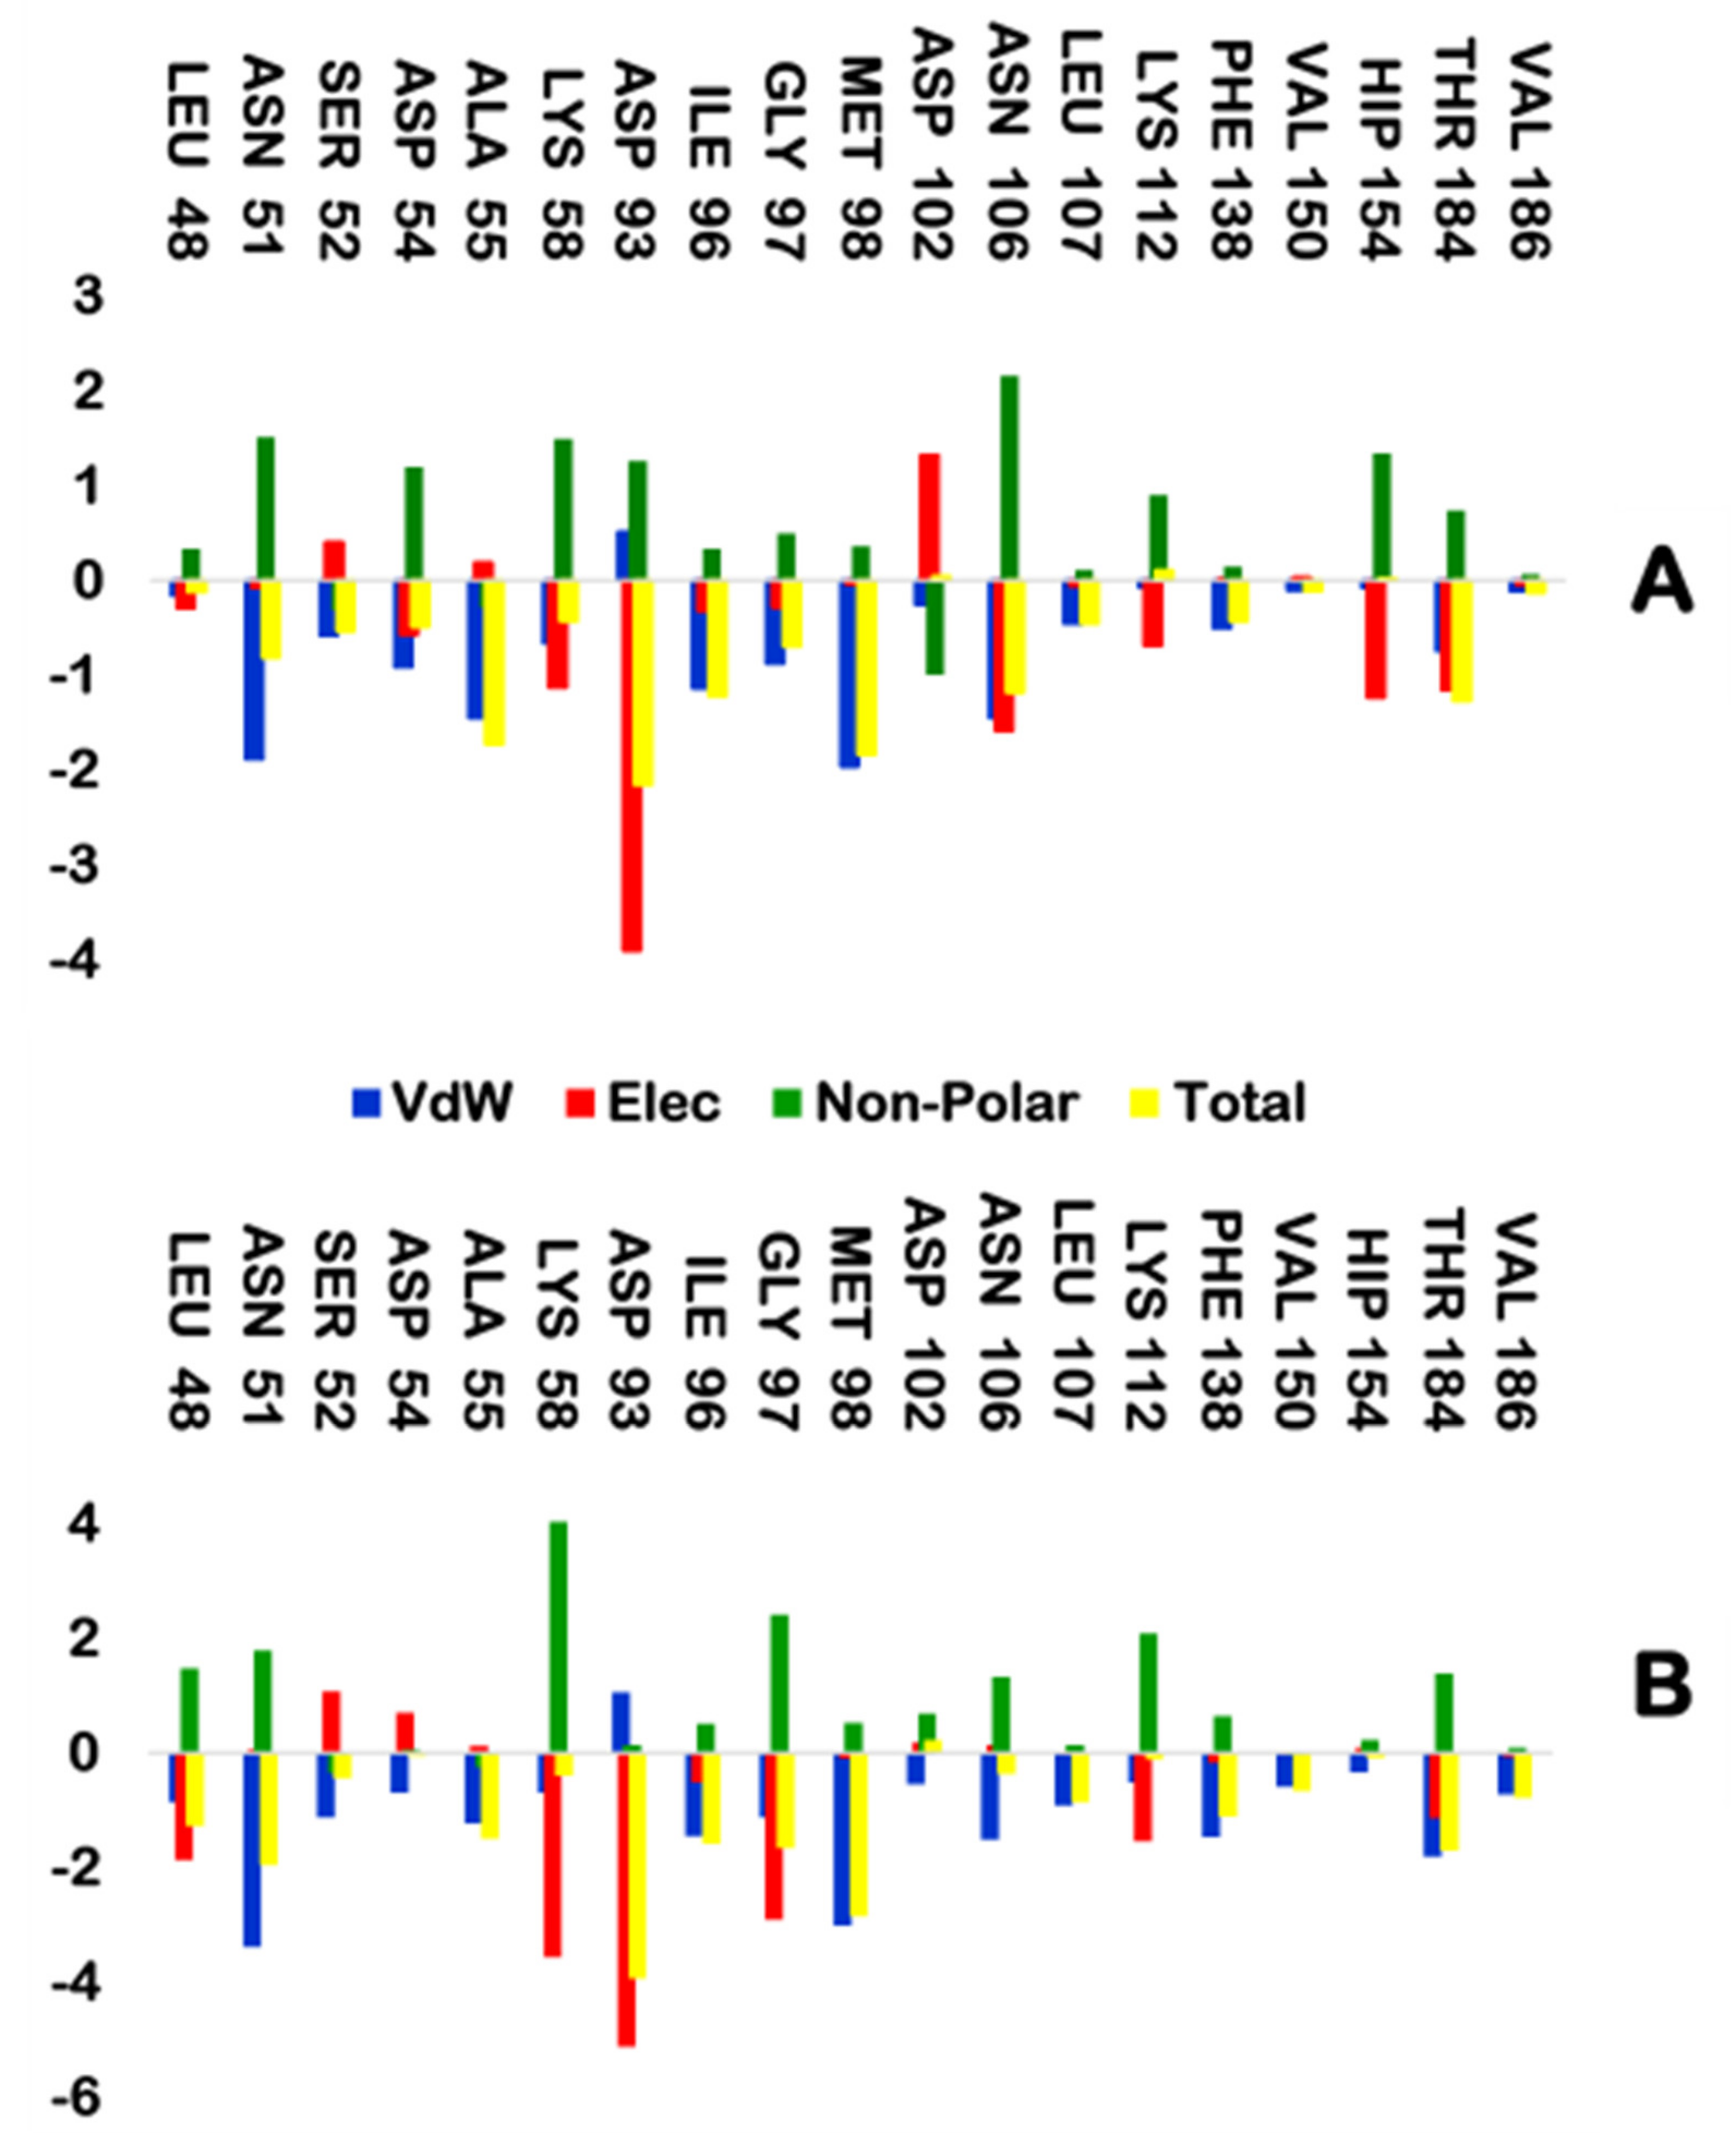
2.2.5. MM/GBSA Binding Free Energy Calculation
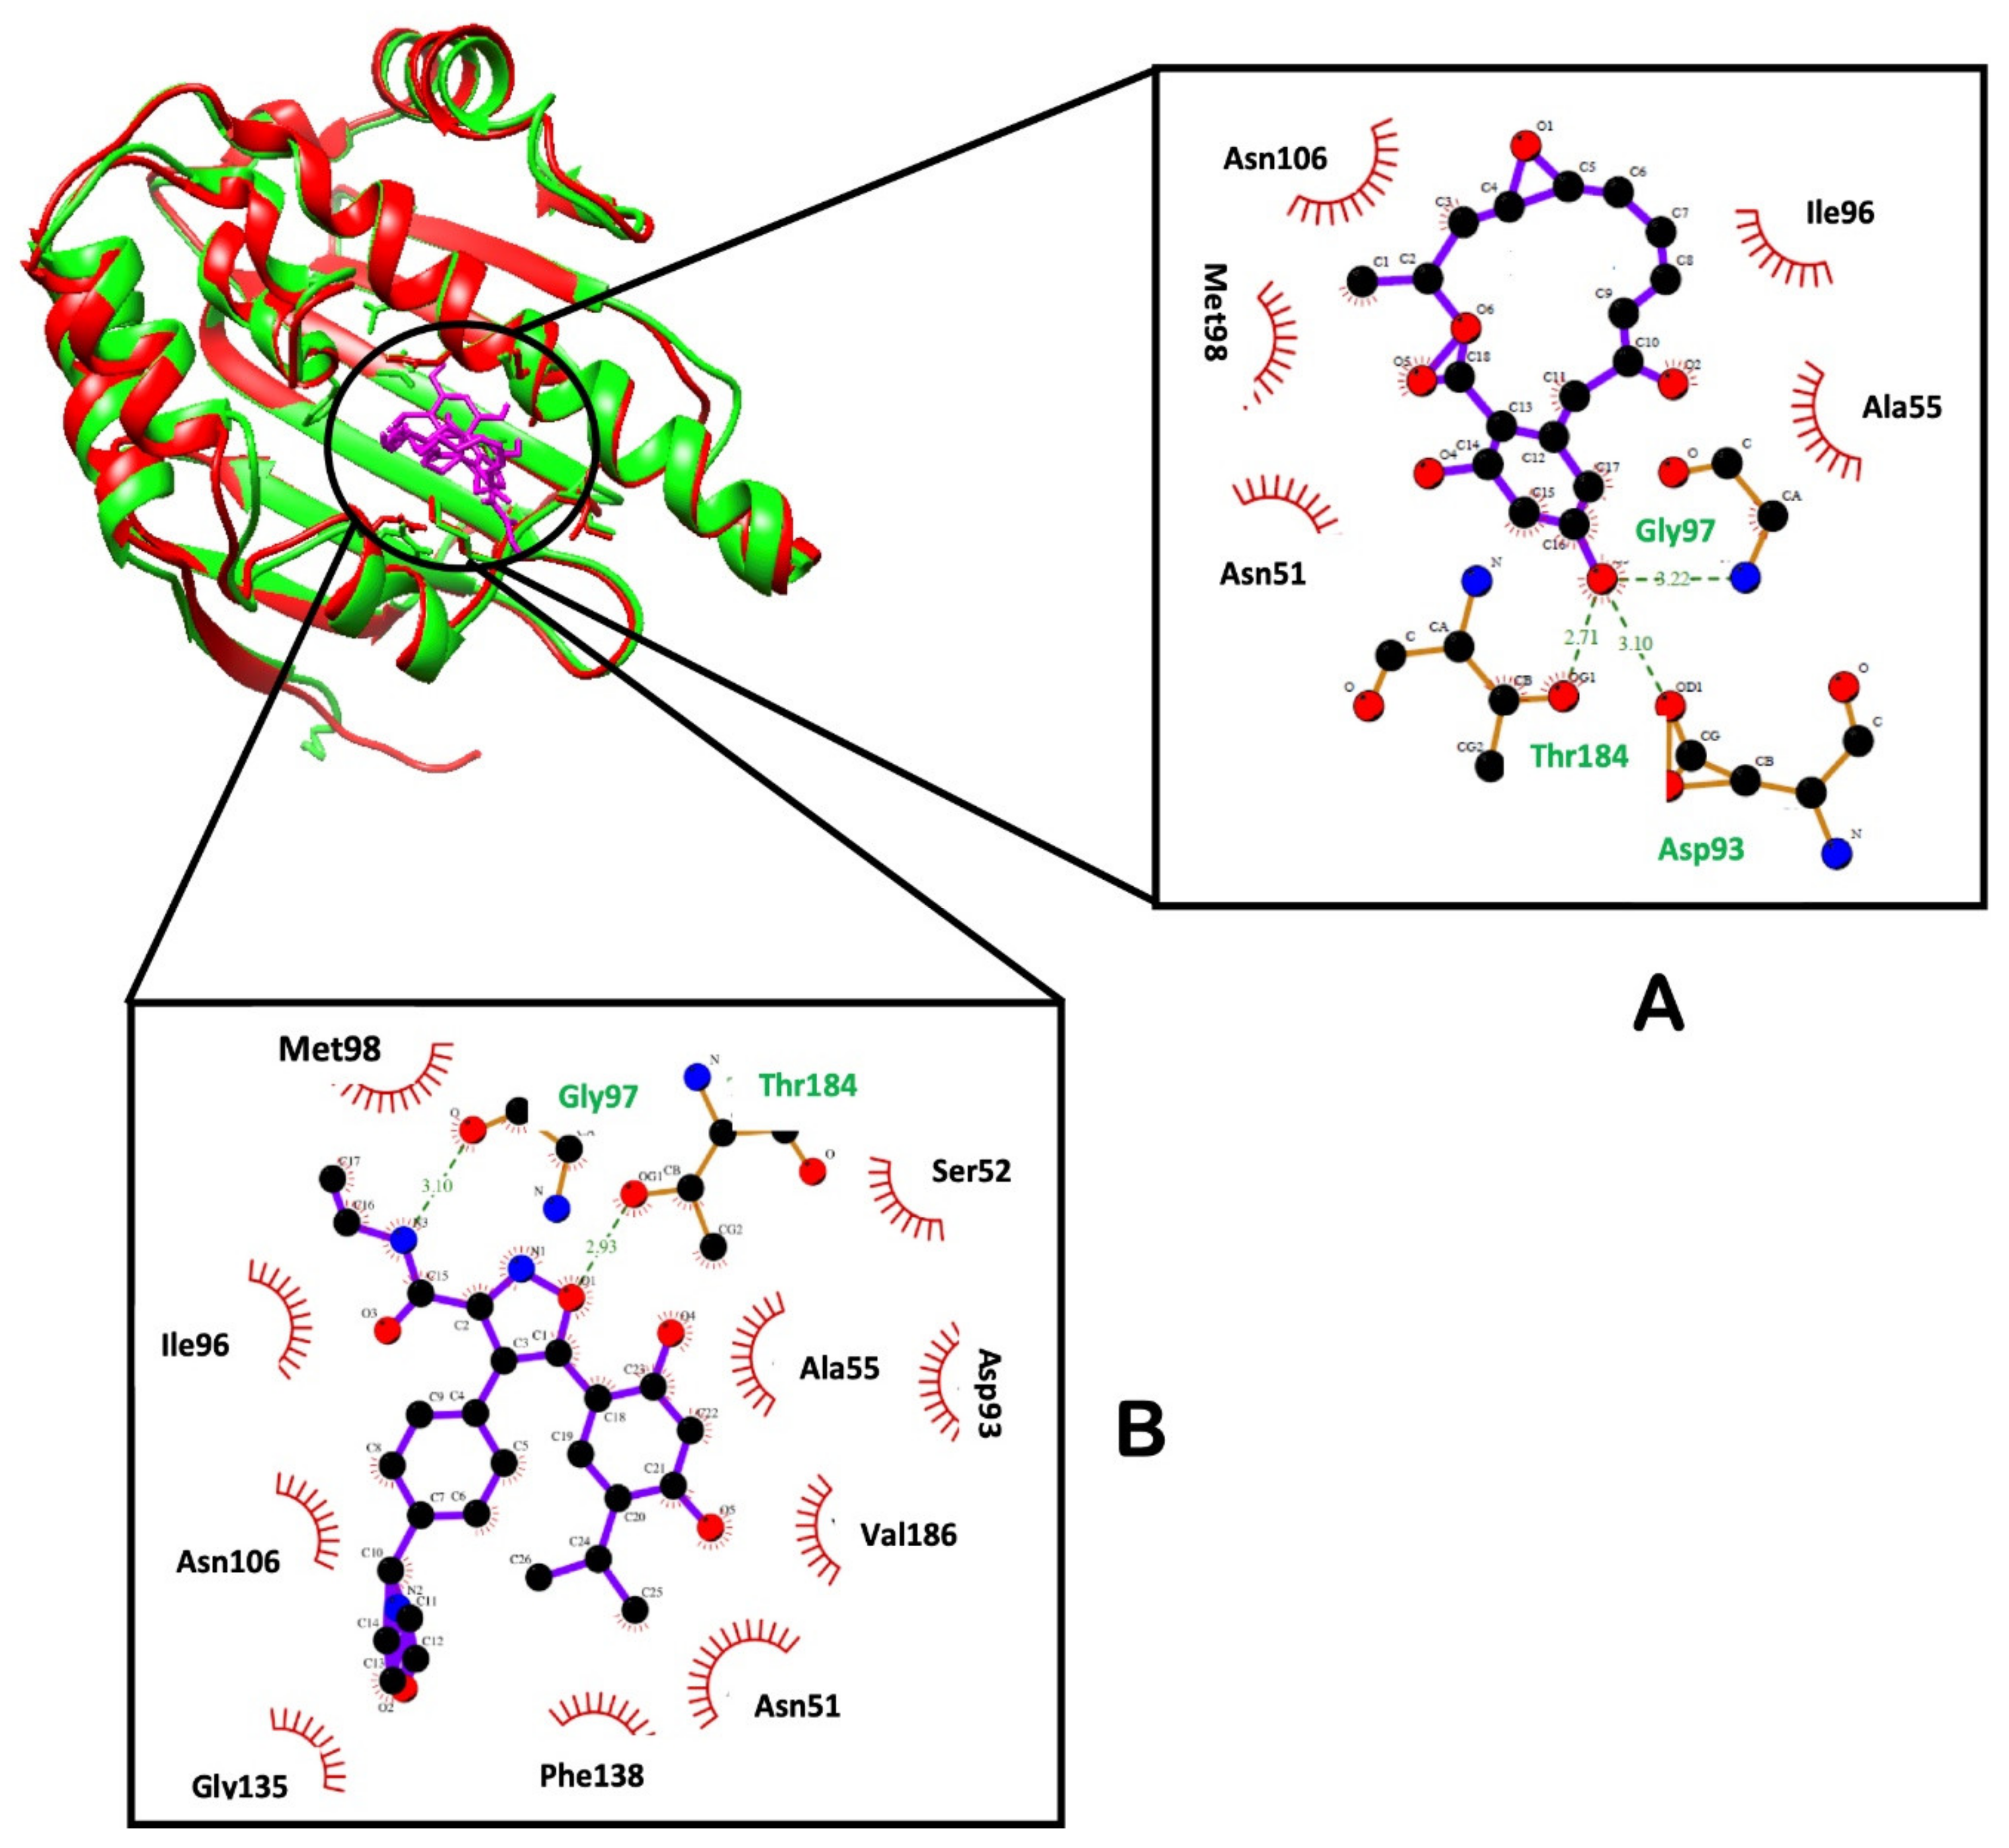
2.2.6. Hydrogen Bond Network Profile
3. Computational Methodology
3.1. DFT Calculations
3.1.1. Charge Distribution and Electrostatic Potential
3.1.2. Non-Linear Optical Properties
3.2. Molecular Dynamics Simulations Protocols
3.2.1. System Operations and Molecular Docking
3.2.2. System Preparation
3.2.3. Root Mean Standard Deviation
3.2.4. Root Mean Standard Fluctuation
3.2.5. Radius of Gyration
3.2.6. Binding Energy Calculations
4. Conclusions
Author Contributions
Funding
Acknowledgments
Conflicts of Interest
References
- Siegel, R.L.; Miller, K.D.; Jemal, A. Cancer statistics, 2019. CA. Cancer J. Clin. 2019, 69, 7–34. [Google Scholar] [CrossRef] [PubMed]
- De Rezende, L.F.M.; Lee, D.H.; da Costa Louzada, M.L.; Song, M.; Giovannucci, E.; Eluf-Neto, J. Proportion of cancer cases and deaths attributable to lifestyle risk factors in Brazil. Cancer Epidemiol. 2019, 59, 148–157. [Google Scholar] [CrossRef] [PubMed]
- Kumalo, H.M.; Bhakat, S.; Soliman, M.E. Heat-Shock Protein 90 (Hsp90) as Anticancer Target for Drug Discovery: An Ample Computational Perspective. Chem. Biol. Drug Des. 2015, 86, 1131–1160. [Google Scholar] [CrossRef]
- Aschner, Y.; Zemans, R.L.; Yamashita, C.M.; Downey, G.P. Matrix Metalloproteinases and Protein Tyrosine Kinases: Potential Novel Targets in Acute Lung Injury and ARDS. Chest 2014, 146, 1081–1091. [Google Scholar] [CrossRef]
- Fan, T.; Sun, G.; Sun, X.; Zhao, L.; Zhong, R.; Peng, Y. Tumor energy metabolism and potential of 3-bromopyruvate as an inhibitor of aerobic glycolysis: Implications in tumor treatment. Cancers. 2019, 11, 317. [Google Scholar] [CrossRef]
- Calderwood, S.K.; Khaleque, M.A.; Sawyer, D.B.; Ciocca, D.R. Heat shock proteins in cancer: Chaperones of tumorigenesis. Trends Biochem. Sci. 2006, 31, 164–172. [Google Scholar] [CrossRef]
- Janku, F.; Garrido-Laguna, I.; Petruzelka, L.B.; Stewart, D.J.; Kurzrock, R. Novel Therapeutic Targets in Non-small Cell Lung Cancer. J. Thorac. Oncol. 2011, 6, 1601–1612. [Google Scholar] [CrossRef]
- Allen, B.K.; Stathias, V.; Maloof, M.E.; Vidovic, D.; Winterbottom, E.F.; Capobianco, A.J.; Clarke, J.; Schurer, S.; Robbins, D.J.; Ayad, N.G. Epigenetic Pathways and Glioblastoma Treatment: Insights From Signaling Cascades. J. Cell. Biochem. 2015, 116, 351–363. [Google Scholar] [CrossRef]
- Berghoff, A.S.; Bartsch, R.; Wöhrer, A.; Streubel, B.; Birner, P.; Kros, J.M.; Brastianos, P.K.; von Deimling, A.; Preusser, M. Predictive molecular markers in metastases to the central nervous system: recent advances and future avenues. Acta Neuropathol. 2014, 128, 879–891. [Google Scholar] [CrossRef]
- Kenny, L.M.; Aboagye, E.O. Chapter Ten - Clinical Translation of Molecular Imaging Agents Used in PET Studies of Cancer. In Emerging Applications of Molecular Imaging to Oncology, 1st ed.; Pomper, M.G., Fisher, P.B.B.T.-A., Eds.; Academic Press: Amsterdam, Netherlands, 2014; Volume 124, pp. 329–374. ISBN 0065-230X. [Google Scholar]
- McArthur, J.C. Neurologic manifestations of AIDS. Medicine 1987, 66, 407–437. [Google Scholar] [CrossRef]
- Wang, J.; Walle, A.; Gordon, B.; Novogrodsky, A.; Suthanthiran, M.; Rubin, A.L.; Morrison, H.; Silver, R.T.; Stenzel, K.H. Adoptive immunotherapy for stage IV renal cell carcinoma: A novel protocol utilizing periodate and interleukin-2-activated autologous leukocytes and continuous infusions of low-dose interleukin-2. Am. J. Med. 1987, 83, 1016–1023. [Google Scholar] [CrossRef]
- Ali, M.M.U.; Roe, S.M.; Vaughan, C.K.; Meyer, P.; Panaretou, B.; Piper, P.W.; Prodromou, C.; Pearl, L.H. Crystal structure of an Hsp90–nucleotide–p23/Sba1 closed chaperone complex. Nature 2006, 440, 1013–1017. [Google Scholar] [CrossRef] [PubMed]
- Lackie, R.E.; Maciejewski, A.; Ostapchenko, V.G.; Marques-Lopes, J.; Choy, W.-Y.; Duennwald, M.L.; Prado, V.F.; Prado, M.A.M. The Hsp70/Hsp90 chaperone machinery in neurodegenerative diseases. Front. Neurosci. 2017, 11, 254. [Google Scholar] [CrossRef]
- Delmotte, P.; Delmotte-Plaquee, J. A New Antifungal Substance of Fungal Origin. Nature 1953, 171, 344. [Google Scholar] [CrossRef]
- Schulte, T.W.; Akinaga, S.; Soga, S.; Sullivan, W.; Stensgard, B.; Toft, D.; Neckers, L.M. Antibiotic radicicol binds to the N-terminal domain of Hsp90 and shares important biologic activities with geldanamycin. Cell Stress Chaperones 1998, 3, 100–108. [Google Scholar] [CrossRef]
- Roe, S.M.; Prodromou, C.; O’Brien, R.; Ladbury, J.E.; Piper, P.W.; Pearl, L.H. Structural Basis for Inhibition of the Hsp90 Molecular Chaperone by the Antitumor Antibiotics Radicicol and Geldanamycin. J. Med. Chem. 1999, 42, 260–266. [Google Scholar] [CrossRef]
- Khandelwal, A.; Crowley, V.M.; Blagg, B.S.J. Natural Product Inspired N-Terminal Hsp90 Inhibitors: From Bench to Bedside? Med. Res. Rev. 2016, 36, 92–118. [Google Scholar] [CrossRef]
- Soga, S.; Neckers, L.M.; Schulte, T.W.; Shiotsu, Y.; Akasaka, K.; Narumi, H.; Agatsuma, T.; Ikuina, Y.; Murakata, C.; Tamaoki, T.; et al. KF25706, a Novel Oxime Derivative of Radicicol, Exhibits in Vivo Antitumor Activity via Selective Depletion of Hsp90 Binding Signaling Molecules. Cancer Res. 1999, 59, 2931–2938. [Google Scholar]
- Zuehlke, A.D.; Moses, M.A.; Neckers, L. Heat shock protein 90: Its inhibition and function. Philos. Trans. R. Soc. B Biol. Sci. 2018, 373, 20160527. [Google Scholar] [CrossRef]
- Rowlands, M.G.; Newbatt, Y.M.; Prodromou, C.; Pearl, L.H.; Workman, P.; Aherne, W. High-throughput screening assay for inhibitors of heat-shock protein 90 ATPase activity. Anal. Biochem. 2004, 327, 176–183. [Google Scholar] [CrossRef]
- Baruchello, R.; Simoni, D.; Grisolia, G.; Barbato, G.; Marchetti, P.; Rondanin, R.; Mangiola, S.; Giannini, G.; Brunetti, T.; Alloatti, D.; et al. Novel 3,4-Isoxazolediamides as Potent Inhibitors of Chaperone Heat Shock Protein 90. J. Med. Chem. 2011, 54, 8592–8604. [Google Scholar] [CrossRef] [PubMed]
- Brough, P.A.; Aherne, W.; Barril, X.; Borgognoni, J.; Boxall, K.; Cansfield, J.E.; Cheung, K.-M.J.; Collins, I.; Davies, N.G.M.; Drysdale, M.J.; et al. 4,5-Diarylisoxazole Hsp90 Chaperone Inhibitors: Potential Therapeutic Agents for the Treatment of Cancer. J. Med. Chem. 2008, 51, 196–218. [Google Scholar] [CrossRef] [PubMed]
- Eccles, S.A.; Massey, A.; Raynaud, F.I.; Sharp, S.Y.; Box, G.; Valenti, M.; Patterson, L.; de Haven Brandon, A.; Gowan, S.; Boxall, F.; et al. NVP-AUY922: A Novel Heat Shock Protein 90 Inhibitor Active against Xenograft Tumor Growth, Angiogenesis, and Metastasis. Cancer Res. 2008, 68, 2850–2860. [Google Scholar] [CrossRef] [PubMed]
- Whitesell, L.; Lin, N.U. HSP90 as a platform for the assembly of more effective cancer chemotherapy. Biochim. Biophys. Acta Mol. Cell Res. 2012, 1823, 756–766. [Google Scholar] [CrossRef]
- Doi, T.; Onozawa, Y.; Fuse, N.; Yoshino, T.; Yamazaki, K.; Watanabe, J.; Akimov, M.; Robson, M.; Boku, N.; Ohtsu, A. Phase I dose-escalation study of the HSP90 inhibitor AUY922 in Japanese patients with advanced solid tumors. Cancer Chemother. Pharmacol. 2014, 74, 629–636. [Google Scholar] [CrossRef]
- Jensen, M.R.; Schoepfer, J.; Radimerski, T.; Massey, A.; Guy, C.T.; Brueggen, J.; Quadt, C.; Buckler, A.; Cozens, R.; Drysdale, M.J.; et al. NVP-AUY922: A small molecule HSP90 inhibitor with potent antitumor activity in preclinical breast cancer models. Breast Cancer Res. 2008, 10, R33. [Google Scholar] [CrossRef]
- Stingl, L.; Stühmer, T.; Chatterjee, M.; Jensen, M.R.; Flentje, M.; Djuzenova, C.S. Novel HSP90 inhibitors, NVP-AUY922 and NVP-BEP800, radiosensitise tumour cells through cell-cycle impairment, increased DNA damage and repair protraction. Br. J. Cancer 2010, 102, 1578. [Google Scholar] [CrossRef]
- Abbasi, M.; Sadeghi-Aliabadi, H.; Amanlou, M. 3D-QSAR, molecular docking, and molecular dynamic simulations for prediction of new Hsp90 inhibitors based on isoxazole scaffold. J. Biomol. Struct. Dyn. 2018, 36, 1463–1478. [Google Scholar] [CrossRef]
- Lawal, M.M.; Govender, T.; Maguire, G.E.M.; Kruger, H.G.; Honarparvar, B. DFT study of the acid-catalyzed esterification reaction mechanism of methanol with carboxylic acid and its halide derivatives. Int. J. Quantum Chem. 2018, 118, e25497. [Google Scholar] [CrossRef]
- Marenich, A.V.; Cramer, C.J.; Truhlar, D.G. Universal solvation model based on solute electron density and on a continuum model of the solvent defined by the bulk dielectric constant and atomic surface tensions. J. Phys. Chem. B 2009, 113, 6378–6396. [Google Scholar] [CrossRef]
- Da Silva, P.L.; Guimarães, L.; Pliego Jr, J.R. Revisiting the mechanism of neutral hydrolysis of esters: water autoionization mechanisms with acid or base initiation pathways. J. Phys. Chem. B 2013, 117, 6487–6497. [Google Scholar] [CrossRef]
- Lide, D.R. Handbook of Chemistry & Physics, 85th ed.; CRC press: Boca Raton, FL, USA, 2004; Volume 85, pp. 9–43. [Google Scholar]
- Pauling, L.; Brockway, L.O. Carbon—Carbon Bond Distances. The Electron Diffraction Investigation of Ethane, Propane, Isobutane, Neopentane, Cyclopropane, Cyclopentane, Cyclohexane, Allene, Ethylene, Isobutene, Tetramethylethylene, Mesitylene, and Hexamethylbenzene. Revised Values of Covalent Radii. J. Am. Chem. Soc. 1937, 59, 1223–1236. [Google Scholar] [CrossRef]
- Gangadharan, R.P.; Krishnan, S.S. Natural Bond Orbital (NBO) Population Analysis of 1-Azanapthalene-8-ol. Acta Phys. Pol. A. 2014, 125. [Google Scholar] [CrossRef]
- Glendening, E.D.; Landis, C.R.; Weinhold, F. NBO 6.0: Natural bond orbital analysis program. J. Comput. Chem. 2013, 34, 1429–1437. [Google Scholar] [CrossRef] [PubMed]
- Del Olmo, L.; Morera-Boado, C.; López, R.; de la Vega, J.M.G. Electron density analysis of 1-butyl-3-methylimidazolium chloride ionic liquid. J. Mol. Model. 2014, 20, 2175. [Google Scholar] [CrossRef] [PubMed]
- Ndagi, U.; Lawal, M.M.; Soliman, M.E. DFT study of the structural and electronic properties of selected organogold (III) compounds with characteristic anticancer activity. Russ. J. Phys. Chem. A 2019, 93, 1543–1558. [Google Scholar] [CrossRef]
- Weinhold, F.; Landis, C.R. Natural bond orbitals and extensions of localized bonding concepts. Chem. Educ. Res. Pract. 2001, 2, 91–104. [Google Scholar] [CrossRef]
- Ejalonibu, M.A.; Elrashedy, A.A.; Lawal, M.M.; Soliman, M.E.; Sosibo, S.C.; Kumalo, H.M.; Mhlongo, N.N. Dual targeting approach for Mycobacterium tuberculosis drug discovery: Insights from DFT calculations and molecular dynamics simulations. Struct. Chem. 2019, 1–15. [Google Scholar] [CrossRef]
- Adeowo, F.Y.; Honarparvar, B.; Skelton, A.A. Density functional theory study on the complexation of NOTA as a bifunctional chelator with radiometal ions. J. Phys. Chem. A 2017, 121, 6054–6062. [Google Scholar] [CrossRef]
- Kosevich, M.V.; Zobnina, V.G.; Stepanian, S.G.; Karachevtsev, V.A.; Adamowicz, L. The effect of protonation of cytosine and adenine on their interactions with carbon nanotubes. J. Mol. Graph. Model. 2016, 70, 77–84. [Google Scholar] [CrossRef]
- Weiner, P.K.; Langridge, R.; Blaney, J.M.; Schaefer, R.; Kollman, P.A. Electrostatic potential molecular surfaces. Proc. Natl. Acad. Sci. USA 1982, 79, 3754–3758. [Google Scholar] [CrossRef] [PubMed]
- Silva, N.G.d.; Alecrim, A.M.; Costa, R.A.; de Oliveira, K.M.T. Geometry and Stability of Molecular Clusters: Factor to Be Considered in Biomolecular Activity. J. Braz. Chem. Soc. 2018, 29, 2350–2362. [Google Scholar] [CrossRef]
- Raha, K.; Peters, M.B.; Wang, B.; Yu, N.; Wollacott, A.M.; Westerhoff, L.M.; Merz Jr, K.M. The role of quantum mechanics in structure-based drug design. Drug Discov. Today 2007, 12, 725–731. [Google Scholar] [CrossRef] [PubMed]
- Drissi, M.; Benhalima, N.; Megrouss, Y.; Rachida, R.; Chouaih, A.; Hamzaoui, F. Theoretical and experimental electrostatic potential around the m-nitrophenol molecule. Molecules 2015, 20, 4042–4054. [Google Scholar] [CrossRef]
- Rauf, S.M.A.; Arvidsson, P.I.; Albericio, F.; Govender, T.; Maguire, G.E.M.; Kruger, H.G.; Honarparvar, B. The effect of N-methylation of amino acids (Ac-X-OMe) on solubility and conformation: a DFT study. Org. Biomol. Chem. 2015, 13, 9993–10006. [Google Scholar] [CrossRef]
- Levine, B.F.; Bethea, C.G. Second and third order hyperpolarizabilities of organic molecules. J. Chem. Phys. 1975, 63, 2666–2682. [Google Scholar] [CrossRef]
- Bartlett, R.J.; Purvis III, G.D. Molecular hyperpolarizabilities. I. Theoretical calculations including correlation. Phys. Rev. A 1979, 20, 1313. [Google Scholar] [CrossRef]
- Thole, B.T. Molecular polarizabilities calculated with a modified dipole interaction. Chem. Phys. 1981, 59, 341–350. [Google Scholar] [CrossRef]
- Castellano, O.; Gimon, R.; Soscun, H. Theoretical study of the σ–π and π–π interactions in heteroaromatic monocyclic molecular complexes of benzene, pyridine, and thiophene dimers: implications on the resin–asphaltene stability in crude oil. Energy Fuels 2011, 25, 2526–2541. [Google Scholar] [CrossRef]
- Cummings, S.D.; Cheng, L.-T.; Eisenberg, R. Metalloorganic compounds for nonlinear optics: Molecular hyperpolarizabilities of M (diimine)(dithiolate) complexes (M= Pt, Pd, Ni). Chem. Mater. 1997, 9, 440–450. [Google Scholar] [CrossRef]
- Gregersen, E. The Britannica guide to electricity and magnetism, 1st ed.; Britannica Educational Publishing: New York, NY, USA, 2010; ISBN 1615303790. [Google Scholar]
- Sattin, S.; Tao, J.; Vettoretti, G.; Moroni, E.; Pennati, M.; Lopergolo, A.; Morelli, L.; Bugatti, A.; Zuehlke, A.; Moses, M.; et al. Activation of Hsp90 Enzymatic Activity and Conformational Dynamics through Rationally Designed Allosteric Ligands. Chem. A Eur. J. 2015, 21, 13598–13608. [Google Scholar] [CrossRef]
- Kato, M.; Li, J.; Chuang, J.L.; Chuang, D.T. Distinct Structural Mechanisms for Inhibition of Pyruvate Dehydrogenase Kinase Isoforms by AZD7545, Dichloroacetate, and Radicicol. Structure 2007, 15, 992–1004. [Google Scholar] [CrossRef]
- Garon, E.B.; Finn, R.S.; Hamidi, H.; Dering, J.; Pitts, S.; Kamranpour, N.; Desai, A.J.; Hosmer, W.; Ide, S.; Avsar, E.; et al. The HSP90 Inhibitor NVP-AUY922 Potently Inhibits Non Small Cell Lung Cancer Growth. Mol. Cancer Ther. 2013, 12, 890–900. [Google Scholar] [CrossRef] [PubMed]
- Sun, H.; Duan, L.; Chen, F.; Liu, H.; Wang, Z.; Pan, P.; Zhu, F.; Zhang, J.Z.H.; Hou, T. Assessing the performance of MM/PBSA and MM/GBSA methods. 7. Entropy effects on the performance of end-point binding free energy calculation approaches. Phys. Chem. Chem. Phys. 2018, 20, 14450–14460. [Google Scholar] [CrossRef] [PubMed]
- Pantsar, T.; Poso, A. Binding Affinity via Docking: Fact and Fiction. Molecules 2018, 23, 1899. [Google Scholar] [CrossRef]
- Prodromou, C.; Roe, S.M.; O’Brien, R.; Ladbury, J.E.; Piper, P.W.; Pearl, L.H. Identification and structural characterization of the ATP/ADP-binding site in the Hsp90 molecular chaperone. Cell 1997, 90, 65–75. [Google Scholar] [CrossRef]
- Sepehri, B.; Rezaei, M.; Ghavami, R. The in silico identification of potent anti-cancer agents by targeting the ATP binding site of the N-domain of HSP90. SAR QSAR Environ. Res. 2018, 29, 551–565. [Google Scholar] [CrossRef]
- Chen, D.; Oezguen, N.; Urvil, P.; Ferguson, C.; Dann, S.M.; Savidge, T.C. Regulation of protein-ligand binding affinity by hydrogen bond pairing. Sci. Adv. 2016, 2, e1501240. [Google Scholar] [CrossRef]
- Frisch, M.J.; Trucks, G.W.; Schlegel, H.B.; Scuseria, G.E.; Robb, M.A.; Cheeseman, J.R.; Scalmani, G.; Barone, V.; Petersson, G.A.; Nakatsuji, H. Gaussian, 16 version; Gaussian Inc: Wallingford, CT, USA, 2016. [Google Scholar]
- Lee, C.; Yang, W.; Parr, R.G. Development of the Colle-Salvetti correlation-energy formula into a functional of the electron density. Phys. Rev. B 1988, 37, 785. [Google Scholar] [CrossRef]
- Becke, A.D. Density-functional thermochemistry. II. The effect of the Perdew–Wang generalized-gradient correlation correction. J. Chem. Phys. 1992, 97, 9173–9177. [Google Scholar] [CrossRef]
- Rassolov, V.A.; Pople, J.A.; Ratner, M.A.; Windus, T.L. 6-31G* basis set for atoms K through Zn. J. Chem. Phys. 1998, 109, 1223–1229. [Google Scholar] [CrossRef]
- Lawal, M.M.; Govender, T.; Maguire, G.E.M.; Honarparvar, B.; Kruger, H.G. Mechanistic investigation of the uncatalyzed esterification reaction of acetic acid and acid halides with methanol: A DFT study. J. Mol. Model. 2016, 22, 235. [Google Scholar] [CrossRef] [PubMed]
- Dennington, R.; Keith, T.A.; Millam, J.M. GaussView, version 6.0. 16; Semichem Inc: Shawnee Mission, KS, USA, 2016. [Google Scholar]
- Besler, B.H.; Merz Jr, K.M.; Kollman, P.A. Atomic charges derived from semiempirical methods. J. Comput. Chem. 1990, 11, 431–439. [Google Scholar] [CrossRef]
- Li, J.; Sun, L.; Xu, C.; Yu, F.; Zhou, H.; Zhao, Y.; Zhang, J.; Cai, J.; Mao, C.; Tang, L.; et al. Structure insights into mechanisms of ATP hydrolysis and the activation of human heat-shock protein 90. Acta Biochim. Biophys. Sin. (Shanghai) 2012, 44, 300–306. [Google Scholar] [CrossRef]
- Morris, G.M.; Huey, R.; Lindstrom, W.; Sanner, M.F.; Belew, R.K.; Goodsell, D.S.; Olson, A.J. AutoDock4 and AutoDockTools4: Automated docking with selective receptor flexibility. J. Comput. Chem. 2009, 30, 2785–2791. [Google Scholar] [CrossRef]
- Trott, O.; Olson, A.J. AutoDock Vina: Improving the speed and accuracy of docking with a new scoring function, efficient optimization, and multithreading. J. Comput. Chem. 2010, 31, 455–461. [Google Scholar] [CrossRef]
- Pettersen, E.F.; Goddard, T.D.; Huang, C.C.; Couch, G.S.; Greenblatt, D.M.; Meng, E.C.; Ferrin, T.E. UCSF Chimera—A visualization system for exploratory research and analysis. J. Comput. Chem. 2004, 25, 1605–1612. [Google Scholar] [CrossRef]
- Hanwell, M.D.; Curtis, D.E.; Lonie, D.C.; Vandermeersch, T.; Zurek, E.; Hutchison, G.R. Avogadro: an advanced semantic chemical editor, visualization, and analysis platform. J. Cheminform. 2012, 4, 17. [Google Scholar] [CrossRef]
- Götz, A.W.; Williamson, M.J.; Xu, D.; Poole, D.; Le Grand, S.; Walker, R.C. Routine Microsecond Molecular Dynamics Simulations with AMBER on GPUs. 1. Generalized Born. J. Chem. Theory Comput. 2012, 8, 1542–1555. [Google Scholar] [CrossRef]
- Salomon-Ferrer, R.; Götz, A.W.; Poole, D.; Le Grand, S.; Walker, R.C. Routine Microsecond Molecular Dynamics Simulations with AMBER on GPUs. 2. Explicit Solvent Particle Mesh Ewald. J. Chem. Theory Comput. 2013, 9, 3878–3888. [Google Scholar] [CrossRef]
- Salomon-Ferrer, R.; Case, D.A.; Walker, R.C. An overview of the Amber biomolecular simulation package. Wiley Interdiscip. Rev. Comput. Mol. Sci. 2013, 3, 198–210. [Google Scholar] [CrossRef]
- Burger, S.K.; Schofield, J.; Ayers, P.W. Quantum Mechanics/Molecular Mechanics Restrained Electrostatic Potential Fitting. J. Phys. Chem. B 2013, 117, 14960–14966. [Google Scholar] [CrossRef] [PubMed]
- Sprenger, K.G.; Jaeger, V.W.; Pfaendtner, J. The General AMBER Force Field (GAFF) Can Accurately Predict Thermodynamic and Transport Properties of Many Ionic Liquids. J. Phys. Chem. B 2015, 119, 5882–5895. [Google Scholar] [CrossRef] [PubMed]
- Shao, Y.; Molnar, L.F.; Jung, Y.; Kussmann, J.; Ochsenfeld, C.; Brown, S.T.; Gilbert, A.T.B.; Slipchenko, L.V.; Levchenko, S.V.; O’Neill, D.P.; et al. Advances in methods and algorithms in a modern quantum chemistry program package. Phys. Chem. Chem. Phys. 2006, 8, 3172–3191. [Google Scholar] [CrossRef] [PubMed]
- Maier, J.A.; Martinez, C.; Kasavajhala, K.; Wickstrom, L.; Hauser, K.E.; Simmerling, C. ff14SB: Improving the Accuracy of Protein Side Chain and Backbone Parameters from ff99SB. J. Chem. Theory Comput. 2015, 11, 3696–3713. [Google Scholar] [CrossRef]
- Jorgensen, W.L.; Chandrasekhar, J.; Madura, J.D.; Impey, R.W.; Klein, M.L. Comparison of simple potential functions for simulating liquid water. J. Chem. Phys. 1983, 79, 926–935. [Google Scholar] [CrossRef]
- Bhakat, S.; Martin, A.J.M.; Soliman, M.E.S. An integrated molecular dynamics{,} principal component analysis and residue interaction network approach reveals the impact of M184V mutation on HIV reverse transcriptase resistance to lamivudine. Mol. BioSyst. 2014, 10, 2215–2228. [Google Scholar] [CrossRef]
- Chetty, S.; Soliman, M.E.S. Possible allosteric binding site on Gyrase B, a key target for novel anti-TB drugs: homology modelling and binding site identification using molecular dynamics simulation and binding free energy calculations. Med. Chem. Res. 2015, 24, 2055–2074. [Google Scholar] [CrossRef]
- Kumalo, H.M.; Soliman, M.E. A comparative molecular dynamics study on BACE1 and BACE2 flap flexibility. J. Recept. Signal Transduct. 2016, 36, 505–514. [Google Scholar] [CrossRef]
- Roe, D.R.; Cheatham, T.E. PTRAJ and CPPTRAJ: Software for Processing and Analysis of Molecular Dynamics Trajectory Data. J. Chem. Theory Comput. 2013, 9, 3084–3095. [Google Scholar] [CrossRef]
- Moberly, J.G.; Bernards, M.T.; Waynant, K. V Key features and updates for Origin 2018. J. Cheminform. 2018, 10, 5. [Google Scholar] [CrossRef] [PubMed]
- Sargsyan, K.; Grauffel, C.; Lim, C. How Molecular Size Impacts RMSD Applications in Molecular Dynamics Simulations. J. Chem. Theory Comput. 2017, 13, 1518–1524. [Google Scholar] [CrossRef] [PubMed]
- Shunmugam, L.; Soliman, M.E.S. Targeting HCV polymerase: a structural and dynamic perspective into the mechanism of selective covalent inhibition. RSC Adv. 2018, 8, 42210–42222. [Google Scholar] [CrossRef]
- Massova, I.; Kollman, P.A. Combined molecular mechanical and continuum solvent approach (MM-PBSA/GBSA) to predict ligand binding. Perspect. Drug Discov. Des. 2000, 18, 113–135. [Google Scholar] [CrossRef]
- Kollman, P.A.; Massova, I.; Reyes, C.; Kuhn, B.; Huo, S.; Chong, L.; Lee, M.; Lee, T.; Duan, Y.; Wang, W.; et al. Calculating Structures and Free Energies of Complex Molecules: Combining Molecular Mechanics and Continuum Models. Acc. Chem. Res. 2000, 33, 889–897. [Google Scholar] [CrossRef]
- Tsui, V.; Case, D.A. Theory and applications of the generalized born solvation model in macromolecular simulations. Biopolymers 2000, 56, 275–291. [Google Scholar] [CrossRef]
Sample Availability: Samples of the compounds are not available from the authors. |


| Atom | RD | NVP |
|---|---|---|
| Cl1 | −0.019 | O1, −0.618 |
| O2 | −0.584 | −0.320 |
| O3 | −0.610 | −0.704 |
| O4 | −0.659 | −0.701 |
| O5 | −0.700 | −0.708 |
| O6 | −0.644 | N6, −0.533 |
| O7 | −0.679 | N7, −0.176 |
| C15 | 0.849 | N8, −0.587 |
| RD | NVP | ||||
|---|---|---|---|---|---|
| Donor | Acceptor | E2 (kcal/mol) | Donor | Acceptor | E2 (kcal/mol) |
| LP (3) Cl1 | BD* (2) C17–C23 | 10.97 | LP (2) O2 | BD* (2) N7–C26 | 16.56 |
| LP (2) O2 | BD* (1) C9–H27 | 5.46 | LP (2) O2 | BD* (2) C16–C21 | 30.08 |
| LP (2) O3 | BD* (2) O4–C15 | 40.86 | LP (2) O3 | BD* (2) C27–C31 | 29.49 |
| LP (2) O4 | BD* (1) O3–C15 | 31.43 | LP (2) O4 | BD* (2) C22–C28 | 29.35 |
| LP (2) O4 | BD* (1) C15–C16 | 16.40 | LP (2) O5 | BD* (1) N8–C32 | 20.69 |
| LP (2) O5 | BD* (2) C16–C20 | 35.57 | LP (2) O5 | BD* (1) C26–C32 | 18.24 |
| LP (2) O6 | BD* (1) C19–C22 | 20.31 | LP (1) N6 | BD* (1) C10–H35 | 6.97 |
| LP (2) O6 | BD* (1) C21–22 | 16.89 | LP (1) N6 | BD* (1) C11–H39 | 6.97 |
| LP (2) O7 | BD* (2) C24–C25 | 32.79 | LP (1) N8 | BD* (2) O5–C32 | 75.47 |
| α (×10−24 esu) | βtot (×10−29 esu) | α (×10−24 esu) | βtot (×10−29 esu) | ||
| 51.857 | 18.333 | 70.692 | 103.494 | ||
| Energy Components (kcal/mol) | Expt (μM) | |||||
|---|---|---|---|---|---|---|
| ΔEvdw | ΔEelec | ΔGgas | ΔGsolv | ΔGbind | IC50 | |
| NT-RD | −31.9 ± 3.3 | −29.7 ± 7.2 | 37.0 ± 5.7 | 4.4 ± 0.3 | −28.9 ± 4.5 | 1 |
| NT-NVP | −52.5 ± 4.1 | −45.6 ± 7.2 | 55.3 ± 6.1 | −6.5 ± 0.6 | −49.4 ± 3.9 | 0.1 |
| #Acceptor | DonorH | Donor | Frames | Percentage (100 %) | Average Distance | |
|---|---|---|---|---|---|---|
| NT-RD | ASP 93@OD1 | RD@H1 | RD@O3 | 119247 | 59.6 | 2.6309 |
| THR 184@OG1 | RD@H1 | RD@O3 | 54267 | 27.1 | 2.7190 | |
| RD@O3 | GLY 97@H | GLY 97@N | 29273 | 14.6 | 2.9167 | |
| NT-NVP | ASP 93@OD2 | NVP@H23 | NVP@O4 | 199273 | 99.6 | 2.6117 |
| GLY 97@O | NVP@H15 | NVP@N3 | 64888 | 32.4 | 2.9001 | |
| NVP@O1 | THR 184@HG1 | THR 184@OG1 | 62686 | 31.3 | 2.8657 |
© 2020 by the authors. Licensee MDPI, Basel, Switzerland. This article is an open access article distributed under the terms and conditions of the Creative Commons Attribution (CC BY) license (http://creativecommons.org/licenses/by/4.0/).
Share and Cite
Magwenyane, A.M.; Mhlongo, N.N.; Lawal, M.M.; Amoako, D.G.; Somboro, A.M.; Sosibo, S.C.; Shunmugam, L.; Khan, R.B.; Kumalo, H.M. Understanding the Hsp90 N-Terminal Dynamics: Structural and Molecular Insights into the Therapeutic Activities of Anticancer Inhibitors Radicicol (RD) and Radicicol Derivative (NVP-YUA922). Molecules 2020, 25, 1785. https://doi.org/10.3390/molecules25081785
Magwenyane AM, Mhlongo NN, Lawal MM, Amoako DG, Somboro AM, Sosibo SC, Shunmugam L, Khan RB, Kumalo HM. Understanding the Hsp90 N-Terminal Dynamics: Structural and Molecular Insights into the Therapeutic Activities of Anticancer Inhibitors Radicicol (RD) and Radicicol Derivative (NVP-YUA922). Molecules. 2020; 25(8):1785. https://doi.org/10.3390/molecules25081785
Chicago/Turabian StyleMagwenyane, Ayanda M., Ndumiso N. Mhlongo, Monsurat M. Lawal, Daniel G. Amoako, Anou M. Somboro, Sphelele C. Sosibo, Letitia Shunmugam, Rene B. Khan, and Hezekiel M. Kumalo. 2020. "Understanding the Hsp90 N-Terminal Dynamics: Structural and Molecular Insights into the Therapeutic Activities of Anticancer Inhibitors Radicicol (RD) and Radicicol Derivative (NVP-YUA922)" Molecules 25, no. 8: 1785. https://doi.org/10.3390/molecules25081785
APA StyleMagwenyane, A. M., Mhlongo, N. N., Lawal, M. M., Amoako, D. G., Somboro, A. M., Sosibo, S. C., Shunmugam, L., Khan, R. B., & Kumalo, H. M. (2020). Understanding the Hsp90 N-Terminal Dynamics: Structural and Molecular Insights into the Therapeutic Activities of Anticancer Inhibitors Radicicol (RD) and Radicicol Derivative (NVP-YUA922). Molecules, 25(8), 1785. https://doi.org/10.3390/molecules25081785