Band-Gap Energies of Choline Chloride and Triphenylmethylphosphoniumbromide-Based Systems


Abstract

1. Introduction
2. Results and Discussion
3. Materials and Methods
3.1. Sample Preparation
3.2. UV–VIS Analysis
4. Conclusions
Author Contributions
Funding
Conflicts of Interest
References and Notes
- Li, X.; Row, K.H. Development of deep eutectic solvents applied in extraction and separation. J. Sep. Sci. 2016, 39, 3505–3520. [Google Scholar] [CrossRef] [PubMed]
- Liu, P.; Hao, J.W.; Mo, L.P.; Zhang, Z.H. Recent advances in the application of deep eutectic solvents as sustainable media as well as catalysts in organic reactions. RSC Adv. 2015, 5, 48675–48704. [Google Scholar] [CrossRef]
- Khandelwal, S.; Tailor, Y.K.; Kumar, M. Deep eutectic solvents (DESs) as eco-friendly and sustainable solvent/catalyst systems in organic transformations. J. Mol. Liq. 2016, 215, 345–386. [Google Scholar] [CrossRef]
- Di Pietro, M.E.; Colombo Dugoni, G.; Ferro, M.; Mannu, A.; Castiglione, F.; Costa Gomes, M.; Fourmentin, S.; Mele, A. Do Cyclodextrins Encapsulate Volatiles in Deep Eutectic Systems? ACS Sustain. Chem. Eng. 2019, 7, 17397–17405. [Google Scholar] [CrossRef]
- Garcia-Alvarez, J. Deep Eutectic Mixtures: Promising Sustainable Solvents for Metal-Catalysed and Metal-Mediated Organic Reactions. Eur. J. Inorg. Chem. 2015, 31, 5147–5157. [Google Scholar] [CrossRef]
- Zhang, Q.; Wang, Q.; Zhang, S.; Lu, X.; Zhang, X. Electrodeposition in Ionic Liquids. Chem. Phys. Chem. 2016, 17, 335–351. [Google Scholar] [CrossRef]
- Wagle, D.V.; Zhao, H.; Baker, G.A. Deep eutectic solvents: Sustainable media for nanoscale and functional materials. Acc. Chem. Res. 2014, 47, 2299–2308. [Google Scholar] [CrossRef]
- Olivares, B.; Martinez, F.; Rivas, L.; Calderon, C.; Munita, J.M.; Campodonico, P.R. A Natural Deep Eutectic Solvent Formulated to Stabilize β-Lactam Antibiotics. Sci. Rep. 2018, 8, 14900–14912. [Google Scholar] [CrossRef]
- Abbott, A.P.; Capper, G.; Davies, D.L.; Rasheed, R.K.; Tambyrajah, V. Novel solvent properties of choline chloride/urea mixtures. Chem. Commun. 2003, 1, 70–71. [Google Scholar] [CrossRef]
- Smith, E.W.L.; Abbott, A.P.; Ryder, K.S. Deep eutectic solvents (DESs) and their applications. Chem. Rev. 2014, 114, 11060–11082. [Google Scholar] [CrossRef]
- Mannu, A.; Ferro, M.; Colombo Dugoni, G.; Di Pietro, M.E.; Garroni, S.; Mele, A. From deep eutectic solvents to deep band gap systems. J. Mol. Liq. 2020, 301, 112441–112449. [Google Scholar] [CrossRef]
- Fürth, R. On the theory of the liquid state: I. The statistical treatment of the thermodynamics of liquids by the theory of holes. Proc. Camb. Phil. Soc. 1941, 37, 252–275. [Google Scholar]
- Abbott, A.P. Application of hole theory to the viscosity of ionic and molecular liquids. Chem. Phys. Chem. 2004, 5, 1242–1246. [Google Scholar] [CrossRef] [PubMed]
- Chan, F.T.S.; Kaminski-Schierle, G.S.; Kumita, J.R.; Bertoncini, C.W.; Dobsonb, C.B.; Kaminski, C.F. Protein amyloids develop an intrinsic fluorescence signature during aggregation. Analyst 2013, 138, 2156–2162. [Google Scholar] [CrossRef]
- Ashworth, C.R.; Matthews, R.P.; Welton, T.; Hunt, P.A. Doubly ionic hydrogen bond interactions within the choline chloride–urea deep eutectic solvent. Phys. Chem. Chem. Phys. 2016, 18, 18145–18160. [Google Scholar] [CrossRef]
- Wang, H.; Liu, S.; Zhao, Y.; Wang, J.; Yu, Z. Insights into the Hydrogen Bond Interactions in Deep Eutectic Solvents Composed of Choline Chloride and Polyols. ACS Sust. Chem. Eng. 2019, 7, 7760–7767. [Google Scholar] [CrossRef]
- Viezbicke, B.D.; Patel, S.; Davis, B.E.; Birnie, D.P. Evaluation of the Tauc method for optical absorption edge determination: ZnO thin films as a model system. Phys. Status Solidi B 2015, 252, 1700–1710. [Google Scholar] [CrossRef]
- Schwarze, M.; Tress, W.; Beyer, B.; Gao, F.; Scholz, R.; Poelking, C.; Ortstein, K.; Günther, A.A.; Kasemann, D.; Andrienko, D.; et al. Band structure engineering in organic semiconductors. Science 2016, 352, 1446–1449. [Google Scholar] [CrossRef]
- Hou, Y.; Gu, Y.; Zhang, S.; Yang, F.; Ding, H.; Shan, Y. Novel binary eutectic mixtures based on imidazole. J. Mol. Liq. 2008, 143, 154–159. [Google Scholar] [CrossRef]
- Dai, Y.; van Spronsen, J.; Witkamp, G.-J.; Verpoorte, R.; Choi, Y.H. Natural deep eutectic solvents as new potential media for green technology. Anal. Chim. Acta 2013, 766, 61–68. [Google Scholar] [CrossRef]
- Skulcova, A.; Russ, A.; Jablonsky, M.; Sima, J. The pH behavior of seventeen deep eutectic solvents. BioResources 2018, 13, 5042–5051. [Google Scholar]
- Abbott, A.P.; Davies, D.L.; Capper, G.; Rasheed, R.; Tambyrajah, V. Lonic Liquids and Their Use as Solvents. WO 2002026701, 1 May 2003. [Google Scholar]
- Skulcova, A.; Majova, V.; Kohutova, M.; Grosik, M.; Sima, J.; Jablonsky, M. UV/Vis Spectrometry as a Quantification Tool for Lignin Solubilized in Deep Eutectic Solvents. BioResources 2017, 12, 6713–6722. [Google Scholar] [CrossRef]
- Raghuwanshi, V.S.; Ochmann, M.; Hoell, A.; Polzer, F.; Rademann, K. Deep Eutectic Solvents for the Self-Assembly of Gold Nanoparticles: A SAXS, UV–Vis, and TEM Investigation. Langmuir 2014, 30, 6038–6046. [Google Scholar] [CrossRef] [PubMed]
- Tauc, J.; Grigorovici, R.; Vancu, A. Optical Properties and Electronic Structure of Amorphous Germanium. Phys. Stat. Sol. 1966, 15, 627–638. [Google Scholar] [CrossRef]
- Wagner, E.P. Investigating Bandgap Energies, Materials, and Design of Light-Emitting Diodes. J. Chem. Educ. 2016, 93, 1289–1298. [Google Scholar] [CrossRef]
- Glassey, W.V. Spreadsheet Modeling of Electron Distributions in Solids. J. Chem. Educ. 2006, 83, 327–333. [Google Scholar] [CrossRef]
- For the analytic calculation see reference 1, Supporting Information Li, X.; Row, K.H. Development of deep eutectic solvents applied in extraction and separation. J. Sep. Sci. 2016, 39, 3505–3520. [Google Scholar] [CrossRef] [PubMed]
- Costa, J.C.S.; Taveira, R.J.S.; Lima, C.F.R.A.C.; Mendes, A.; Santos, L.M.N.B.F. Optical band gaps of organic semiconductor materials. Opt. Mater. 2016, 58, 51–60. [Google Scholar] [CrossRef]
- Kumari, P.; Supreet, S.; Kaur, S.; Kashyap, H.K. Influence of Hydration on the Structure of Reline Deep Eutectic Solvent: A Molecular Dynamics Study. ACS Omega 2018, 3, 15246–15255. [Google Scholar] [CrossRef]
- Ma, C.; Laaksonen, A.; Liu, C.; Lu, X.; Ji, X. The peculiar effect of water on ionic liquids and deep eutectic solvents. Chem. Soc. Rev. 2018, 47, 8685–8720. [Google Scholar] [CrossRef]
- Chan, C.K.; Kim, E.G.; Bredas, J.L.; Kahn, A. Molecular n-type doping of 1,4,5,8-naphthalene tetracarboxylic dianhydride by pyronin B studied using direct and inverse photoelectron spectroscopies. Adv. Funct. Mater. 2006, 16, 831–837. [Google Scholar] [CrossRef]
- Evans, D.A.; McGlynn, A.G.; Towlson, B.M.; Gunn, M.; Jones, D.; Jenkins, T.E.; Winter, R.; Poolton, N.R.J. Determination of the optical band-gap energy of cubic and hexagonal boron nitride using luminescence excitation spectroscopy. J. Phys. Cond. Mat. 2008, 20, 1–7. [Google Scholar] [CrossRef]
- Beaton, D.A.; Alberi, K.; Fluegel, B.; Mascarenhas, A.; Reno, J.L. Precise Determination of the Direct–Indirect Band Gap Energy Crossover Composition in AlxGa1_xAs. Appl. Phys. Express 2013, 6, 071205-1–071201-5. [Google Scholar] [CrossRef]
- Maksimov, O.; Tamargo, M.C. Direct-to-indirect band gap crossover for the Be x Zn 1−x Te alloy. Appl. Phys. Lett. 2001, 79, 782–786. [Google Scholar] [CrossRef]
- Tran, T.T.; Panella, J.R.; Chamorro, J.R.; Morey, J.R.; McQueen, T.M. Designing indirect–direct bandgap transitions in double perovskites. Mater. Horiz. 2017, 4, 688–693. [Google Scholar] [CrossRef]
- Tongay, S.; Zhou, J.; Ataca, C.; Lo, K.; Matthews, T.S.; Li, J.; Grossman, J.C.; Wu, J. Thermally Driven Crossover from Indirect toward Direct Bandgap in 2D Semiconductors: MoSe2 versus MoS2. Nano Lett. 2012, 12, 5576–5580. [Google Scholar] [CrossRef]
- Zhu, Z.; Xiao, J.; Sun, H.; Hu, Y.; Cao, R.; Wang, Y.; Zhao, L.; Zhuang, J. Composition-dependent band gaps and indirect–direct band gap transitions of group-IV semiconductor alloys. Phys. Chem. Chem. Phys. 2015, 17, 21605–21610. [Google Scholar] [CrossRef]
- Mudd, G.W.; Molas, M.R.; Chen, X.; Zólyomi, V.; Nogajewski, K.; Kudrynskyi, Z.R.; Kovalyuk, Z.D.; Yusa, G.; Makarovsky, O.; Eaves, L.; et al. The direct-to-indirect band gap crossover in two-dimensional van der Waals Indium Selenide crystals. Sci. Rep. 2016, 6, 39619–39629. [Google Scholar] [CrossRef]
- Hassanien, A.S.; Akl, A.A. Effect of Se addition on optical and electrical properties of chalcogenide CdSSe thin films. Superlattice. Microst. 2016, 89, 153–169. [Google Scholar] [CrossRef]
- Urbach, F. The Long-Wavelength Edge of Photographic Sensitivity and of the Electronic Absorption of Solids. Phys. Rev. 1953, 92, 1324. [Google Scholar] [CrossRef]
- Muiva, C.M.; Sathiaraj, T.S.; Mwabora, J.M. Chemical bond approach to optical properties of some flash evaporated Se100−XSbX chalcogenide alloys. Eur. Phys. J. Appl. Phys. 2012, 59, 10301–10308. [Google Scholar] [CrossRef]
- Qin, H.; Hu, X.; Wang, J.; Cheng, H.; Chen, L.; Qi, Z. Overview of acidic deep eutectic solvents on synthesis, properties and applications. Green Energy Environ. 2020, 5, 8–21. [Google Scholar] [CrossRef]
- Posada, E.; López-Salas, N.; Jiménez Riobóo, R.J.; Ferrer, M.L.; Gutiérrez, M.C.; Del Monte, F. Reline aqueous solutions behaving as liquid mixtures of H-bonded co-solvents: Microphase segregation and formation of co-continuous structures as indicated by Brillouin and 1H NMR spectroscopies. Phys. Chem. Chem. Phys. 2017, 19, 17103–17110. [Google Scholar] [CrossRef] [PubMed]
- Hammond, O.S.; Bowron, D.T.; Edler, K.J. The Effect of Water upon Deep Eutectic Solvent Nanostructure: An Unusual Transition from Ionic Mixture to Aqueous Solution. Angew. Chem. Int. Ed. 2017, 56, 9782–9785. [Google Scholar] [CrossRef] [PubMed]
Sample Availability: Samples of the compounds are not available from the authors. |


| System | HBA | HBD | Molar Ratio |
|---|---|---|---|
| 1 | Choline chloride | nickel sulphate | 1:1a |
| 2 | Choline chloride | imidazole | 3:7a |
| 3 | Choline chloride | d-(+)-glucose | 2:1a |
| 4 | Choline chloride | Glycerol | 1:5a |
| 5 | Triphenylmethylphosphonium bromide | ethylene glycol | 1:5 |
| 6 | Triphenylmethylphosphonium bromide | Glycerol | 1:5 |
| Entry | HBA | HBD | Indirect Band Gap (eV) | Direct Band Gap (eV) |
|---|---|---|---|---|
| 1 | Choline chloride | Nickel sulphate | - | 5.18a (0.96945) |
| 2 | Choline chloride | Imidazole | - | 4.74a (0.98835) |
| 3 | Choline chloride | d-(+)-glucose | - | 5.85a (0.9828) |
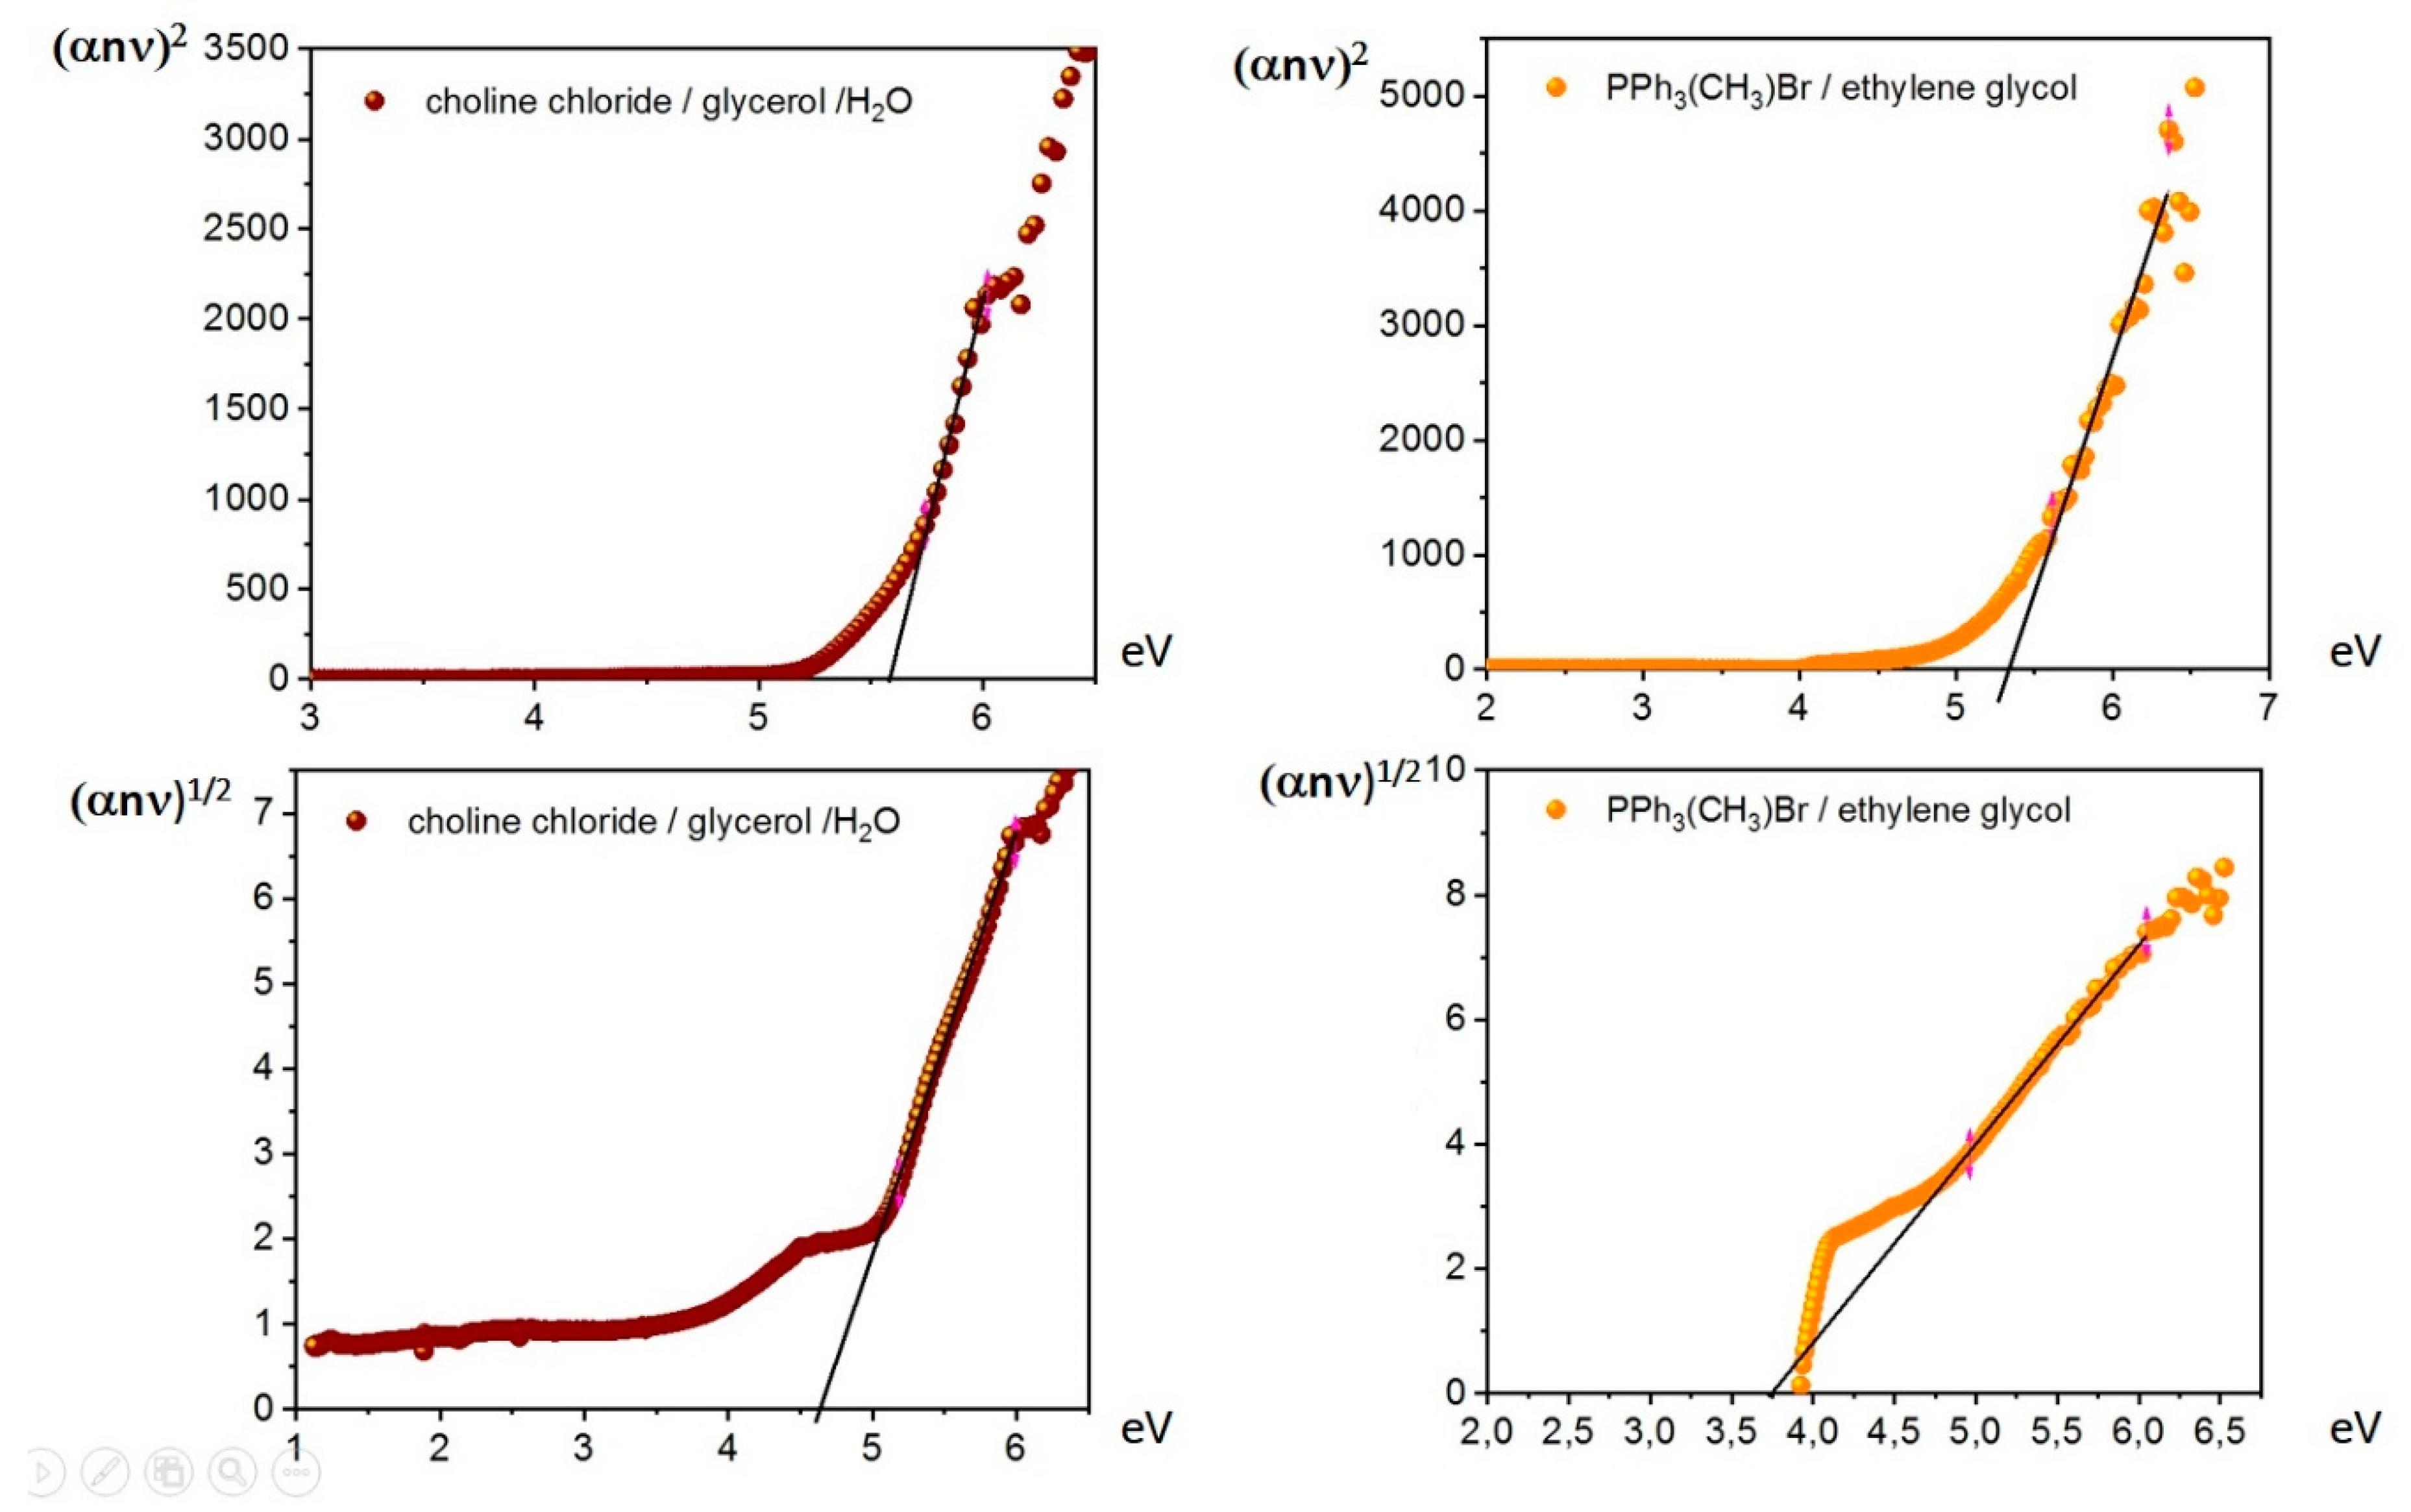
| 4 | Choline chloride | Glycerol | 4.64a (0.99756) | 5.56a (0.98955) |
| 5 | Triphenylmethylphosphonium bromide | Ethylene glycol | 3.74 (0.99879) | 5.34 (0.97962) |
| 6 | Triphenylmethylphosphonium bromide | Glycerol | - | 5.23 (0.98312) |
| Entry | HBA | HBD | Eu | Direct Band Gap (eV) |
|---|---|---|---|---|
| 1 | Choline chloride | Nickel sulphate | 0.59 | 5.18 |
| 2 | Choline chloride | Imidazole | 0.34 | 4.74 |
| 3 | Choline chloride | d-(+)-glucose | 0.26 | 5.85 |
| 4 | Choline chloride | Glycerol | 0.13 | 5.56 |
| 5 | Triphenylmethylphosphonium bromide | Ethylene glycol | 1.56 | 5.34 |
| 6 | Triphenylmethylphosphonium bromide | Glycerol | 0.67 | 5.23 |
| Entry | System | Direct Band Gap (eV) |
|---|---|---|
| 1 | Choline chloride/glycolic acid/H2O | 4.68 [11] |
| 2 | Choline chloride/imidazole/H2O | 4.74 |
| 3 | Choline chloride/levulinic acid/H2O | 5.08 [11] |
| 4 | Choline chloride/ethylene glycol/H2O | 5.16 [11] |
| 5 | Choline chloride/nickel sulphate/H2O | 5.18 |
| 6 | Choline chloride/glucose/H2O | 5.85 |
| 7 | Choline chloride/glycerol/H2O | 5.56 |
© 2020 by the authors. Licensee MDPI, Basel, Switzerland. This article is an open access article distributed under the terms and conditions of the Creative Commons Attribution (CC BY) license (http://creativecommons.org/licenses/by/4.0/).
Share and Cite
Mannu, A.; Di Pietro, M.E.; Mele, A. Band-Gap Energies of Choline Chloride and Triphenylmethylphosphoniumbromide-Based Systems. Molecules 2020, 25, 1495. https://doi.org/10.3390/molecules25071495
Mannu A, Di Pietro ME, Mele A. Band-Gap Energies of Choline Chloride and Triphenylmethylphosphoniumbromide-Based Systems. Molecules. 2020; 25(7):1495. https://doi.org/10.3390/molecules25071495
Chicago/Turabian StyleMannu, Alberto, Maria Enrica Di Pietro, and Andrea Mele. 2020. "Band-Gap Energies of Choline Chloride and Triphenylmethylphosphoniumbromide-Based Systems" Molecules 25, no. 7: 1495. https://doi.org/10.3390/molecules25071495
APA StyleMannu, A., Di Pietro, M. E., & Mele, A. (2020). Band-Gap Energies of Choline Chloride and Triphenylmethylphosphoniumbromide-Based Systems. Molecules, 25(7), 1495. https://doi.org/10.3390/molecules25071495