3.1. PEMFC Performance in Regular Flow-Through Mode
The PEMFC with the asymmetric GDM pairing has lower Ohmic resistances and significantly greater current and power densities at all operating conditions tested in flow-through mode, which flows H
2 continuously at a fixed stoichiometric value relative to the air flow.
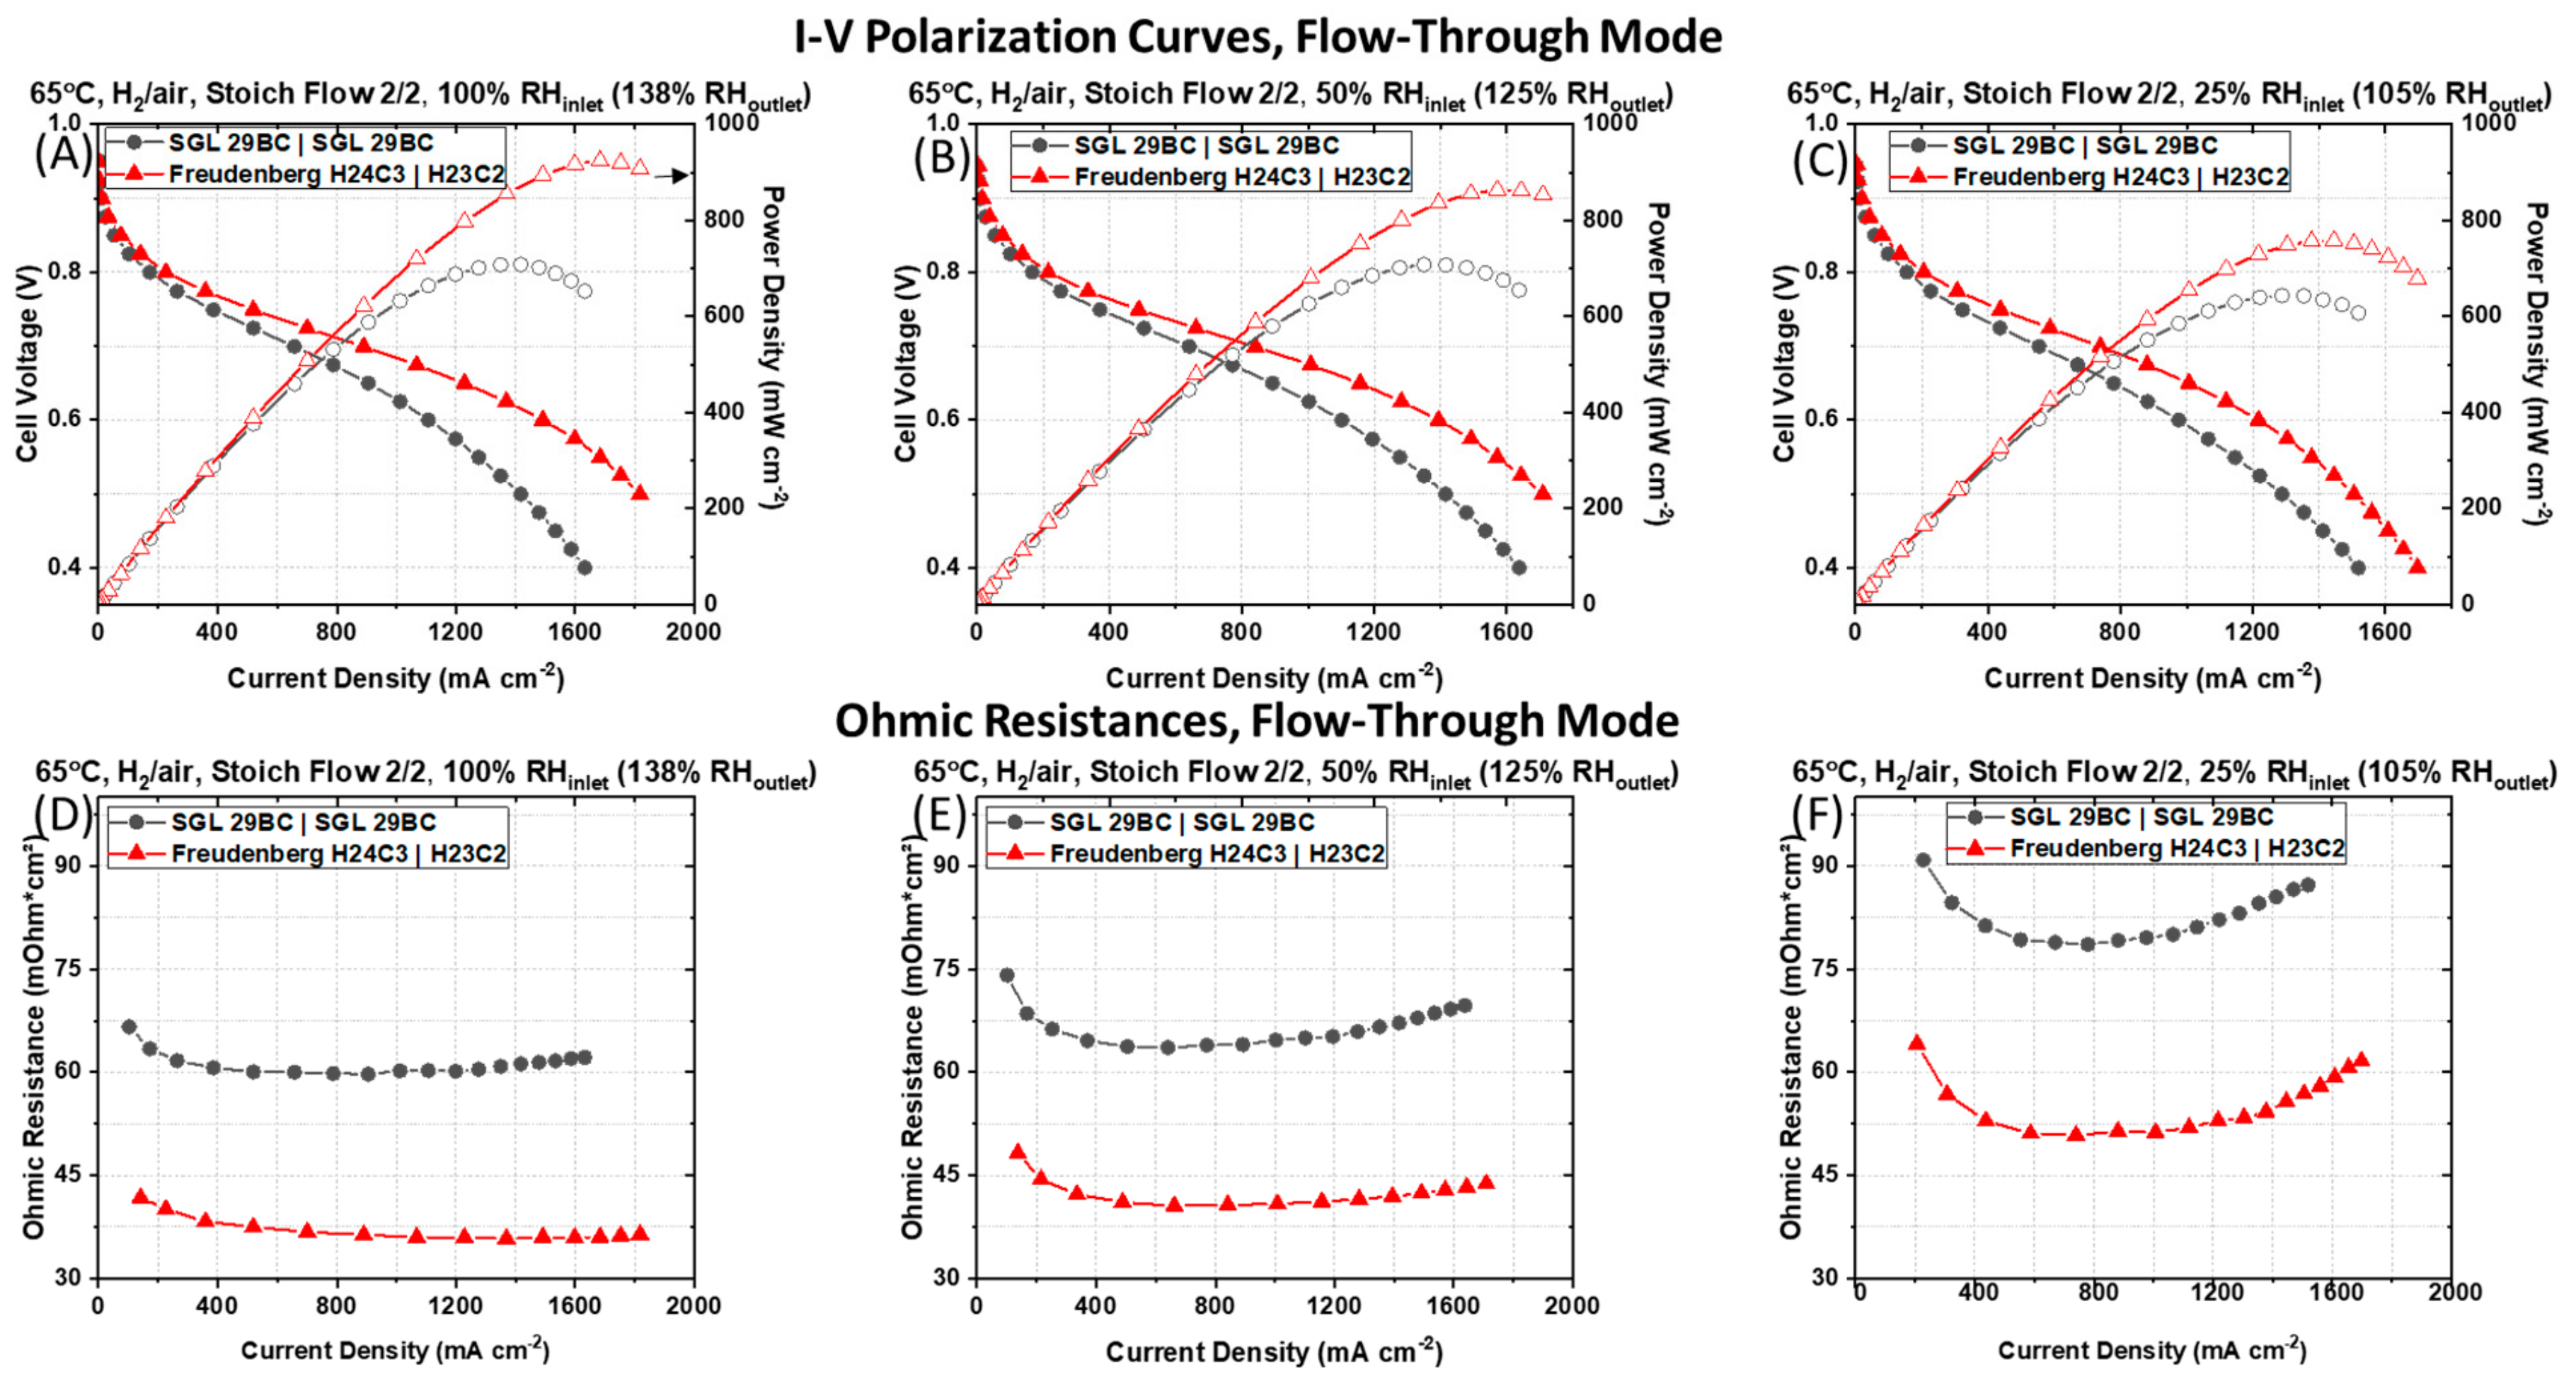
Figure 2 shows the typical I–V polarization and power density curves (A, B, and C) with the associated Ohmic resistances (D, E, and F) measured for a PEMFC containing a symmetric pairing of SGL 29BC GDM on the anode and cathode side (black circle) to a PEMFC containing an asymmetric pairing of Freudenberg GDM on the anode (i.e., H24C3) and cathode (i.e., H23C2) side (red triangle) at a cell working temperature of 65 °C, fed with ambient pressure air, in H
2|air at stoichiometric flow of 2/2 humidified at 100%, 50%, and 25% RH
inlet, respectively.
In the kinetic region of the polarization curve (i.e., operating cell voltage ≥ 0.80 V), there is a smaller effect of mass transport and current densities are very similar for both PEMFCs at all operating conditions. The differences in performance between the PEMFCs containing the symmetric SGL 29BC GDM pairing and the PEMFC containing the asymmetric Freudenberg GDM pairing are more pronounced at the lower cell operating voltage (i.e., operating cell voltage ≤ 0.60 V). Higher current densities are systematically measured for the PEMFC containing the asymmetric Freudenberg GDM pairing (i.e., H24C3 (anode) │ H23C2 (cathode)) at lower cell voltage requiring a higher consumption of O2, H+, and rejection of H2O, compared to the PEMFCs containing the symmetric SGL 29BC GDM pairing at all operating conditions.
The current density measured at an operating cell voltage of 0.60 V increases from 1101 to 1394 mA cm−2 at 50% RHinlet and from 976 to 1217 mA cm−2 at 25% RHinlet when the symmetric GDM pairing of SGL 29BC is replaced by the asymmetric pairing of Freudenberg GDM. The benefit is even greater in more humidified gas flows, when the presence of liquid water is more certain, as we observe a 36% increase in the measured current density at 100% RHinlet in the PEMFC with the asymmetric Freudenberg GDM pairing (i.e., from 1107 to 1491 mA cm−2). The peak power density increases by 31.5% at 100% RHinlet, 22% at 50% RHinlet, and 18% at 25% RHinlet, respectively, when the symmetric SGL 29BC GDM pairing is replaced by the asymmetric Freudenberg GDM pairing.
As shown in
Figure 2D–F, the Ohmic resistances measured at a current density of 1000 mA cm
−2 for the PEMFC containing the symmetrical SGL 29BC GDM pairing were 60 mOhm cm
2 at 100% RH
inlet, 64 mOhm cm
2 at 50% RH
inlet, and 80 mOhm cm
2 at 25% RH
inlet, respectively, compared to 36 mOhm cm
2 at 100% RH
inlet, 42 mOhm cm
2 at 50% RH
inlet, and 51 mOhm cm
2 at 25% RH
inlet for the PEMFC containing the asymmetric Freudenberg GDM pairing. The lower values of the cell Ohmic resistance for the PEMFC containing the asymmetric Freudenberg GDM pairing suggests that the cell is less sensitive to the adverse effects of dehydration in dry operating conditions. We describe these effects extensively in our prior work [
26]. In short, Freudenberg GDM have a significantly lower compressibility, maintain a relatively large void volume at high levels of compressive stress, and have smoother MPL surfaces. These traits are expected to minimize cell contact resistances without sacrificing high gas transport.
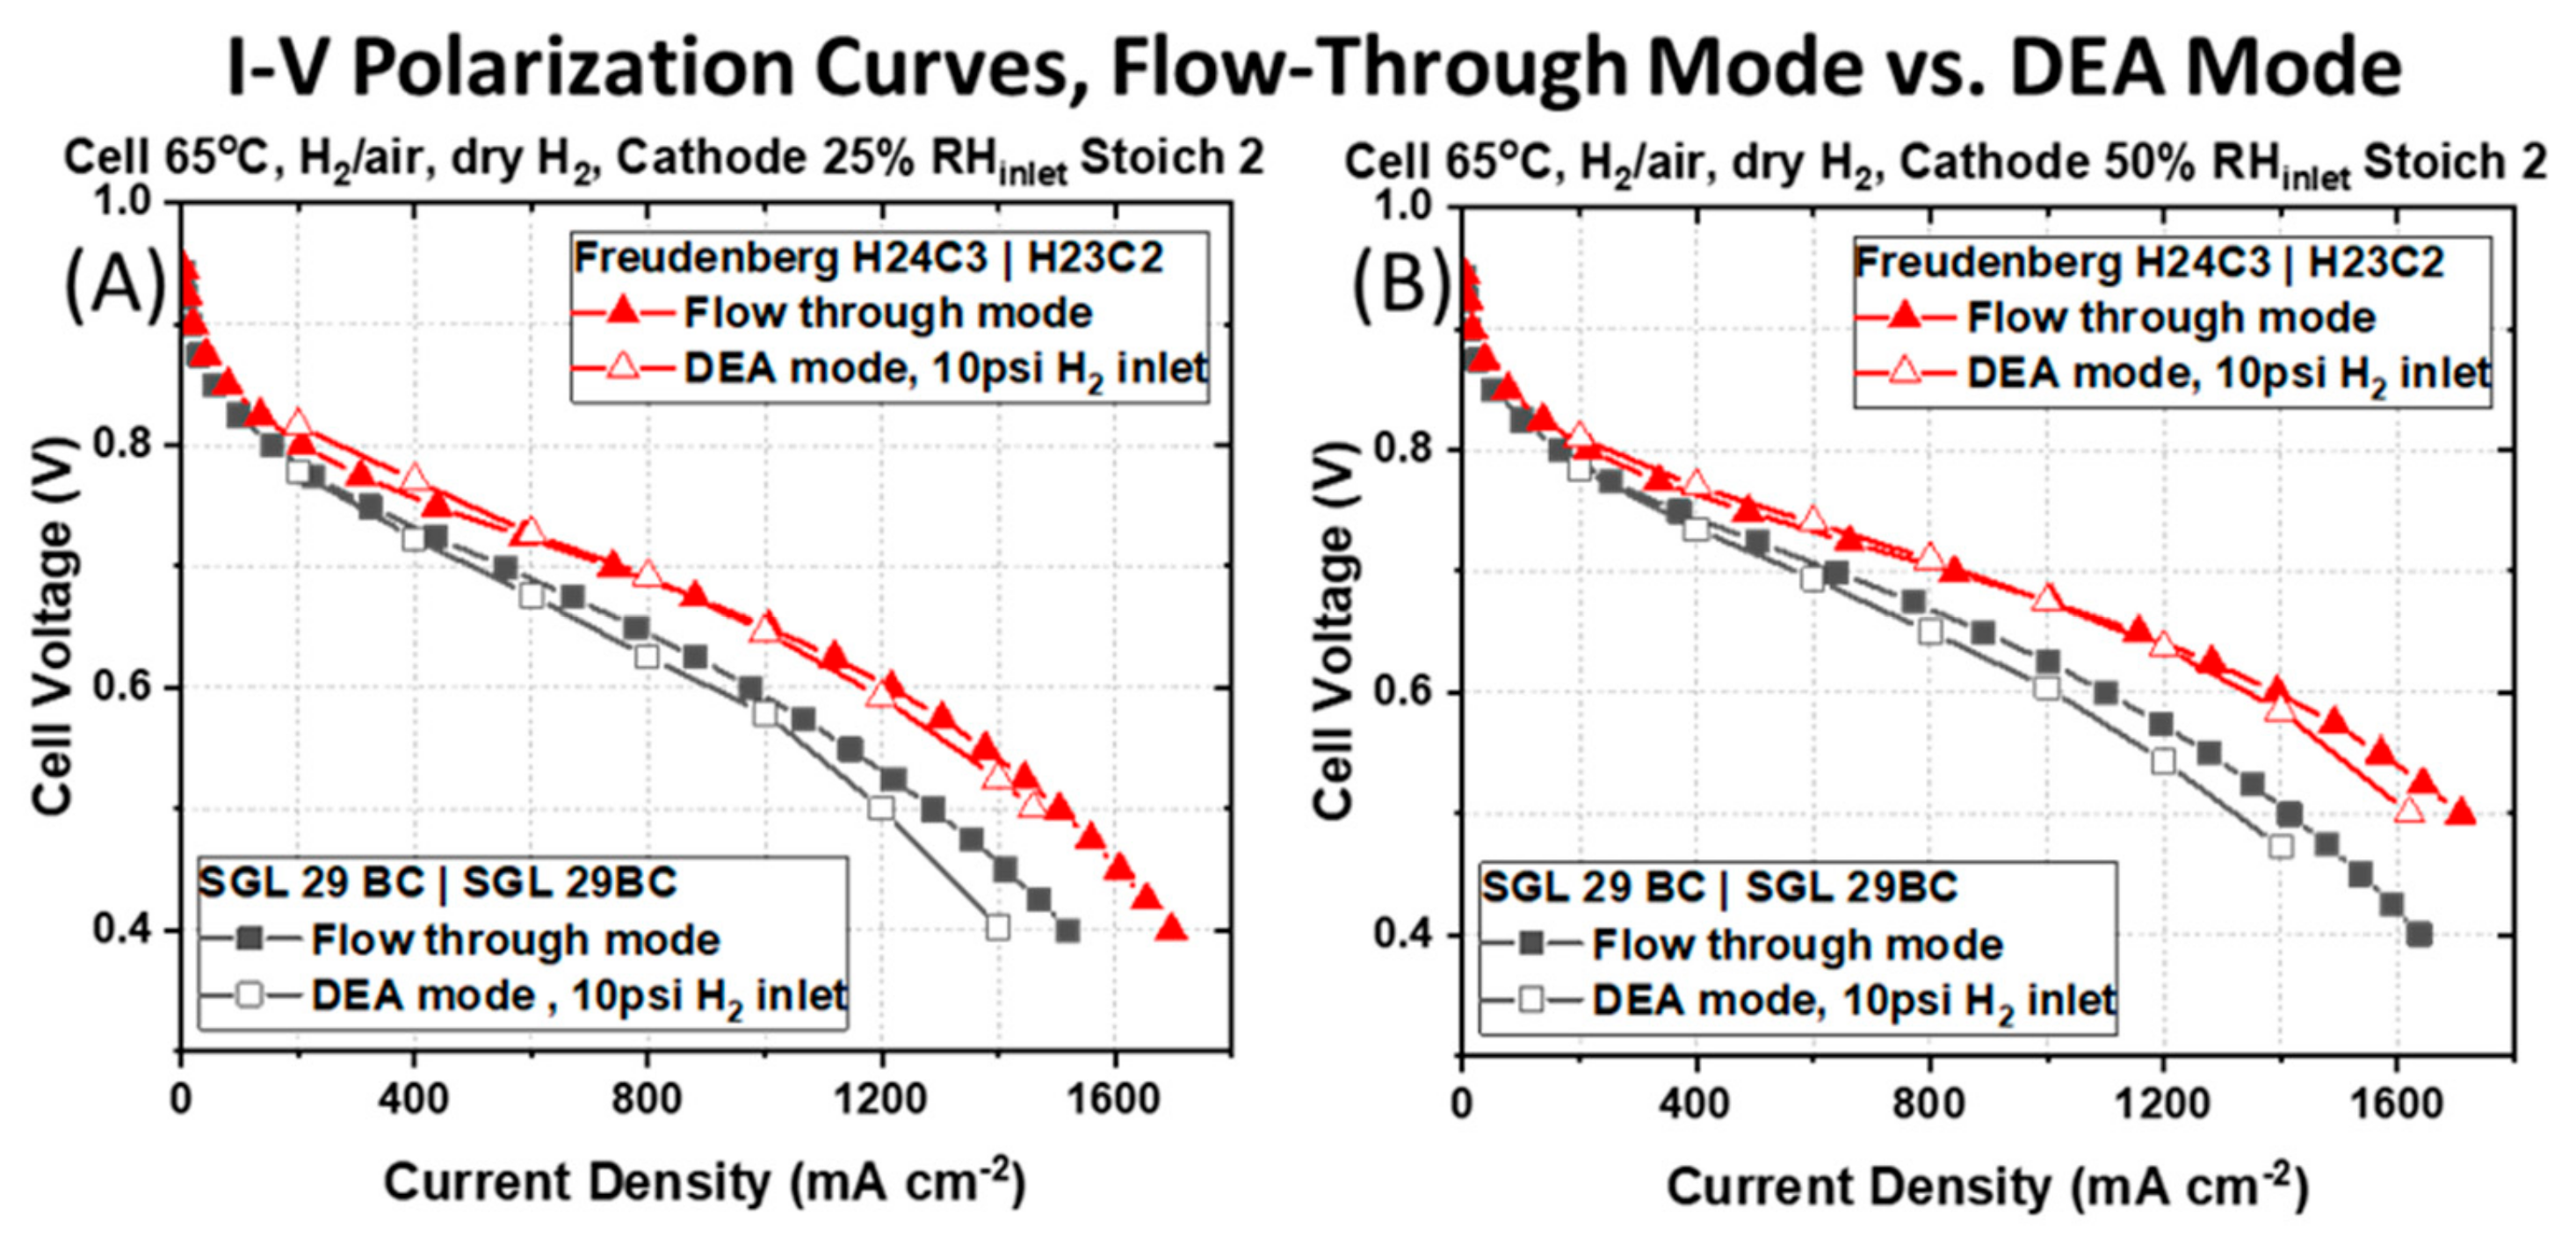
The difference in the polarization behavior is not simply a function of the reduction of the cell Ohmic resistance for the PEMFC containing the asymmetric Freudenberg GDM pairng, as this GDM pairing still maintains a higher current density after
iR-correcting the cell voltages, as shown in
Figure 3. The
iR-corrected polarization curves, which account for differences in cell Ohmic resistances, reveal that the PEMFC containing the symmetric SGL 29BC GDM pairing maintain lower current densities at all
iR-corrected cell voltages compared to the PEMFC containing the asymmetric Freudenberg GDM pairing. This indicates that in addition to the differences in Ohmic resistance, there are additional sources of resistances in the PEMFCs with different GDM pairing.
To quantify the total oxygen transport resistance (R
total-O₂), O
2 limiting current measurements were performed. This experiment resolves where the liquid water is saturating to occlude gas transport. The R
total-O₂ was calculated using Equation (1) [
28] from the slope of the plot between the limiting current and dry O
2 mole fraction at different total pressures as described in the experimental section.
In Equation (1), C
O2 is the gas channel O
2 concentration, i
lim is the measured limiting current density (A cm
−2geometric), F is the Faraday constant (96485 C mol
−1), R is the universal gas constant (8.3145 J mol
−1 K
−1), T is the cell temperature (K), P
abs is the absolute gas pressure, and P
H₂O is the partial pressure of water. The R
total-O₂ can be also be described by Equation (2) [
30]:
where R
O₂P-dep is the pressure dependent O
2 bulk diffusion resistance and R
O₂P-ind is the pressure independent oxygen transport resistance. R
O₂P-dep describes Fickian intermolecular gas diffusion through larger pores (>100 nm diameter), while R
O₂P-ind comprises Knudsen diffusion in smaller pores of the microporous layer and the catalyst layers (<100 nm diameter) as well as diffusion through the ionomer film covering the Pt particles.
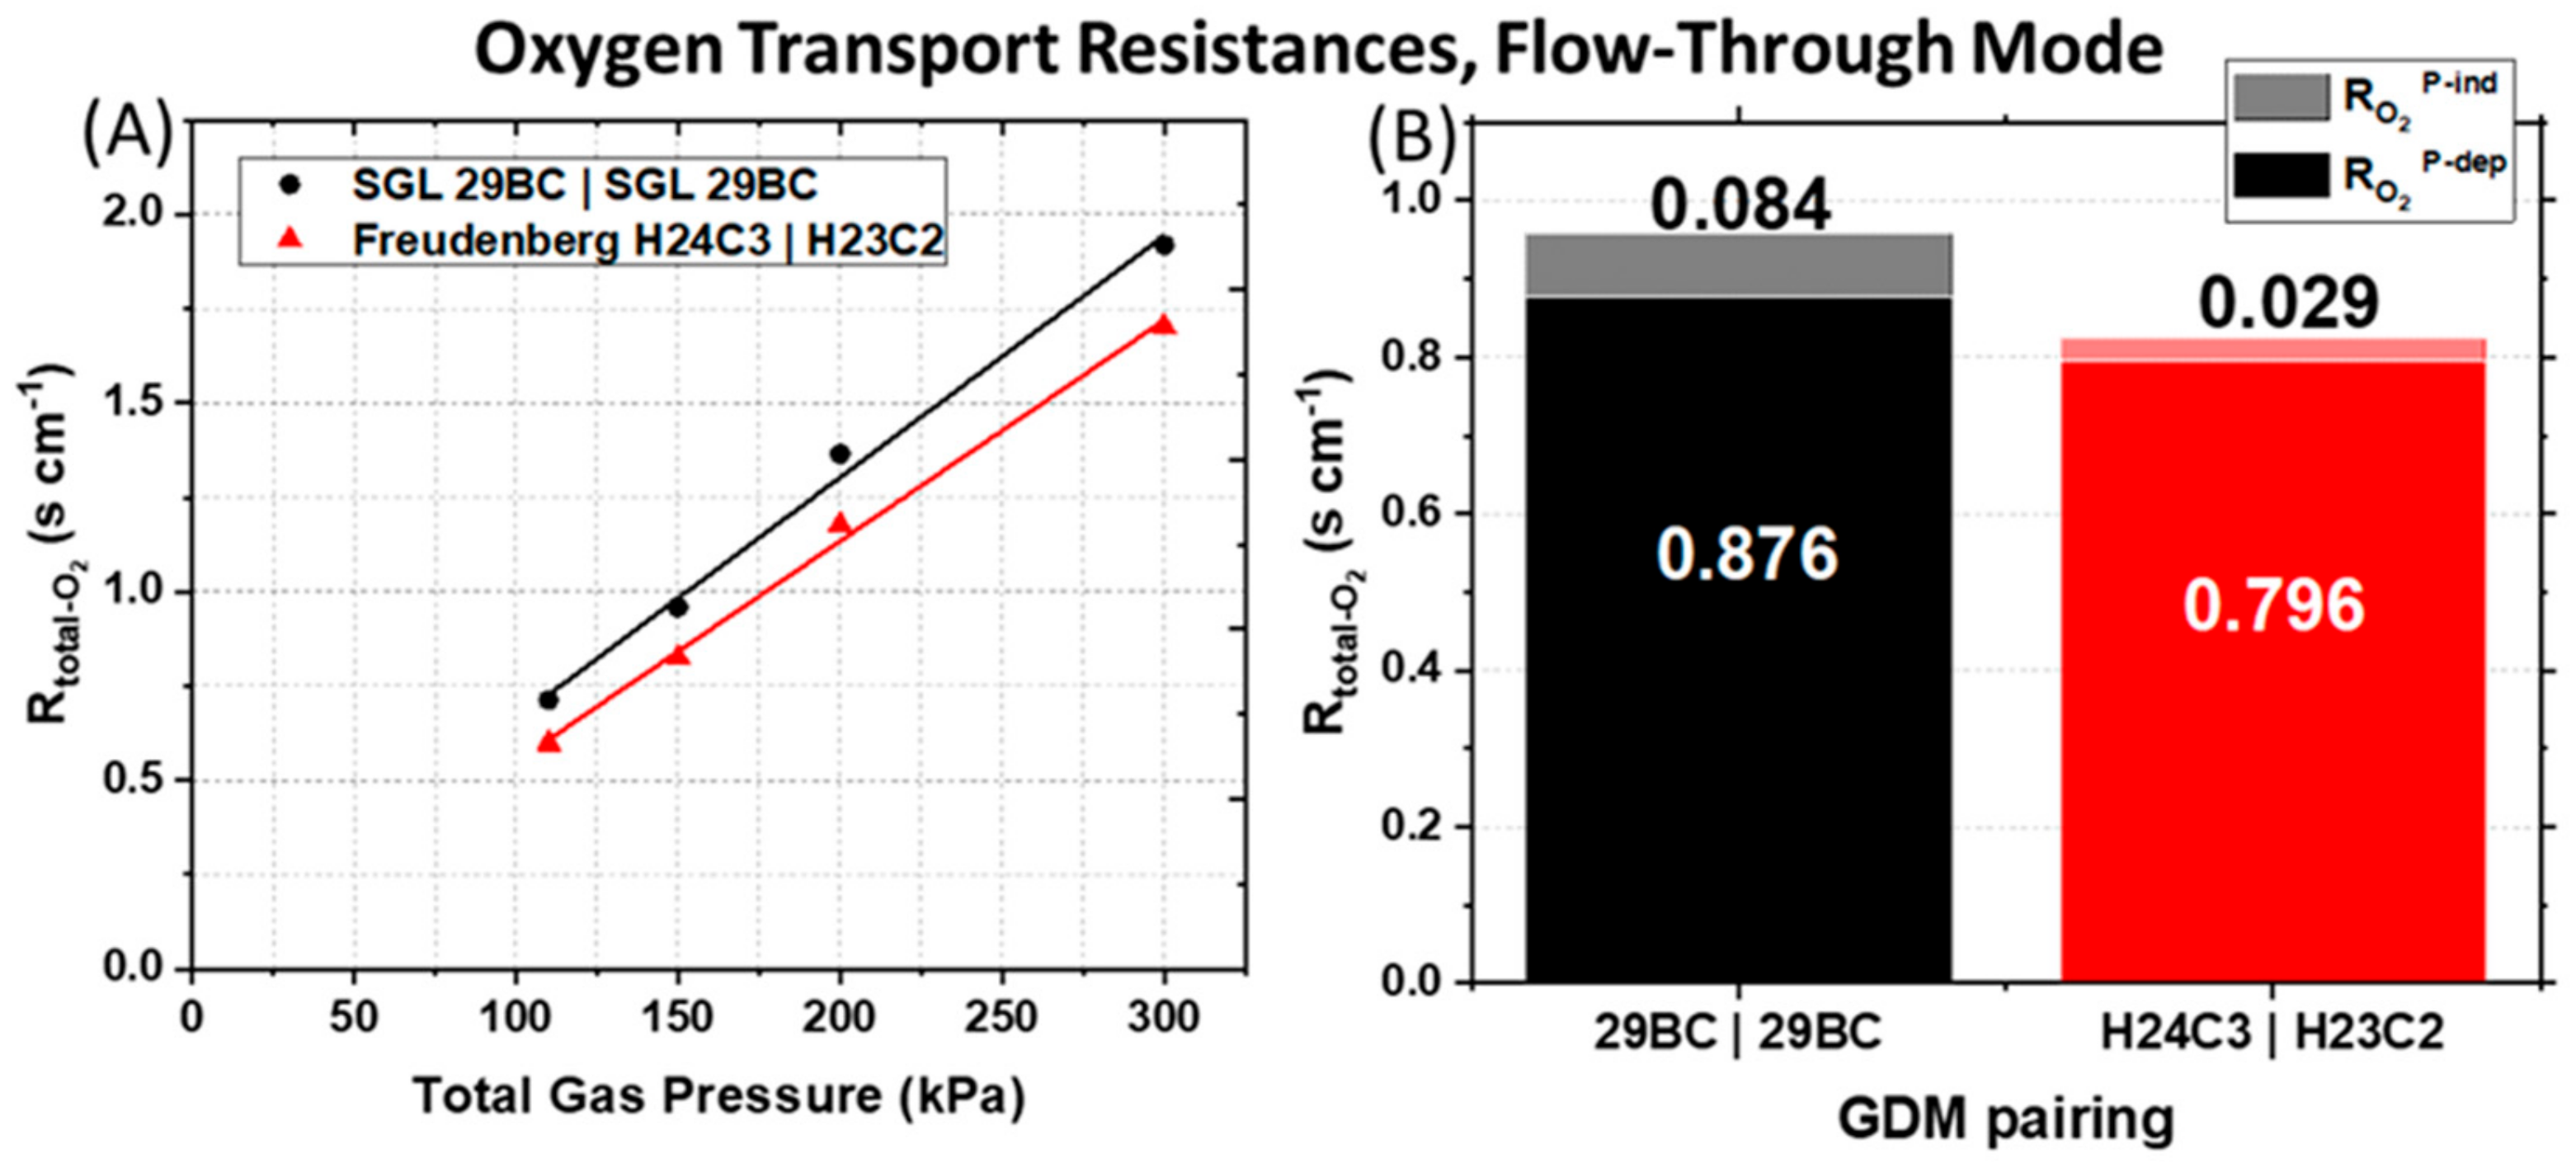
The asymmetric Freudenberg GDM pairing reduces both the pressure-dependent and pressure-independent O
2 transport resistances, suggesting a decrease in liquid water saturation in the cathode. The calculated
Rtotal-O₂ are plotted in
Figure 4A as a function of the total gas pressure. We observe that both PEMFCs tested have a decrease in R
total-O₂ with a decrease of the total gas pressure.
Figure 4A shows the effect of the GDM pairing on the R
total-O₂, which is the sum of the
RO₂P-dep (solid bars) and
RO₂P-ind (shaded bars) calculated for the 150 kPa
abs back-pressure data set. The symmetric anode and cathode GDM pairing (SGL 29BC) yields a R
O₂P-ind that is ~3× larger and R
O₂P-dep that is ~1.1× larger than the asymmetric Freudenberg GDM pairing.
This indicates that in the PEMFC with the symmetric SGL 29BC GDM pairing, oxygen diffusion is hindered by poor gas transport in the two pore size regimes: the fine pores in the cathode CL also including the ionomer or internal water (R
O₂P-ind), as well as in larger pores such as those in the MPL, GDL, and the gas channel (R
O₂P-dep). The exact form of water is uncertain, but possibilities include continuous or discontinuous film and droplets. The higher R
O₂P-ind can arise from either more water saturation in the cathode catalyst layer or from a very poorly hydrated cathode CL ionomer that impedes oxygen diffusion through the ionomer film to the active sites [
28,
34,
35]. The accompanying high R
O₂P-dep suggests a greater oxygen diffusion resistance through the larger GDL or MPL pores or the gas channels, which is likely the result of the higher tortuosity in the GDL of SGL 29BC, which Zenyuk et al. [
36] have reported to be several times greater than the tortuosity of the GDL region of the Freudenberg H23C2 used at the cathode in the asymmetric GDM pairing.
Compared to the symmetric SGL 29BC GDM pairing, the asymmetric Freudenberg GDM pairing overall displays superior power, presumably due to better management of the water, reactants and products. The latter GDM configuration can effectively remove significant amounts of liquid water for high humidity and high power operation as well as maintain membrane hydration during dry operation. Considering that the PEMFC with asymmetric Freudenberg GDM pairing has lower Ohmic resistances (
Figure 2D–F) and lower oxygen transport resistances (
Figure 4), we conclude that this asymmetric Freudenberg GDM pairing promotes more effective water management in flow-through mode.
3.2. PEMFC Performance in Dead-Ended Anode (DEA) Mode
The PEMFC with the asymmetric GDM pairing promotes more effective water management in flow-through mode (
Section 2.1), and we postulate that this GDM selection will also enhance PEMFC performance in DEA mode and resolve voltage decay due to excessive accumulation of back-diffused liquid water from the cathode and dilution of the anode fuel concentration via N
2 crossover. During the DEA operation of a PEMFC, when air is supplied as the oxidant, water produced at the cathode back-diffuses across the membrane to the dry anode and accumulates in the anode flow channel [
7,
8,
9,
10,
11,
12]. This accumulation of water at the anode blocks the gas transport pathway. Additionally, nitrogen may be transported through the membrane from cathode to anode due to pressure and concentration gradients [
7,
12,
13,
14,
15], resulting in local fuel (i.e., H
2) starvation and performance loss. Cell voltage decay in this study will have a stronger sensitivity to the former failure mode, anode water accumulation from insufficient water management, because these PEMFCs only differ in GDM selection. We assume that the N
2 crossover rate will not change for the two PEMFCs tested because they are comprised of identical catalyst coated membranes (CCMs).
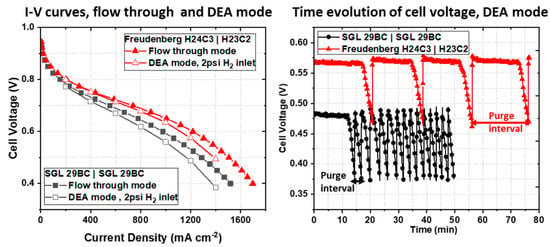
The advantage of using asymmetric GDM observed in flow-through mode is maintained when the PEMFCs are operated in DEA mode. Polarization curves for the two PEMFCs with different GDM pairings are shown with open symbols in
Figure 5.
Owing to the pressure and concentration gradients between anode and cathode during DEA mode, we anticipate higher amounts of water back-diffusion across the membrane, and greater liquid water saturation at the anode. That the asymmetric GDM pairing maintains higher cell voltages and power compared to the PEMFC with symmetric GDM during DEA mode supports that an asymmetric GDM pairing imparts superior water management. At 800 mA cm
−2 and 25% RH
inlet at the cathode [Figure. 5(A)], the PEMFC with asymmetric GDM (Freudenberg H24C3 | H23C2, red curve) pairing produces 0.67 V compared to 0.61 V for the PEMFC with symmetric GDM (SGL 29BC). Similarly, a considerable increase in voltage (and power) is measured at 1200 mA cm
−2, 0.57 to 0.48 V, when an asymmetric GDM pairing is used in place of a symmetric GDM pairing commonly reported to be used in the open literature. The same trends are observed with a more humidified cathode gas stream in
Figure 5B. There are marginal decreases in cell voltages during operation in DEA mode compared to flow-through mode (~42 mV at 1200 mA cm
−2) for both PEMFCs under study. These are attributed to the use of dry hydrogen on the anode side during testing in DEA mode, while in flow-through mode, the anode RH
inlet matches that at the cathode.
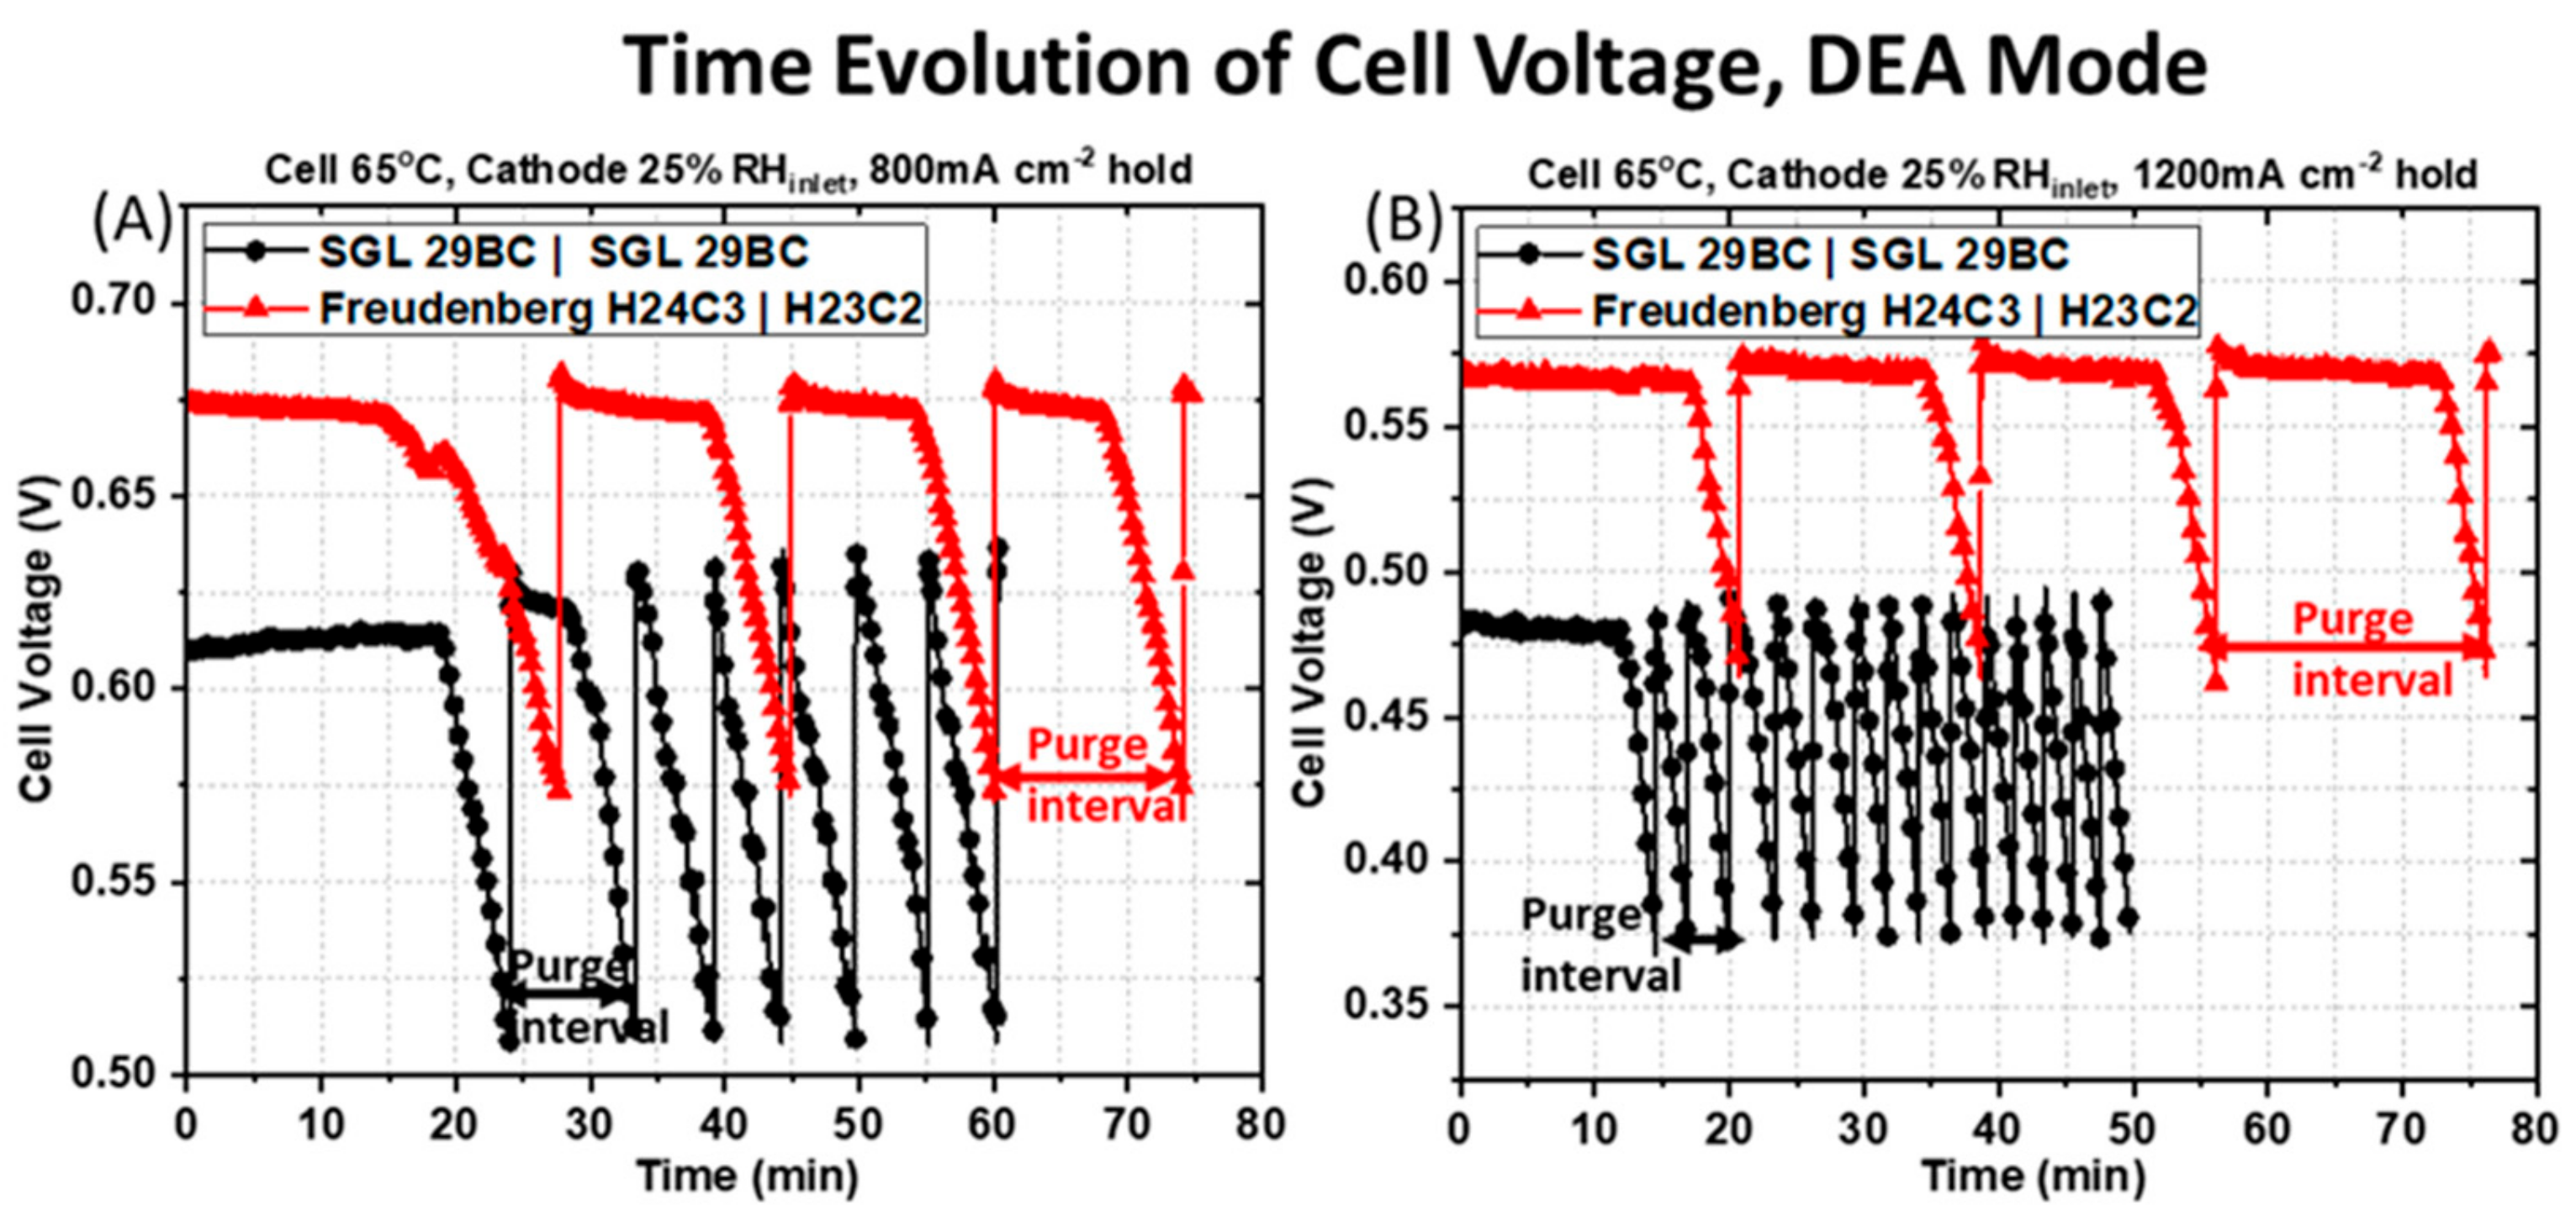
The time evolution of the cell voltage is significantly different for the PEMFC containing the symmetric SGL 29BC GDM pairing and the PEMFC containing the asymmetric Freudenberg GDM pairing.
Figure 6 shows the time evolution of the cell voltage obtained in DEA mode at two applied current densities of (A) 800 mA cm
−2 and (B) 1200 mA cm
−2 for a H
2 inlet pressure of 2 psi and with 25% RH
inlet air flowing at the cathode. The purge interval is defined as the time between each valve opening event. Examples of these are illustrated at the bottom of
Figure 6A,B for each pairing of GDM by either the black or red arrows. The criterion for triggering a valve-opening event was a voltage decay of 0.10 V during constant current operation. All of these observations support that water accumulates in the anode faster for a PEMFC with a symmetric GDM pairing. First, the time between purge events is much greater for the asymmetric GDM pairing. It requires more time at a given current density for the anode to saturate with water and cell voltage decay to be observed. The asymmetric GDM spends a longer time at steady-state prior to voltage decay, and its periods of voltage decay are more gradual. Further, the applied current density has a major impact on the purge interval for each of the PEMFCs under study. A reduction of the purge interval with increasing current density, from
Figure 6A to
Figure 6B, highlights the inferior water management of the symmetric GDM pairing (black circles) compared to the asymmetric GDM pairing (red triangles). A longer purge duration is desirable in a fuel cell system because it increases H
2 utilization and reduces valve wear.
As shown in
Figure 6A for the PEMFC containing the symmetric SGL 29BC GDM pairing (black circles) at the applied current density of 800 mA cm
−2 the cell output voltage is maintained at a constant value of ~0.61 V initially from 0 min to 20 min 37 s. This behavior represents an absence of liquid water in the GDL and the channels at the beginning of the experiment after dry H
2 was purged through the anode compartment and prior to water production at the cathode. The cell operating voltage drops rapidly after 20 min 37 s, likely due to liquid water saturation in the anode GDM or flow fields from back-diffused water. After 3 min 21 s of steady voltage decline, the first purge event happens and the solenoid is opened to remove water/impurities accumulated in the anode. After the 1 s gas purging duration, the cell operating voltage rises and recovers rapidly to its original level, implying that the 1 s purging duration is sufficient to discharge the accumulated water at this applied current density of at 800 mA cm
−2. The cell output voltage is stable again for ~7 min, and then steadily declines for about 3 min 21 s, when the next purge event happens. As the experiment progresses, the gap between each purge intervals becomes shorter. There is a mean value of 2 min 24 s ± 21 s for the constant voltage hold period (steady-state, prior to the rapid voltage decay) and a mean value of 2 min 58 s ± 18 s for the regions of rapid voltage decline. This sums to a mean purge interval of 5 min 22 s ± 22 s for the total of five purge events for the last 24 min of the experiment.
For the same operating condition, the response obtained for the PEMFC containing the asymmetric Freudenberg GDM pairing is drastically different, as shown in
Figure 6A. The average purge time for the PEMFC with asymmetric GDM is extended by ~10 min compared to the PEMFC with symmetric GDM that are more prone to anode water saturation. The cell output voltage is maintained at a constant value of 0.67 V initially from 0 min to 17 min 46 s, again probably representing an absence of liquid water in the GDL and the channels during this period after dry hydrogen was purged through the anode compartment prior to current generation. The cell operating voltage begins to drop smoothly after 17 min 46 s, likely due to the initial saturation by back-diffused water. The cell voltage decays relatively slowly, ~10 min of steady cell output decline, before the first purge event happens. As the experiment progresses, the gap between each purge intervals remains constant, with mean value of 10 min 45 s ± 1 min 27 s for the constant voltage hold period and a mean value of 4 min 42 s ± 10 s for the steady voltage decline period. This corresponds to mean purge interval of 15 min 27 s ± 1 min 33 s for a total of three purge events for the last 47 min of the experiment.
As the applied current density increases from 800 to 1200 mA cm
−2, the water generated in the cathode becomes larger, and there is an expected increase in the water back-diffused from the cathode to the anode due to the difference in water vapor concentration. Therefore, the accumulated water in the anode compartment becomes larger as the current density increases. This is reflected in the cell voltage response shown in
Figure 6B for the PEMFC containing the symmetric SGL 29 BC GDM pairing at 1200 mA cm
−2 and 2 psi H
2 inlet pressure. The cell voltage is maintained at a constant value of ~ 0.48 V initially from 0 min to 13 min 25s, again probably representing an absence of liquid water in the GDL and the channels during this period, where dry hydrogen is purged through the anode compartment. The cell operating voltage begins to drop smoothly after 13 min 25s, likely due to the initial saturation of back diffusive water vapor. After ~1 min of steady cell output decline, the first purge event happens, the solenoid is opened to remove water/impurities accumulated in the anode compartment. After the 1 s gas purging duration, the cell operating voltage rose and recovered rapidly to its original level, implying that the 1 s purging duration is sufficient to discharge the accumulated water at this applied current density of at 1200 mA cm
−2. However, as the experiment progresses, the gap between each purge interval is very stable and brief, with a mean value of 1 min 30 s ± 26 s for the constant voltage hold period and a mean value of 1 min ± 3 s for the steady voltage decline period. This corresponds to a mean purge interval of 2 min 33 s± 28 s for a total of 13 purge events for the last 33 min of the experiment. This is a significant increase in purge frequency compared to the lower current density operation.
The PEMFC containing the asymmetric Freudenberg GDM pairing has a different behavior, as shown in
Figure 6B. Unlike with the symmetric GDM pairing, which saw a reduction in purge interval at higher current density, the average purge interval marginally increases at higher current density when asymmetric GDM are used. The cell voltage is maintained at a constant value of 0.57 V initially from 0 min to 17 min 34 s, again probably representing an absence of liquid water in the GDM and the channels during this period, where dry hydrogen is purged through the anode compartment. The cell operating voltage begins to drop smoothly after 17 min 34 s, likely due to the initial saturation of back-diffused water vapor. After ~3 min 10 s of steady cell output decline, the first purge event happens, the solenoid is opened to remove water/impurities accumulated in the anode compartment. As the experiment progresses, the gap between each purge interval remains stable, with a mean value of 15 min 14 s ± 1 min 40 s for the constant voltage hold period and a mean value of 3 min 16 s ± 20 s for the steady voltage decline period. This corresponds to a mean purge interval of 18 min 29 s ± 1 min 21 s for a total of three purge events for the last 55 min of the experiment.
Figure 7 compares the variation of the mean purge interval observed for the data in
Figure 6 as a function of the fixed current density for both PEMFCs under study when testing in steady state DEA mode. There is a longer time before the first purge is required due to the initial absence of liquid water in the GDM and the channels prior to the start of the DEA mode operation, as dry hydrogen is purged through the anode compartment. It should be noted that the first purge interval is not included in this calculation because the PEMFC has not yet reached an equilibrium state in hydration. For reference, the blue line shows the purge interval used during polarization characterization in
Figure 5.
Superior water management imparted by an asymmetric GDM pairing will conserve H
2 fuel by vastly reducing anode purging frequency, another advantage of using the Freudenberg asymmetric GDM pairing for a PEMFC in DEA mode. At the applied current density of 800 mA cm
−2, the mean purge interval is 2.7× longer for the PEMFC containing the asymmetric Freudenberg GDM pairing. As shown in
Figure 6A, only four purging events are necessary over an 80 min period compared to seven over a 60 min period for the PEMFC containing the symmetric SGL 29BC pairing. As the applied current density increases from 800 to 1200 mA cm
−2, the water generated in the cathode increases and we expect a greater back-diffusion driving force from the cathode to the anode due to the greater difference in water vapor concentration between the two electrodes. Therefore, we expect greater water accumulation in the anode compartment as the current density increases. It can be seen from
Figure 7, that the PEMFC containing the symmetric SGL 29BC pairing is the most affected by the increase in the current density. The mean purge interval is more than 50% shorter, and a total of fourteen purge events are necessary over a 50 min period compared to only four in an 80 min period for the PEMFC containing the Freudenberg asymmetric GDM pairing, as shown in
Figure 6B. The PEMFC constructed with the asymmetric Freudenberg GDM pairing requires even less frequent anode purging at higher current densities. We attribute this to an expected difference in thermal conductivity for the two cathode GDM used in these PEMFCs. Fibrous GDL substrates from Freudenberg have been shown to have a lower thermal conductivity than those GDL substrates developed by SGL [
37,
38]. With a lower thermal conductivity in the cathode GDL substrate, the cathode catalyst layer temperature would increase, facilitating product water evaporation for rejection from the cathode.

 ,
, 


