
Exploring the Polymorphism of Drostanolone Propionate


Abstract
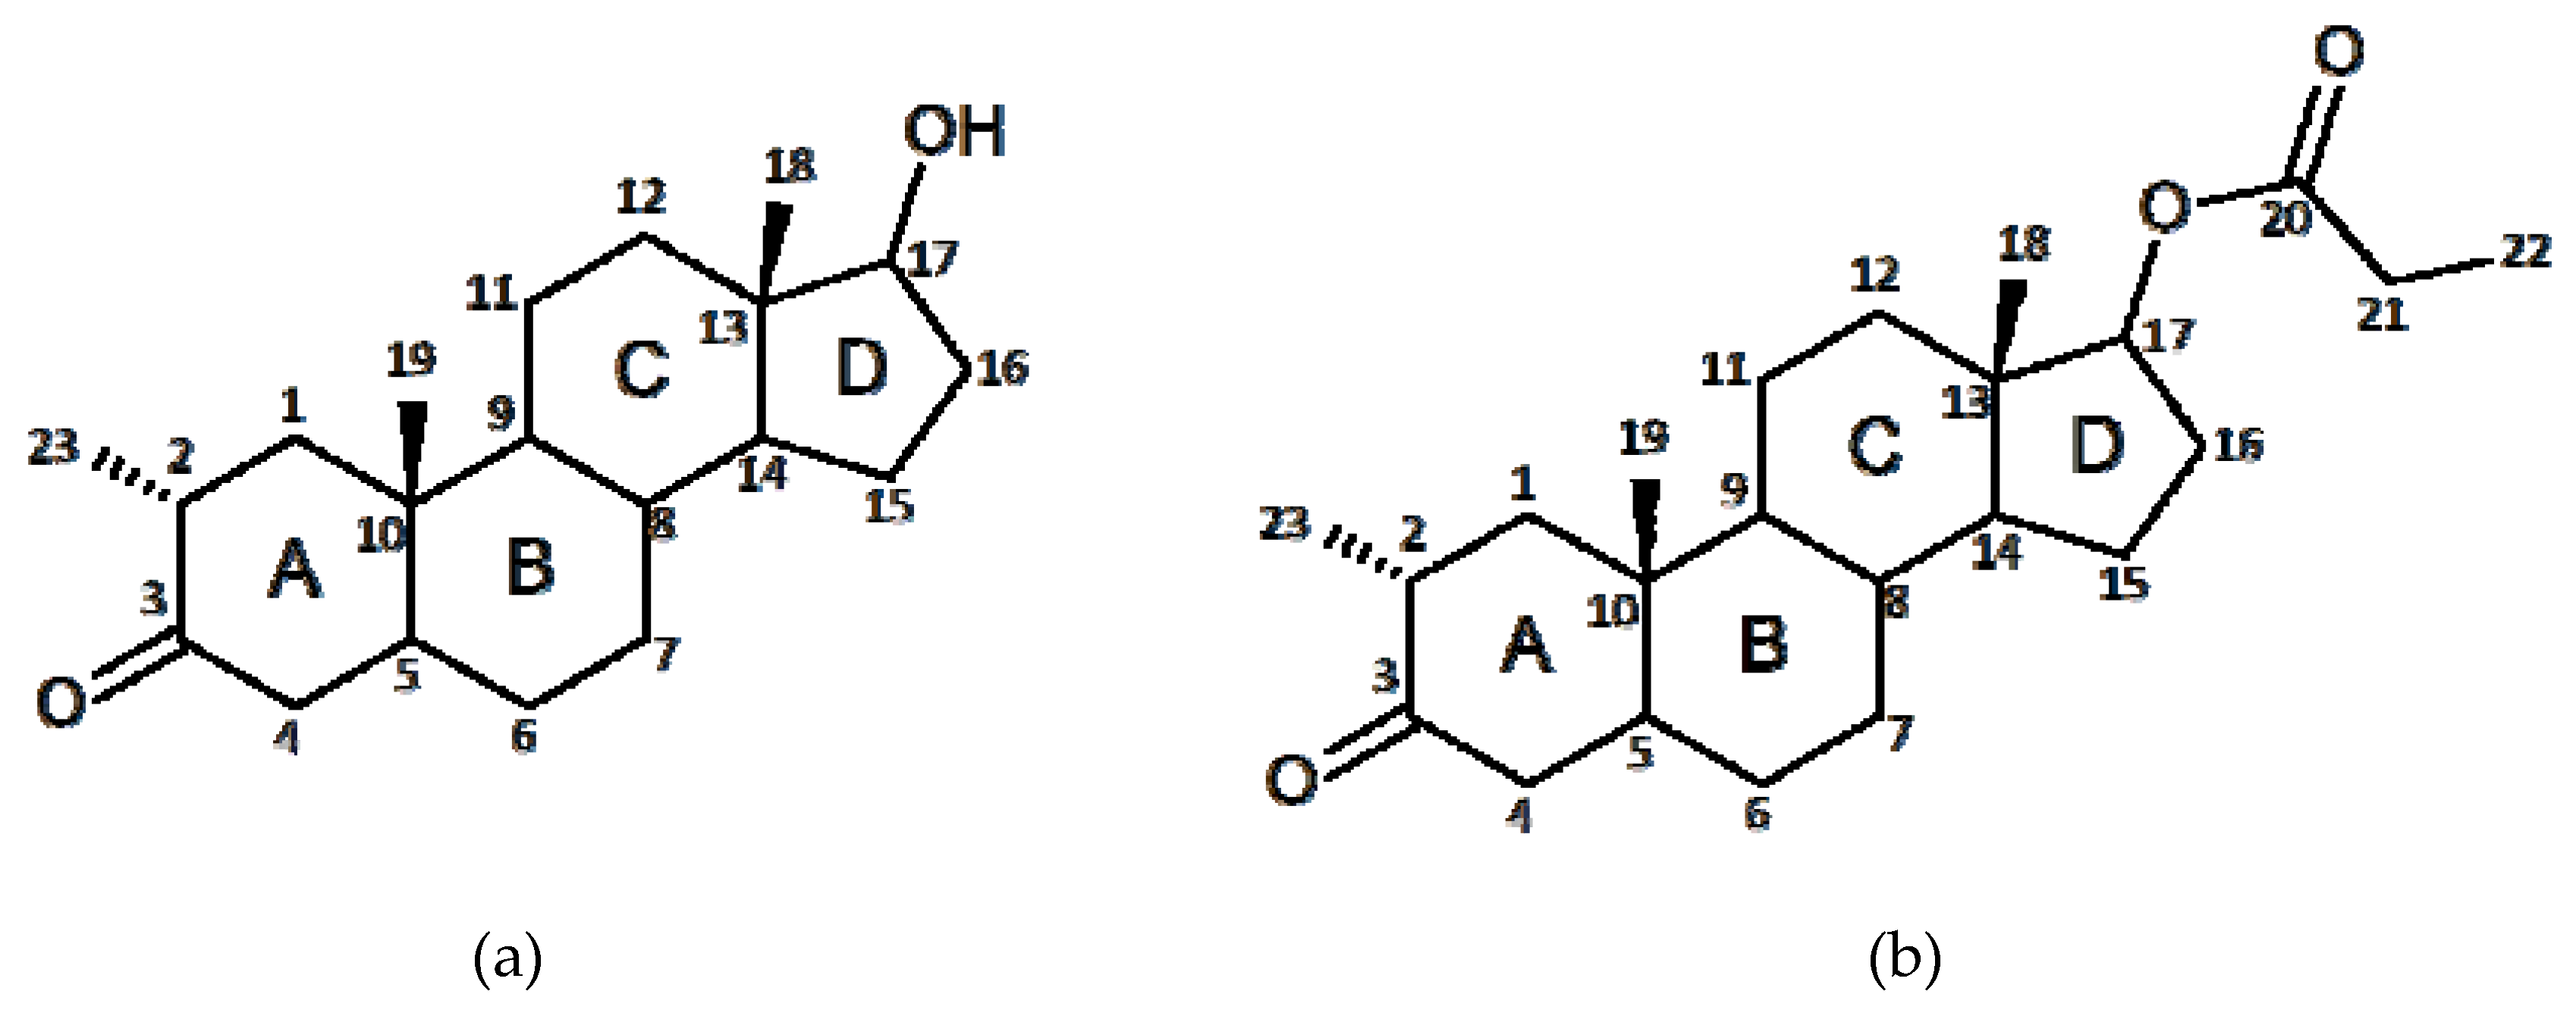
1. Introduction
2. Results and Discussion
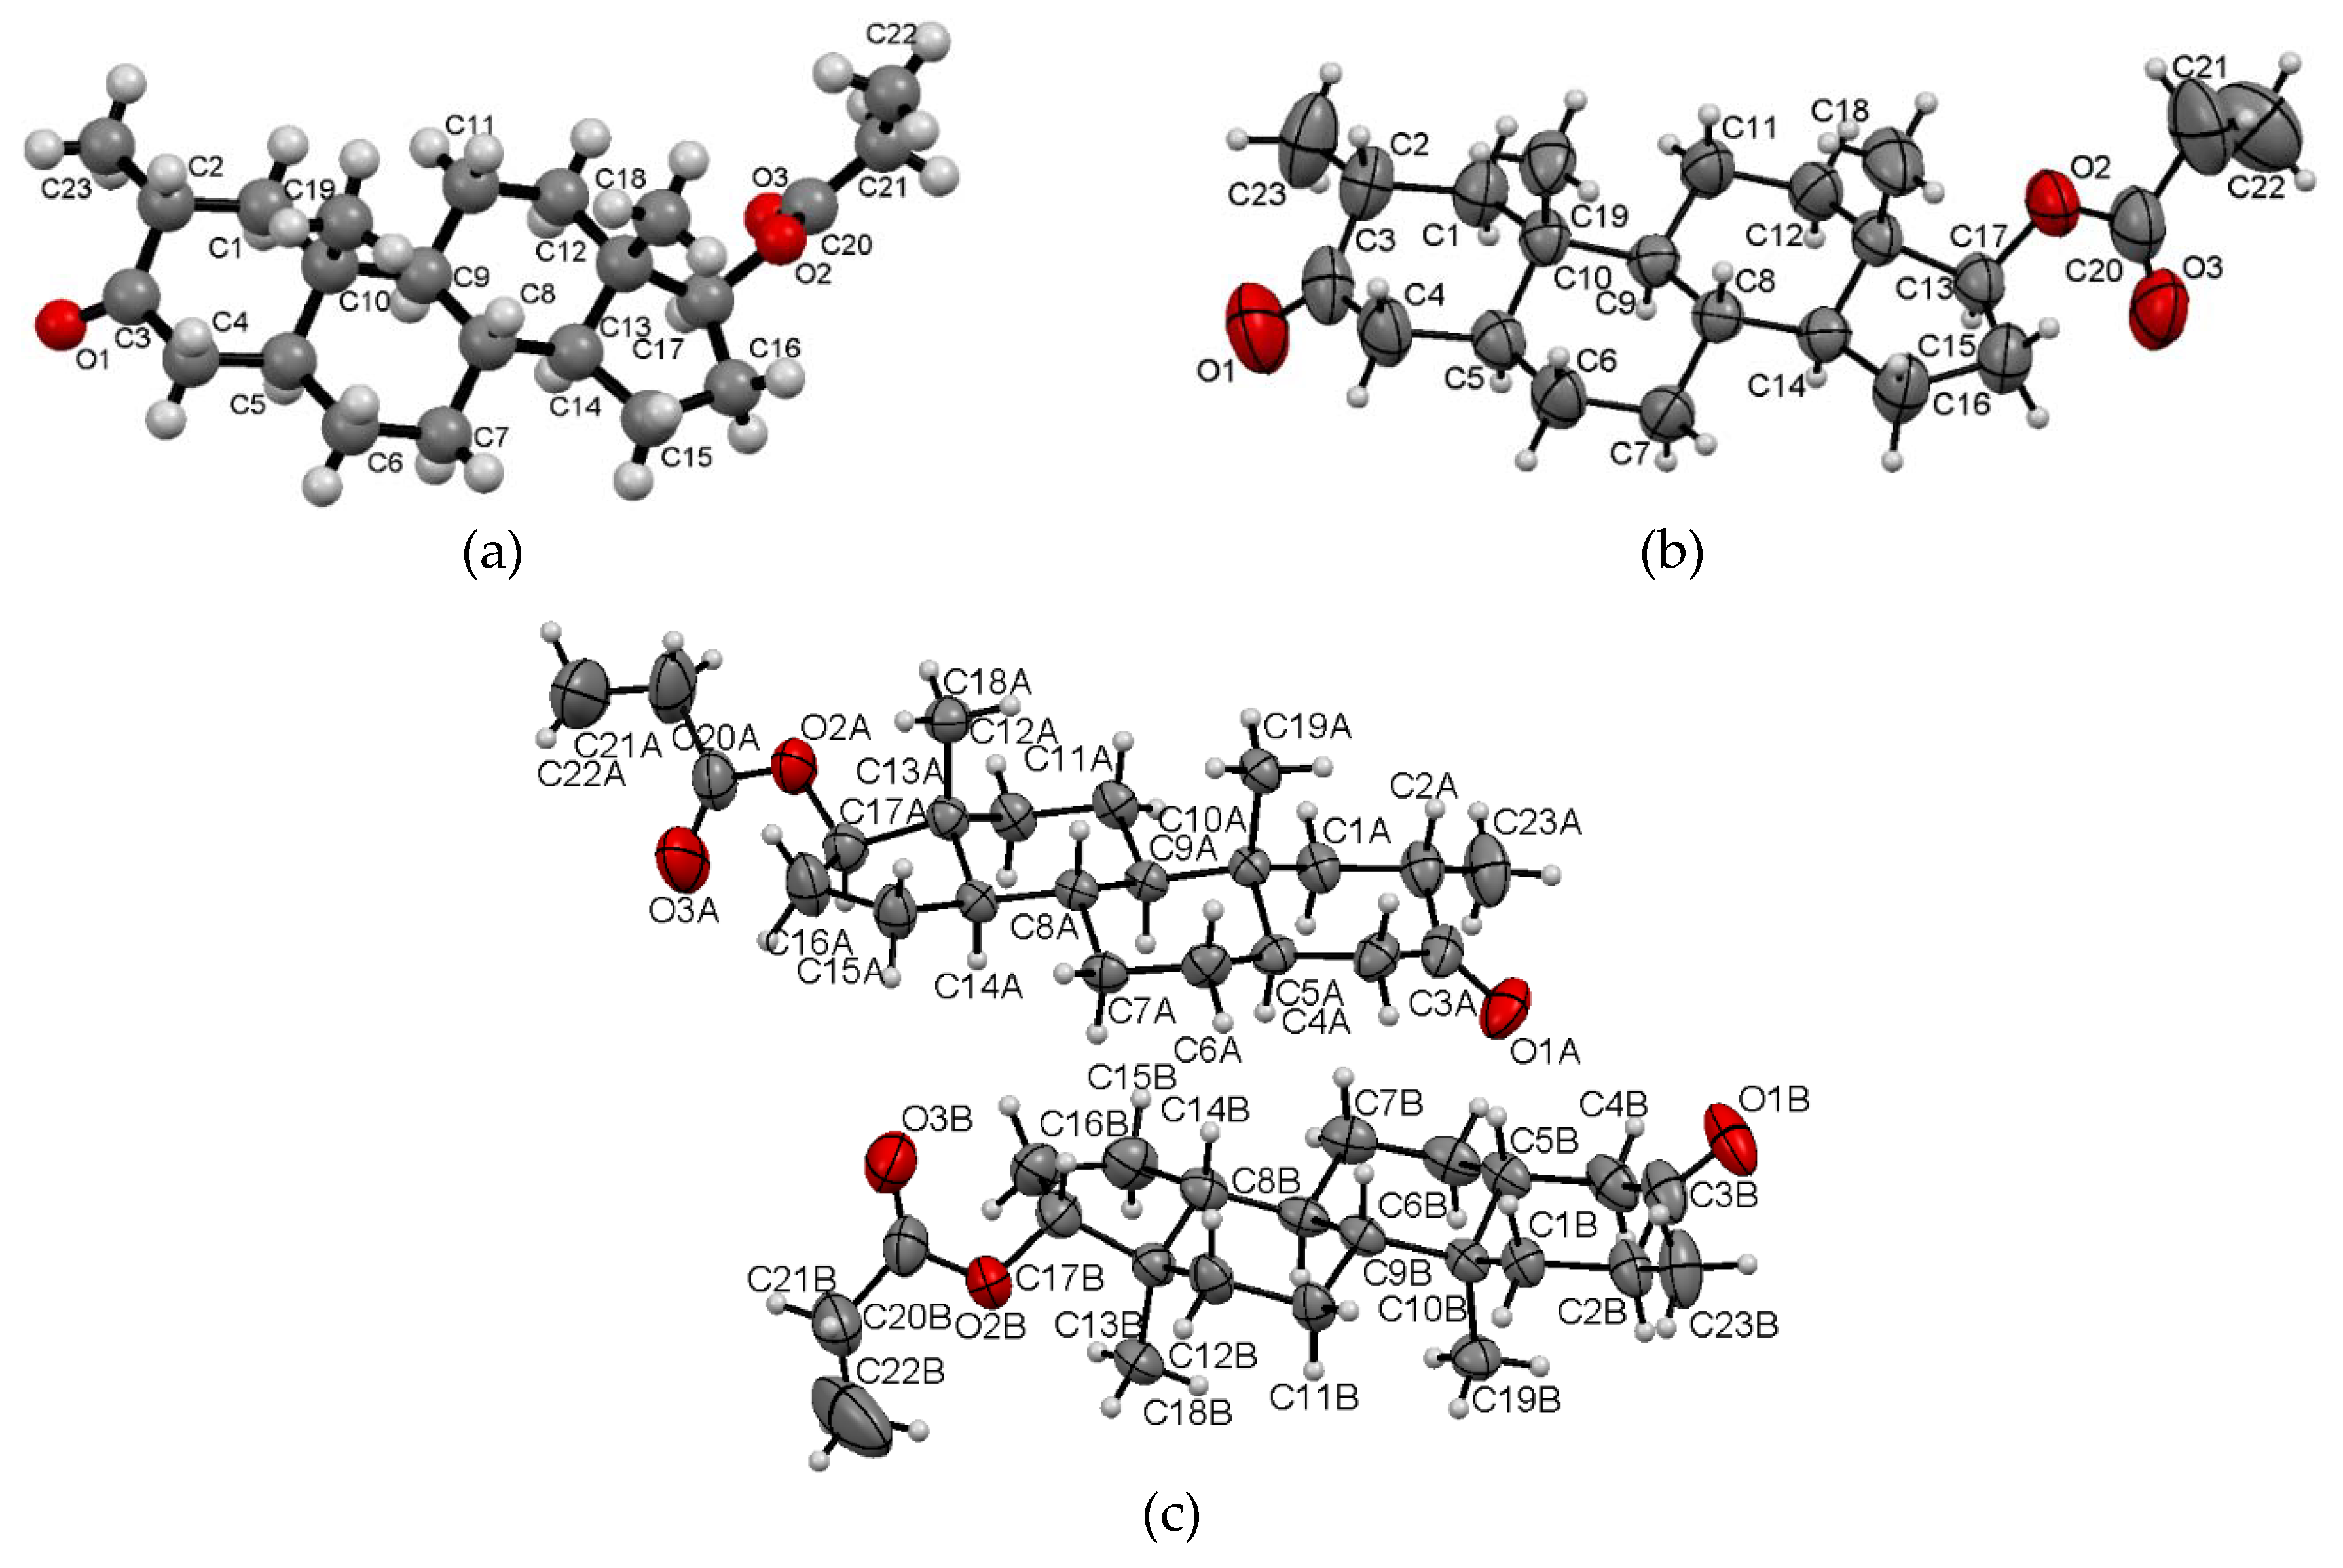
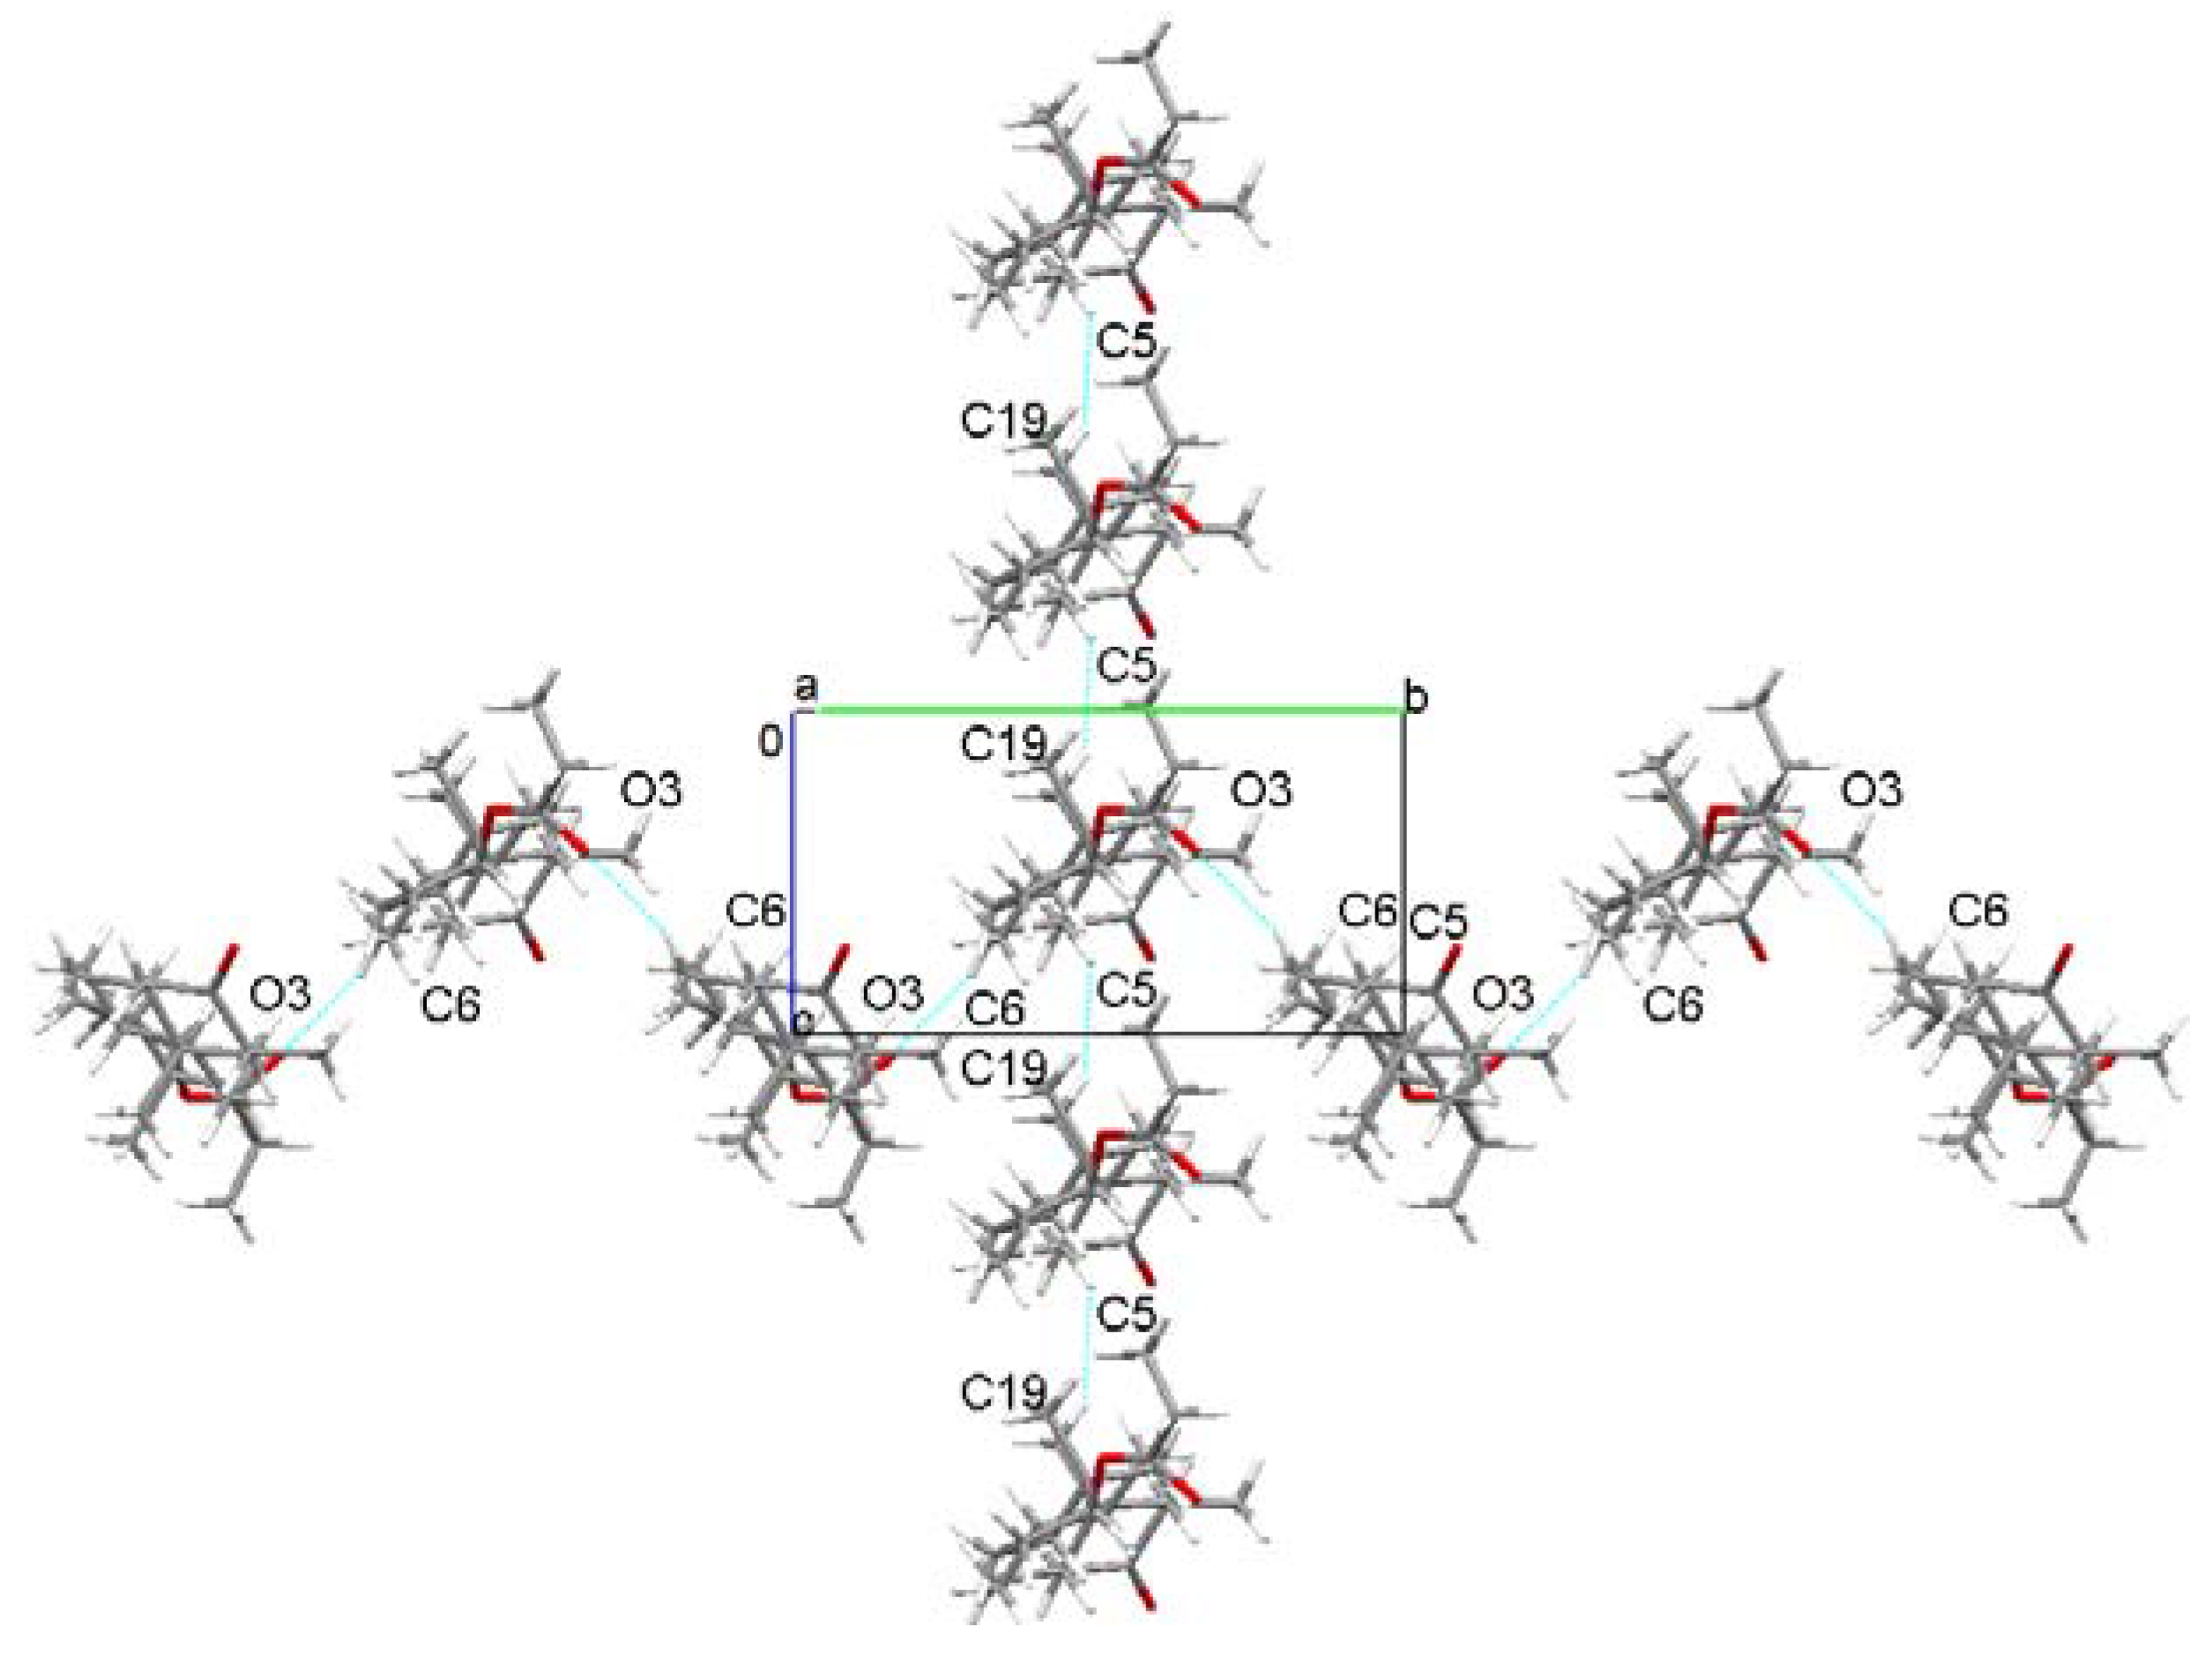
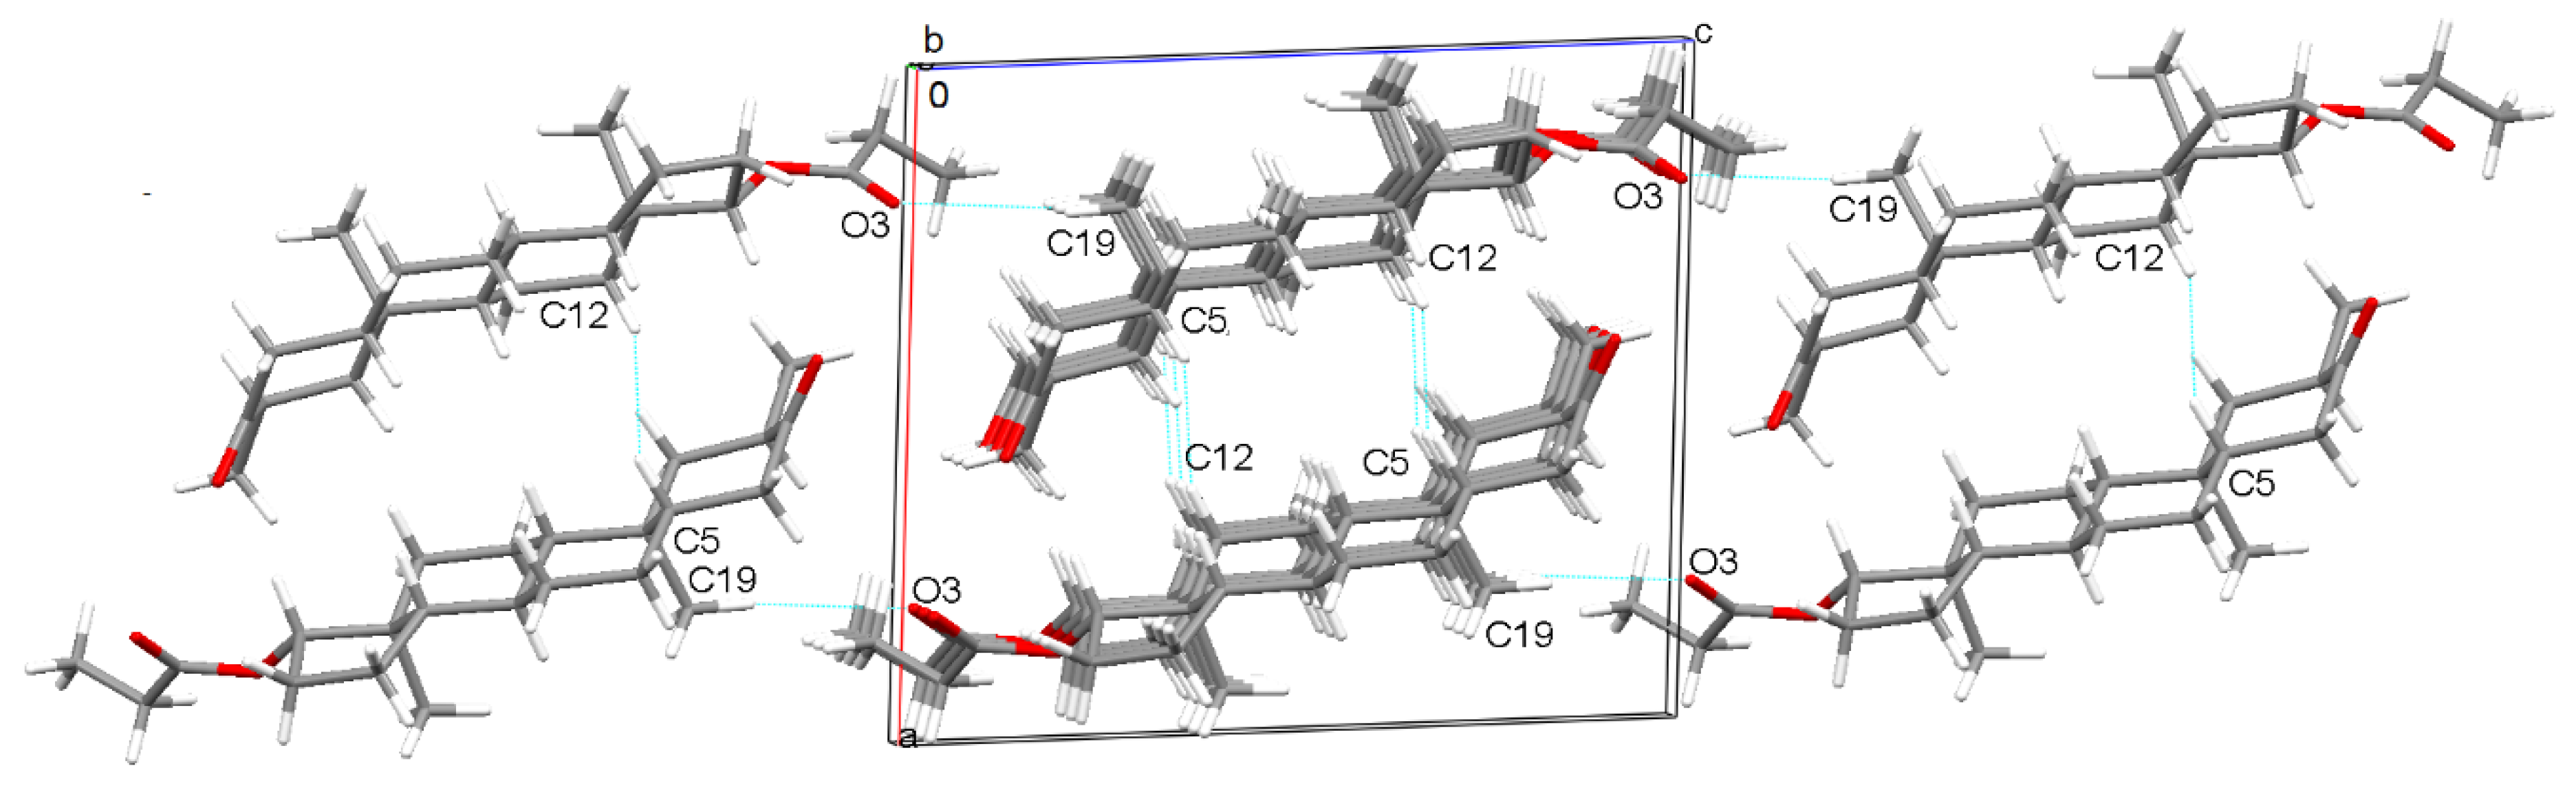
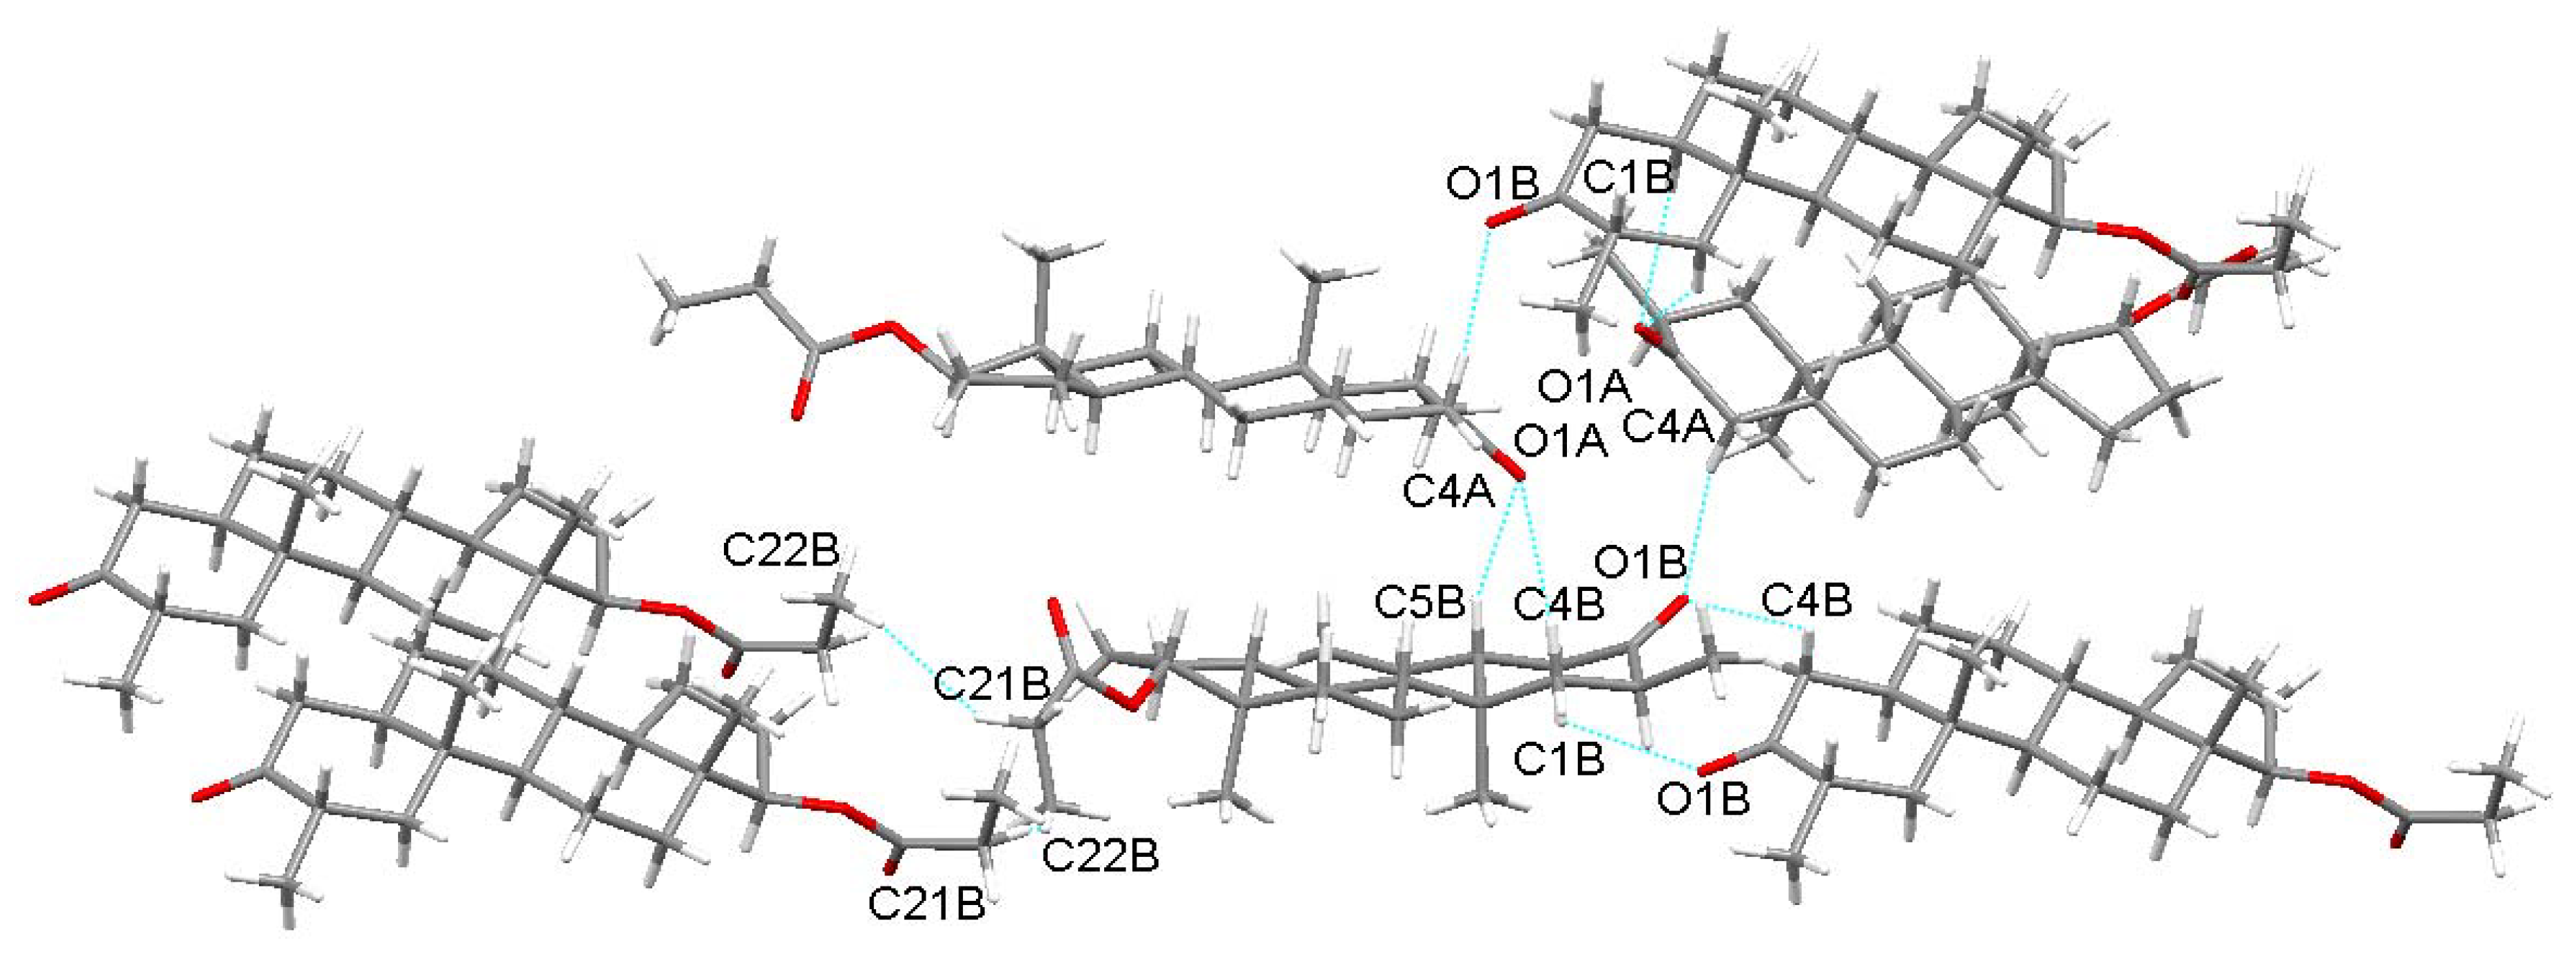
2.1. Crystal Structure Analysis
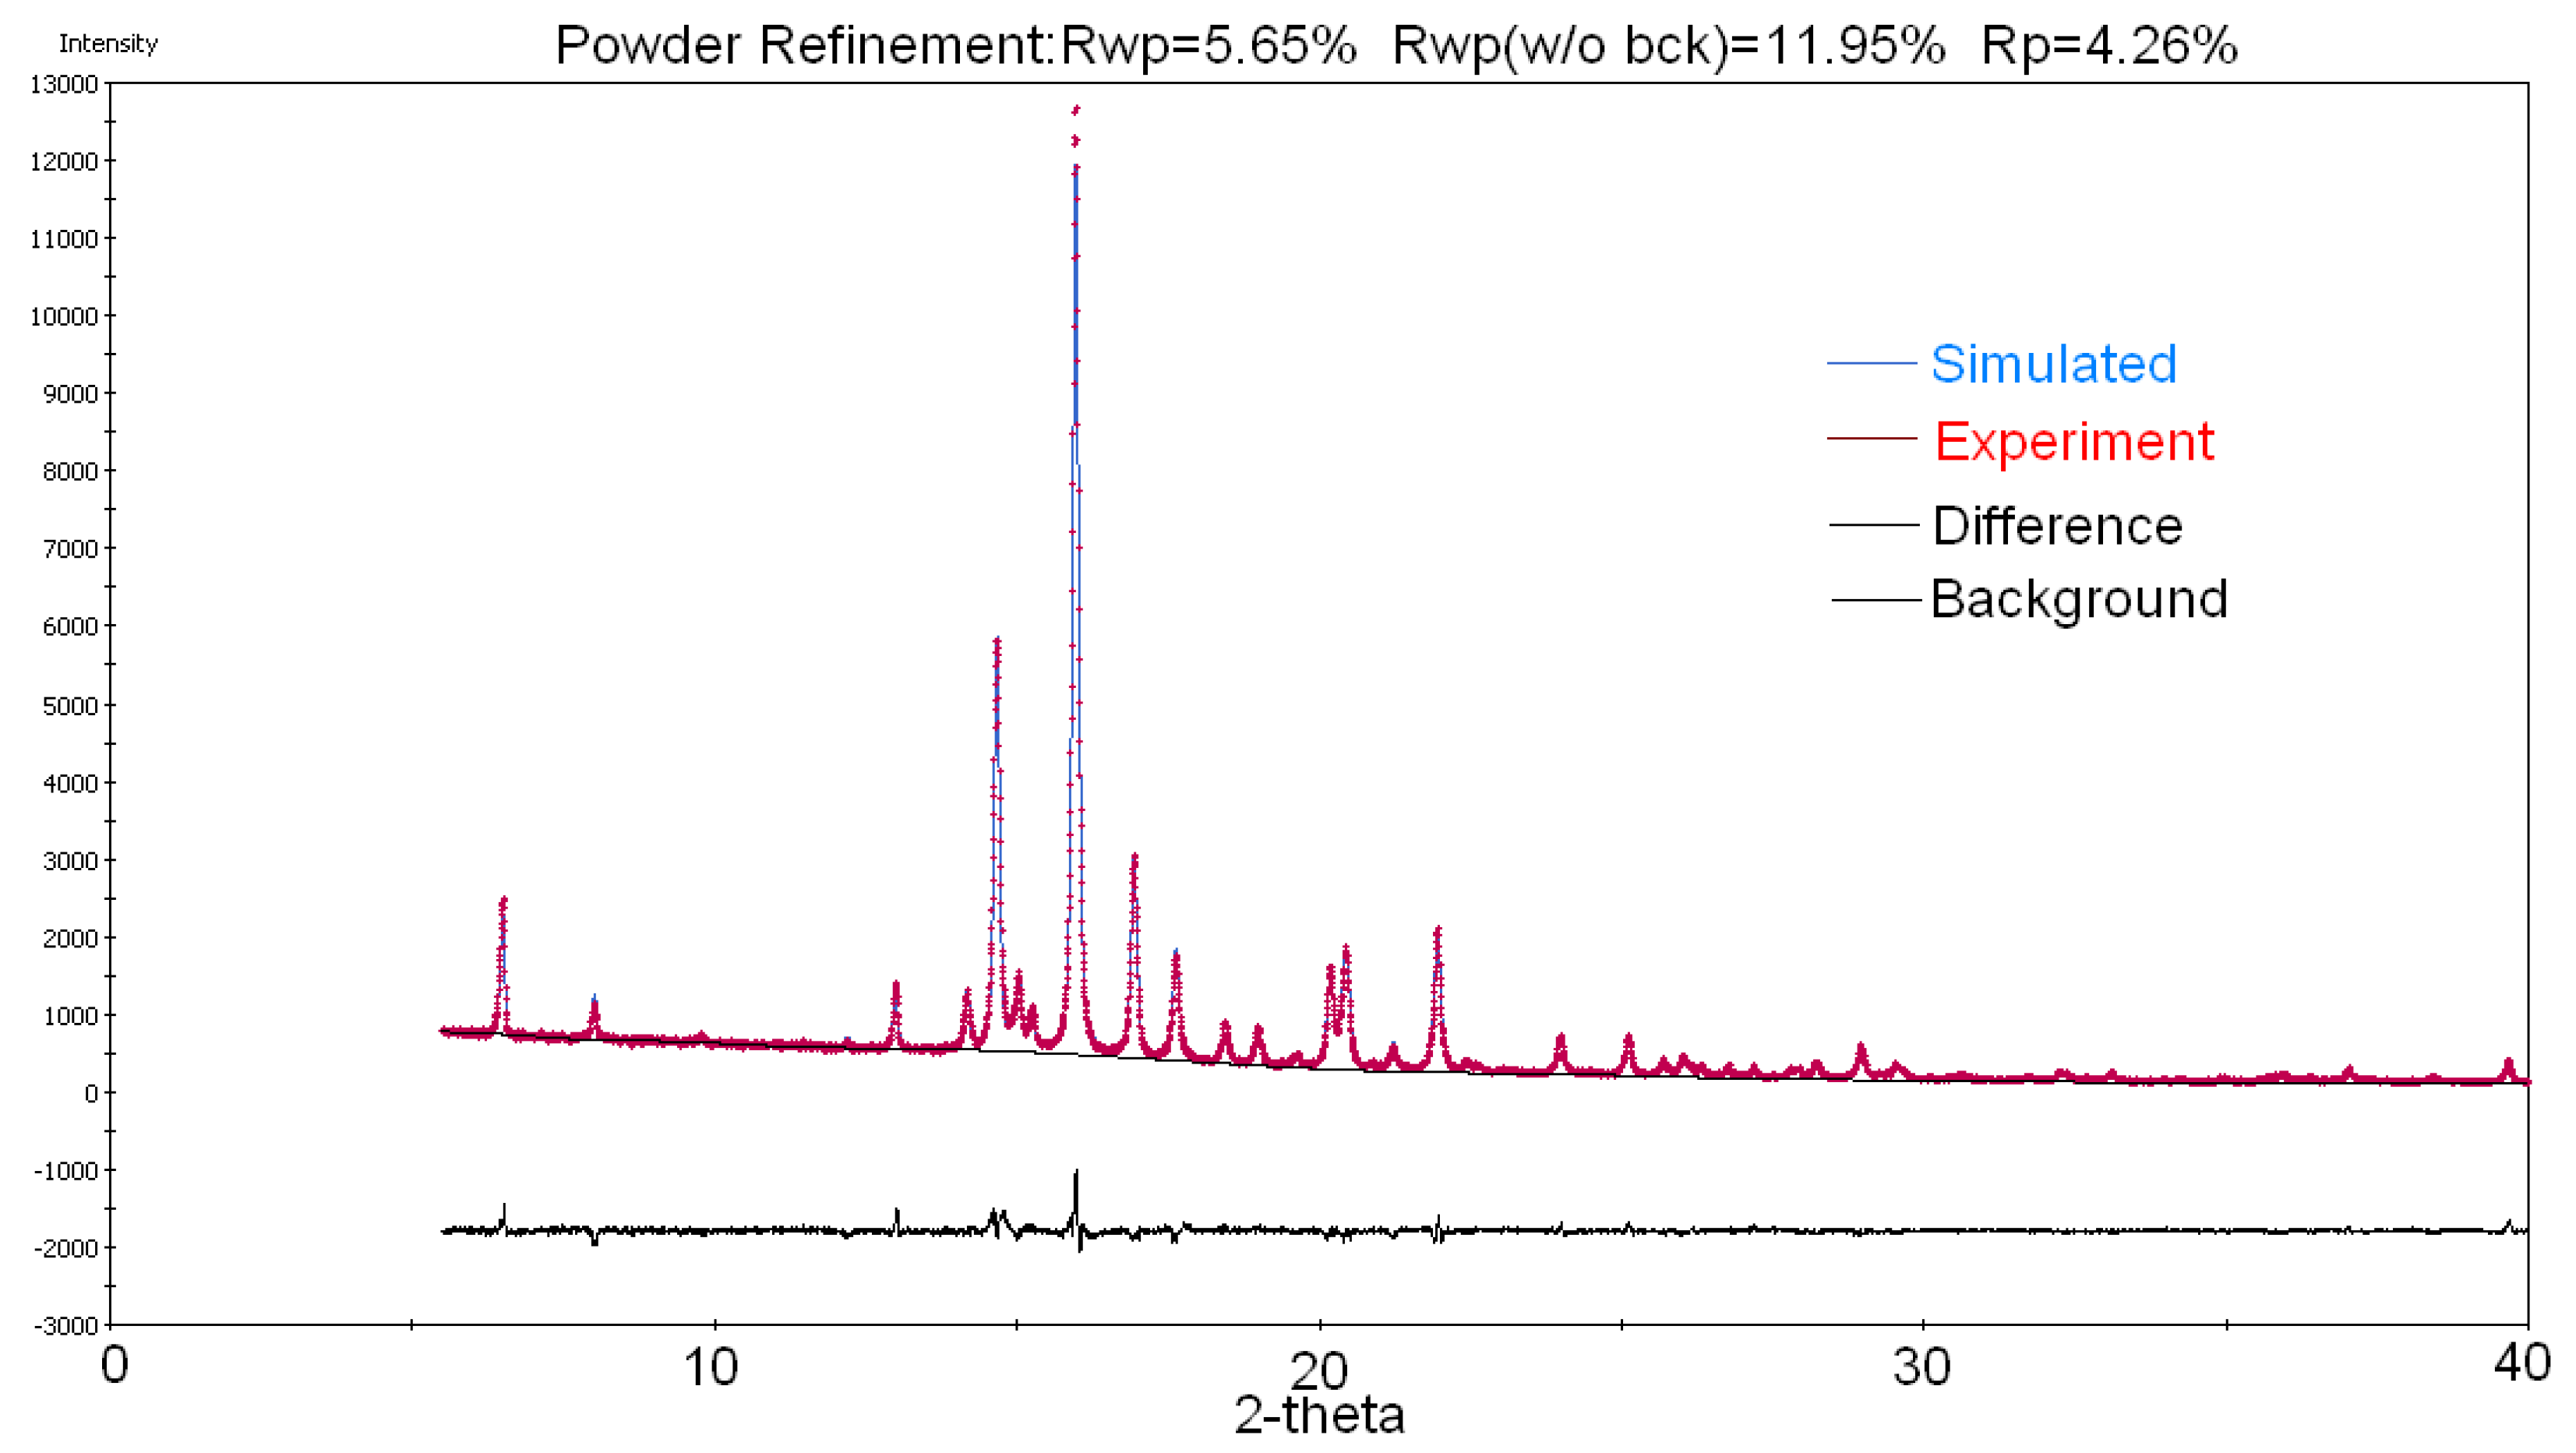
2.2. Crystal Structure Determination of Drost 1 by X-ray Powder Diffraction (XRPD)
2.3. Hirshfeld Surfaces and Fingerprint Plot Analysis
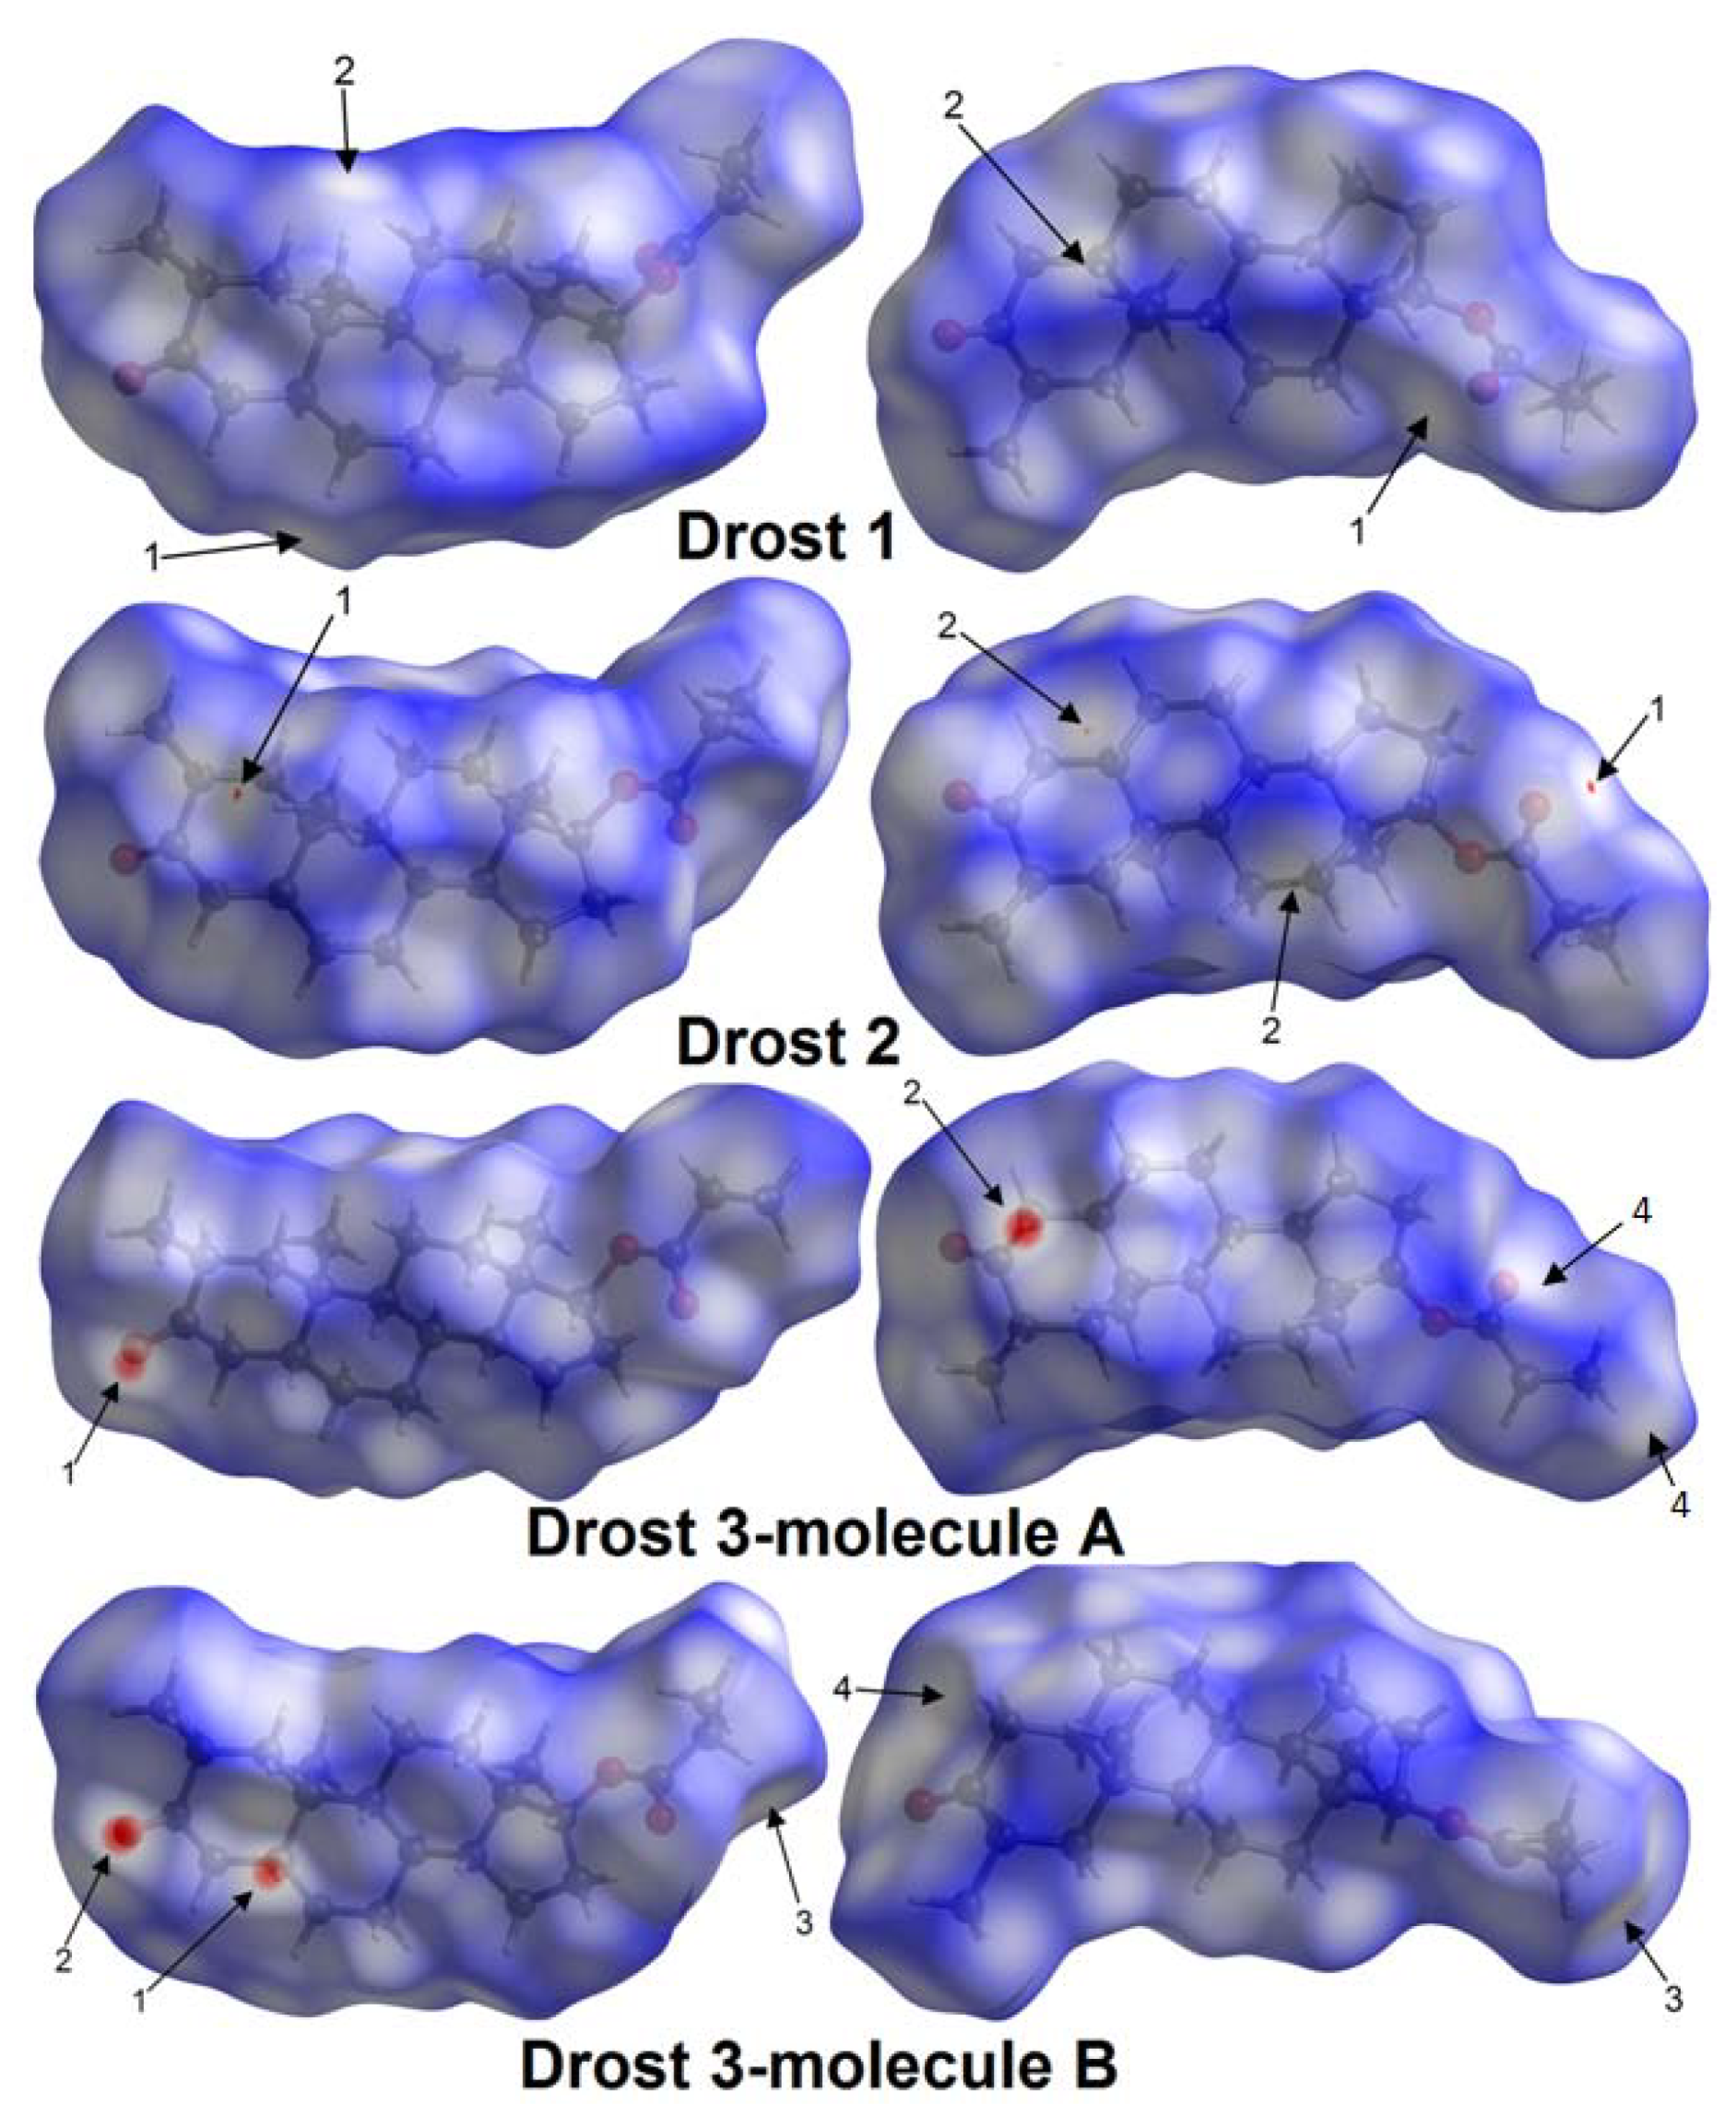
2.3.1. Hirshfeld Surfaces
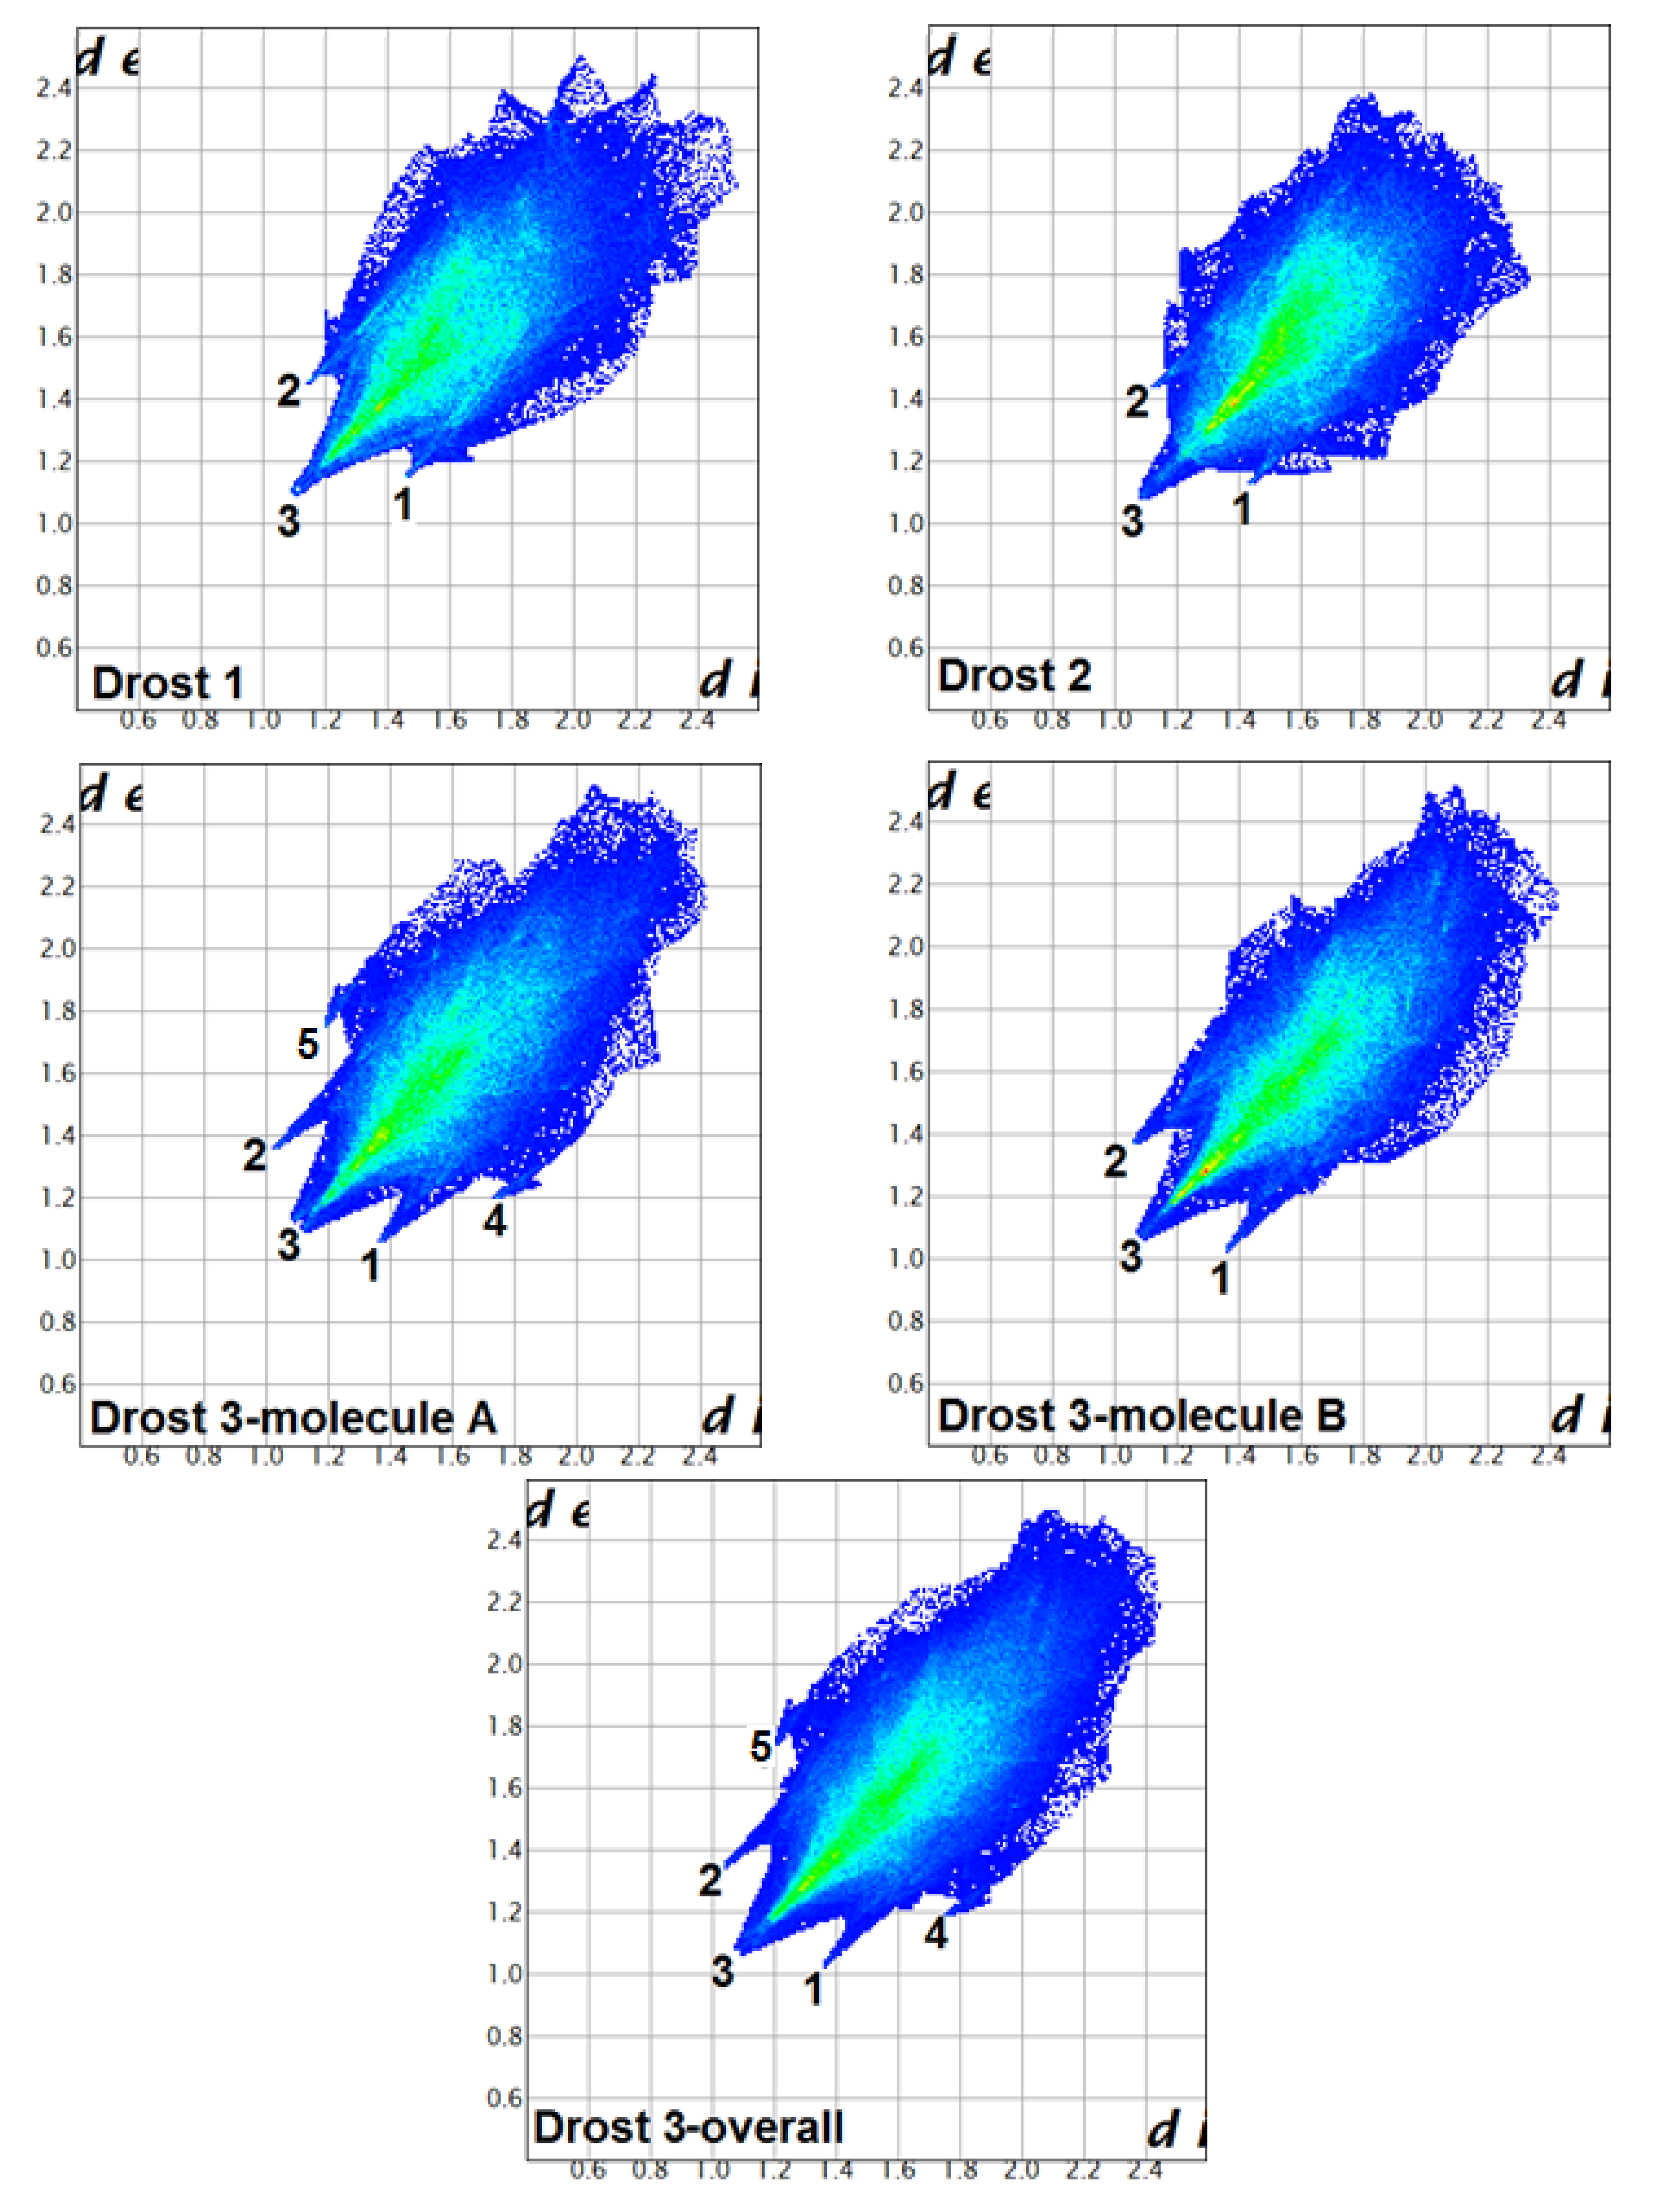
2.3.2. Fingerprint Plot Analysis
- (i)
- The plots shape and features are different in all three compounds and indicate that the supramolecular assemblies are different for each crystal structure.
- (ii)
- The top end values of de and di in the fingerprint plots of Drost 2 are slightly smaller in comparison with Drost 1 and the two independent molecules of Drost 3, which conclude that Drost 2 has higher packing efficiency [26]. This is already in good agreement with the Kitaigorodskii packing index.
- (iii)
- The fingerprint plots of Drost 1 and Drost 2 exhibits similar features, while being different with the plots of the two molecules in Drost 3.
- (iv)
- The common and the most visible feature in all polymorphs is the wide H...H spike, which stands for label 3.
- (v)
- The two distinct molecules of Drost 3 show two sharp spikes, which are characteristic to O...H and H...O contacts. These are less protruding in Drost 1 and Drost 2, which indicate the formation of stronger C-H…O bonds in Drost 3.
- (vi)
- The C-H…C interactions in molecule A of Drost 3 are seen on the fingerprint plot as two characteristic wings, which molecule B is lacking.
- (vii)
- The high percentage of H…H, O…H and C…H inter-contacts indicates that the structures rely on weak van der Walls interactions, which assure the crystal packing [27].
2.4. Lattice Energies Evaluation
2.4.1. Lattice Energy Evaluation by the Coulomb-London-Pauli (CLP) Method
2.4.2. Lattice Energy Evaluation by a Density-Functional Tight-Binding Model
2.5. Conformational Analysis
3. Materials and Methods
3.1. Materials
3.2. Crystal Growth
3.3. X-ray Powder Diffraction (XRPD)
3.4. Single Crystal X-ray Diffraction
3.5. Evaluation of Intermolecular Interactions by Hirshfeld Surfaces and Fingerprint Plots
3.6. Lattice Energy Evaluation by the CLP Model
3.7. Evaluation of Intermolecular Interactions by First Principal Methods
3.8. Conformational Analysis
4. Conclusions
Supplementary Materials
Author Contributions
Funding
Acknowledgments
Conflicts of Interest
References
- Vippagunta, S.R.; Brittain, H.G.; Grant, D.J.W. Crystalline solids. Adv. Drug Delivery Rev. 2001, 48, 3–26. [Google Scholar] [CrossRef]
- Shahidi, N.T. A review of the chemistry, biological action, and clinical applications of anabolic-androgenic steroids. Clin. Ther. 2001, 23, 1355–1390. [Google Scholar] [CrossRef]
- Kam, P.C.A.; Yarrow, M. Anabolic steroid abuse: Physiological and anaesthetic considerations. Anaesthesia 2005, 60, 685–692. [Google Scholar] [CrossRef]
- Dickerman, R.D.; McConathy, W.J.; Zachariah, N.Y. Testosterone, Sex Hormone-Binding Globulin, Lipoproteins, and Vascular Disease. J. Cardiovasc. Risk 1997, 4, 363–366. [Google Scholar] [CrossRef] [PubMed]
- Glazer, G. Atherogenic effects of anabolic steroids on serum lipid levels: A literature review. Arch. Intern. Med. 1991, 151, 1925–1931. [Google Scholar] [CrossRef] [PubMed]
- Hartgens, F.; Rietjens, G.; Keizer, H.; Kuipers, H.; Wolffenbuttel, B. Effects of androgenic-anabolic steroids on apolipoproteins and lipoprotein (a). Brit. J. Sports Med. 2004, 38, 253–259. [Google Scholar] [CrossRef] [PubMed]
- Braunstein, G.D. The influence of anabolic steroids on muscular strength. Princ. Med. Biol. 1997, 8, 465–474. [Google Scholar] [CrossRef]
- Cherkasova, O.P.; Nazarov, M.M.; Sapozhnikov, D.A.; Man’kova, A.A.; Fedulova, E.V.; Volodin, V.A.; Minaeva, V.A.; Minaev, B.F.; Baryshnikov, G.V. Vibrational spectra of corticosteroid hormones in the terahertz range. Laser Appl. Life Sci. 2010, 7376, 73760P. [Google Scholar] [CrossRef]
- Elks, J.; Ganellin, C.R. The Dictionary of Drugs: Chemical Data: Chemical Data, Structures and Bibliographies, 1st ed.; Springer: Easton, ME, USA, 1990; p. 652. [Google Scholar]
- Llewellyn, W. Anabolics, 10th ed.; Molecular Nutrition Llc.: Jupiter, FL, USA, 2011; p. 517. [Google Scholar]
- Kicman, A.T. Pharmacology of anabolic steroids. Br. J. Pharmacol. 2008, 154, 502–521. [Google Scholar] [CrossRef]
- Vermeulen, A. Longacting steroid preparations. Acta Clin. Belg. 1975, 30, 48–55. [Google Scholar] [CrossRef]
- William, N.; Taylor, M.D. Anabolic Steroids and the Athlete, 2nd ed.; McFarland & Company: Jefferson, MO, USA; London, UK, 2002; p. 39. [Google Scholar]
- Chowdhury, M.S.; Banks, A.J.; Bond, W.H.; Jones, W.G.; Ward, H.W. A comparison of drostanolone propionate (Masteril) and nandrolone decanoate (Deca-durabolin) in the treatment of breast carcinoma. Clin. Oncol. 1976, 2, 203–206. [Google Scholar] [PubMed]
- Choudhary, M.I.; Siddiqui, M.; Atia-tul-Wahab; Yousuf, S.; Fatima, N.; Ahmad, M.S.; Choudhry, H. Bio-Catalytic Structural Transformation of Anti-cancer Steroid, Drostanolone Enanthate with Cephalosporium aphidicola and Fusarium lini, and Cytotoxic Potential Evaluation of Its Metabolites against Certain Cancer Cell Lines. Front. Pharmacol. 2017, 8, 900. [Google Scholar] [CrossRef] [PubMed]
- Macrae, C.F.; Bruno, I.J.; Chisholm, J.A.; Edgington, P.R.; McCabe, P.; Pidcock, E.; Rodriguez-Monge, L.; Taylor, R.; Van de Streek, J.; Woo, P.A. Mercury CSD 2.0-new features for the visualization and investigation of crystal structures. J. Appl. Cryst. 2008, 41, 466–470. [Google Scholar] [CrossRef]
- Meden, A. Crystal structure solution from powder diffraction data-state of the art and perspectives. Croat. Chem. Acta. 1998, 71, 615–633. Available online: https://hrcak.srce.hr/132373 (accessed on 19 March 2020).
- Dassault Systèmes BIOVIA, v8.0.0.843; Materials Studio: San Diego, CA, USA, 2014.
- Boultif, A.; Louer, D. Powder pattern indexing with the dichotomy method. J. Appl. Cryst. 2004, 37, 724–731. [Google Scholar] [CrossRef]
- Werner, P.-E.; Eriksson, L.; Westdahl, M. TREOR, a semi-exhaustive trial-and-error powder indexing program for all symmetries. J. Appl. Cryst. 1985, 18, 367–370. [Google Scholar] [CrossRef]
- Visser, J.W. Some calculations for powder patterns. J. Appl. Crystallogr. 1969, 2, 142–143. [Google Scholar] [CrossRef]
- Neumann, M.A. X-Cell: A novel indexing algorithm for routine tasks and difficult cases. J. Appl. Cryst. 2003, 36, 356–365. [Google Scholar] [CrossRef]
- Favre-Nicolin, V.; Cerny, R. FOX, ‘free objects for crystallography’: A modular approach to ab initio structure determination from powder diffraction. J. Appl. Cryst. 2002, 35, 734–743. [Google Scholar] [CrossRef]
- Caglioti, G.; Paoletti, A.; Ricci, F.P. Choice of collimators for a crystal spectrometer for neutron diffraction. Nucl. Instrum. 1958, 3, 223–228. [Google Scholar] [CrossRef]
- Soman, R.; Sujatha, S.; Arunkumar, C. Quantitative crystal structure analysis of fluorinated porphyrins. J. Fluor. Chem. 2014, 163, 16–22. [Google Scholar] [CrossRef]
- Durka, K.; Hoser, A.A.; Kaminski, R.; Lulinnski, S.; Serwatowski, J.; Kozminski, W.; Wozniak, K. Polymorphism of a Model Arylboronic Azaester: Combined Experimental and Computational Studies. Cryst. Growth Des. 2011, 11, 1835–1845. [Google Scholar] [CrossRef]
- Hathwar, V.R.; Sist, M.; Jørgensen, M.R.V.; Mamakhel, A.H.; Wang, X.; Hoffmann, C.M.; Sugimoto, K.; Overgaard, J.; Iversen, B.B. Quantitative analysis of intermolecular interactions in orthorhombic rubrene. IUCrJ 2015, 2, 563–574. [Google Scholar] [CrossRef] [PubMed]
- Minaeva, V.A.; Minaev, B.F.; Baryshikov, G.V.; Surovtsev, N.V.; Cherkasova, O.P.; Tkachenko, L.I.; Karaush, N.N.; Stromylo, E.V. Temperature Effects in Low-Frequency Raman Spectra of Corticosteroid Hormones. Opt. Spectrosc. 2015, 118, 214–223. [Google Scholar] [CrossRef]
- Minaeva, V.A.; Cherkasova, O.P.l.; Minaev, B.F.; Baryshnikov, G.V.; Khmara, A.V. Features of Terahertz Adsorption and Raman Scattering of Mineralocorticoid Hormones. Bull. Russ. Acad. Sci. Phys. 2015, 79, 1196–1201. [Google Scholar] [CrossRef]
- Kitaigorodsky, A.I. Molecular Crystals and Molecules; Academic Press: New York, NY, USA, 1973; p. 18. [Google Scholar]
- Spek, A.L. Structure validation in chemical crystallography. Acta Cryst. 2009, D65, 148–155. [Google Scholar] [CrossRef]
- Elstner, M.; Porezag, D.; Jungnickel, G.; Elsner, J.; Haugk, M.; Frauenheim, T.; Suhai, S.; Seifert, G. Self-consistent-charge density-functional tight-binding method for simulations of complex materials properties. Phys. Rev. B 1998, 58, 7260–7269. [Google Scholar] [CrossRef]
- Aradi, B.; Hourahine, B.; Frauenheim, T. DFTB+, a sparse matrix-based implementation of the DFTB method. J. Phys. Chem. A 2007, 111, 5678–5684. [Google Scholar] [CrossRef]
- Hoja, J.; Reilly, A.M.; Tkatchenko, A. First-principles modeling of molecular crystals: Structures and stabilities, temperature and pressure. WIREs Comput. Mol. Sci. 2017, 7, e1294. [Google Scholar] [CrossRef]
- Momma, K.; Izumi, F. VESTA 3 for three-dimensional visualization of crystal, volumetric and morphology data. J. Appl. Crystallogr. 2011, 44, 1272–1276. [Google Scholar] [CrossRef]
- Elstner, M.; Hobza, P.; Frauenheim, T.; Suhai, S.; Kaxiras, E. Hydrogen bonding and stacking interactions of nucleic acid base pairs: A density-functional-theory based treatment. J. Chem. Phys. 2001, 114, 5149–5155. [Google Scholar] [CrossRef]
- Bende, A.; Grosu, I.; Turcu, I. Molecular Modeling of Phenothiazine Derivatives: Self-Assembling Properties. J. Phys. Chem. A 2010, 114, 12479–12489. [Google Scholar] [CrossRef]
- Mackenzie, C.F.; Spackman, P.R.; Jayatilaka, D.; Spackman, M.A. Crystal Explorer model energies and energy frameworks: Extension to metal coordination compounds, organic salts, solvates and open-shell systems. IUCrJ 2017, 4, 575–587. [Google Scholar] [CrossRef] [PubMed]
- Thomas, S.P.; Spackman, P.R.; Jayatilaka, D.; Spackman, M.A. Accurate lattice energies for molecular crystals from experimental crystal structures. J. Chem. Theory Comput. 2018, 14, 1614–1623. [Google Scholar] [CrossRef]
- Werner, H.-J.; Manby, F.R.; Knowles, P.J. Fast linear scaling second-order Møller-Plesset perturbation theory (MP2) using local and density fitting approximations. J. Chem. Phys. 2003, 118, 8149–8160. [Google Scholar] [CrossRef]
- Weigend, F.; Ahlrichs, R. Balanced basis sets of split valence, triple zeta valence and quadruple zeta valence quality for H to Rn: Design and assessment of accuracy. Phys. Chem. Chem. Phys. 2005, 7, 3297–3305. [Google Scholar] [CrossRef]
- Werner, H.-J.; Knowles, P.J.; Knizia, G.; Manby, F.R.; Schütz, M. Molpro: A general-purpose quantum chemistry program package. WIREs Comput. Mol. Sci. 2012, 2, 242–253. [Google Scholar] [CrossRef]
- Vener, M.V.; Elena Levina, E.O.; Koloskov, O.A.; Rykounov, A.A.; Voronin, A.P.; Tsirelson, V.G. Evaluation of the lattice energy of the two-component molecular crystals using solid-state density functional theory. Cryst. Growth Des. 2014, 14, 4997–5003. [Google Scholar] [CrossRef]
- Espinosa, E.; Molins, E.; Lecomte, C. Hydrogen bond strengths revealed by topological analyses of experimentally observed electron densities. Chem. Phys. Lett. 1998, 285, 170–173. [Google Scholar] [CrossRef]
- Bader, R.W.F. Atoms in Molecules: A Quantum Theory; Oxford University Press: New York, NY, USA, 1990. [Google Scholar]
- Baryshnikov, G.V.; Minaev, B.F.; Minaeva, V.A.; Baryshnikova, A.T.; Pittelkow, M. DFT and QTAIM study of the tetra-tert-butyltetraoxa[8]circulene regioisomers structure. J. Mol. Struc. 2012, 1026, 127–132. [Google Scholar] [CrossRef]
- Arkhipov, D.E.; Lyubeshkin, A.V.; Volodin, A.D.; Korlyukov, A.A. Molecular structures polymorphism the role of F…F interactions in crystal packing of fluorinated tosylates. Crystals 2019, 9, 242. [Google Scholar] [CrossRef]
- Kuznetsov, M.L. Relationships between Interaction Energy and Electron Density Properties for Homo Halogen Bonds of the [(A)nY–X···X–Z(B)m] Type (X = Cl, Br, I). Molecules 2019, 24, 2733. [Google Scholar] [CrossRef] [PubMed]
- Jeziorski, B.; Moszynski, R.; Szalewicz, K. Perturbation Theory Approach to Intermolecular Potential Energy Surfaces of van der Waals Complexes. Chem. Rev. 1994, 94, 1887–1930. [Google Scholar] [CrossRef]
- Parker, T.M.; Burns, L.A.; Parrish, R.M.; Ryno, A.G.; Sherrill, C.D. Levels of symmetry adapted perturbation theory (SAPT). I. Efficiency and performance for interaction energies. J. Chem. Phys. 2014, 140, 094106. [Google Scholar] [CrossRef] [PubMed]
- Papajak, E.; Zheng, J.; Xu, X.; Leverentz, H.R.; Truhlar, D.G. Perspectives on Basis Sets Beautiful: Seasonal Plantings of Diffuse Basis Functions. J. Chem. Theory Comput. 2011, 7, 3027–3034. [Google Scholar] [CrossRef]
- Griffin, J.F.; Duax, W.L.; Weeks, C.M. (Eds.) Atlas of Steroid Structure; IFI/PLENUM: New York, NY, USA, 1984; Volume 2, p. 8. [Google Scholar] [CrossRef]
- Altona, C.; Geise, H.J.; Romers, C. Conformation of non-aromatic ring Compounds—XXV: Geometry and conformation of ring D in some steroids from X-ray structure determinations. Tetrahedron 1968, 24, 13–32. [Google Scholar] [CrossRef]
- Turza, A.; Miclăuș, M.O.; Pop, A.; Borodi, G. Crystal and molecular structures of boldenone and four boldenone steroid esters. Z. Kristallogr. Cryst. Mater. 2019, 234, 671–683. [Google Scholar] [CrossRef]
- CrysAlis PRO; Rigaku Oxford Diffraction: Yarnton, Oxfordshire, UK, 2015.
- Dolomanov, O.V.; Bourhis, L.J.; Gildea, R.J.; Howard, J.A.K.; Puschmann, H. OLEX2: A Complete Structure Solution, Refinement and Analysis Program. J. Appl. Cryst. 2009, 42, 339–341. [Google Scholar] [CrossRef]
- Sheldrick, G.M. SHELXT-Integrated space-group and crystal-structure determination. Acta Cryst. 2015, A71, 3–8. [Google Scholar] [CrossRef]
- Sheldrick, G.M. A short history of SHELX. Acta Cryst. 2008, A64, 112–122. [Google Scholar] [CrossRef]
- Sheldrick, G.M. Crystal structure refinement with SHELXL. Acta Cryst. 2015, C71, 3–8. [Google Scholar] [CrossRef]
- Spackman, M.A.; McKinnon, J.J. Fingerprinting intermolecular interactions in molecular crystals. CrystEngComm. 2002, 4, 378–392. [Google Scholar] [CrossRef]
- McKinnon, J.J.; Jayatilaka, D.; Spackman, M.A. Towards quantitative analysis of intermolecular interactions with Hirshfeld surfaces. Chem. Commun. 2007, 37, 3814–3816. [Google Scholar] [CrossRef] [PubMed]
- McKinnon, J.J.; Fabbiani, F.P.A.; Spackman, M.A. Comparison of Polymorphic Molecular Crystal Structures through Hirshfeld Surface Analysis. Cryst. Growth Des. 2007, 7, 755–769. [Google Scholar] [CrossRef]
- Turner, M.J.; McKinnon, J.J.; Wolff, S.K.; Grimwood, D.J.; Spackman, P.R.; Jayatilaka, D.; Spackman, M.A. CrystalExplorer17; University of Western Australia: The Nedlands, Australia, 2017. [Google Scholar]
- Gavezzotti, A. Efficient computer modeling of organic materials. The atom–atom, Coulomb–London–Pauli (AA-CLP) model for intermolecular electrostatic-polarization, dispersion and repulsion energies. New J. Chem. 2011, 35, 1360–1368. [Google Scholar] [CrossRef]
- Parrish, R.M.; Burns, L.A.; Smith, D.G.A.; Simmonett, A.C.; DePrince III, A.E.; Hohenstein, E.G.; Bozkaya, U.; Sokolov, A.Y.; Di Remigio, R.; Richard, R.M.; et al. Psi4 1.1: An Open-Source Electronic Structure Program Emphasizing Automation, Advanced Libraries, and Interoperability. J. Chem. Theory Comput. 2017, 13, 3185–3197. [Google Scholar] [CrossRef]
- Altona, C.; Sundaralingam, M. Conformational analysis of the sugar ring in nucleosides and nucleotides. New description using the concept of pseudorotation. J. Am. Chem. Soc. 1972, 94, 8205–8212. [Google Scholar] [CrossRef]
Sample Availability: Samples of polymorphs Drost 1 and Drost 2 are available from the authors. |


| Compound Name | Drost 2 (Ethanol) | Drost 3 (Acetone) |
|---|---|---|
| Empirical formula | C23H36O3 | C23H36O3 |
| Formula weight | 360.52 | 360.52 |
| Temperature/K | 293(2) | 293(2) |
| Crystal system | monoclinic | monoclinic |
| Space group | P21 | I2 |
| a/Å | 11.2322(5) | 11.8778(5) |
| b/Å | 7.4380(2) | 7.4245(3) |
| c/Å | 12.5035(5) | 48. 6370(17) |
| α/° | 90 | 90 |
| β/° | 93.647(2) | 96. 668(4) |
| γ/° | 90 | 90 |
| Volume/Å3 | 1042.49(4) | 4260.1(3) |
| Z | 2 | 8 |
| ρcalcg/cm3 | 1.149 | 1.124 |
| μ/mm−1 | 0.576 | 0.564 |
| F(000) | 396.0 | 1584.0 |
| Radiation | CuKα (λ = 1.54184) | CuKα (λ = 1.54184) |
| 2Θ range for data collection/° | 7.064 to 140.916 | 7.32 to 144.44 |
| Index ranges | −13 ≤ h ≤ 13, −9 ≤ k ≤ 8, −15 ≤ l ≤ 15 | −14 ≤ h ≤ 14, −8 ≤ k ≤ 8, −59 ≤ l ≤ 59 |
| Reflections collected | 13976 | 30229 |
| Independent reflections | 3924 [Rint = 0.0356, Rsigma = 0.0232] | 8013 [Rint = 0.0195, Rsigma = 0.0146] |
| Data/restraints/parameters | 3924/1/239 | 8013/2/477 |
| Goodness-of-fit on F2 | 1.017 | 1.036 |
| Final R indexes [I > = 2σ (I)] | R1 = 0.0446, wR2 = 0.1266 | R1 = 0.0465, wR2 = 0.1317 8 |
| Final R indexes [all data] | R1 = 0.0475, wR2 = 0.1315 | R1 = 0.0566, wR2 = 0.1463 |
| Largest diff. peak/hole/e Å−3 | 0.16/−0.16 | 0.20/−0.13 |
| Flack parameter | 0.10(10) | 0.06(6) |
| CCDC No.* | 1956813 | 1956814 |
| Chemical Formula | C23H36O3 |
|---|---|
| Formula weight (g/mol) | 360.53 |
| Crystal system | orthorhombic |
| Space group | P 21 21 21 (19) |
| Z | 4 |
| a (Å) | 27.2532(19) |
| b (Å) | 12.0731(8) |
| c (Å) | 6.4161(4) |
| V (Å3) | 2111.09 |
| Rwp (%) | 5.64 |
| CCDC No. | 1956812 |
| Structure | D-H...A | d(D-H) | d(H...A) | d(D...A) | <(DHA) | Label | Fig. |
|---|---|---|---|---|---|---|---|
| Drost 1 | C6-H6A...O3 | 0.97 | 2.715(3) | 3.647(2) | 161.43(1) | 1 (White spot) | 7 |
| C19-H19A...H5-C5 | 0.96/0.98 | 2.373(7) | 3.907(6) | 146.15(7)/138.6(8) | 2 (White spot) | 7 | |
| Drost 2 | C19-H19B...O3 | 0.96 | 2.687(5) | 3.622(8) | 164.54(2) | 1 (Faint-red spot) | 7 |
| C12-H12A...H5-C5 | 0.97/0.98 | 2.341(1) | 4.047(7) | 136.2(4)/152.04(8) | 2 (Faint-red spot) | 7 | |
| Drost 3 mol. A | C5B-H5B...O1A | 0.98 | 2.537(8) | 3.460(11) | 157.09(9) | 1 (Intense-red spot) | 7 |
| C1B-H1BB...O1A | 0.97 | 2.720(6) | 3.554(7) | 144.43(4) | 1 (Intense-red spot) | 7 | |
| C4A-H4AA...O1B | 0.97 | 2.510(8) | 3.459(9) | 166.38(6) | 2 (Intense red spot) | 7 | |
| C22A-H22C...C20A | 0.96 | 3.077(1) | 4.031(1) | 174.06(3) | 4 (White spot) | 7 | |
| Drost 3 mol. B | C5B-H5B...O1A | 0.98 | 2.537(8) | 3.460(11) | 157.09(9) | 1 (Intense red spot) | 7 |
| C1B-H1BB...O1A | 0.97 | 2.720(6) | 3.554(7) | 144.43(4) | 1 (Intense red spot) | 7 | |
| C4A-H4AA...O1B | 0.97 | 2.510(8) | 3.459(9) | 166.38(6) | 2 (Intense red spot) | 7 | |
| C21B-H21D...H22E-C22B | 0.97/0.96 | 2.366(7) | 4.086(9) | 141.02(8) | 3 (White spot) | 7 | |
| C4B-H4BA...O1B | 0.97 | 2.665(8) | 3.524(6) | 118.68(2) | 4 (White spot) | 7 |
| Structure | H...H | O...H/H...O | C...H/H...C | C...O/O...C | O…O | C…C |
|---|---|---|---|---|---|---|
| Drost 1 | 83.2% | 16.0% | 0.5% | 0.3% | - | - |
| Drost 2 | 83.3% | 14.6% | 0.9% | 0.5% | 0.8% | - |
| Drost 3 Mol. A | 83.4% | 14.3% | 1.1% | 0.6% | 0.6% | - |
| Drost 3 Mol. B | 82.0% | 16.7% | 0.5% | 0.5% | 0.2% | 0.1% |
| Drost 3 overall | 85.2% | 12.9% | 0.9% | 0.6% | 0.4% | - |
| a | ||||||
| Structure | Ecoul | Epol | Edisp | Eatt | Erep | Elatt (kJ/mol) |
| Drost 1 | −16.0 | −54.1 | −130.4 | −200.5 | 44.2 | −156.3 |
| Drost 2 | −10.3 | −56.5 | −139.4 | −206.2 | 48.7 | −159.2 |
| Drost 3 | −13.0 | −55.2 | −134.7 | −202.9 | 51.4 | −151.6 |
| b | ||||||
| Structure | Edisp (N∞) | Elatt (N∞) | ||||
| Drost 1 | −125.9 | −142.6 | ||||
| Drost 2 | −138.3 | −151.7 | ||||
| Drost 3 | −119.7 | −137.7 | ||||
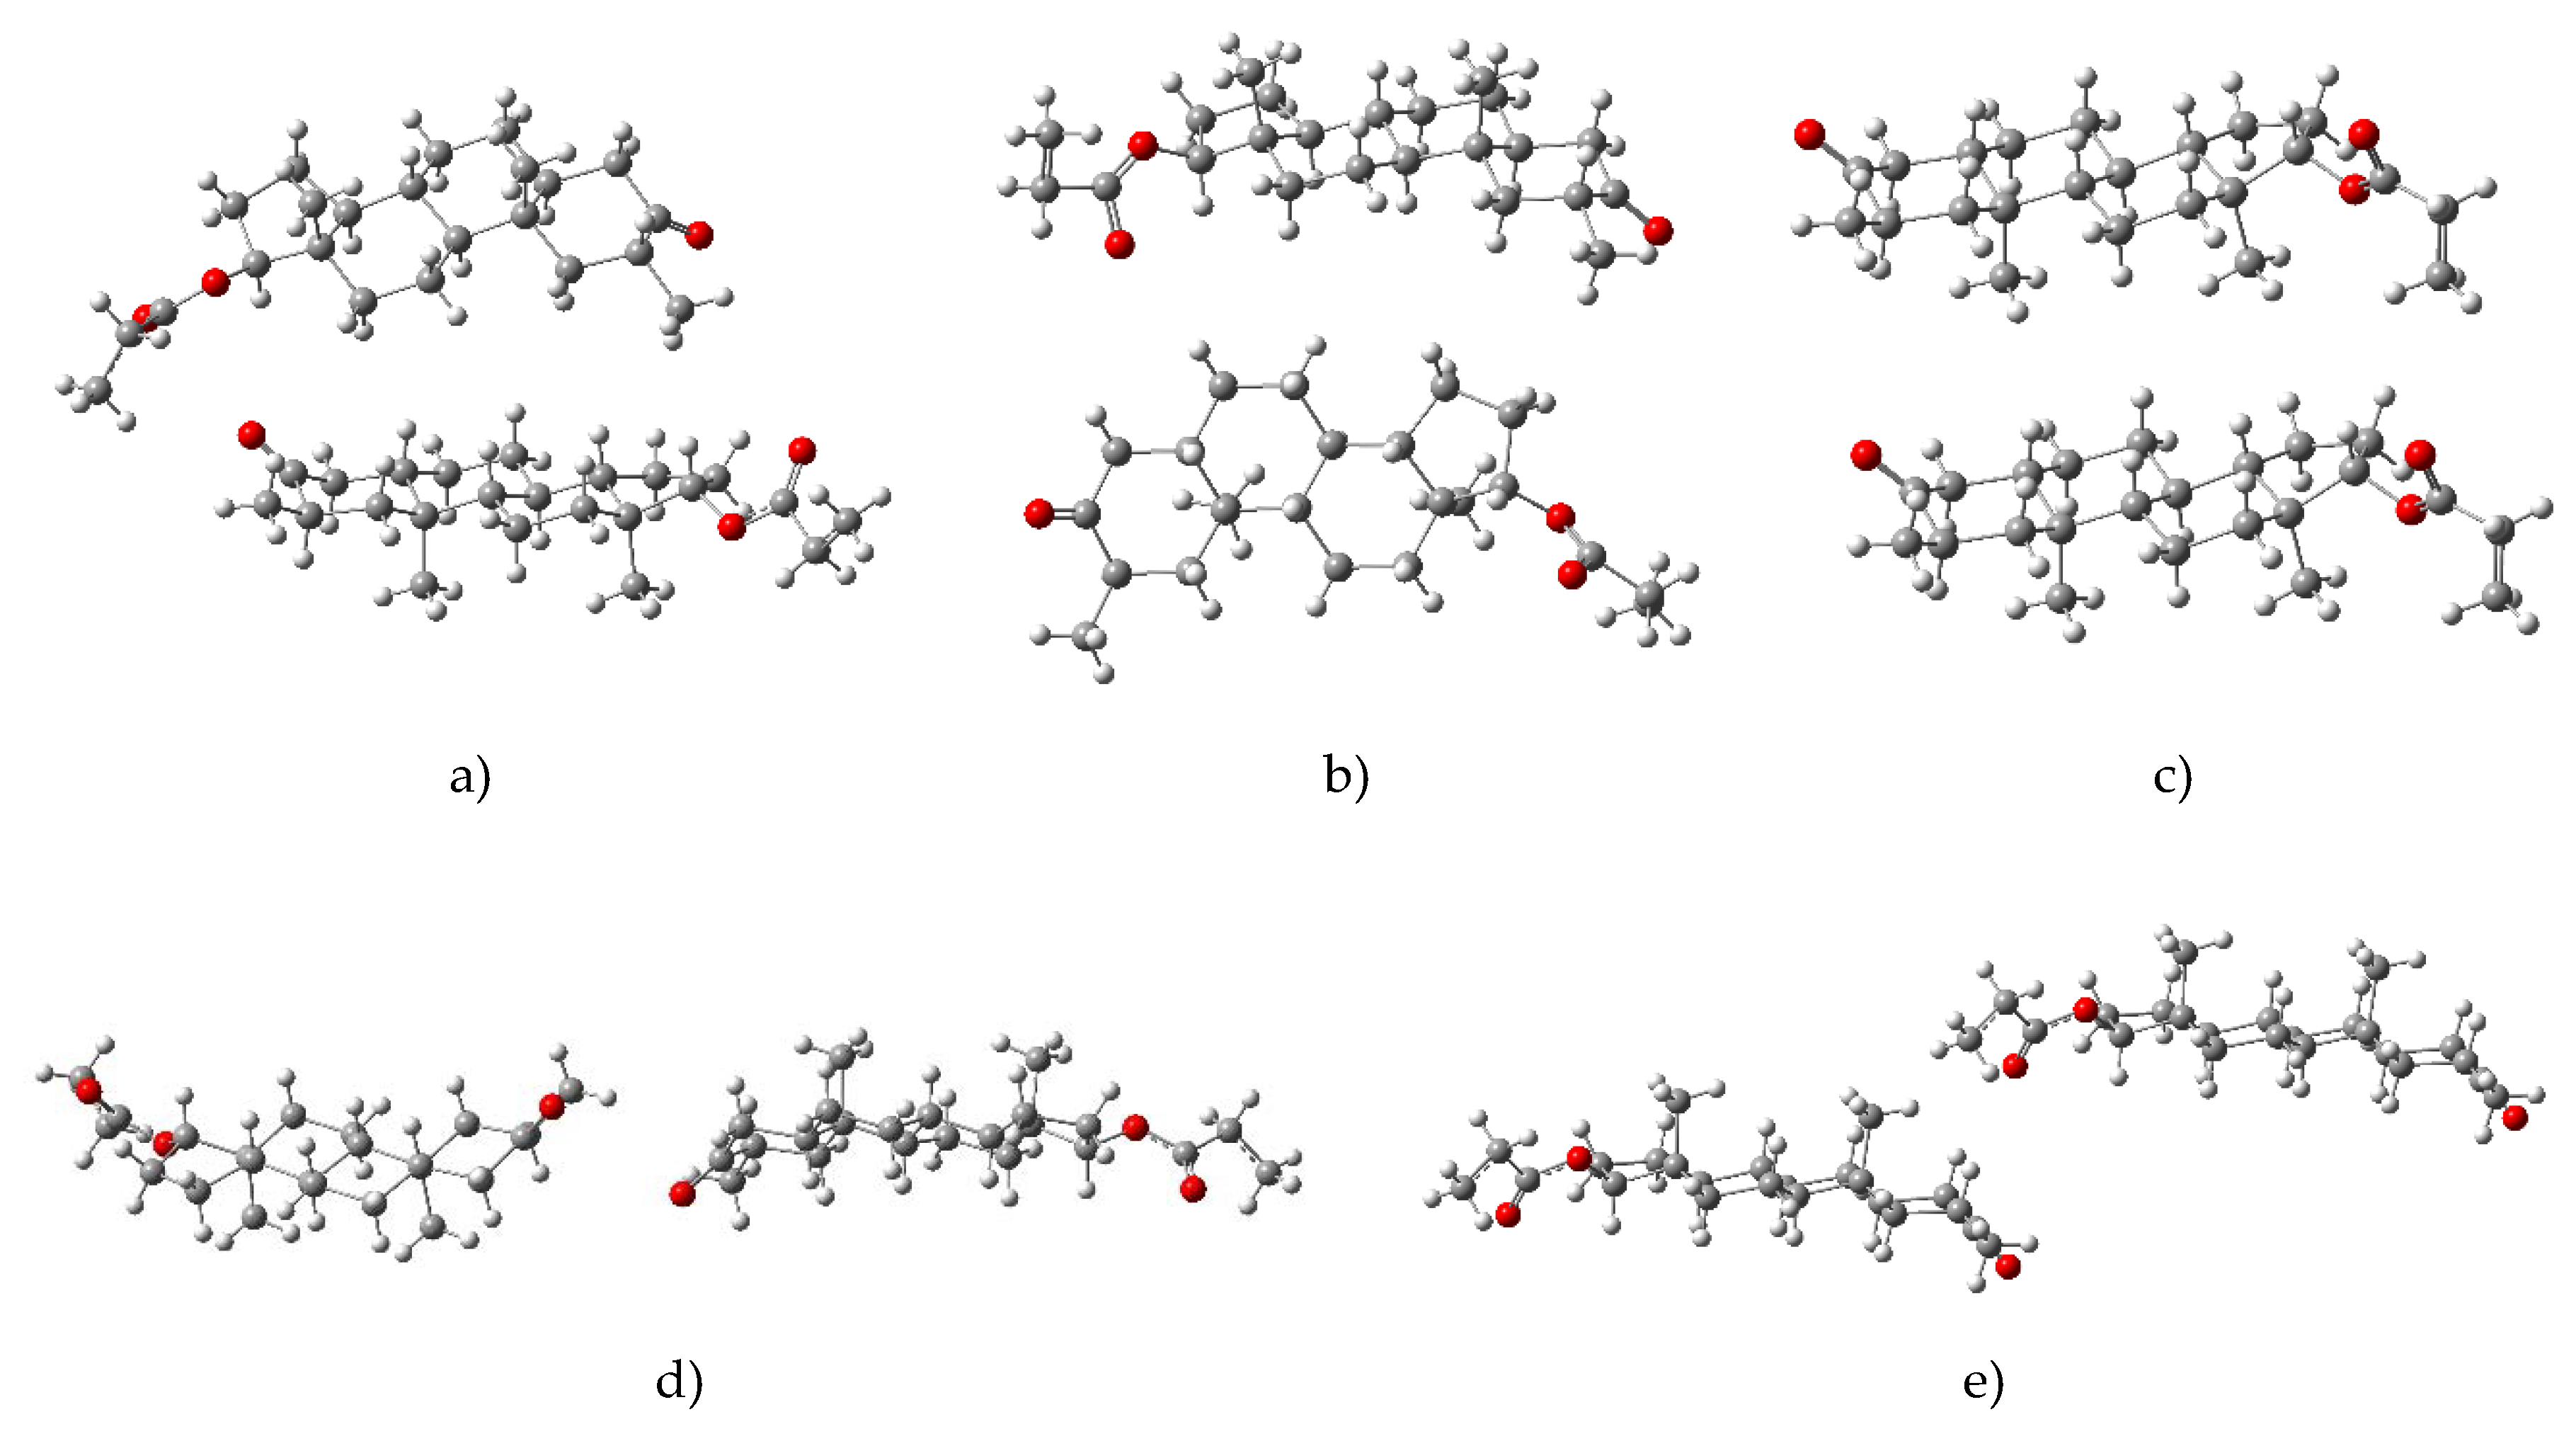
| Structure | Eelectr | Eexch | Eind | Edisp | EsSAPT0 | EDF-LMP2 |
|---|---|---|---|---|---|---|
| Dim a) | −3.50 | +18.25 | −4.07 | −39.45 | −28.77 | −21.67 |
| Dim b) | −5.36 | +7.68 | −2.82 | −19.97 | −20.47 | −15.37 |
| Dim c) | −3.48 | +11.79 | −2.24 | −30.06 | −24.00 | −18.08 |
| Dim d) | −6.22 | +3.54 | −1.08 | −7.24 | −10.98 | −8.25 |
| Dim e) | −11.06 | +8.39 | −2.96 | −12.94 | −18.47 | −14.13 |
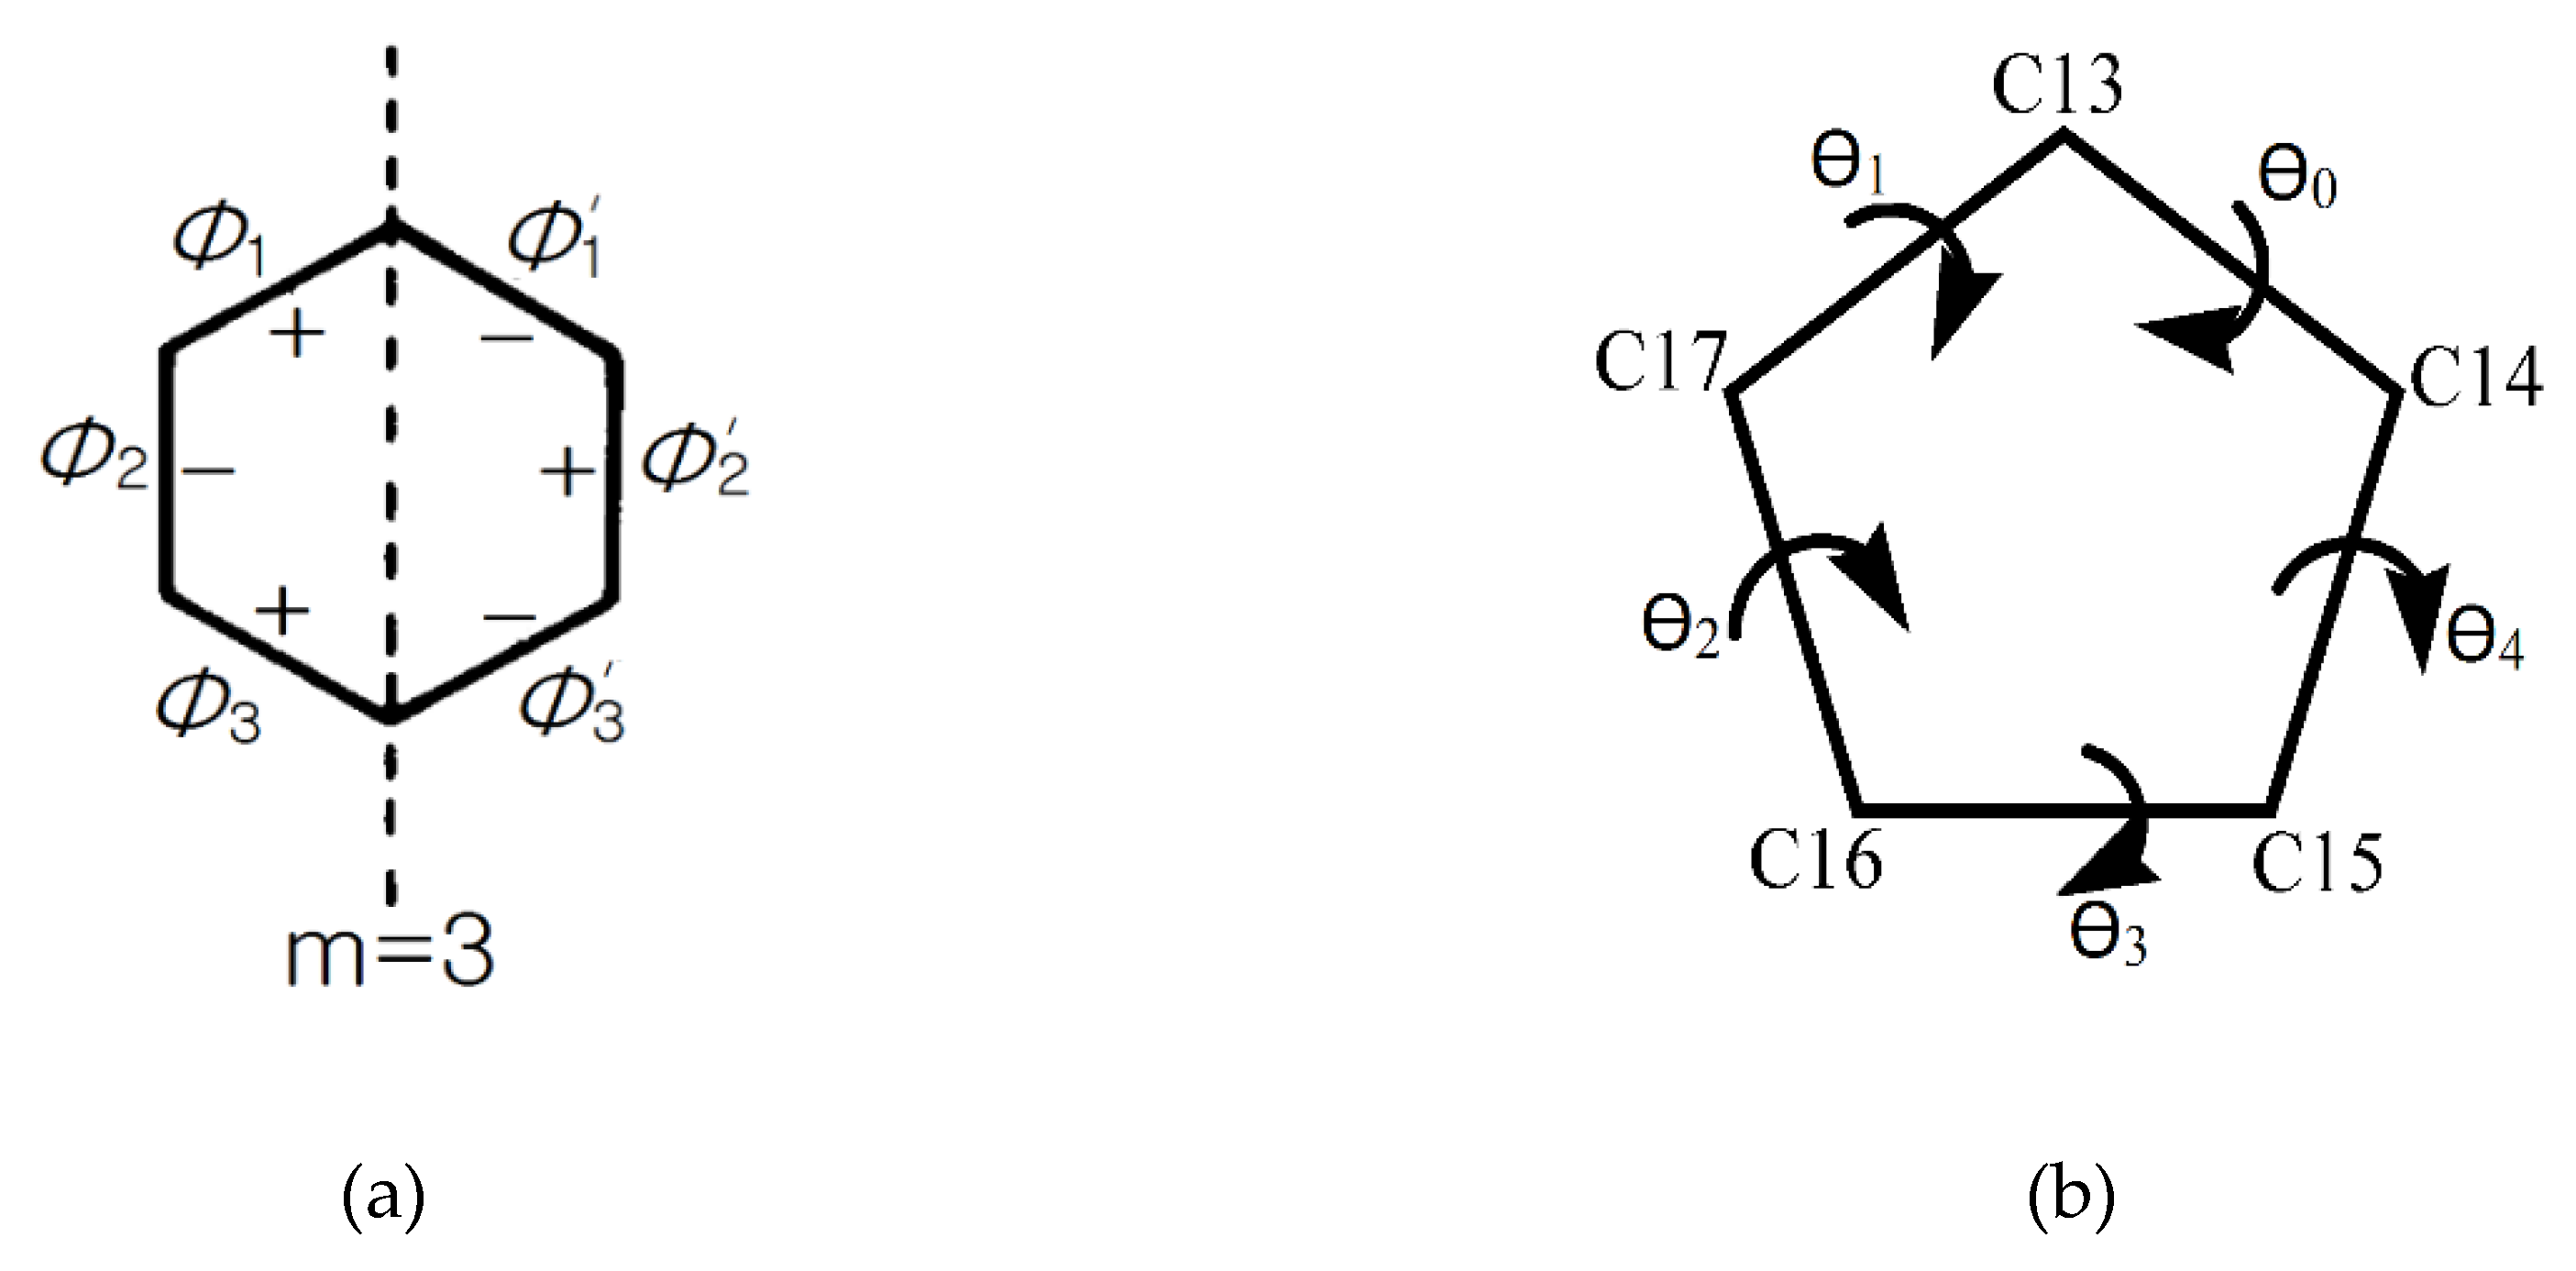
| Mirror Planes | Drost 1 | Drost 2 | Drost 3-Mol A | Drost 3-Mol B | |
|---|---|---|---|---|---|
| Ring A | ΔCs (C3–C10) | 1.22 | 2.72 | 0.69 | 2.43 |
| ΔCs (C4–C1) | 1.12 | 0.90 | 2.93 | 2.51 | |
| ΔCs (C5–C2) | 1.27 | 1.85 | 3.41 | 4.49 | |
| Average ΔCs | 1.20 | 1.82 | 2.34 | 3.14 | |
| Ring B | ΔCs (C5–C8) | 1.46 | 2.67 | 3.43 | 2.28 |
| ΔCs (C6–C9) | 4.50 | 3.37 | 0.30 | 4.33 | |
| ΔCs (C7–C10) | 3.73 | 0.75 | 3.14 | 6.13 | |
| Average ΔCs | 3.23 | 2.27 | 2.29 | 4.24 | |
| Ring C | ΔCs (C9–C13) | 3.49 | 2.00 | 2.26 | 2.35 |
| ΔCs (C8–C12) | 4.21 | 8.62 | 6.94 | 3.49 | |
| ΔCs (C14–C11) | 0.84 | 6.86 | 8.79 | 5.62 | |
| Average ΔCs | 2.85 | 5.83 | 5.99 | 3.82 |
| Structure | Drost 1 | Drost 2 | Drost 3 | |
|---|---|---|---|---|
| Mol. A | Mol. B | |||
| P | 7.23 | 11.19 | 10.7 | 6.95 |
| τm | 46.26 | 46.94 | 46.72 | 46.86 |
© 2020 by the authors. Licensee MDPI, Basel, Switzerland. This article is an open access article distributed under the terms and conditions of the Creative Commons Attribution (CC BY) license (http://creativecommons.org/licenses/by/4.0/).
Share and Cite
Borodi, G.; Turza, A.; Bende, A. Exploring the Polymorphism of Drostanolone Propionate. Molecules 2020, 25, 1436. https://doi.org/10.3390/molecules25061436
Borodi G, Turza A, Bende A. Exploring the Polymorphism of Drostanolone Propionate. Molecules. 2020; 25(6):1436. https://doi.org/10.3390/molecules25061436
Chicago/Turabian StyleBorodi, Gheorghe, Alexandru Turza, and Attila Bende. 2020. "Exploring the Polymorphism of Drostanolone Propionate" Molecules 25, no. 6: 1436. https://doi.org/10.3390/molecules25061436
APA StyleBorodi, G., Turza, A., & Bende, A. (2020). Exploring the Polymorphism of Drostanolone Propionate. Molecules, 25(6), 1436. https://doi.org/10.3390/molecules25061436