PETRA: Drug Engineering via Rigidity Analysis


Abstract
1. Introduction
2. Related Work
Rigidity Distance
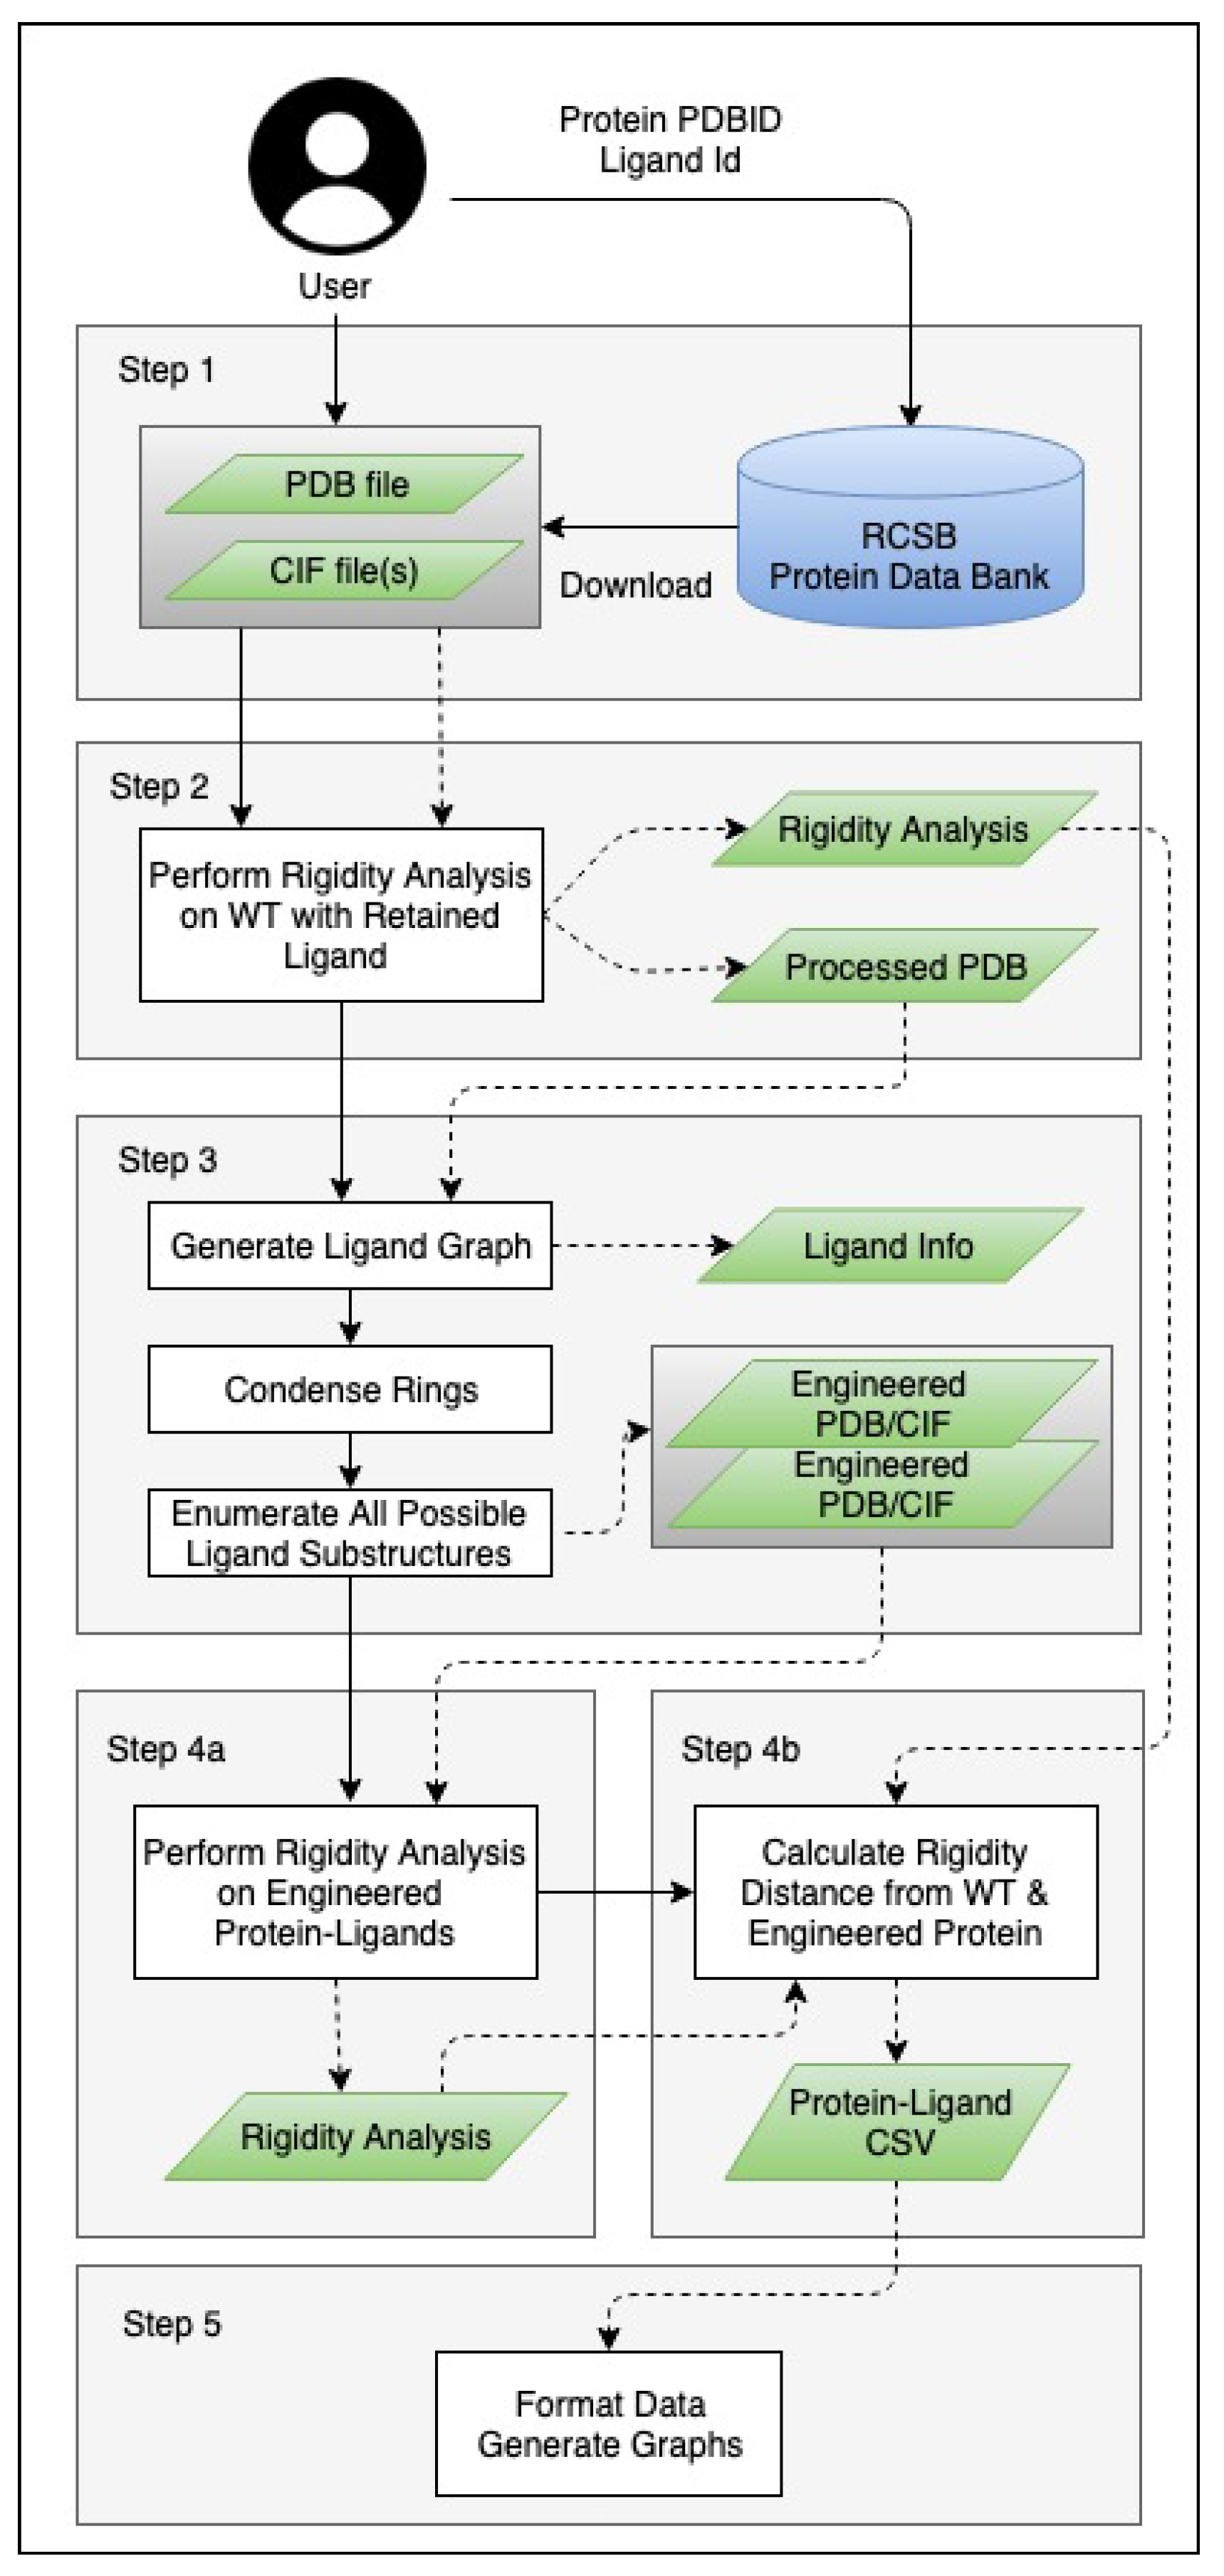
3. Methods
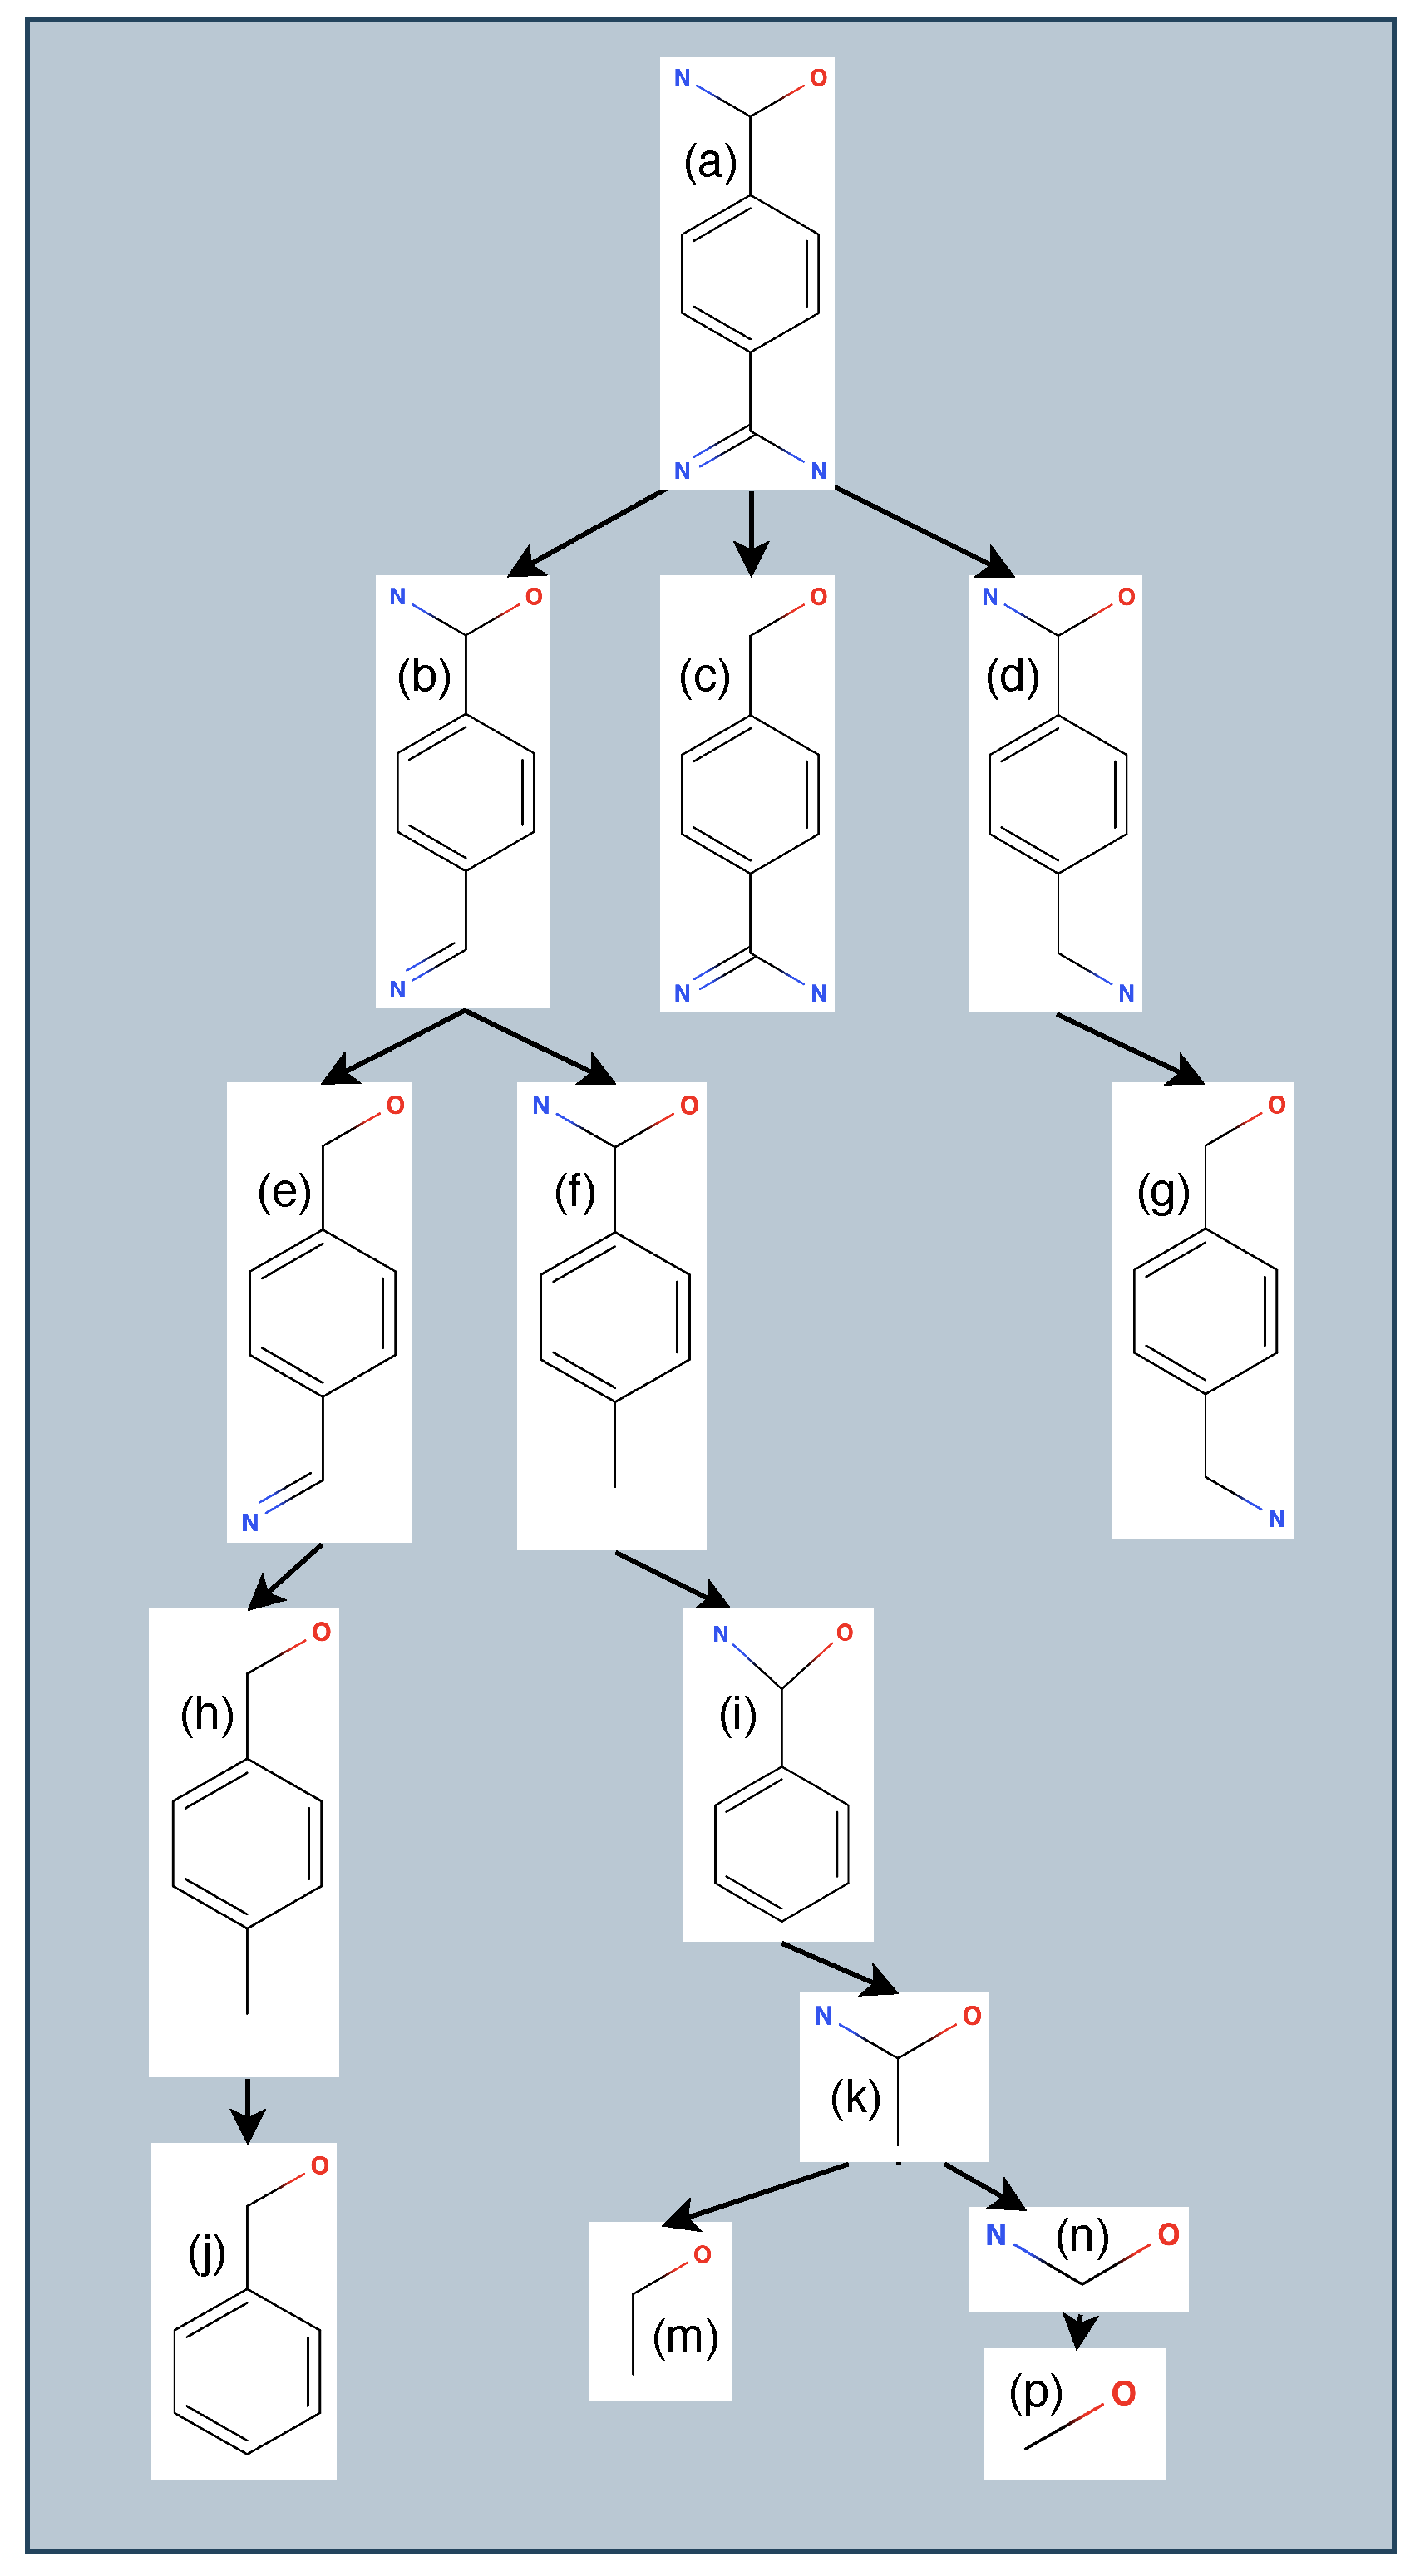
3.1. Generating Ligand Variants
3.2. Analysis and Visualizations
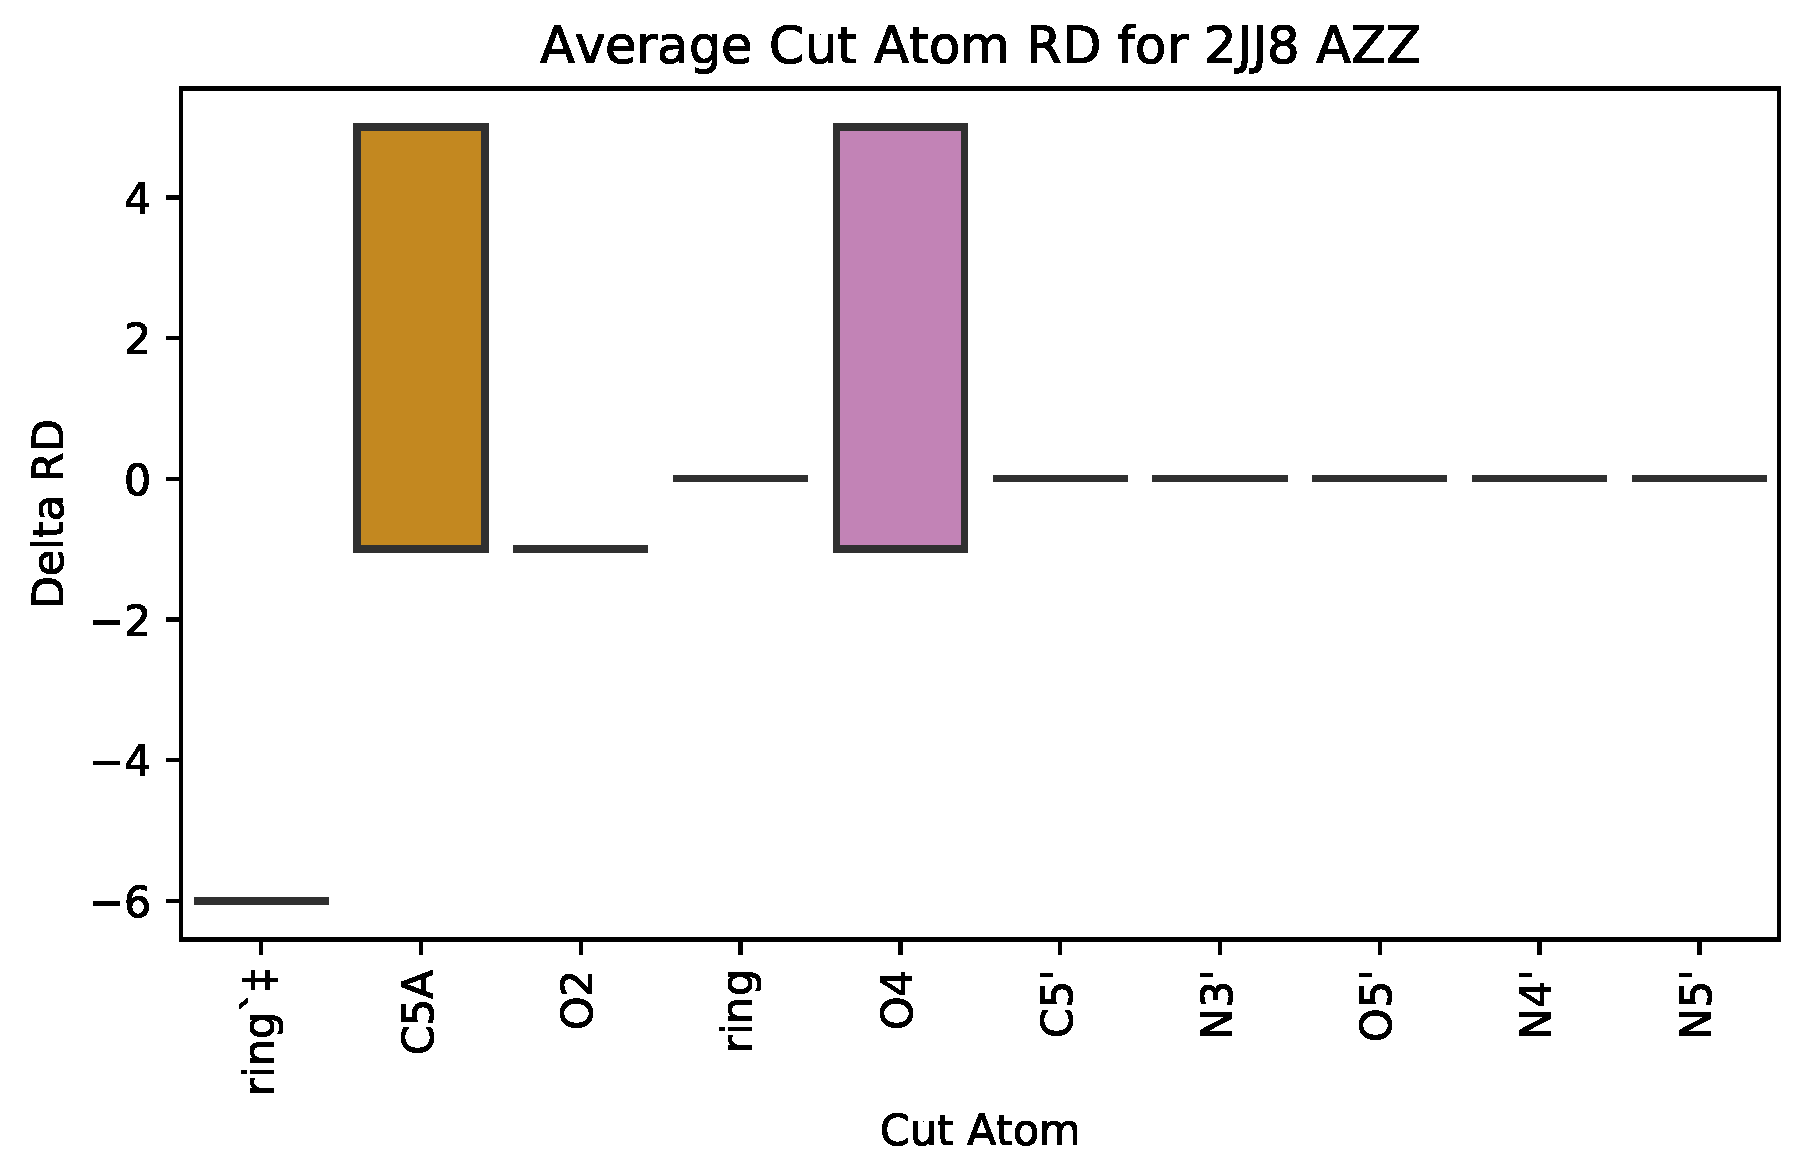
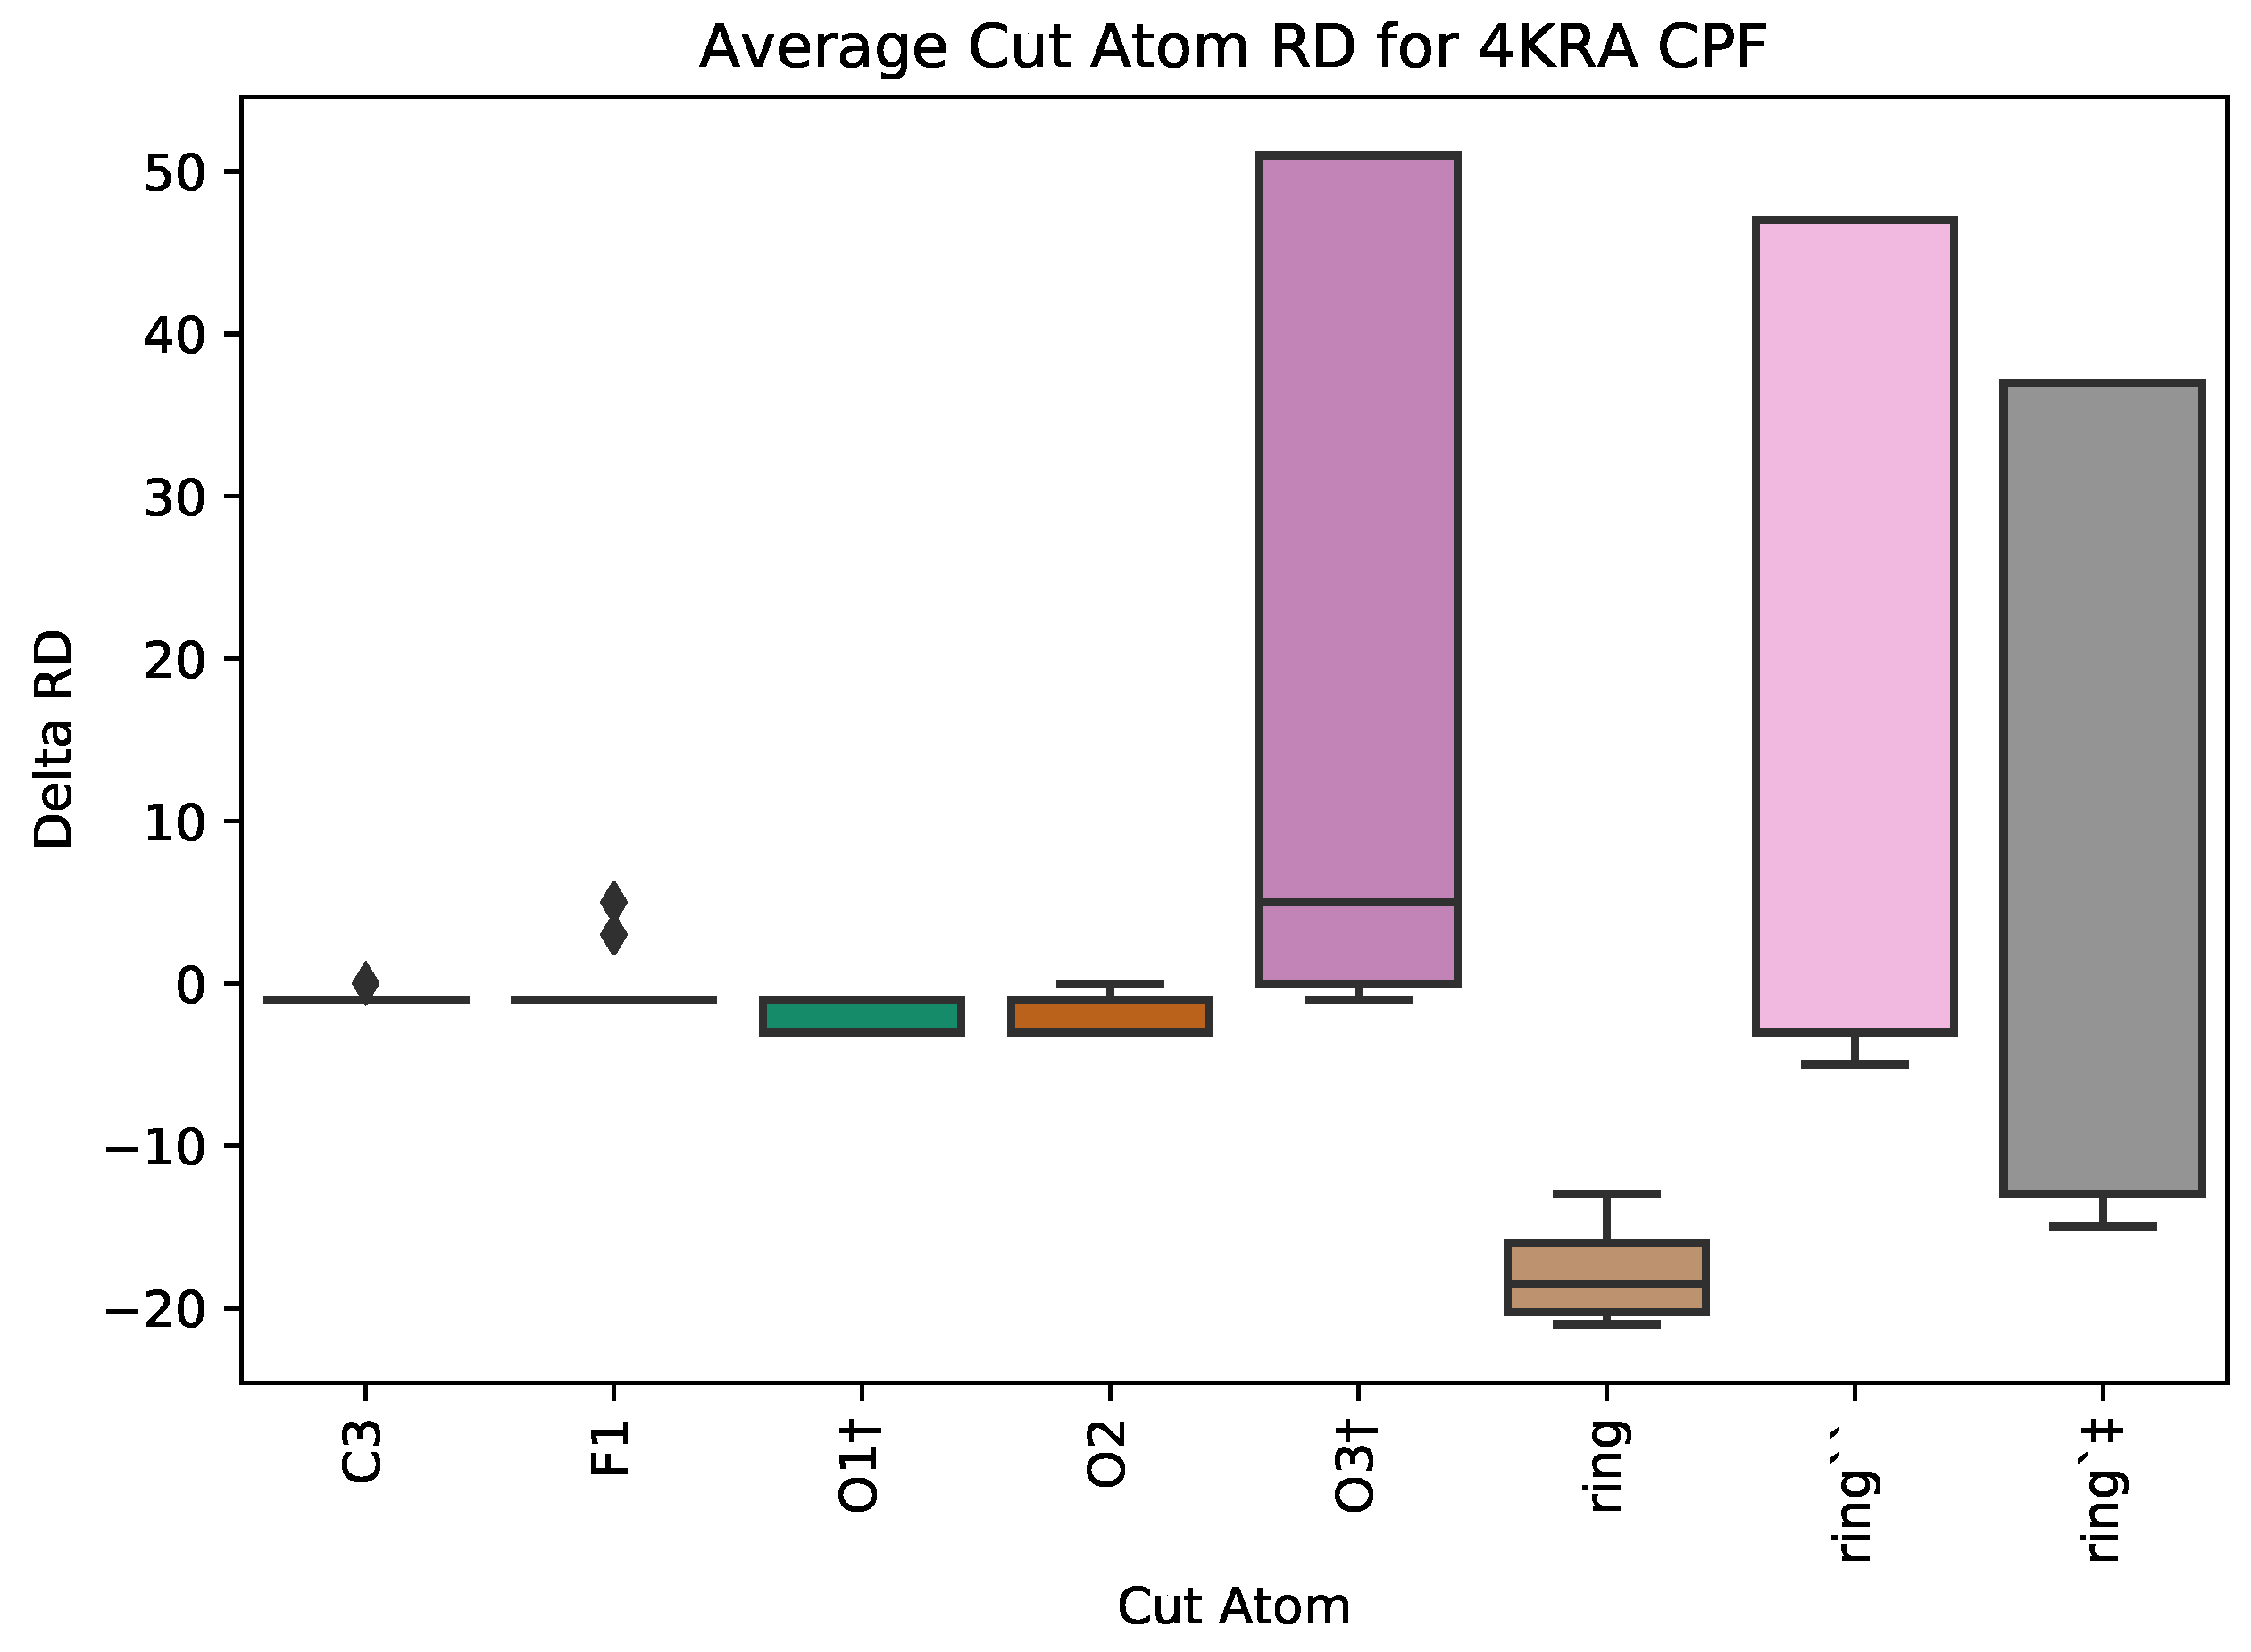
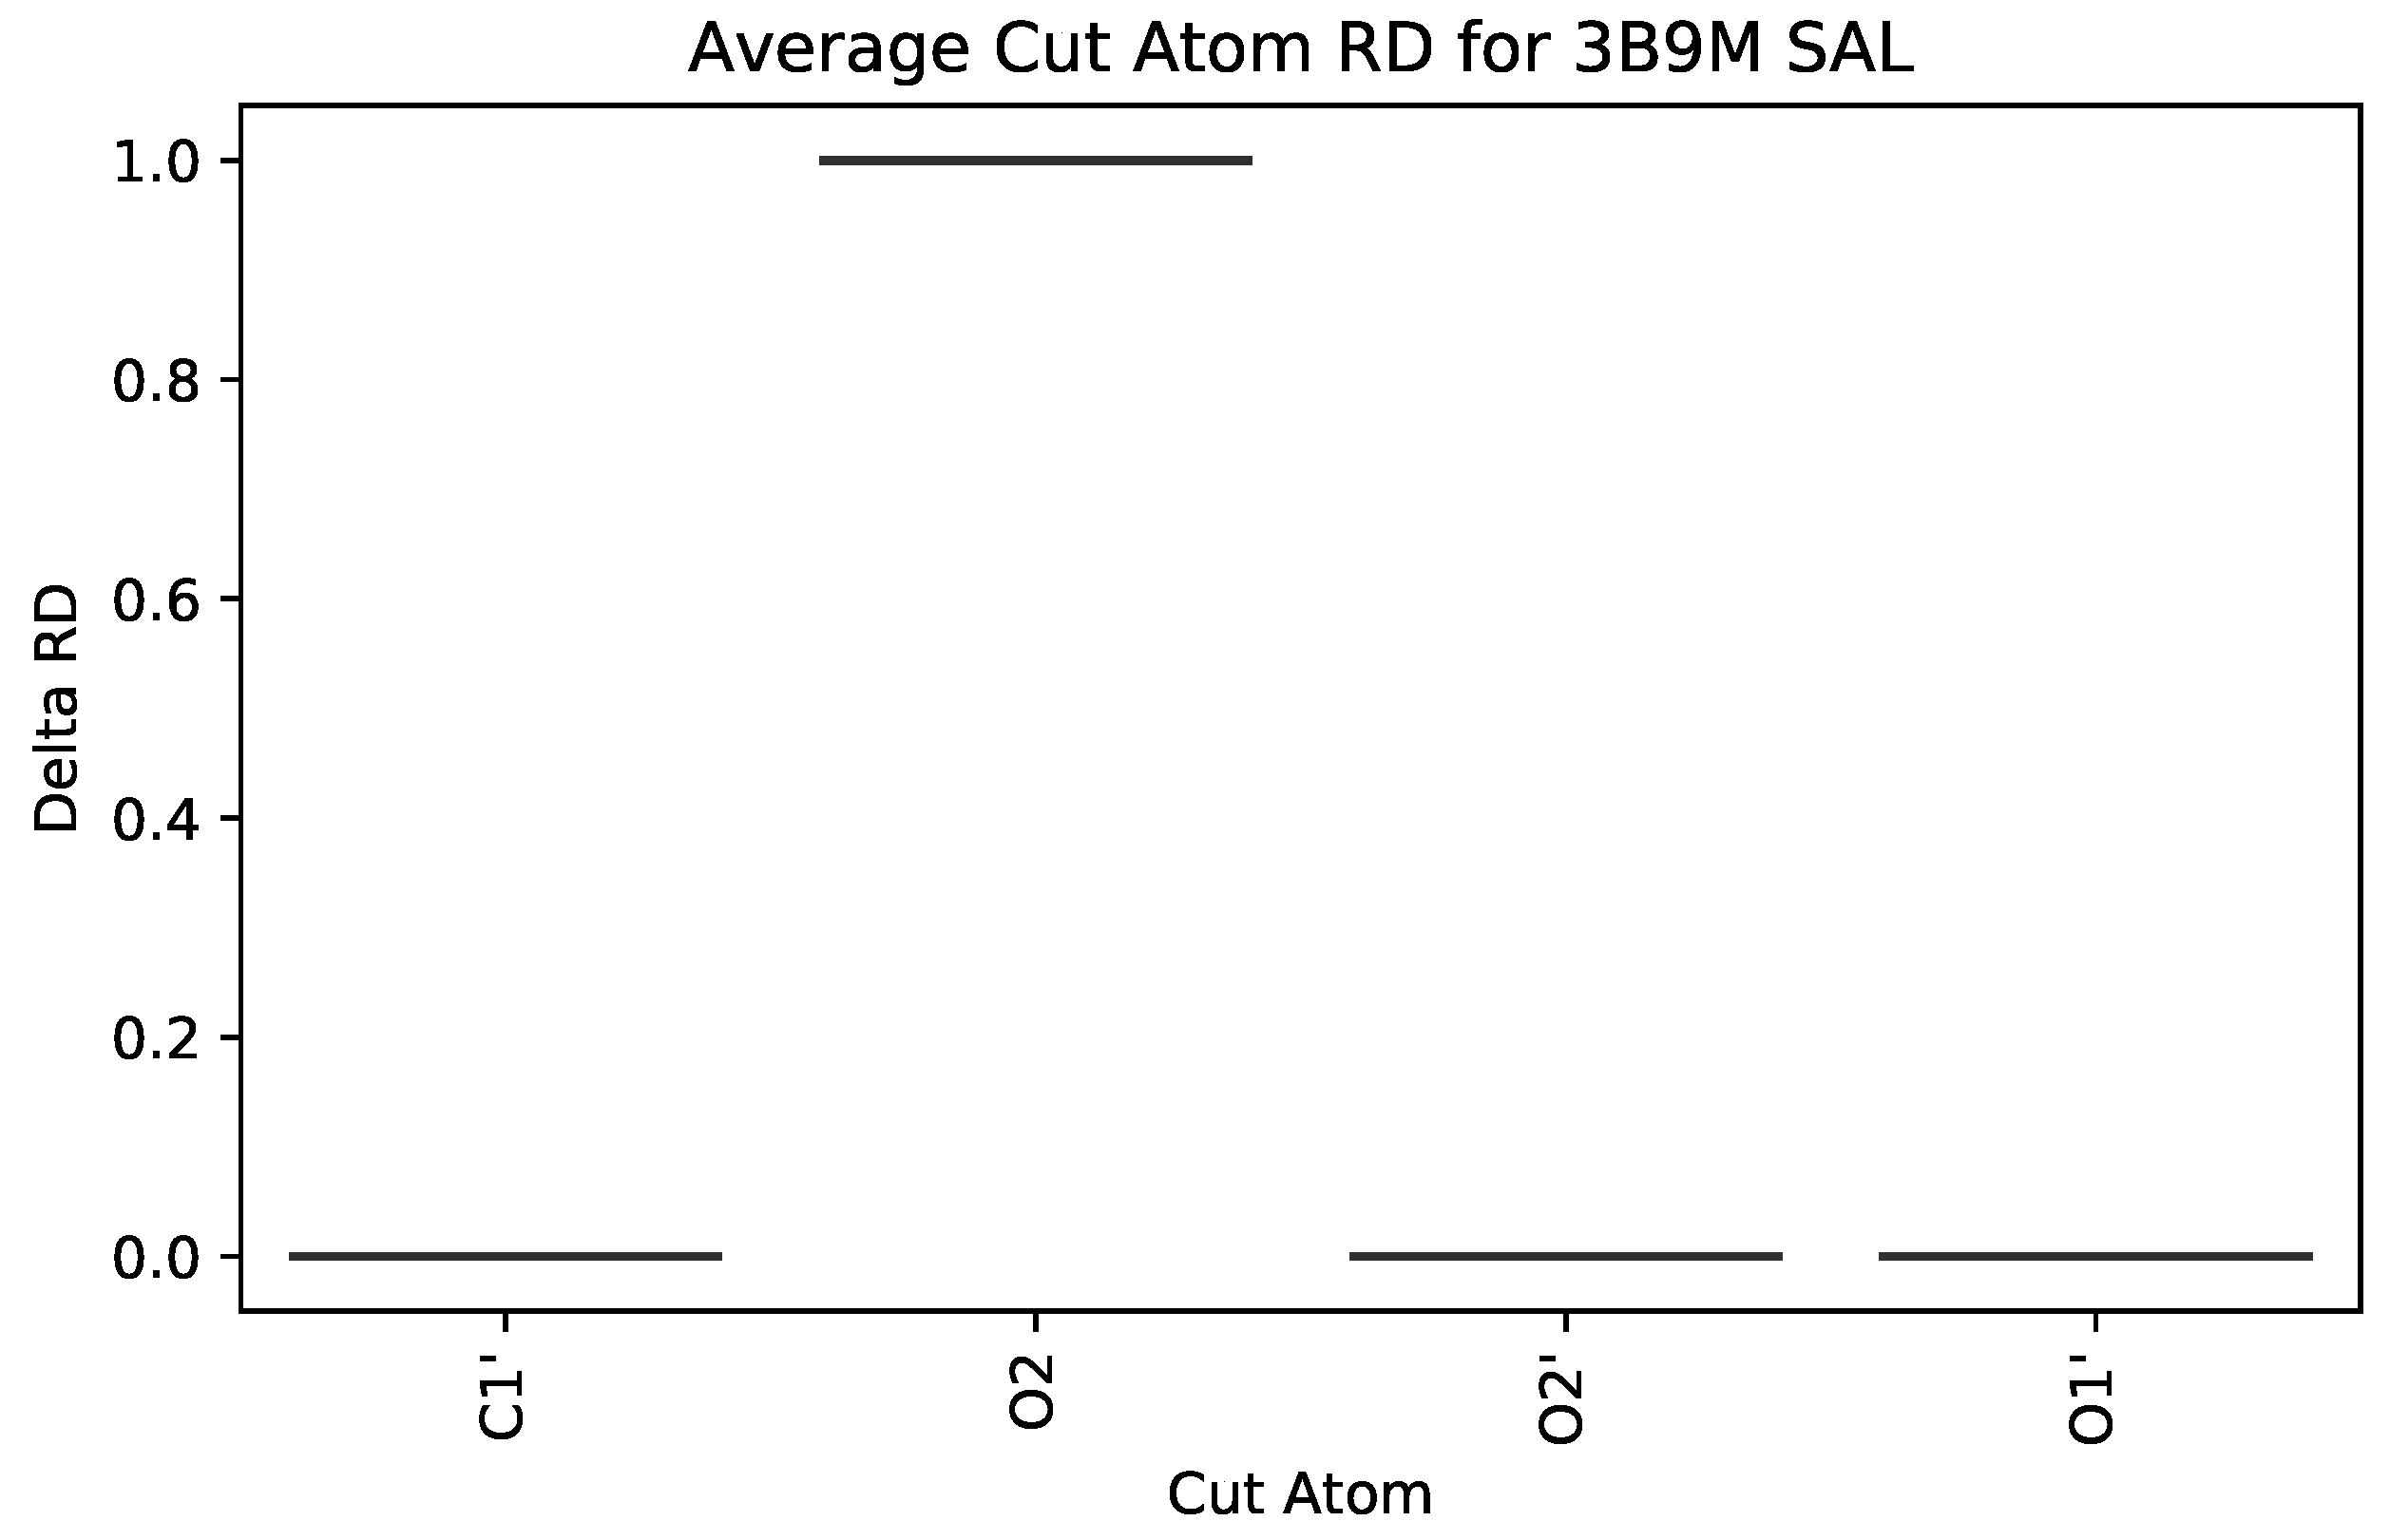
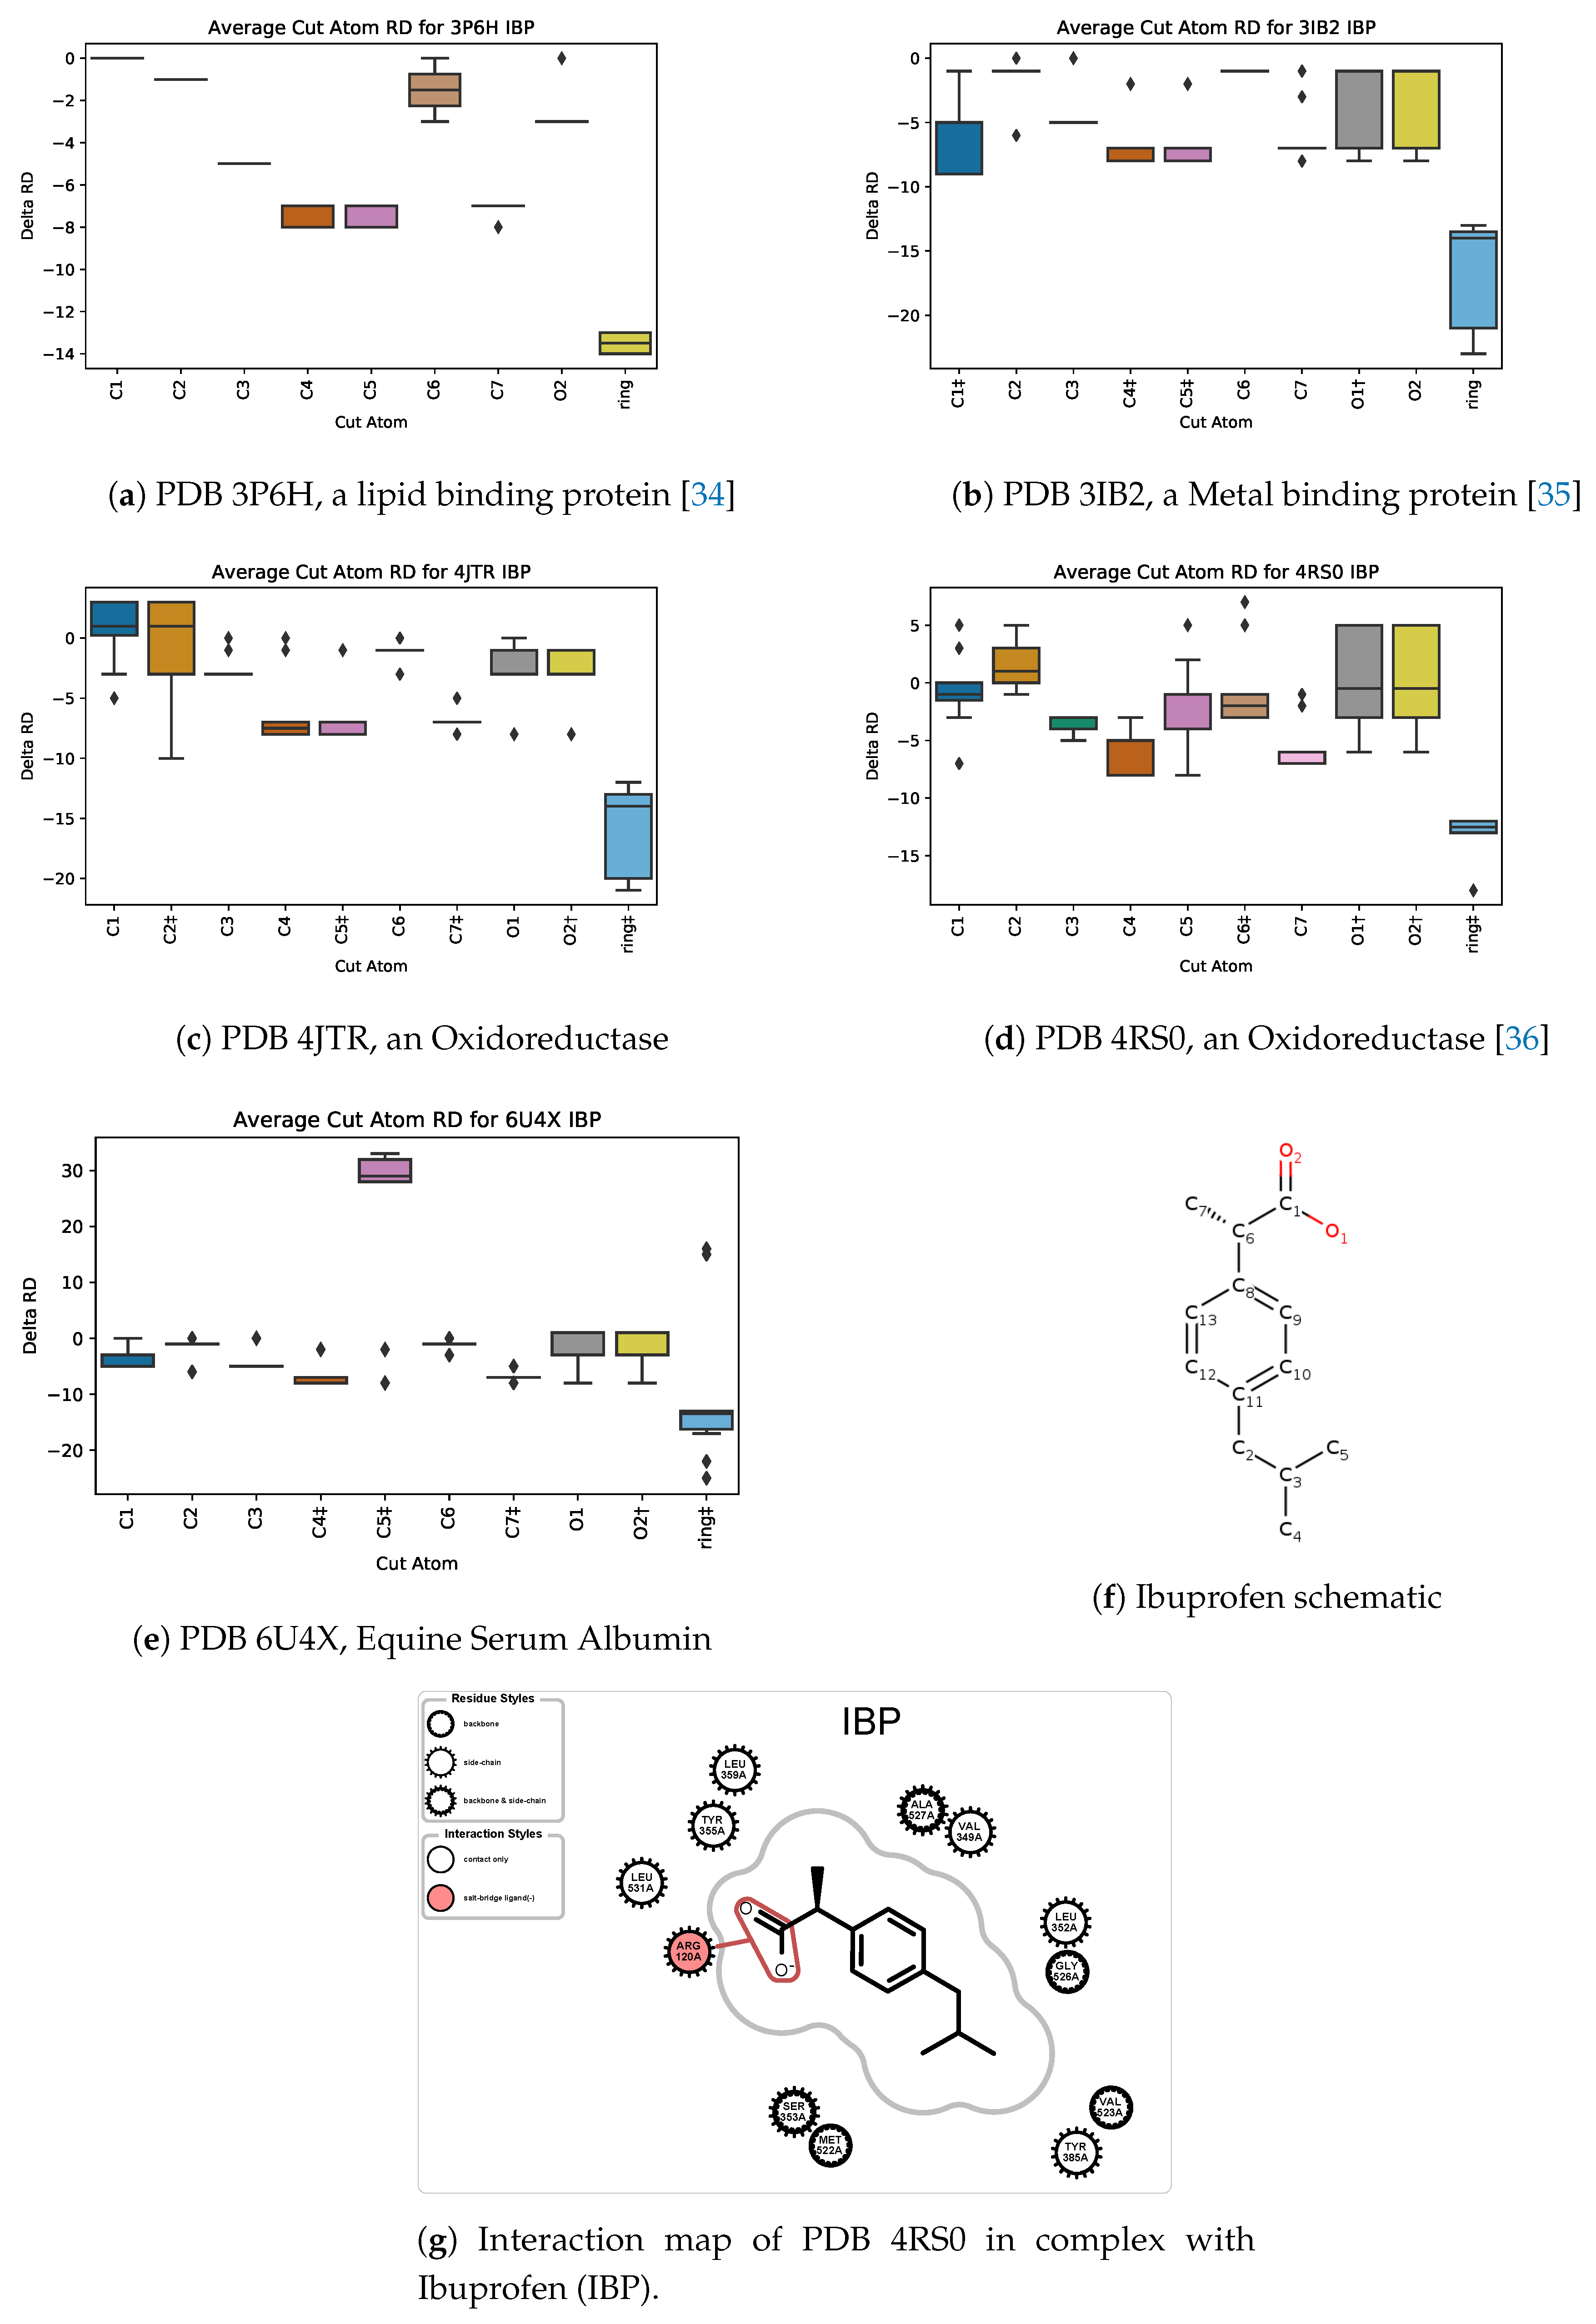
3.2.1. : the Role of Single Atoms
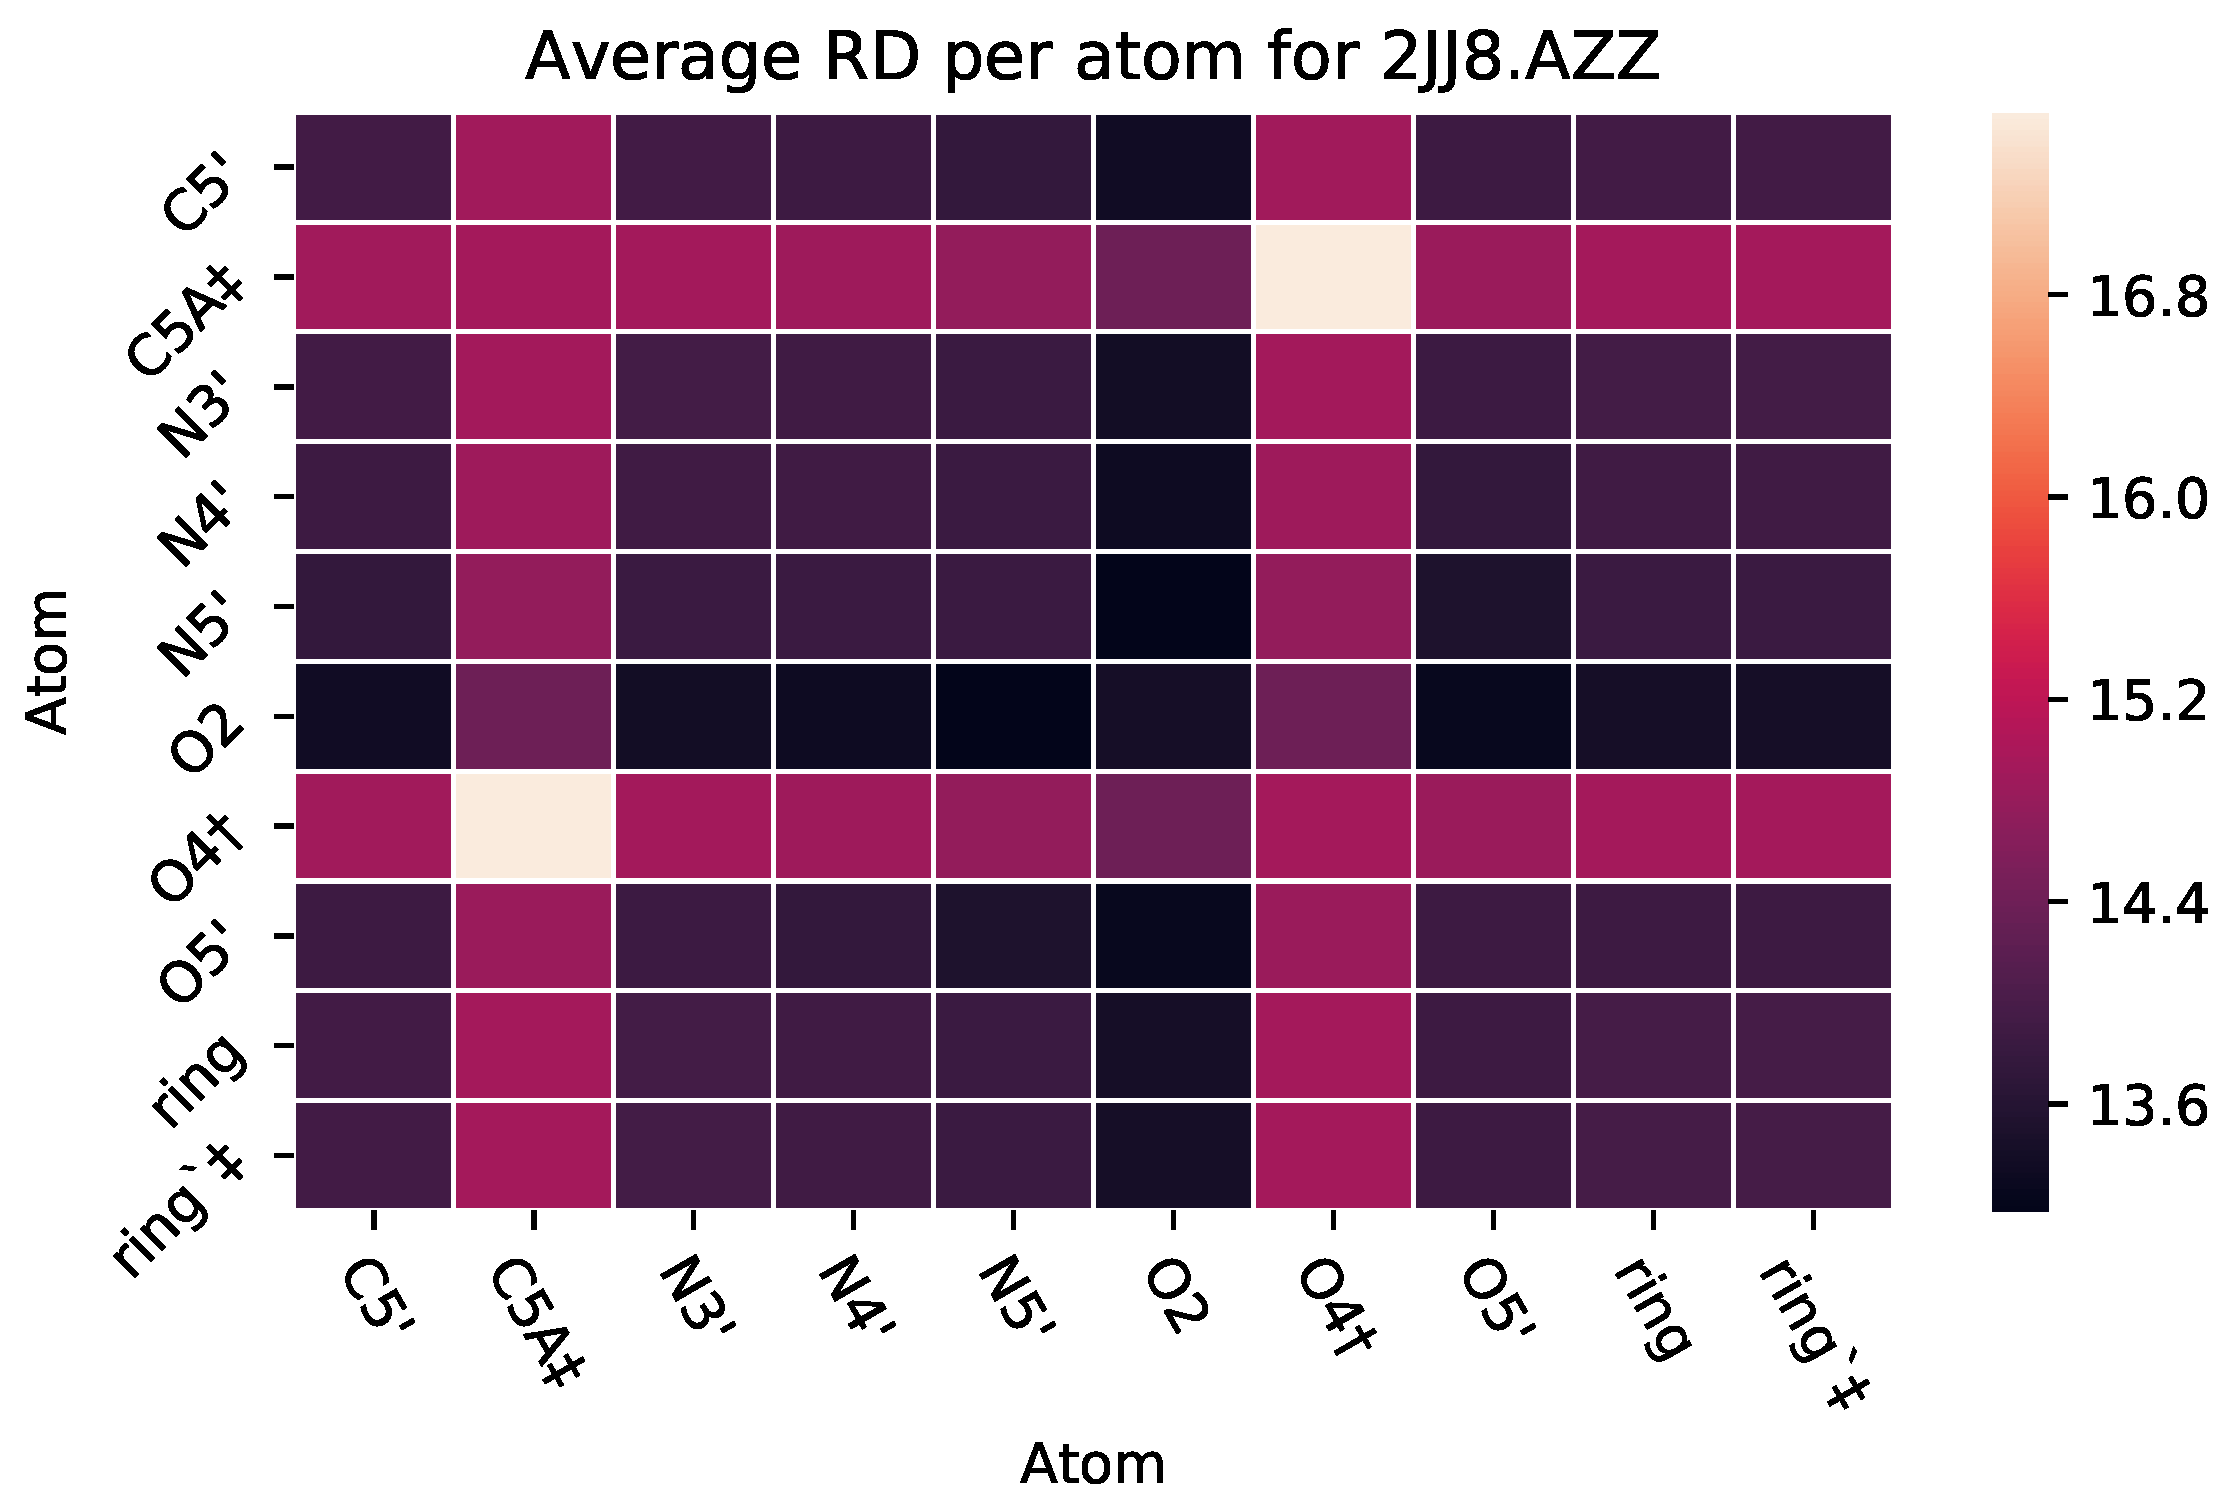
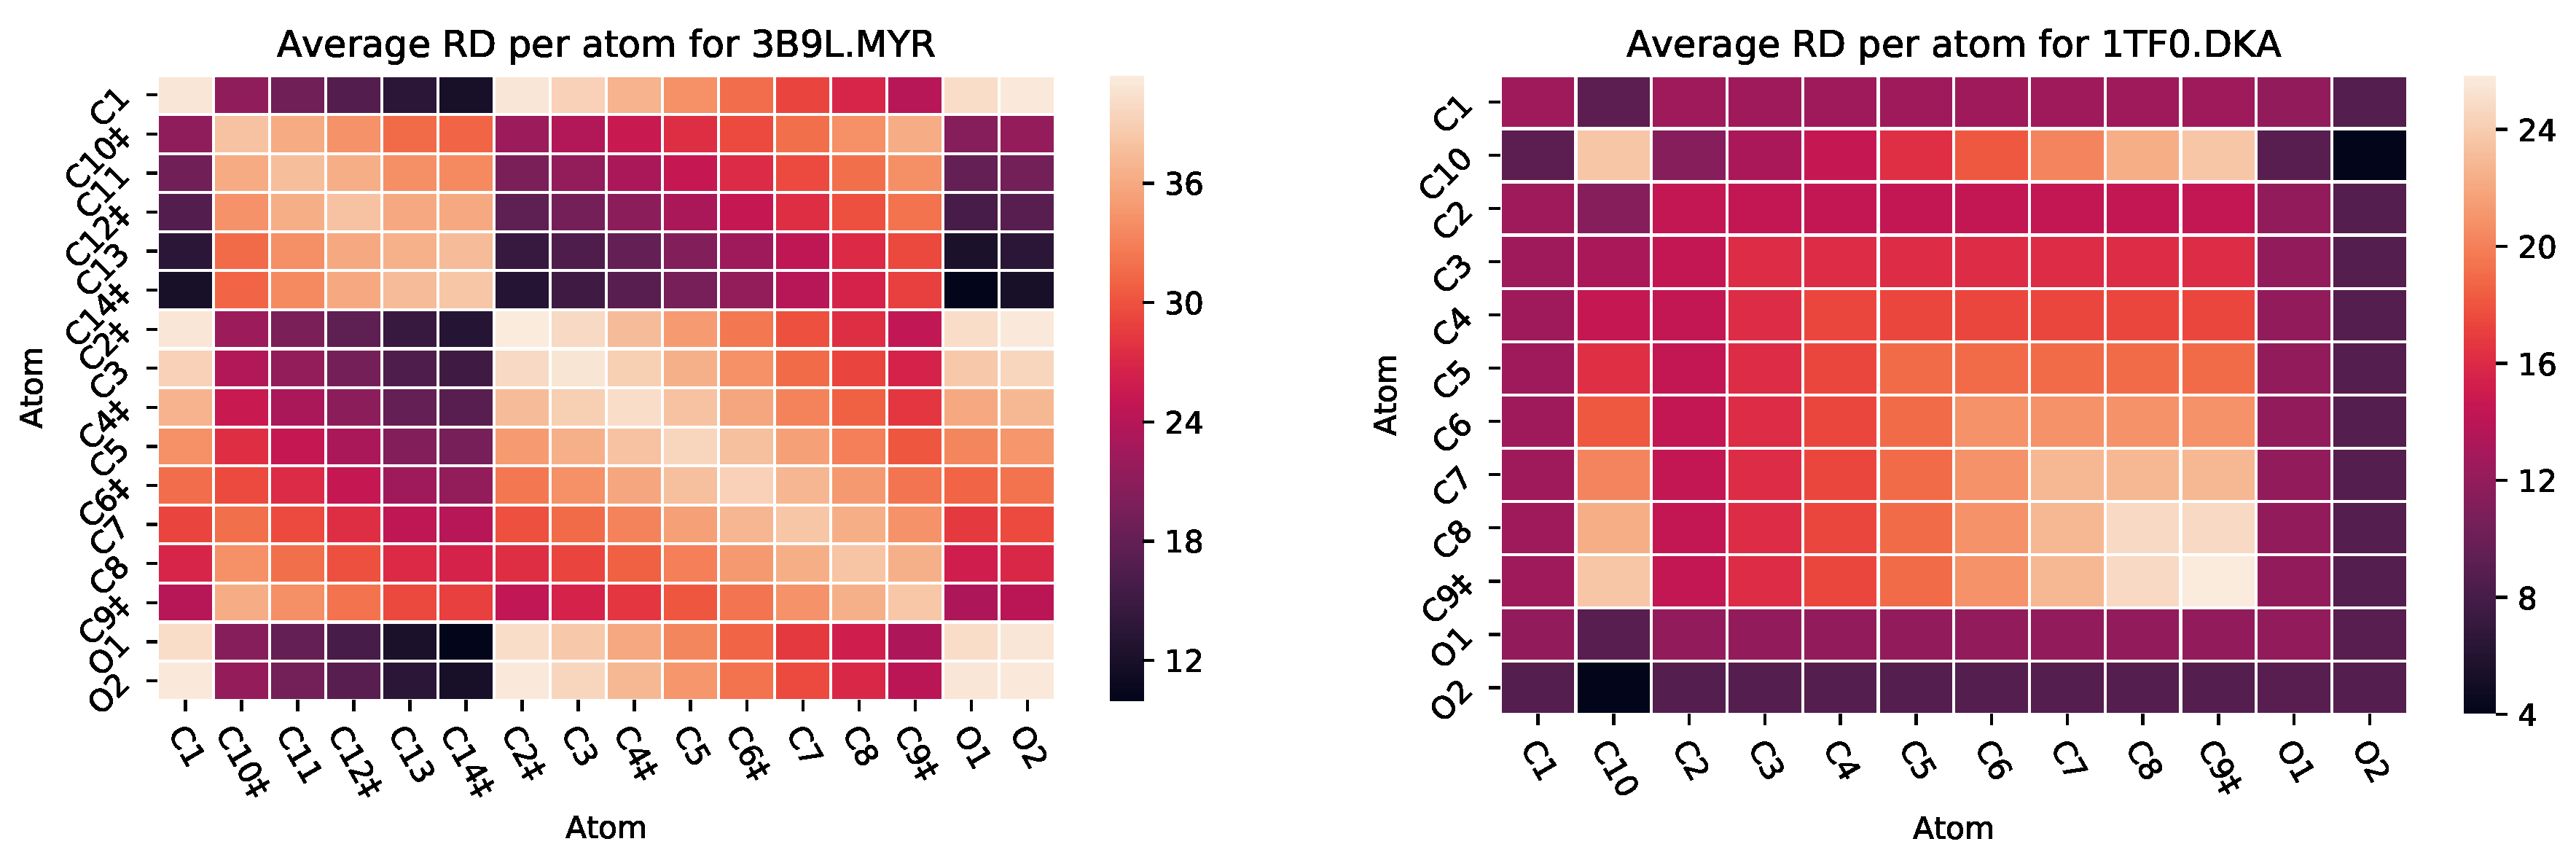
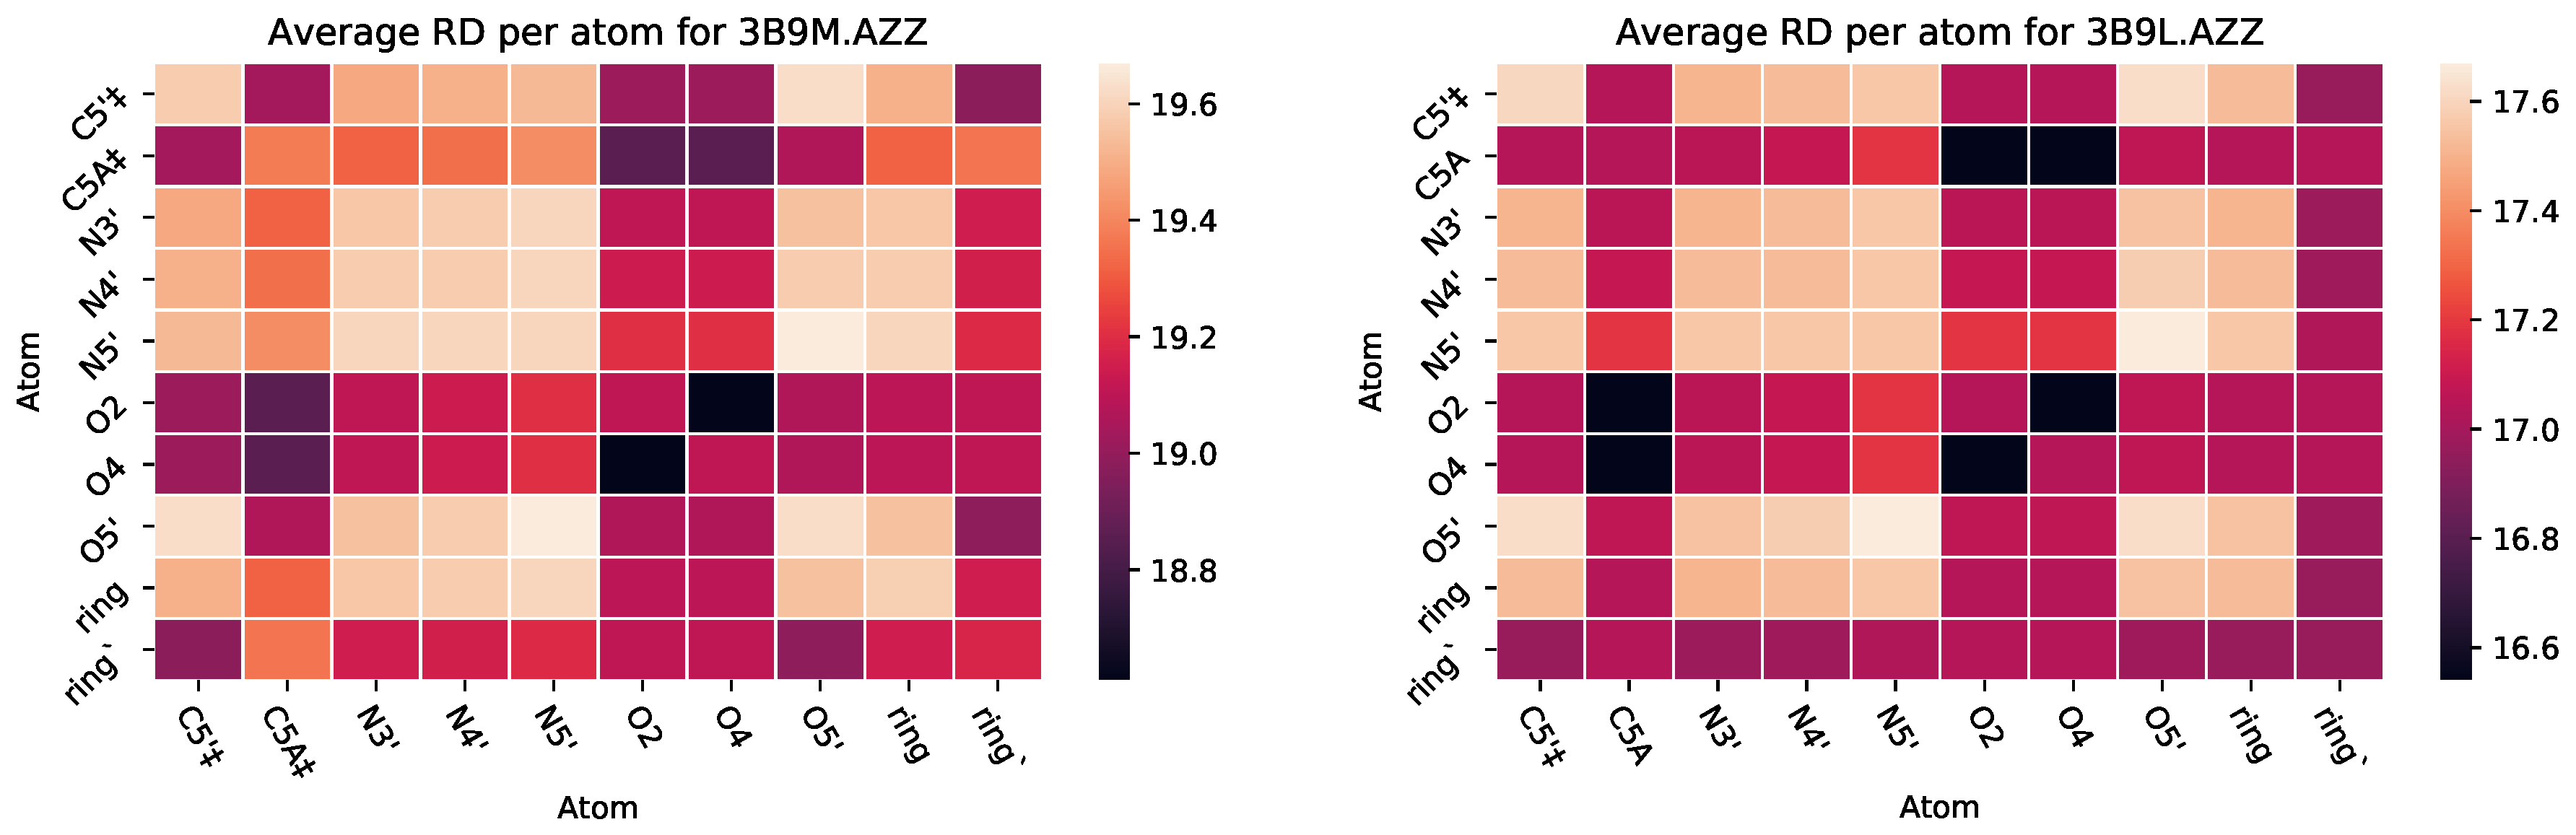
3.2.2. : The Role of Pairs of Atoms
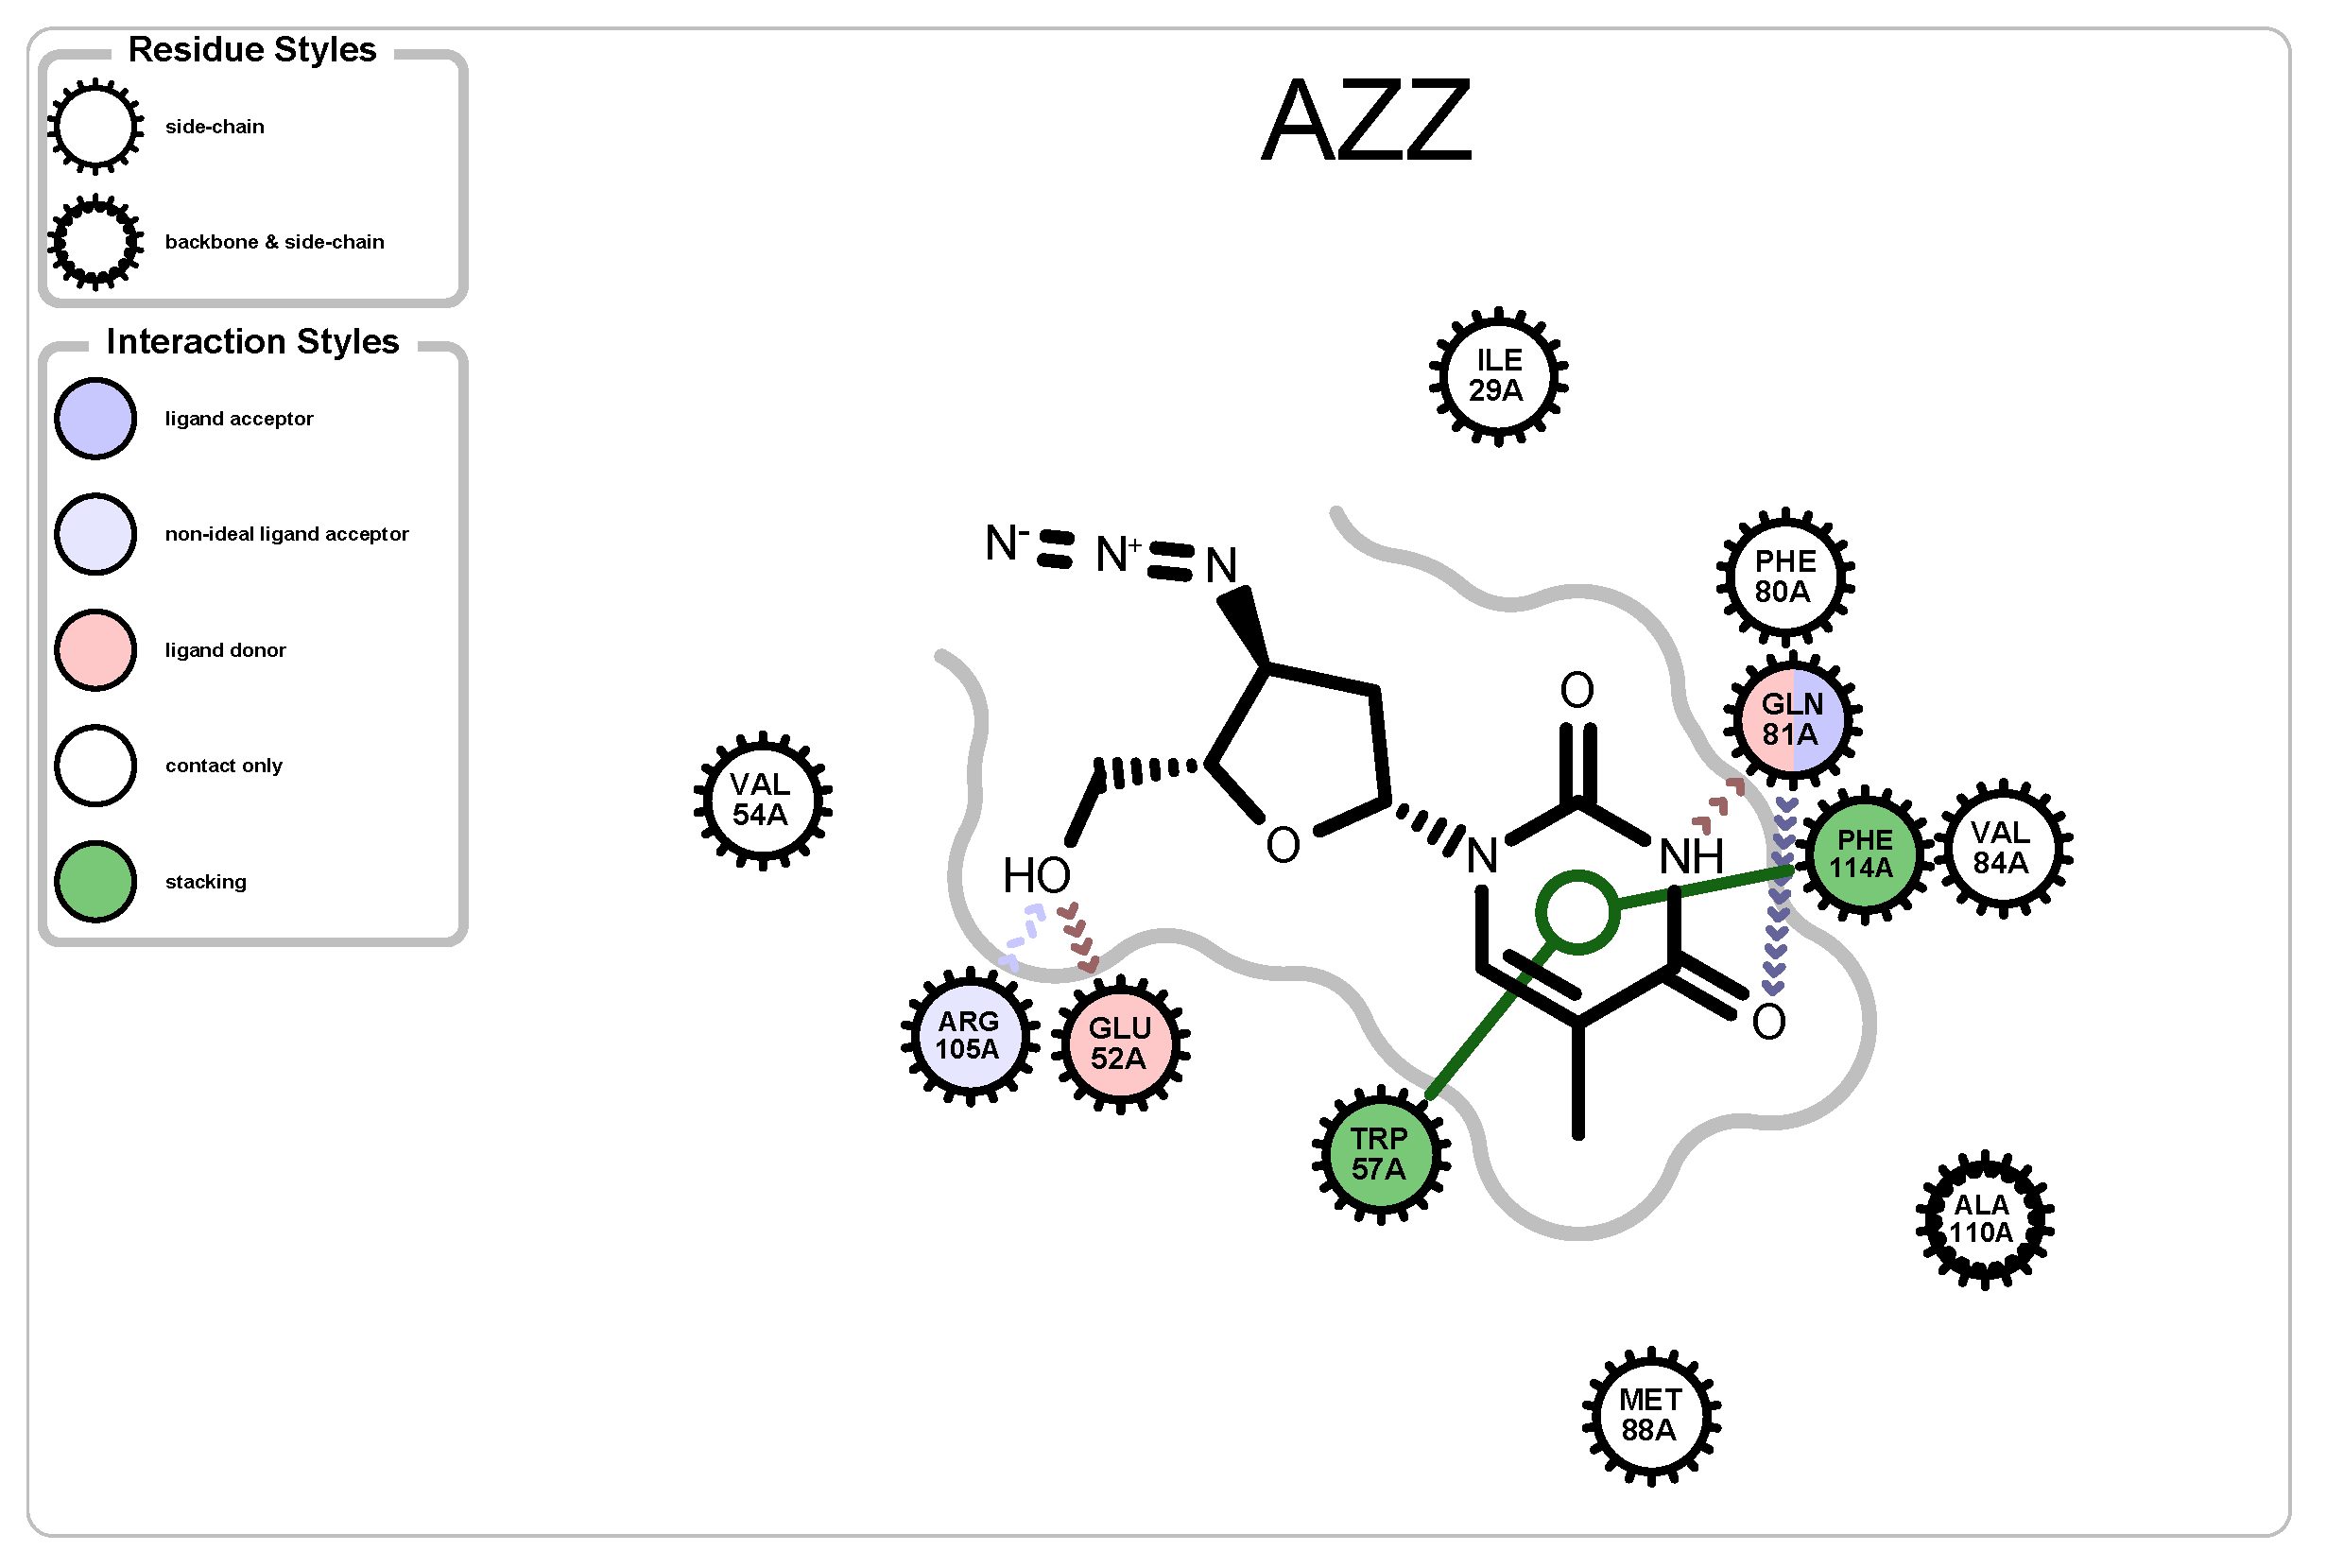
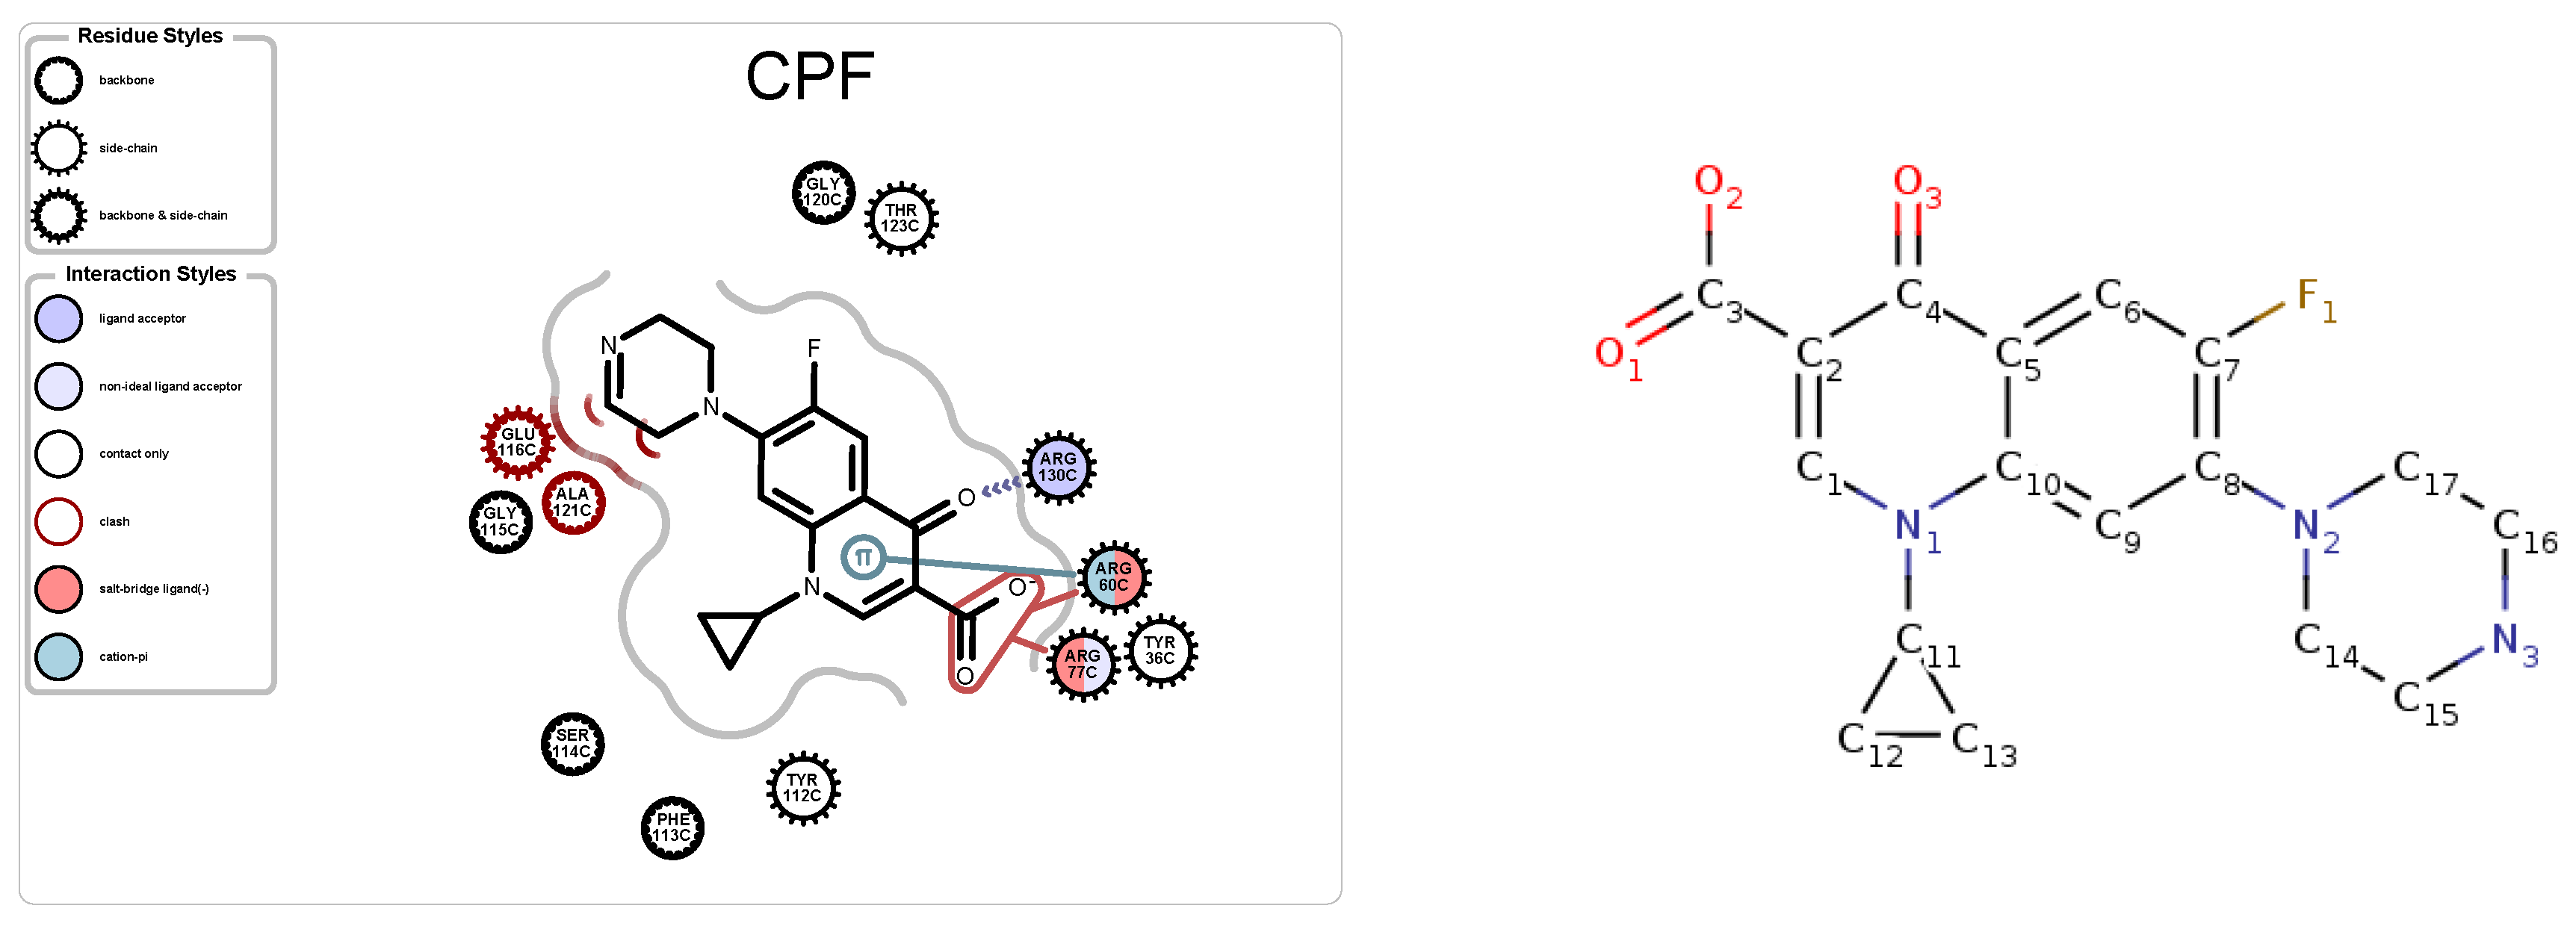
3.2.3. Protein-Ligand Interactions
4. Data Set, Run-Times
5. Case Studies and Discussion
5.1. Case Study 1: Ciprofloxacin
5.2. Case Study 2: Human Serum Albumin
5.3. Case Study 3: Ibuprofen
5.4. Case Study 4: Ibuprofen Variants
6. Conclusions and Future Work
Author Contributions
Funding
Conflicts of Interest
References
- Szymański, P.; Markowicz, M.; Mikiciuk-Olasik, E. Adaptation of high-throughput screening in drug discovery—Toxicological screening tests. Int. J. Mol. Sci. 2012, 13, 427–452. [Google Scholar] [CrossRef] [PubMed]
- Araya, C.L.; Fowler, D.M. Deep mutational scanning: Assessing protein function on a massive scale. Trends Biotechnol. 2011, 29, 435–442. [Google Scholar] [CrossRef] [PubMed]
- Engh, R.A.; Brandstetter, H.; Sucher, G.; Eichinger, A.; Baumann, U.; Bode, W.; Huber, R.; Poll, T.; Rudolph, R.; von der Saal, W. Enzyme flexibility, solvent and ‘weak’interactions characterize thrombin–ligand interactions: Implications for drug design. Structure 1996, 4, 1353–1362. [Google Scholar] [CrossRef]
- Tinberg, C.E.; Khare, S.D.; Dou, J.; Doyle, L.; Nelson, J.W.; Schena, A.; Jankowski, W.; Kalodimos, C.G.; Johnsson, K.; Stoddard, B.L.; et al. Computational design of ligand-binding proteins with high affinity and selectivity. Nature 2013, 501, 212. [Google Scholar] [CrossRef]
- Barbas, C.F.; Languino, L.R.; Smith, J.W. High-affinity self-reactive human antibodies by design and selection: targeting the integrin ligand binding site. Proc. Natl. Acad. Sci. USA 1993, 90, 10003–10007. [Google Scholar] [CrossRef]
- Karki, R.G.; Tang, Y.; Burke, T.R.; Nicklaus, M.C. Model of full-length HIV-1 integrase complexed with viral DNA as template for anti-HIV drug design. J. Comput. Mol. Des. 2004, 18, 739–760. [Google Scholar] [CrossRef]
- Patny, A.; Desai, P.V.; Avery, M.A. Homology modeling of G-protein-coupled receptors and implications in drug design. Curr. Med. Chem. 2006, 13, 1667–1691. [Google Scholar] [CrossRef]
- Hung, C.L.; Chen, C.C. Computational approaches for drug discovery. Drug Dev. Res. 2014, 75, 412–418. [Google Scholar] [CrossRef]
- Douguet, D.; Munier-Lehmann, H.; Labesse, G.; Pochet, S. LEA3D: A computer-aided ligand design for structure-based drug design. J. Med. Chem. 2005, 48, 2457–2468. [Google Scholar] [CrossRef]
- Laskowski, R.A.; Swindells, M.B. LigPlot+: Multiple ligand–protein interaction diagrams for drug discovery. J. Chem. Inf. Modeling 2011, 51, 2778–2786. [Google Scholar] [CrossRef]
- Tsai, T.Y.; Chang, K.W.; Chen, C.Y.C. iScreen: World’s first cloud-computing web server for virtual screening and de novo drug design based on TCM database@ Taiwan. J. Comput. Mol. Des. 2011, 25, 525–531. [Google Scholar] [CrossRef] [PubMed]
- Douguet, D. e-LEA3D: A computational-aided drug design web server. Nucleic Acids Res. 2010, 38, W615–W621. [Google Scholar] [CrossRef] [PubMed]
- Chang, K.W.; Tsai, T.Y.; Chen, K.C.; Yang, S.C.; Huang, H.J.; Chang, T.T.; Sun, M.F.; Chen, H.Y.; Tsai, F.J.; Chen, C.Y.C. iSMART: An integrated cloud computing web server for traditional Chinese medicine for online virtual screening, de novo evolution and drug design. J. Biomol. Struct. Dyn. 2011, 29, 243–250. [Google Scholar] [CrossRef] [PubMed]
- Liu, X.; Ouyang, S.; Yu, B.; Liu, Y.; Huang, K.; Gong, J.; Zheng, S.; Li, Z.; Li, H.; Jiang, H. PharmMapper server: A web server for potential drug target identification using pharmacophore mapping approach. Nucleic Acids Res. 2010, 38, W609–W614. [Google Scholar] [CrossRef] [PubMed]
- Murray, C.W.; Rees, D.C. The rise of fragment-based drug discovery. Nat. Chem. 2009, 1, 187. [Google Scholar] [CrossRef] [PubMed]
- Yang, S.Y. Pharmacophore modeling and applications in drug discovery: Challenges and recent advances. Drug Discov. Today 2010, 15, 444–450. [Google Scholar] [CrossRef]
- Leelananda, S.P.; Lindert, S. Computational methods in drug discovery. Beilstein J. Org. Chem. 2016, 12, 2694–2718. [Google Scholar] [CrossRef]
- Hwang, T.J.; Carpenter, D.; Lauffenburger, J.C.; Wang, B.; Franklin, J.M.; Kesselheim, A.S. Failure of investigational drugs in late-stage clinical development and publication of trial results. JAMA Intern. Med. 2016, 176, 1826–1833. [Google Scholar] [CrossRef]
- Lange, J.H.; Venhorst, J.; van Dongen, M.J.; Frankena, J.; Bassissi, F.; de Bruin, N.M.; den Besten, C.; de Beer, S.B.; Oostenbrink, C.; Markova, N.; et al. Biophysical and physicochemical methods differentiate highly ligand-efficient human D-amino acid oxidase inhibitors. Eur. J. Med. Chem. 2011, 46, 4808–4819. [Google Scholar] [CrossRef]
- Fox, N.; Jagodzinski, F.; Streinu, I. KINARI-Lib: A C++ Library for Pebble Game Rigidity Analysis of Mechanical Models; Minisymposium on Publicly Available Geometric/Topological Software: Chapel Hill, NC, USA, 2012. [Google Scholar]
- Jacobs, D.; Rader, A.; Thorpe, M.; Kuhn, L. Protein Flexibility Predictions using Graph Theory. Proteins 2001, 44, 150–165. [Google Scholar] [CrossRef]
- Jacobs, D.; Hendrickson, B. An algorithm for two-dimensional rigidity percolation: The pebble game. J. Comput. Phys. 1997, 137, 346–365. [Google Scholar] [CrossRef]
- Jagodzinski, F.; Hardy, J.; Streinu, I. Using Rigidity Analysis To Probe Mutation-Induces Structural Changes in Proteins. J. Bioinf. Comput. Biol. 2012, 10, 1242010–1242027. [Google Scholar] [CrossRef] [PubMed]
- Farhoodi, R.; Shelbourne, M.; Hsieh, R.; Haspel, N.; Hutchinson, B.; Jagodzinski, F. Predicting the Effect of Point Mutations on Protein Structural Stability. In Proceedings of the 8th ACM International Conference on Bioinformatics, Computational Biology, and Health Informatics, Boston MA, USA, 21–24 August 2017; pp. 247–252. [Google Scholar]
- Siderius, M.; Jagodzinski, F. Mutation sensitivity maps: Identifying residue substitutions that impact protein structure via a rigidity analysis in silico mutation approach. J. Comput. Biol. 2018, 25, 89–102. [Google Scholar] [CrossRef] [PubMed]
- Majeske, N.; Jagodzinski, F. Elucidating Which Pairwise Mutations Affect Protein Stability: An Exhaustive Big Data Approach. In Proceedings of the 2018 IEEE 42nd Annual Computer Software and Applications Conference (COMPSAC), Tokyo, Japan, 23–27 July 2018; Volume 1, pp. 508–515. [Google Scholar]
- Dehghanpoor, R.; Ricks, E.; Hursh, K.; Gunderson, S.; Farhoodi, R.; Haspel, N.; Hutchinson, B.; Jagodzinski, F. Predicting the effect of single and multiple mutations on protein structural stability. Molecules 2018, 23, 251. [Google Scholar] [CrossRef]
- Berman, H.M.; Westbrook, J.; Feng, Z.; Gilliland, G.; Bhat, T.N.; Weissig, H.; Shindyalov, I.N.; Bourne, P.E. The protein data bank. Nucleic Acids Res. 2000, 28, 235–242. [Google Scholar] [CrossRef]
- OpenEye Scientific Software. Cheminformatics Software: Molecular Modeling Software: OpenEye Scientific. Available online: https://www.eyesopen.com/ (accessed on 30 November 2019).
- Andersson, M.I.; MacGowan, A.P. Development of the quinolones. J. Antimicrob. Chemother. 2003, 51, 1–11. [Google Scholar] [CrossRef]
- Fanali, G.; Di Masi, A.; Trezza, V.; Marino, M.; Fasano, M.; Ascenzi, P. Human serum albumin: From bench to bedside. Mol. Asp. Med. 2012, 33, 209–290. [Google Scholar] [CrossRef]
- Zhu, L.; Yang, F.; Chen, L.; Meehan, E.J.; Huang, M. A new drug binding subsite on human serum albumin and drug–drug interaction studied by X-ray crystallography. J. Struct. Biol. 2008, 162, 40–49. [Google Scholar] [CrossRef]
- Davies, N.M. Clinical pharmacokinetics of ibuprofen. Clin. Pharmacokinet. 1998, 34, 101–154. [Google Scholar] [CrossRef]
- González, J.M.; Fisher, S.Z. Structural analysis of ibuprofen binding to human adipocyte fatty-acid binding protein (FABP4). Acta Crystallogr. Sect. 2015, 71, 163–170. [Google Scholar] [CrossRef]
- Mir, R.; Singh, N.; Vikram, G.; Kumar, R.P.; Sinha, M.; Bhushan, A.; Kaur, P.; Srinivasan, A.; Sharma, S.; Singh, T.P. The Structural Basis for the Prevention of Nonsteroidal Antiinflammatory Drug-Induced Gastrointestinal Tract Damage by the C-Lobe of Bovine Colostrum Lactoferrin. Biophys. J. 2009, 97, 3178–3186. [Google Scholar] [CrossRef] [PubMed]
- Blobaum, A.L.; Xu, S.; Rowlinson, S.W.; Duggan, K.C.; Banerjee, S.; Kudalkar, S.N.; Birmingham, W.R.; Ghebreselasie, K.; Marnett, L.J. Action at a Distance mutations of peripheral residues transform rapid reversible inhibitors to slow, tight binders of cyclooxygenase-2. J. Biol. Chem. 2015, 290, 12793–12803. [Google Scholar] [CrossRef] [PubMed]


| PDB ID | Ligand | Protein Res. | HBs and HIs | Num Rings | Largest Change in | Largest Rigid Cluster |
|---|---|---|---|---|---|---|
| 1H9Z | RWF | 582 | 5 | 2 | −16 | 1334 |
| 1HA2 | SWF | 582 | 7 | 2 | 21 | 1041 |
| 1TF0 | DKA | 609 | 1 | 0 | −8 | 3703 |
| 2BXD | RWF | 1156 | 9 | 2 | −23 | 1700 |
| 2I2Z | SAL | 581 | 1 | 1 | 1 | 1059 |
| 2I2Z | MYR | 581 | 8 | 0 | −8 | 1059 |
| 2JJ8 | AZZ | 736 | 6 | 2 | −6 | 2570 |
| 3B9L | MYR | 582 | 7 | 0 | −7 | 1218 |
| 3B9L | AZZ | 582 | 1 | 2 | −9 | 1218 |
| 3B9M | SAL | 582 | 1 | 1 | 1 | 1092 |
| 3B9M | MYR | 582 | 6 | 0 | −7 | 1118 |
| 3B9M | AZZ | 582 | 2 | 2 | −9 | 1092 |
| 3BCR | AZZ | 812 | 2 | 2 | 3 | 6804 |
| 3IB2 | IBP | 341 | 4 | 1 | −23 | 2651 |
| 3P6D | ZGB | 138 | 4 | 1 | −10 | 1422 |
| 3P6E | ZGC | 139 | 3 | 1 | −1 | 1342 |
| 3P6G | IZP | 139 | 3 | 1 | −3 | 1405 |
| 3P6H | IBP | 139 | 1 | 1 | −14 | 1475 |
| 4JTR | IBP | 633 | 5 | 1 | −21 | 5381 |
| 4KRA | CPF | 1018 | 5 | 3 | 51 | 7271 |
| 4RS0 | IBP | 557 | 4 | 1 | −18 | 5524 |
| 6U4X | IBP | 580 | 9 | 1 | 33 | 3050 |
| PDB ID | Num. of Residues | Ligand | Ligand Size | Num. of Lig Variants | Run Time (min) | Data Size |
|---|---|---|---|---|---|---|
| 2PJ6 | 306 | 059 | 32 | 7989 | 641 | 5.7 GB |
| 2RKN | 77 | LP3 | 30 | 163 | 1.0 | 41 MB |
| 3CYW | 198 | 017 | 38 | 3293 | 104 | 2.2 GB |
| 3IWL | 68 | TCE | 16 | 367 | 1.8 | 74 MB |
| 3JVY | 198 | 017 | 38 | 3293 | 109 | 2.1 GB |
| 4KRA | 1023 | CPF | 24 | 72 | 53 | 147 MB |
© 2020 by the authors. Licensee MDPI, Basel, Switzerland. This article is an open access article distributed under the terms and conditions of the Creative Commons Attribution (CC BY) license (http://creativecommons.org/licenses/by/4.0/).
Share and Cite
Herr, S.; Myers-Dean, J.; Read, H.; Jagodzinski, F. PETRA: Drug Engineering via Rigidity Analysis. Molecules 2020, 25, 1304. https://doi.org/10.3390/molecules25061304
Herr S, Myers-Dean J, Read H, Jagodzinski F. PETRA: Drug Engineering via Rigidity Analysis. Molecules. 2020; 25(6):1304. https://doi.org/10.3390/molecules25061304
Chicago/Turabian StyleHerr, Sam, Josh Myers-Dean, Hunter Read, and Filip Jagodzinski. 2020. "PETRA: Drug Engineering via Rigidity Analysis" Molecules 25, no. 6: 1304. https://doi.org/10.3390/molecules25061304
APA StyleHerr, S., Myers-Dean, J., Read, H., & Jagodzinski, F. (2020). PETRA: Drug Engineering via Rigidity Analysis. Molecules, 25(6), 1304. https://doi.org/10.3390/molecules25061304