Article

Retention Modelling of Phenoxy Acid Herbicides in Reversed-Phase HPLC under Gradient Elution

by
Alessandra Biancolillo
1,
Maria Anna Maggi
2,
Sebastian Bassi
3,
Federico Marini
3 and
Angelo Antonio D’Archivio
1,*
1
Dipartimento di Scienze Fisiche e Chimiche, Università degli Studi dell’Aquila, Via Vetoio, Coppito, 67100 L’Aquila (AQ), Italy
2
Hortus Novus srl, Via Campo Sportivo 2, Canistro, 67100 L’Aquila, Italy
3
Dipartimento di Chimica, Università degli Studi di Roma “La Sapienza”, Piazzale Aldo Moro 5, 00185 Roma, Italy
*
Author to whom correspondence should be addressed.
Molecules 2020, 25(6), 1262; https://doi.org/10.3390/molecules25061262
Submission received: 26 January 2020 / Revised: 1 March 2020 / Accepted: 11 March 2020 / Published: 11 March 2020
(This article belongs to the Special Issue Chromatographic Analysis of Pollutants)

Abstract

:
Phenoxy acid herbicides are used worldwide and are potential contaminants of drinking water. Reversed phase high-performance liquid chromatography (RP-HPLC) is commonly used to monitor phenoxy acid herbicides in water samples. RP-HPLC retention of phenoxy acids is affected by both mobile phase composition and pH, but the synergic effect of these two factors, which is also dependent on the structure and pKa of solutes, cannot be easily predicted. In this paper, to support the setup of RP-HPLC analysis of phenoxy acids under application of linear mobile phase gradients we modelled the simultaneous effect of the molecular structure and the elution conditions (pH, initial acetonitrile content in the eluent and gradient slope) on the retention of the solutes. In particular, the chromatographic conditions and the molecular descriptors collected on the analyzed compounds were used to estimate the retention factor k by Partial Least Squares (PLS) regression. Eventually, a variable selection approach, Genetic Algorithms, was used to reduce the model complexity and allow an easier interpretation. The PLS model calibrated on the retention data of 15 solutes and successively tested on three external analytes provided satisfying and reliable results.

1. Introduction

Phenoxy acid herbicides are synthetic analogues of the plant regulator auxins and are extensively used to control broad-leaved weeds in many crops, such as rice, wheat and soybeans [1]. The treatment by phenoxy acids induces “auxin overdose” into the unwanted vegetal species that undergoing disorganized and uncontrolled growth eventually die. 2,4-dichlorophenoxyacetic acid (2,4-D), although first marketed in 1944, is still one of the most widely used herbicides in the world, together with the parent products 2-(4-chloro-2-methylphenoxy) propanoic acid (mecoprop), (4-chloro-2-methylphenoxy)acetic acid (MCPA) and 2-(2,4-dichlorophenoxy)propanoic acid (dichloroprop) [2,3]. Phenoxy acids are highly soluble in the aqueous media and therefore, can easily migrate through the agricultural environment finally leading to groundwater contamination [4,5], which can compromise drinking water quality and affect human health because of chronic toxicity, endocrine-disrupting action and potential carcinogenic effects [6,7,8]. Phenoxy acids in water or food can be detected and quantified by reversed-phase high-performance liquid chromatography (RP-HPLC) coupled to spectrophotometric or mass-spectrometry detection [3,9,10,11]. Multi-residue determination in real samples by RP-HPLC is usually preceded by a procedure for concentration and isolation of the analytes, such as liquid-phase micro-extraction or solid-phase extraction [12], but differently from gas-chromatography [13,14], preliminary derivatization of the phenoxy acids is not needed.
Routine monitoring of trace pollutants in water requests chromatographic methods able to simultaneously detect and quantify many structural congeners or multi-class mixtures. In this context, the empirical trial-and-error strategies still used to develop chromatographic methods may be inefficient or excessively time-consuming. To overcome such limitation various multivariate statistical approaches have been proposed [15,16,17,18] with the aim of providing predictive tools for the chromatographic retention. A widely used approach is quantitative structure-retention relationship (QSRR) methodology [19,20] which is aimed at establishing a relationship between the solute structure, encoded by a set of molecular descriptors, and the retention time or a related parameter. Approaches complementary to QSRR, on the other hand, are applied to model the effects of the separation conditions on the chromatographic behavior of a target solute or a mixture of analytes. To this end, multivariate design of experiments combined with response surface methodology can be employed to optimize the chromatographic response(s) of interest [21,22,23,24,25], such as retention time, pair or global resolution and overall analysis time. Apart from the above two kinds of predictive approaches, which can be considered orthogonal according to the complementary nature of the described variability, QSRR-based models combining both molecular descriptors of solutes and the features of the eluent, the column or both have been proposed [26,27,28,29,30]. These comprehensive models, once calibrated on a pool of known solutes and a well-designed set of separation conditions, allow to predict the behavior of unseen molecules in the whole experimental domain covered in calibration or to transfer retention data among different columns [31,32,33,34].
In RP-HPLC the composition of the eluent, mostly a binary aqueous mixture, is the experimental parameter commonly tuned to find the optimal separation conditions. Moreover, to overcome the typical disadvantages of isocratic elution, such as poor resolution of early peaks, broadening of late peaks, band tailing, and long separation times, mobile-phase gradients are required [35,36], especially when dealing with complex mixtures or structural congeners. The concentration of organic solvent in the aqueous mobile phase is usually increased during the chromatographic run, which determines a progressive increase of the elution power of the eluent and a consequent decrease in solute retention. Apart from composition, the retention behavior of weak acids is also influenced by the eluent pH, that must be fixed or properly modulated during the chromatographic run [37]. An increase in pH of the mobile phase produces a progressive ionization of the solute and a consequent decrease in its retention time. It must be remarked that the organic modifier of the mobile phase affects the acidity of both medium and solutes, which does not allow to easily deduce the synergic effect of the eluent pH and composition on the retention behavior of the target analytes, especially when gradient elution is applied.
In a previous work [38], we modelled the combined effect of pH and composition of water-acetonitrile eluent on the retention of phenoxy acids and structurally related carboxylic acids under isocratic elution conditions. The molecular structure of the phenoxy acids was described by a-priori selected quantum-chemical properties (dipole moment, mean polarizability, anisotropy of polarizability, water/n-heptane partition coefficient and a hydrogen bond descriptor) of both neutral and ionized forms together with the experimental pKa, while pH and acetonitrile volume fraction were the variables associated with the eluent. A three-layer artificial neural network was used to generate the retention model. In the present work, we developed a comprehensive model to predict the retention behavior of phenoxy acid herbicides and related carboxylic acids under the application of linear composition gradients at different pH levels. Moreover, the molecular structure of solutes is encoded by non-quantum-chemical theoretical descriptors provided by popular software Dragon (Dragon 6, Talete srl, Milan) [39] that, as compared to quantum-chemical molecular properties, are quickly accessible to users with no specific expertise in theoretical chemistry. The regression problem was solved by Partial Least Square [40,41], as it is one of the most commonly applied regression methods in this context [20,42,43]. Eventually, Genetic Algorithms (GA) [44] were applied in order to reduce the model complexity and make its interpretation easier.

2. Results

The set of solutes investigated in this work (reported in Table A1) consists of eight phenoxy acid herbicides (2,4-D, 2,4,5-T, 2,4,5-TP, MCPA, dichlorprop, mecoprop, clopyralid and trichlopyr) and ten derivatives of benzoic acid, phenylacetic acid and phenoxyacetic acid, pKa of these compounds ranging between 2.29 and 4.31. The RP-HPLC retention data of the 18 analytes were collected at three different values of eluent pH, namely 2, 3 and 4. For each pH level the starting acetonitrile volume fraction φi was set to 30, 40, 50, 60 and 70%. While pH of the mobile phase was kept fixed during elution, the acetonitrile content was fixed at the starting value (isocratic elution) or linearly increased to 100% in 15, 20 or 25 min. The descriptors selected to identify the various elution modes were the eluent pH, φi and the gradient slope ϕ defined as (100−φi)/tg, where tg was the application time of the linear gradient, and ϕ = 0 for the isocratic condition. The chromatographic conditions are resumed in Table 1. Nevertheless, in the chromatograms collected under application of the 60 elution modes obtained by the combination of the above designed levels for the three eluent descriptors, we did not consider those peaks given by both poorly or strongly retained compounds. 753 retention time (tr) values were finally collected and the (base 10) logarithm of the related retention factor k [45,46,47], defined as k = (tr−t0)/t0, t0 being the column’s dead time, was assumed as the model response. The use of the logarithm of the retention factor has been preferred to the retention factor itself because it can be directly related to some physico-chemical parameters governing the retention process. In particular, Ciura et al. [45] claim that the use of log k as dependent variable in QSRR presents various advantages, one of the most relevant of which being that it can be used as a hydrophobicity index. Similar considerations are reported by Kaliszan and collaborators [46] who showed how log k could be linearly related to the fraction of the organic modifier in the mobile phase.

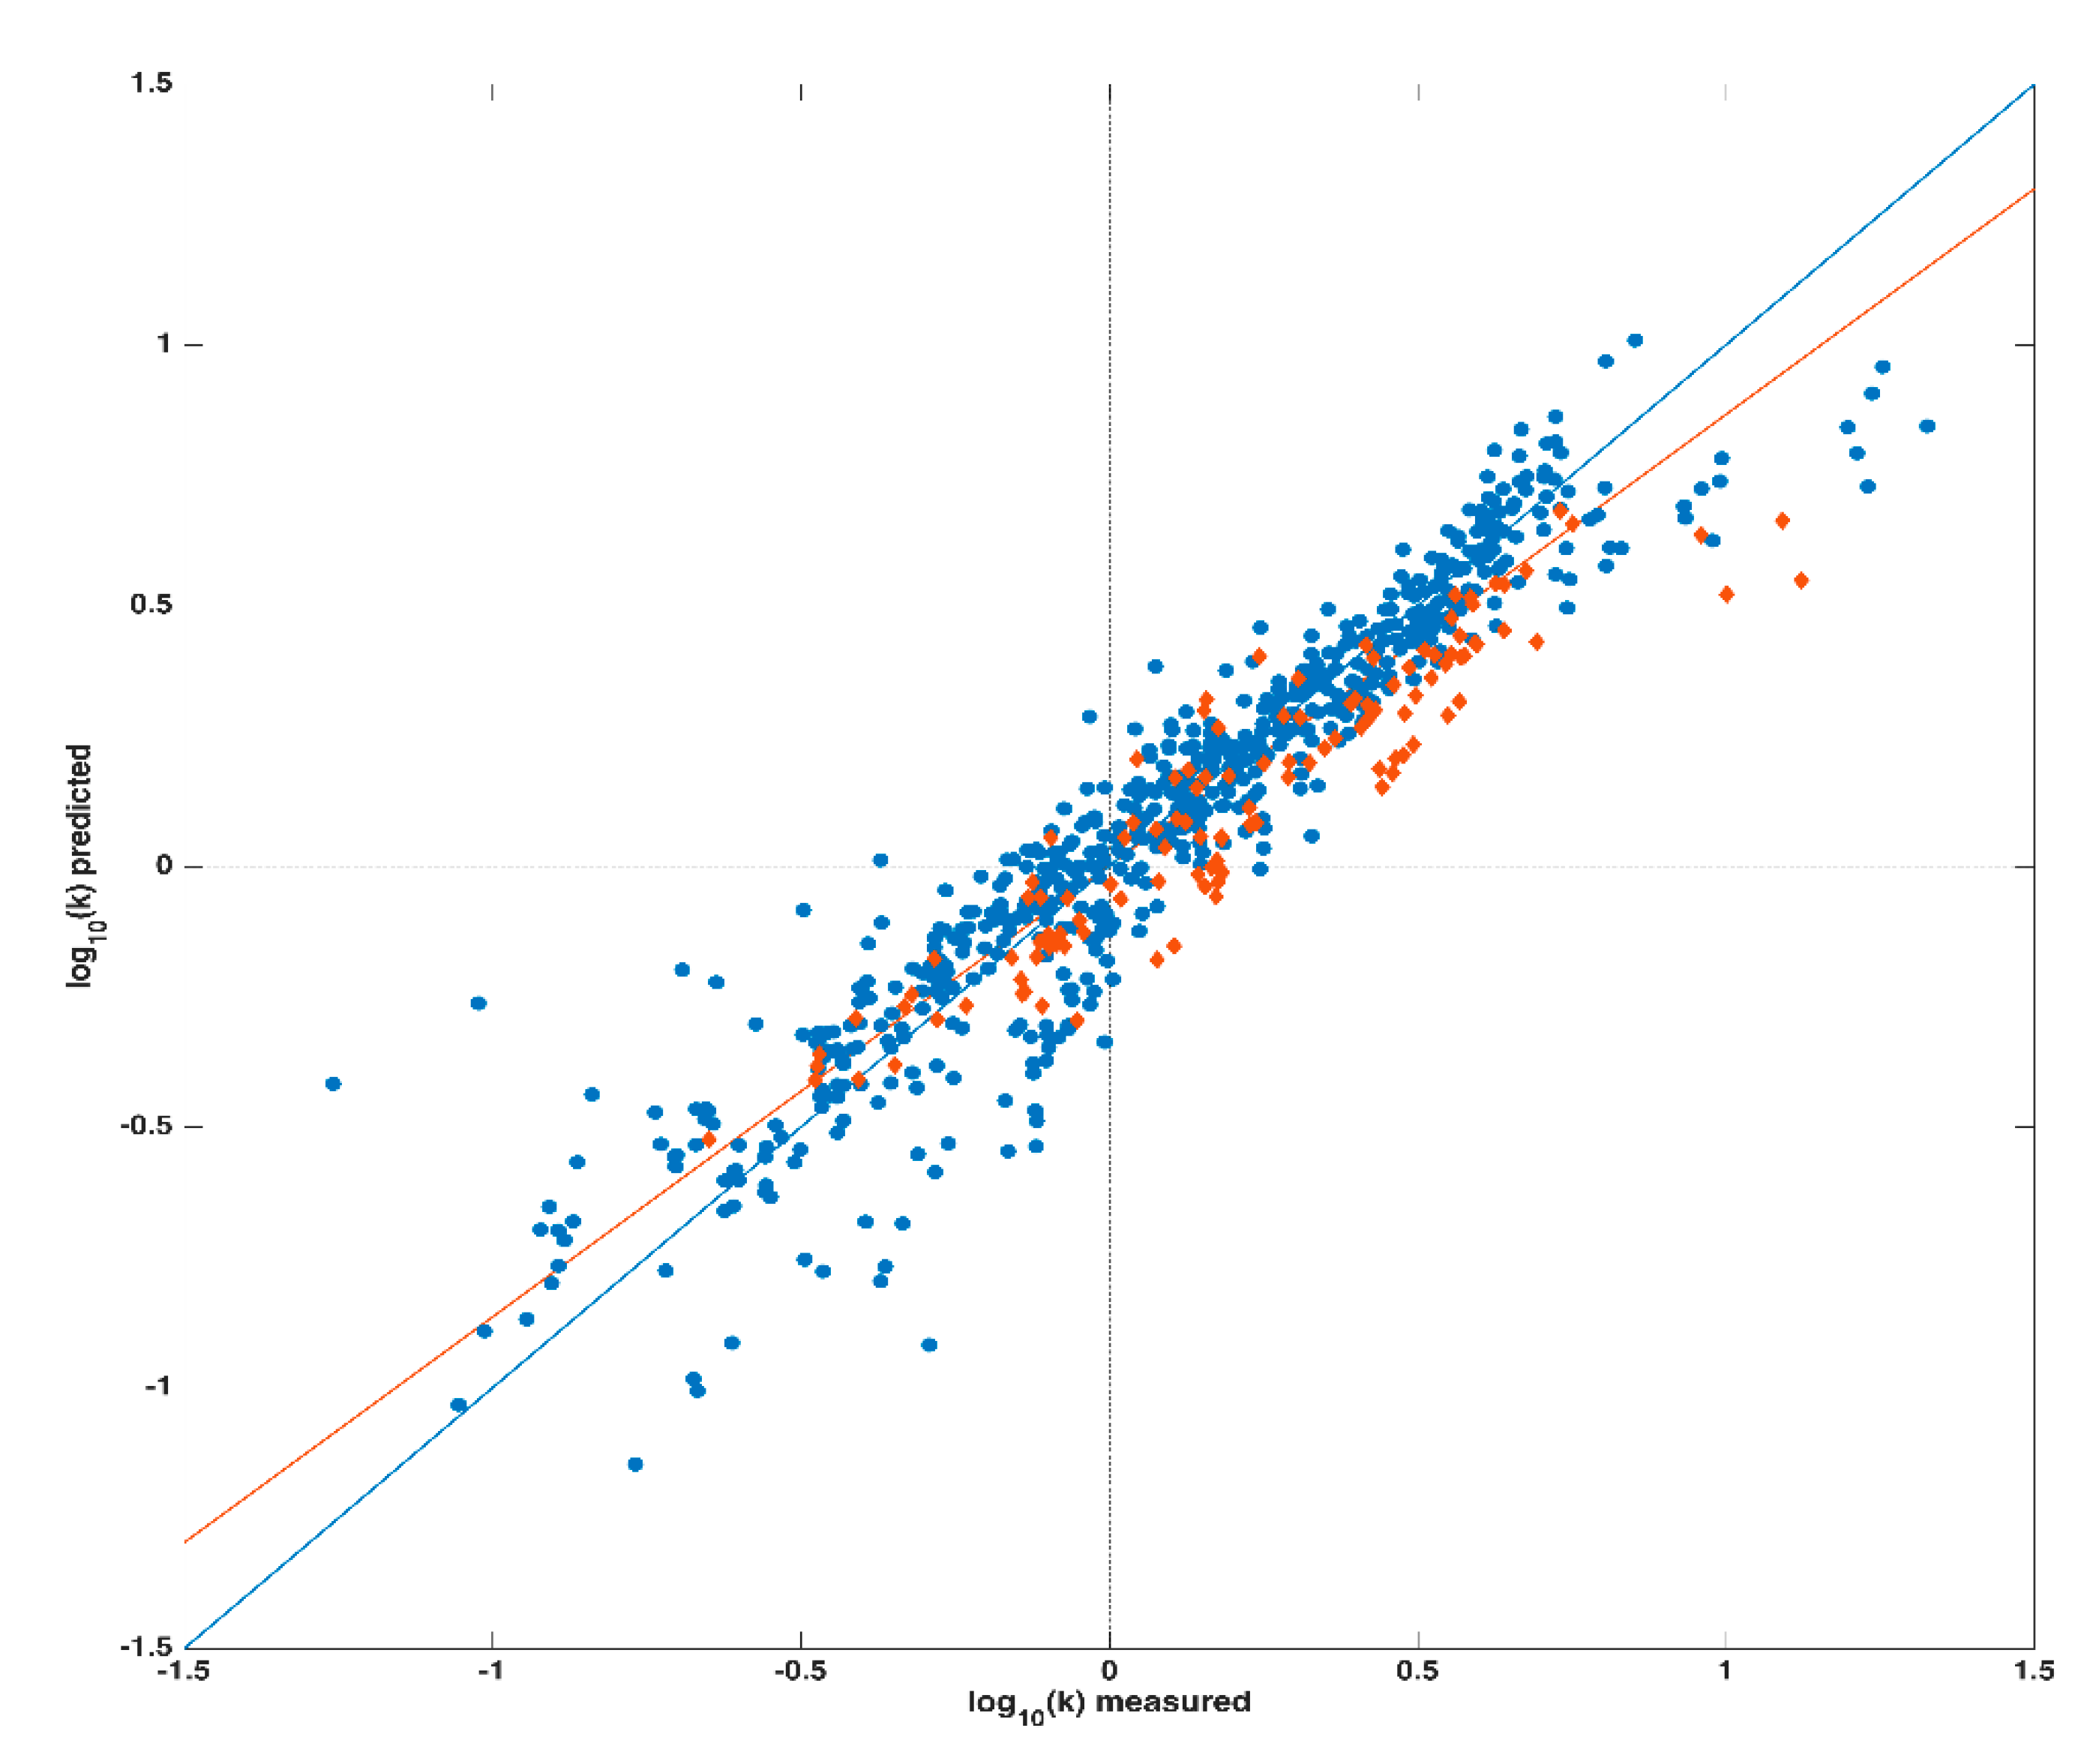
2.1. Prediction of the Retention Factor k

Prior to the creation of any prediction model, the three chromatographic parameters (pH, φi and ϕ) and the 329 descriptors were organized in a unique data matrix X. Then, in order to externally validate the regression model, data collected on the 18 compounds were divided into a training set (for building the calibration model), and a test set (for validation); in particular, the latter one was constituted by data collected on 2,4-diclorofenossiacetic acid, trichlopyr and 2-iodobenzoic acid. As mentioned above, a PLS regression model was created (exploiting only the training set) in order to fit the logarithm of the retention factor k to the autoscaled data matrix X. The calibration model, calculated extracting 11 latent variables (LVs) (defined into a cross-validation procedure), provided a coefficient of determination (Rcv2) of 0.887 and a Root Mean Square Error in Cross-Validation (RMSECV) of 0.142. The application of this model to the test set provided a Rtest2 of 0.872 and a Root Mean Square Error in Prediction (RMSEP) of 0.156; a graphical representation of these results is displayed in Figure 1 showing the agreement between computed/predicted and experimental responses. The black solid line in the plot depicts the ideal fitting (i.e., RMSEP = 0), while the red one represents the actual one; as it can be seen from the good overlap between the two straight lines, and in accordance with the Rcv2 and Rtest2 values shown, the model properly fits the data under study.
Eventually, despite the results provided by the PLS model were quite satisfying, a variable selection approach, Leardi’s Genetic Algorithm (GA) [44], was tested aiming at two final goals: evaluating whether variable selection could improve the predictive accuracy and simplifying the interpretation of the regression model.
The genetic algorithm was applied to the training set (with the parameters reported in Table A2 in Appendix A) and the Rcv2 (5 cancelation groups) was used as fitness.
The predictors were sorted according to the frequency of selection in the 100 GA runs and PLS models with an increasing number of variables were built according to a forward stepwise scheme: the model leading to the highest Rcv2 (5 cancelation groups), which included 29 predictors (see Table 2), was selected as the final one. This model was built on 4 latent variables and resulted in a RMSEC = 0.143 and a RMSECV = 0.148 (corresponding to R2 = 0.883 and Rcv2 = 0.876, respectively). The model was then applied to the test molecules for the final (external) validation and resulted in a RMSEP of 0.167, corresponding to a R2pred of 0.847. This means that, in the present case, the use of a variable selection approach mainly helps the interpretation of the regression model in chemical terms, rather than leading to an improvement in the prediction accuracy. Nevertheless, it has to be emphasized that the results obtained are comparable with those of similar works on QSRR published in the literature (for instance [48] where models (built on log k) have in general SEP values between 0.16 and 0.22, and R2pred around 0.75–0.88), and, framed into a wider scenario, are in line with studies on experimentally measuring retention factor, considering the uncertainty associated to the estimation of this entity [49].

3. Discussion

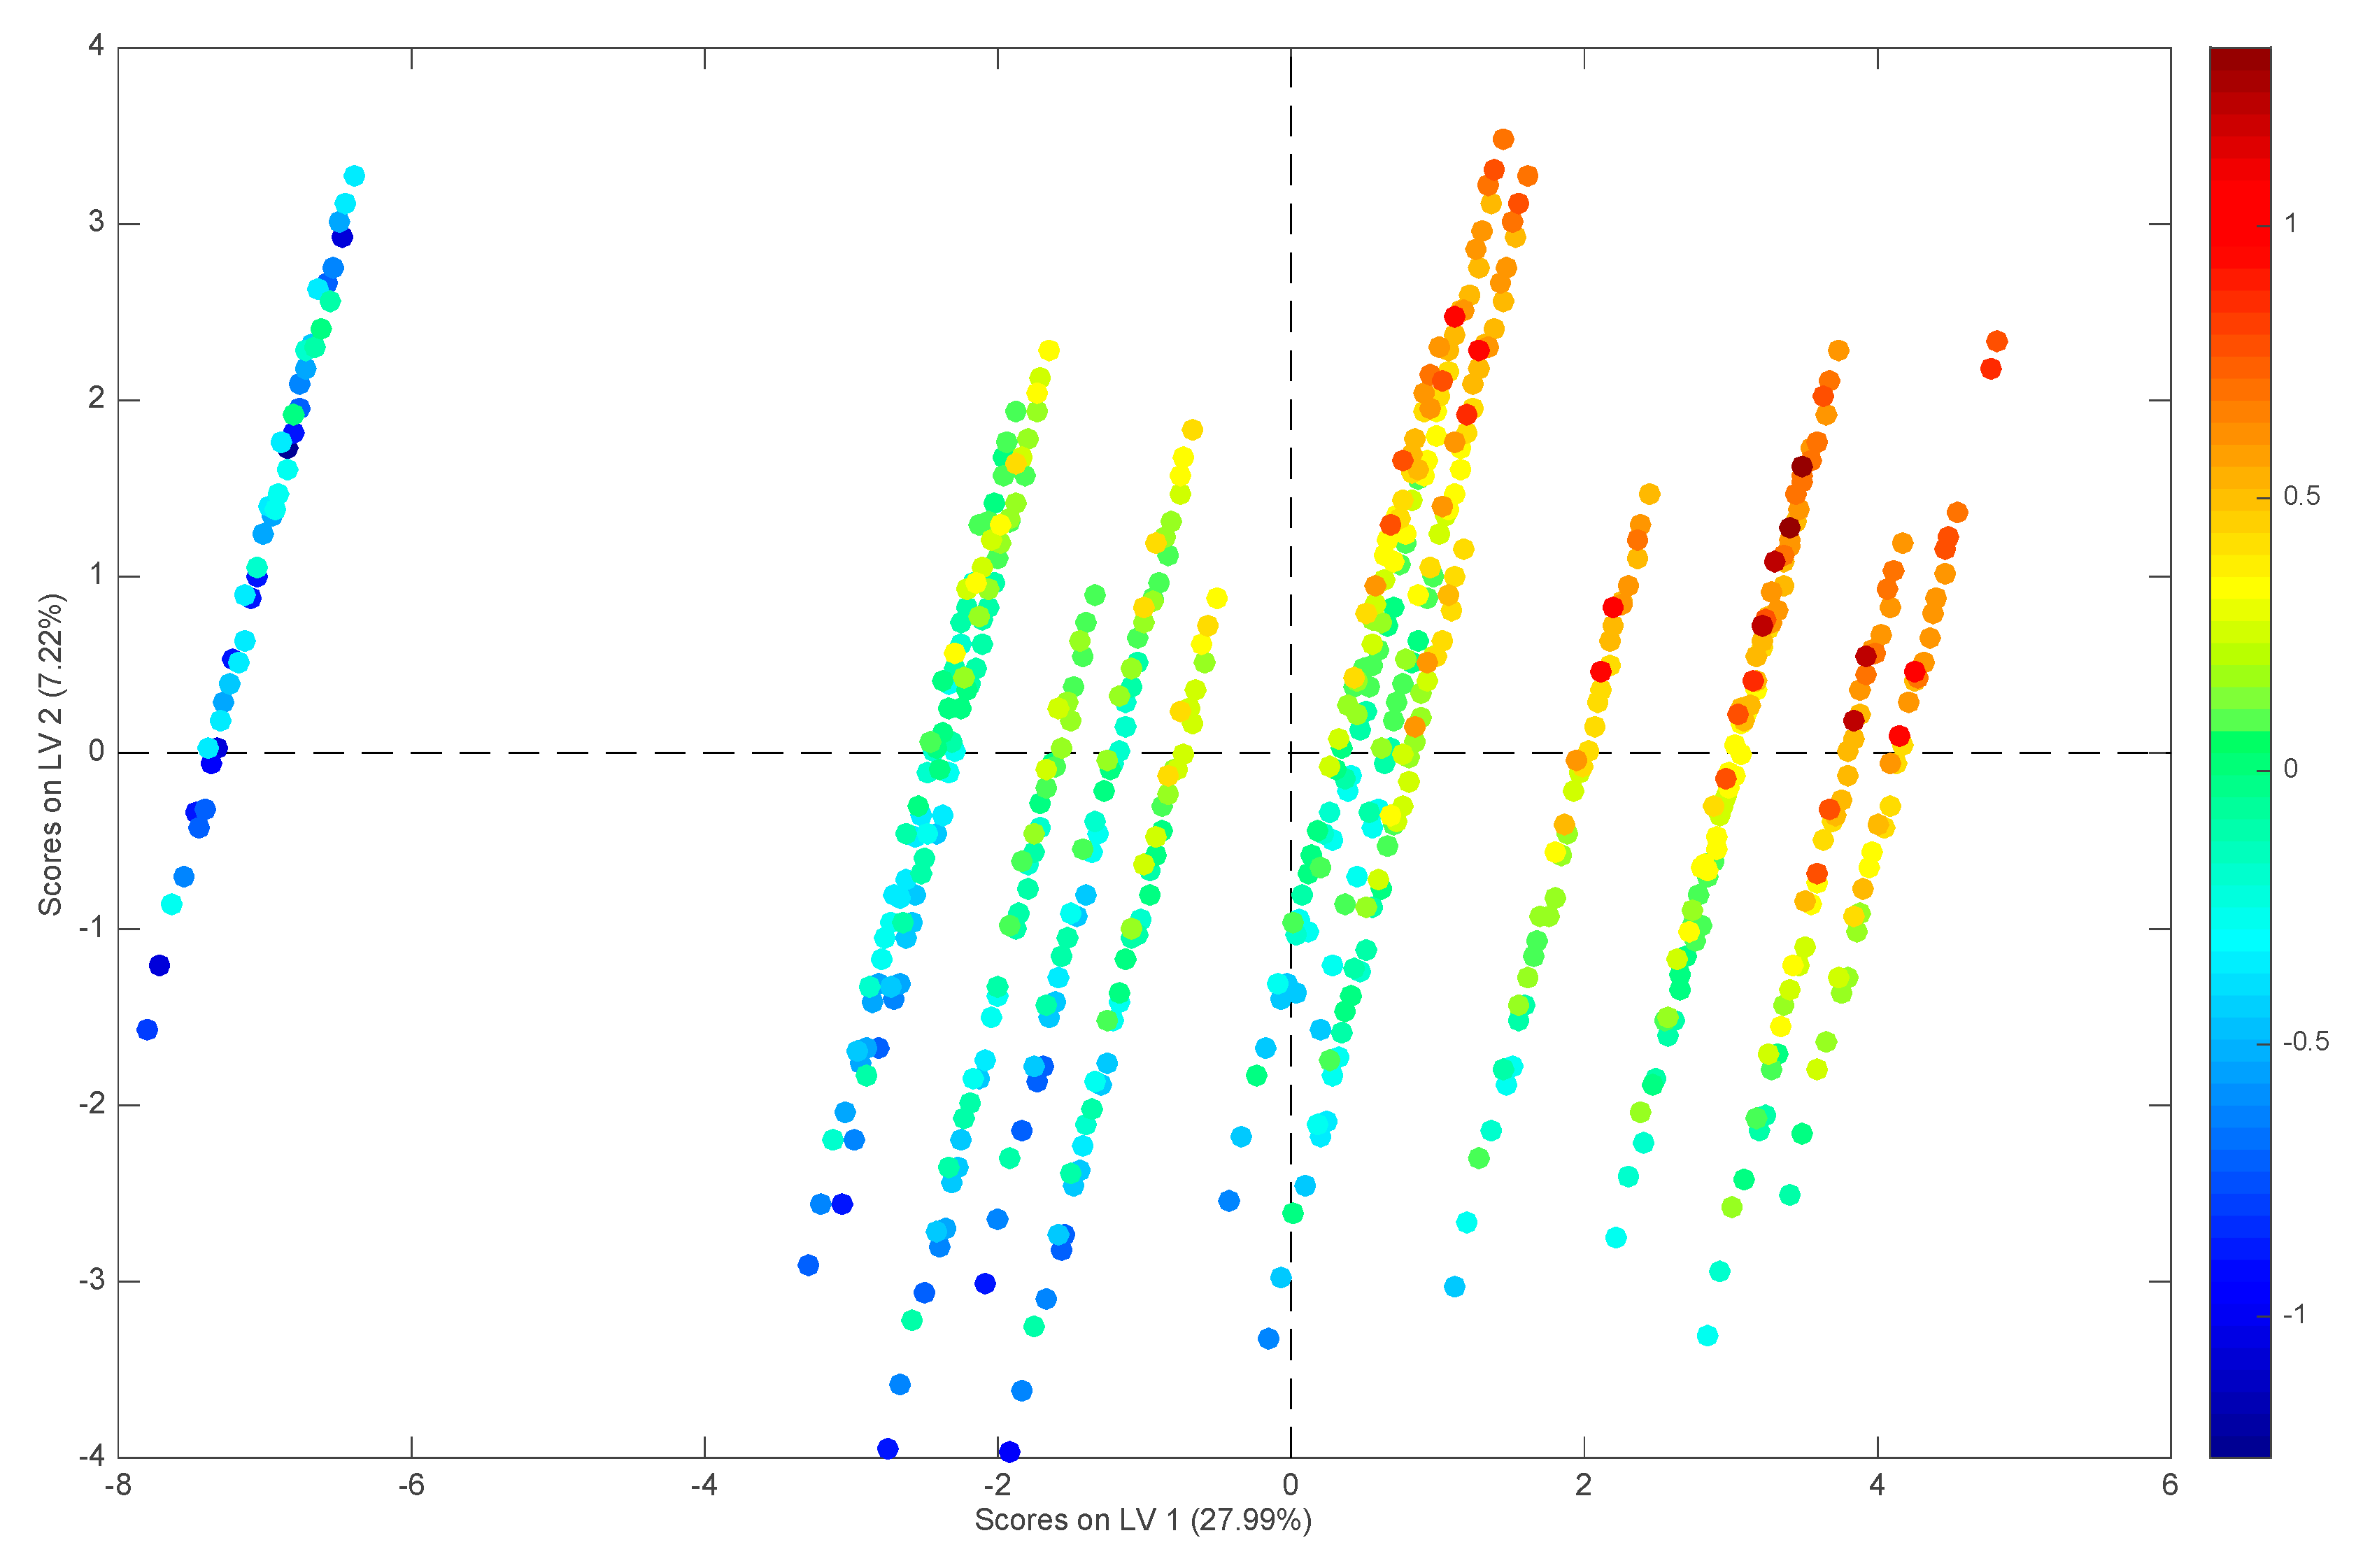
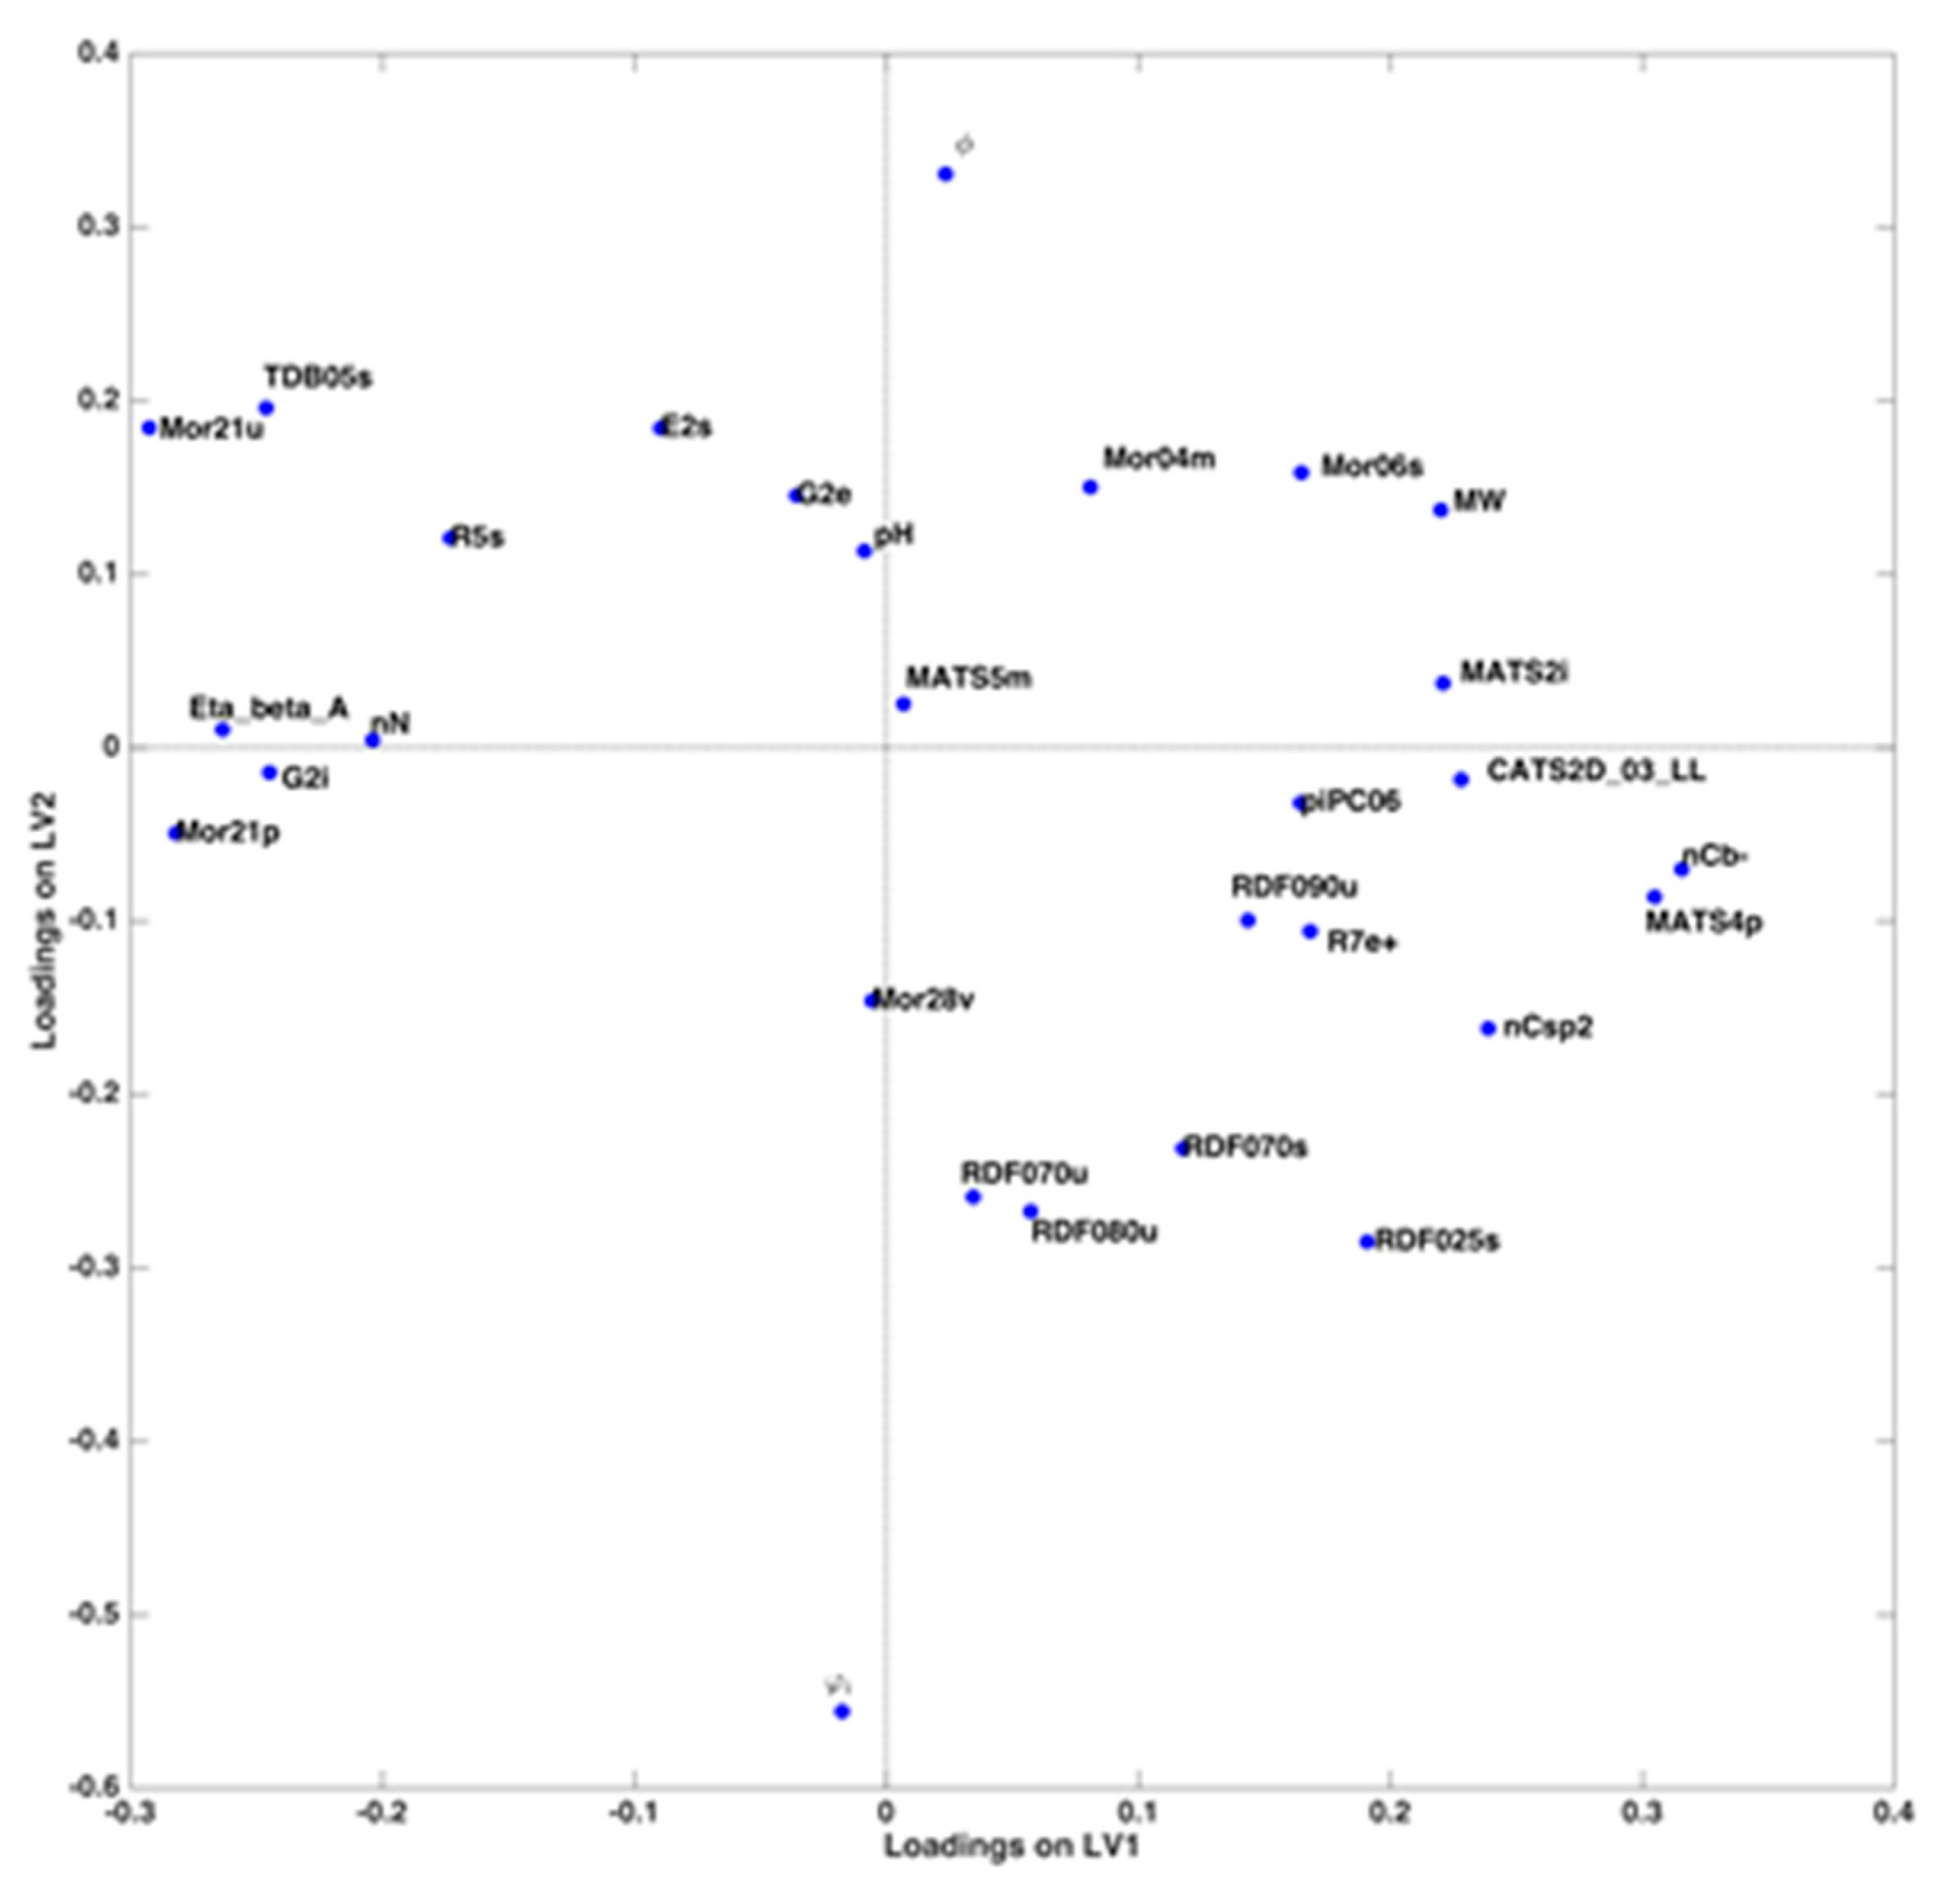
Interpretation of the Model

The PLS model discussed in Section 2.1 provided satisfying and reliable results, indicating that pH, φi, ϕ, and the inspected molecular descriptors represent a reasonable set of predictors for the estimation of log(k) for the investigated phenoxy acid herbicides and related carboxylic acids. The regression coefficients from this model are reported in Table A3.
The application of GA leads to a deeper insight into the system under study; in fact, it provides information about the contributions of the 29 selected variables.
The sample scores along the first two latent variables of the model are reported in Figure 2, where their relation to the values of the response is also highlighted. By inspecting the scores in Figure 2, it is apparent how LV1 accounts mostly for the differences among substances while the mobile phase conditions are mainly responsible for the variance along LV2. In general, log k increases both along LV1 and along LV2.
Investigation of the corresponding loadings (Figure 3) confirms what already evidenced by the scores plot and provides details for a comprehensive interpretation. Indeed, the three predictors related to the mobile phase conditions have practically zero loadings along LV1, thus confirming that the latent variable is affected only by the molecular descriptors characterizing the analytes. In particular, MATS2i, nCb-, MATS4p, MW, nCsp2 and CATS2D_03_LL have the highest positive loadings, while Mor21u, Eta_beta_A, TDB05s, G2i, nN and Mor21p are those giving the largest negative contribution. This means that the value of log k is higher for molecules having higher values of the former descriptors and lower values of the latter, and vice versa.
On the other hand, LV2 is characterized by a very negative contribution of the % of acetonitrile and a highly positive loading of the slope of the gradient; pH of the mobile phase also has a positive, although lower, loading on this component. For each substance, the value of log k increases when a lower initial amount of acetonitrile is used, together with a steeper slope of the gradient; a more basic pH also contributes to increase the value of the retention factor.
In summary, the PLS regression model discussed in Section 2.1 provided satisfying and reliable results, indicating that pH, φi ϕ, and the inspected molecular descriptors represent a reasonable set of predictors for the estimation of log k for the investigated herbicides. The use of a variable selection approach in this specific case did not lead to an improvement in the prediction accuracy but was useful for the interpretation of the regression model in chemical terms.

4. Materials and Methods

4.1. Chemicals

Pestanal standards (purity greater than 99%) of the phenoxy acid herbicides 2-(4-chloro-2-methylphenoxy) propanoic acid (mecoprop), 2,4-dichlorophenoxyacetic acid (2,4-D), (4-chloro-2-methylphenoxy)acetic acid (MCPA), (2,4,5-trichlorophenoxy) acetic acid (2,4,5-T), 2-(2,4,5-trichlorophenoxy)propanoic acid (2,4,5-TP), 2,6-dichloro-pyridine-2-carboxylic acid (clopyralid), 2-(2,4-dichlorophenoxy)propanoic acid (dichloroprop) and [(3,5,6-trichloro-2-pyridinyl)oxy]acetic acid (triclopyr) were obtained from Labor Dr. Ehrenstorfer-Schäfers (Augsburg, Germany). Chemical standards of phenoxyacetic acid, benzoic acid and phenylacetic acid derivatives with purity greater than 95% were purchased from Sigma–Aldrich (St. Louis, MO, USA). Stock solutions (1.00 g L−1) of individual analytes were prepared by dissolving accurately weighed 10 mg of each solute in 10 mL of HPLC-grade acetonitrile (Carlo Erba Reagenti, Milano, Italy) and stored at 4 °C. HPLC-grade acetonitrile was acquired from Sigma-Aldrich (St. Louis, MO, USA). Double deionized water was obtained from a Milli-Q filtration/purification system (Millipore, Bedford, MA, USA).

4.2. HPLC Apparatus

Retention data were collected with a Waters chromatographic system (Waters, Milford, MA, USA) consisting of a Model 600 pump, a 600 Pump Controller Module, an Acqua 717 plus auto-sampler and a 996-photodiode array detector. Chromatographic data management was automated using the Empower data acquisition system (Waters). Eluent degassing was performed by an Agilent 1200 system (Agilent Technologies, Waldbronn, Germany). The analyses were carried on a 250 × 4.6 mm Kinetex C18 (Phenomenex, Torrance, CA, USA) analytical column preceded by a 4 × 3mm UHPLC guard cartridge (Phenomenex) both packed with octadecyl-silica having 5 μm particle size.

4.3. Collection of Retention Data

The HPLC analyses were carried out at room temperature using water-acetonitrile mobile phases with a flow-rate of 1mLmin−1. The retention time of the analytes was collected at fixed values of the eluent pH obtained by mixing the aqueous phase buffered at pH 2, 3 or 4. To control the acidity of the mobile phase a phosphate buffer at 0.1 M concentration was used. pH of water, before mixing with acetonitrile, was adjusted to the desired value by addition of HCl. pH measurements were carried out by means of an Orion 420 A (Beverly, MA, USA) pH meter equipped with an Orion 9107 electrode. Five levels for the initial acetonitrile volume fraction φi were considered, namely 30, 40, 50, 60 and 70%. For each combination of the eluent pH and φi pair, the acetonitrile content in the mobile phase was kept constant for the whole chromatographic run (isocratic elution) or was linearly increased until 100% in 15, 20, or 25 min. After gradient elution the column was re-equilibrated by fluxing the mobile phase at the initial composition for ten minutes before successive analysis. Retention data were collected by injecting 10 μL of acetonitrile solutions of single compounds (5mgL−1) or mixtures providing well-resolved chromatograms. The detection wavelength (220 nm for most analytes) was the one providing the maximum peak height. The dead time of the column was determined by injection of an aqueous solution of sodium nitrate.

4.4. Molecular Descriptors

Starting geometries of phenoxy acid herbicides and the other carboxylic acids were drawn by means of the MacroModel 7.1 molecular modelling program package [50]. The global energy minimum of each molecule was searched using the MM2 force field. Software Dragon 6 [39] was used to compute the molecular descriptors from the optimised geometries. The version utilised in this work provides 4885 descriptors classified as zero- (0D), one- (1D), two- (2D) and three-dimensional (3D) descriptors depending on the fact they are computed from the chemical formula, the substructure list representation, the molecular graph or the geometrical representation of the molecule, respectively. After removal of constant and highly correlated variables (r > 0.85), 329 molecular descriptors were retained for further analyses.

4.5. Development and Validation of Retention Models

The data matrix constituted of the three chromatographic parameters and the 329 molecular descriptors were used as predictors to estimate log k by Partial Least Squares (PLS) [40,41]. The regression model was built on a restricted sub-set of data (the training set) in order to pursue validation on the test set. The optimal complexity of the calibration model (i.e., the number of LVs to be extracted) were defined into a cross-validation procedure (not involving the test set). Once the PLS model parameters were defined (by inspection of the lowest RMSECV) it was validated by predicting the external test set. The goodness of the model was estimated by inspecting Rcv2 and Rtest2.
In order to test whether feature reduction could improve the model from the prediction and the interpretation standpoint, Genetic Algorithms (GA) [44] were applied for variable selection. Concisely, this iterative approach starts picking random sets of variables, which, by means of genetic operators, lead to the generation of offsprings. Calculations are then re-run on the subsets of features, and the variables providing the most performant solution are retained. The procedure is repeated until the optimal solution is reached. For more details, the reader is addressed to [51].
All the calculations were run in Matlab 2015b (The Mathworks Inc., Natick, MA) using in-house routines or by the PLS toolbox Version 8.1 (Eigenvector Research, Inc.Manson, WA).

Author Contributions

Conceptualization, A.A.D. and A.B.; methodology and data curation, F.M.; formal analysis, A.B.; investigation, M.A.M. and S.B.; writing—original draft preparation, review and editing, A.A.D. and A.B. All authors have read and agreed to the published version of the manuscript.

Funding

This research received no external funding.

Conflicts of Interest

The authors declare no conflict of interest.

Appendix A

Table A1. Molecular structure and pKa value (from literature [38]) of the investigated acids.
NameStructurepKa
2,4-D Molecules 25 01262 i0012.73
2,4,5-T Molecules 25 01262 i0022.83
2,4,5-TP Molecules 25 01262 i0032.84
Clopyralid Molecules 25 01262 i0042.29
Dichlorprop Molecules 25 01262 i0053.10
MCPA Molecules 25 01262 i0063.13
Mecoprop Molecules 25 01262 i0073.10
Tryclopir Molecules 25 01262 i0083.97
Benzoic acid Molecules 25 01262 i0094.19
Salicylic acid Molecules 25 01262 i0102.97
2-Iodobenzoic acid Molecules 25 01262 i0112.93
3-Iodobenzoic acid Molecules 25 01262 i0123.85
4-Iodobenzoic acid Molecules 25 01262 i0134.00
Phenylacetic acid Molecules 25 01262 i0144.31
4-Chlorophenylacetic acid Molecules 25 01262 i0152.76
4-Nitrophenylacetic acid Molecules 25 01262 i0163.85
Phenoxyacetic acid Molecules 25 01262 i0173.17
4-Chlorophenoxyacetic acid Molecules 25 01262 i0183.56
Table A2. Parameters of the genetic algorithm.
ParametersValue
Number of chromosomes30
Probability of selection in the original population0.015
Maximum number of variables per chromosome30
Probability of mutation0.01
Probability of cross-over0.50
Backward stepwise selection every100 iterations
Number of runs100
Number of evaluations per run200
Table A3. Regression coefficients extracted from the PLS model based on the 29 descriptors selected by GA.
DescriptorCoefficient
φi−0.686
ϕ−0.091
pH0.212
MATS2i0.061
nCb-0.097
Mor21u−0.067
MATS4p0.080
Eta_beta_A−0.073
TDB05s−0.042
RDF070u−0.025
RDF025s0.0366
Mor06s0.0900
G2i−0.0400
MW0.093
nCsp20.039
MATS5m0.008
Mor28v0.001
R7e+0.034
nN−0.048
piPC060.0658
RDF080u−0.015
RDF090u0.0188
RDF070s0.016
Mor04m0,025
Mor21p−0.081
G2e−0.007
E2s0.025
R5s−0.037
CATS2D_03_LL0.0300

References

  1. Tu, M. General Properties of Herbicides. In Weed Control Methods Handbook; The Nature Conservancy: Arlington, VA, USA, 2003. [Google Scholar]
  2. Peterson, M.A.; McMaster, S.A.; Riechers, D.E.; Skelton, J.; Stahlman, P.W. 2,4-D Past, Present, and Future: A Review. Weed Technol. 2016, 30, 303–345. [Google Scholar] [CrossRef]
  3. Liu, J.F.; Toräng, L.; Mayer, P.; Jönsson, J.Å. Passive extraction and clean-up of phenoxy acid herbicides in samples from a groundwater plume using hollow fiber supported liquid membranes. J. Chromatogr. A 2007, 1160, 56–63. [Google Scholar] [CrossRef] [PubMed]
  4. Jacobsen, C.S.; van der Keur, P.; Iversen, B.V.; Rosenberg, P.; Barlebo, H.C.; Torp, S.; Vosgerau, H.; Juhler, R.K.; Ernstsen, V.; Rasmussen, J.; et al. Variation of MCPA, metribuzine, methyltriazine-amine and glyphosate degradation, sorption, mineralization and leaching in different soil horizons. Environ. Pollut. 2008, 156, 794–802. [Google Scholar] [CrossRef] [PubMed]
  5. Spliid, N.H.; Helweg, A.; Heinrichson, K. Leaching and degradation of 21 pesticides in a full-scale model biobed. Chemosphere 2006, 65, 2223–2232. [Google Scholar] [CrossRef] [PubMed]
  6. Jayakody, N.; Harris, E.C.; Coggon, D. Phenoxy herbicides, soft-tissue sarcoma and non-Hodgkin lymphoma: A systematic review of evidence from cohort and case-control studies. Br. Med. Bull. 2015, 114, 75–94. [Google Scholar] [CrossRef] [PubMed] [Green Version]
  7. Bukowska, B.; Hutnik, K. 2,4-D and MCPA and their derivatives: Effect on the activity of membrane erythrocytes acetylcholinesterase (in vitro). Pestic. Biochem. Physiol. 2006, 85, 174–180. [Google Scholar] [CrossRef]
  8. Murschell, T.; Farmer, D.K. Real-time measurement of herbicides in the atmosphere: A case study of MCPA and 2,4-D during field application. Toxics 2019, 7, 40. [Google Scholar] [CrossRef] [Green Version]
  9. Ji, Z.; Cheng, J.; Song, C.; Hu, N.; Zhou, W.; Suo, Y.; Sun, Z.; You, J. A highly sensitive and selective method for determination of phenoxy carboxylic acids from environmental water samples by dispersive solid-phase extraction coupled with ultra high performance liquid chromatography-tandem mass spectrometry. Talanta 2019, 191, 313–323. [Google Scholar] [CrossRef]
  10. Wu, J.; Kim, H.E.; Hian, K.L. Automated dynamic liquid-liquid-liquid microextraction followed by high-performance liquid chromatography-ultraviolet detection for the determination of phenoxy acid herbicides in environmental waters. J. Chromatogr. A 2005, 1082, 121–127. [Google Scholar] [CrossRef]
  11. McManus, S.L.; Moloney, M.; Richards, K.G.; Coxon, C.E.; Danaher, M. Determination and occurrence of phenoxyacetic acid herbicides and their transformation products in groundwater using ultra high performance liquid chromatography coupled to tandem mass spectrometry. Molecules 2014, 19, 20627–20649. [Google Scholar] [CrossRef] [Green Version]
  12. Mei, X.Y.; Hong, Y.Q.; Chen, G.H. Review on Analysis Methodology of Phenoxy Acid Herbicide Residues. Food Anal. Methods 2016, 9, 1532–1561. [Google Scholar] [CrossRef]
  13. Crespo-Corral, E.; Santos-Delgado, M.J.; Polo-Díez, L.M.; Soria, A.C. Determination of carbamate, phenylurea and phenoxy acid herbicide residues by gas chromatography after potassium tert-butoxide/dimethyl sulphoxide/ethyl iodide derivatization reaction. J. Chromatogr. A 2008, 1209, 22–28. [Google Scholar] [CrossRef] [PubMed]
  14. Hua, K.; Xiao-Gang, C.; Yu-Xia, H.; Chuan-Lai, X. Simultaneous determination of 13 phenoxy acid herbicide residues in soybean by GC-ECD. Anal. Lett. 2006, 39, 2617–2627. [Google Scholar] [CrossRef]
  15. Poole, C.F.; Lenca, N. Applications of the solvation parameter model in reversed-phase liquid chromatography. J. Chromatogr. A 2017, 1486, 2–19. [Google Scholar] [CrossRef] [PubMed]
  16. Vitha, M.; Carr, P.W. The chemical interpretation and practice of linear solvation energy relationships in chromatography. J. Chromatogr. A 2006, 1126, 143–194. [Google Scholar] [CrossRef]
  17. Cela, R.; Ordoñez, E.Y.; Quintana, J.B.; Rodil, R. Chemometric-assisted method development in reversed-phase liquid chromatography. J. Chromatogr. A 2013, 1287, 2–22. [Google Scholar] [CrossRef]
  18. Torres-Lapasió, J.R.; García-Alvarez-Coque, M.C.; Rosés, M.; Bosch, E.; Zissimos, A.M.; Abraham, M.H. Analysis of a solute polarity parameter in reversed-phase liquid chromatography on a linear solvation relationship basis. Anal. Chim. Acta 2004, 515, 209–227. [Google Scholar] [CrossRef]
  19. Héberger, K. Quantitative structure-(chromatographic) retention relationships. J. Chromatogr. A 2007, 1158, 273–305. [Google Scholar] [CrossRef] [Green Version]
  20. Kaliszan, R. QSRR: Quantitative structure-(chromatographic) retention relationships. Chem. Rev. 2007, 107, 3212–3246. [Google Scholar] [CrossRef]
  21. D’Archivio, A.A.; Donato, F.D.; Foschi, M.; Maggi, M.A.; Ruggieri, F. Uhplc analysis of saffron (crocus sativus l.): Optimization of separation using chemometrics and detection of minor crocetin esters. Molecules 2018, 23, 1851. [Google Scholar] [CrossRef] [Green Version]
  22. Sadoughi, N.; Schmidtke, L.M.; Antalick, G.; Blackman, J.W.; Steel, C.C. Gas chromatography-mass spectrometry method optimized using response surface modeling for the quantitation of fungal off-flavors in grapes and wine. J. Agric. Food Chem. 2015, 63, 2877–2885. [Google Scholar] [CrossRef] [PubMed]
  23. Skartland, L.K.; Mjøs, S.A.; Grung, B. Experimental designs for modeling retention patterns and separation efficiency in analysis of fatty acid methyl esters by gas chromatography-mass spectrometry. J. Chromatogr. A 2011, 1218, 6823–6831. [Google Scholar] [CrossRef] [PubMed]
  24. Missaoui, I.; Sayedi, L.; Jamoussi, B.; Hassine, B. Ben Response surface optimization for determination of volatile organic compounds in water samples by headspace-gas chromatography-mass spectrometry method. J. Chromatogr. Sci. 2009, 47, 257–262. [Google Scholar] [CrossRef] [Green Version]
  25. D’Archivio, A.A.; Maggi, M.A.; Marinelli, C.; Ruggieri, F.; Stecca, F. Optimisation of temperature-programmed gas chromatographic separation of organochloride pesticides by response surface methodology. J. Chromatogr. A 2015, 1423, 149–157. [Google Scholar] [CrossRef] [PubMed]
  26. D’Archivio, A.A.; Maggi, M.A.; Mazzeo, P.; Ruggieri, F. Quantitative structure-retention relationships of pesticides in reversed-phase high-performance liquid chromatography based on WHIM and GETAWAY molecular descriptors. Anal. Chim. Acta 2008, 628, 162–172. [Google Scholar] [CrossRef]
  27. D’Archivio, A.A.; Maggi, M.A.; Ruggieri, F. Prediction of the retention of s-triazines in reversed-phase high-performance liquid chromatography under linear gradient-elution conditions. J. Sep. Sci. 2014, 37, 1930–1936. [Google Scholar] [CrossRef]
  28. Fatemi, M.H.; Abraham, M.H.; Poole, C.F. Combination of artificial neural network technique and linear free energy relationship parameters in the prediction of gradient retention times in liquid chromatography. J. Chromatogr. A 2008, 1190, 241–252. [Google Scholar] [CrossRef]
  29. Golubović, J.; Protić, A.; Zečević, M.; Otašević, B.; Mikić, M.; Živanović, L. Quantitative structure-retention relationships of azole antifungal agents in reversed-phase high performance liquid chromatography. Talanta 2012, 100, 329–337. [Google Scholar] [CrossRef]
  30. Tham, S.Y.; Agatonovic-Kustrin, S. Application of the artificial neural network in quantitative structure-gradient elution retention relationship of phenylthiocarbamyl amino acids derivatives. J. Pharm. Biomed. Anal. 2002, 28, 581–590. [Google Scholar] [CrossRef]
  31. D’Archivio, A.A.; Incani, A.; Ruggieri, F. Cross-column prediction of gas-chromatographic retention of polychlorinated biphenyls by artificial neural networks. J. Chromatogr. A 2011, 1218, 8679–8690. [Google Scholar] [CrossRef]
  32. D’Archivio, A.A.; Giannitto, A.; Maggi, M.A.; Ruggieri, F. Cross-column retention prediction in reversed-phase high-performance liquid chromatography by artificial neural network modelling. Anal. Chim. Acta 2012, 717, 52–60. [Google Scholar] [CrossRef] [PubMed]
  33. D’Archivio, A.A.; Maggi, M.A.; Ruggieri, F. Cross-column prediction of gas-chromatographic retention indices of saturated esters. J. Chromatogr. A 2014, 1355, 269–277. [Google Scholar] [CrossRef] [PubMed]
  34. D’Archivio, A.A.; Maggi, M.A.; Ruggieri, F. Multiple-column RP-HPLC retention modelling based on solvatochromic or theoretical solute descriptors. J. Sep. Sci. 2010, 33, 155–166. [Google Scholar] [CrossRef] [PubMed]
  35. Fanali, S.; Haddad, P.R.; Poole, C.F.; Schoenmakers, P.; Lloyd, D. Liquid Chromatography: Fundamentals and Instrumentation; Elsevier: Amsterdam, The Netherlands, 2013; ISBN 9780124158078. [Google Scholar]
  36. Jandera, P.; Churáček, J. Gradient elution in liquid chromatography. II. Retention characteristics (retention volume, band width, resolution, plate number) in solvent-programmed chromatography - theoretical considerations. J. Chromatogr. A 1974, 91, 223–235. [Google Scholar] [CrossRef]
  37. Kaliszan, R.; Wiczling, P.; Markuszewski, M.J. pH Gradient Reversed-Phase HPLC. Anal. Chem. 2004, 76, 749–760. [Google Scholar] [CrossRef] [PubMed]
  38. Aschi, M.; D’Archivio, A.A.; Mazzeo, P.; Pierabella, M.; Ruggieri, F. Modelling of the effect of solute structure and mobile phase pH and composition on the retention of phenoxy acid herbicides in reversed-phase high-performance liquid chromatography. Anal. Chim. Acta 2008, 616, 123–137. [Google Scholar] [CrossRef]
  39. Todeschini, R.; Consonni, V. Molecular Descriptors for Chemoinformatics, 2nd ed.; Wiley-VCH: Weinheim, Germany, 2009; pp. 1–1257. [Google Scholar]
  40. Geladi, P.; Kowalski, B.R. Partial least squares regression: A tutorial. Anal Chim Acta. 1986, 185, 1–17. [Google Scholar] [CrossRef]
  41. Martens, H.; Naes, T. Multivariate calibration; John Wiley & Sons: New York, NY, USA, 1991. [Google Scholar]
  42. Nasab, S.G.; Semnani, A.; Marini, F.; Biancolillo, A. Prediction of viscosity index and pour point in ester lubricants using quantitative structure-property relationship (QSPR). Chemometr Intell Lab Syst. 2018, 183, 59–78. [Google Scholar] [CrossRef]
  43. Wen, Y.; Amos, R.I.J.; Talebi, M.; Szucs, R.; Dolan, J.W.; Pohl, C.A.; Haddad, P.R. Retention prediction using quantitative structure-retention relationships combined with the hydrophobic subtraction model in reversed-phase liquid chromatography. Electrophoresis 2019, 40, 2415–2419. [Google Scholar] [CrossRef]
  44. Leardi, R.; Boggia, R.; Terrile, M. Genetic algorithms as a strategy for feature selection. J. Chemometrics. 1992, 6, 267–281. [Google Scholar] [CrossRef]
  45. Ciura, K.; Kawczak, P.; Nowkowska, J.; Bczek, T. Introduction to Quantitative Structure-Retention Relationships. In Chemometrics for Chromatography; Komsta, L., Hyden, Y., Sherma, J., Eds.; CRC Press: Boca Raton, FL, USA, 2016; pp. 303–318. [Google Scholar]
  46. Kaliszan, R.; Markuszewski, M. In Quantitative Structure-Retention Relationship in Studies of Monolithic Materials. In Monolithic silicas in separation science; Unger, K., Tanaka, U., Machtejevas, E., Eds.; Wiley-VHC: Weinheim, Germany, 2011; pp. 159–171. [Google Scholar]
  47. Poole, C.F. Influence of Solvent Effects on Retention of Small Molecules in Reversed-Phase Liquid Chromatography. Chromatographia 2019, 82, 49–64. [Google Scholar] [CrossRef]
  48. Nekrasova, N.A.; Kurbatova, S.V. Quantitative structure-chromatographic retention correlations of quinoline derivatives. J. Chromatogr. A 2017, 1492, 55–60. [Google Scholar] [CrossRef] [PubMed]
  49. Escuder-Gilabert, L.; Bermúdez-Saldaña, J.M.; Villanueva-Camañas, R.M.; Medina-Hernández, M.J.; Sagrado, S. Reliability of the retention factor estimations in liquid chromatography. J. Chromatography A 2004, 1033, 247–255. [Google Scholar] [CrossRef] [PubMed]
  50. Mohamadi, F.; Richards, N.G.J.; Guida, W.C.; Liskamp, R.; Lipton, M.; Caufield, C.; Chang, G.; Hendrickson, T.; Still, W.C. Macromodel—an integrated software system for modeling organic and bioorganic molecules using molecular mechanics. J. Comput. Chem. 1990, 11, 440–467. [Google Scholar] [CrossRef]
  51. Leardi, R. Genetic algorithm-PLS as a tool for wavelength selection in spectral data sets. In Nature Inspired Methods in Chemometrics: Genetic Algorithms and Artificial Neural Networks; Leardi, R., Ed.; Elsevier: Amsterdam, The Netherlands, 2003; pp. 169–196. [Google Scholar]
Figure 1. PLS model. Legend: Calibration set: blue dots; Test set: orange diamonds.
Molecules 25 01262 g001
Figure 2. PLS model built on the reduced set of 29 predictors selected by GA: scores plot of the training samples. The points are colored according to their values of log k.
Molecules 25 01262 g002
Figure 3. Variables loadings projected on the first two latent variables of the PLS model.
Molecules 25 01262 g003
Table 1. Chromatographic conditions utilized to collect the retention data.
ColumnKinetex C18 (Phenomenex)
Eluentwater-acetonitrile, flux:1 mLmin−1
Elution modeStarting acetonitrile volume fraction (φi): 30, 40, 50, 60, 70%
Eluent pH: 2,3,4
Application time of linear composition gradient (from φi to 100%): none, 15, 20, 25 min
Table 2. List of the 29 predictors selected by the GA in order of decreasing frequency.
VariableDescriptionBlock
φistarting acetonitrile volume fraction in the eluent-
ϕgradient slope-
pHeluent pH-
MATS2iMoran autocorrelation of lag 2 weighted by ionization potential2D autocorrelations
nCb-number of substituted benzene C(sp2)Functional group counts
Mor21usignal 21/unweighted3D-MoRSE descriptors
MATS4pMoran autocorrelation of lag 4 weighted by polarizability2D autocorrelations
Eta_beta_Aeta average VEM countETA indices
TDB05s3D Topological distance-based descriptors - lag 5 weighted by I-state3D autocorrelations
RDF070uRadial Distribution Function - 070/unweightedRDF descriptors
RDF025sRadial Distribution Function - 025/weighted by I-stateRDF descriptors
Mor06ssignal 06/weighted by I-state3D-MoRSE descriptors
G2i2nd component symmetry directional WHIM index/weighted by ionization potentialWHIM descriptors
MWmolecular weightConstitutional indices
nCsp2number of sp2 hybridized Carbon atomsConstitutional indices
MATS5mMoran autocorrelation of lag 5 weighted by mass2D autocorrelations
Mor28vsignal 28/weighted by van der Waals volume3D-MoRSE descriptors
R7e+R maximal autocorrelation of lag 7/weighted by Sanderson electronegativityGETAWAY descriptors
nNnumber of Nitrogen atomsConstitutional indices
piPC06molecular multiple path count of order 6Walk and path counts
RDF080uRadial Distribution Function - 080/unweighted RDF descriptors
RDF090uRadial Distribution Function - 090/unweightedRDF descriptors
RDF070sRadial Distribution Function - 070/weighted by I-stateRDF descriptors
Mor04msignal 04/weighted by mass3D-MoRSE descriptors
Mor21psignal 21/weighted by polarizability3D-MoRSE descriptors
G2e2nd component symmetry directional WHIM index/weighted by Sanderson electronegativityWHIM descriptors
E2s2nd component accessibility directional WHIM index/weighted by I-stateWHIM descriptors
R5sR autocorrelation of lag 5/weighted by I-stateGETAWAY descriptors
CATS2D_03_LLLipophilic-Lipophilic at lag 03CATS2D

